Multimodality Assessment of Brain Tumors and...
16
CONTINUING EDUCATION Multimodality Assessment of Brain Tumors and Tumor Recurrence Wolf-Dieter Heiss 1 , Peter Raab *2 , and Heinrich Lanfermann *2 1 Max Planck Insitute for Neurological Research, Cologne, Germany; and 2 Institute for Diagnostic and Interventional Neuroradiology, Hannover Medical School, Hannover, Germany Learning Objectives: On successful completion of this activity, participants should be able to describe (1) the differences in the information obtained by various MRI and PET modalities and (2) the best combination of imaging procedures to detect brain tumors, to define the biologic activity or malignancy of a tumor, to validate therapeutic effects, and to differentiate between recurrent tumor and tissue necrosis. Financial Disclosure: The authors of this article have indicated no relevant relationships that could be perceived as a real or apparent conflict of interest. CME Credit: SNM is accredited by the Accreditation Council for Continuing Medical Education (ACCME) to sponsor continuing education for physicians. SNM designates each JNM continuing education article for a maximum of 1.0 AMA PRA Category 1 Credit. Physicians should claim only credit commensurate with the extent of their participation in the activity. For CE credit, participants can access this activity through the SNM Web site (http://www.snm.org/ce_online) through October 2012. Neuroimaging plays a significant role in the diagnosis of intra- cranial tumors, especially brain gliomas, and must consist of an assessment of location and extent of the tumor and of its biologic activity. Therefore, morphologic imaging modalities and functional, metabolic, or molecular imaging modalities should be combined for primary diagnosis and for following the course and evaluating therapeutic effects. MRI is the gold standard for providing detailed morphologic information and can supply some additional insights into metabolism (MR spectroscopy) and perfusion (perfusion-weighted imaging) but still has limitations in identifying tumor grade, invasive growth into neighboring tissue, and treatment-induced changes, as well as recurrences. These insights can be obtained by various PET modalities, including imaging of glucose metabolism, amino acid uptake, nucleoside uptake, and hypoxia. Diagnostic accuracy can benefit from coregistration of PET results and MRI, combining the high-resolution morphologic images with the biologic information. These procedures are optimized by the newly developed combination of PET and MRI modalities, permitting the simultaneous assessment of morphologic, func- tional, metabolic, and molecular information on the human brain. Key Words: neurology; oncology; brain tumors; gliomas; PET; MRI J Nucl Med 2011; 52:1585–1600 DOI: 10.2967/jnumed.110.084210 Brain tumors are newly formed alterations of morphol- ogy, and for their diagnosis, therefore, CT or MRI is manda- tory. These imaging modalities are essential for delineating the normal and pathologic anatomy and also for assessing vascular supply and impairment of the blood–brain barrier (BBB) (perfusion-weighted imaging; contrast enhancement). Additionally, MRI is capable of giving functional information on microstructural (diffusion-weighted imaging [DWI]), physiologic, and metabolic (MR spectroscopy [MRS]) changes of tumor tissues. PET and MRI provide physiologic, biochemical, and molecular information related to tumor me- tabolism, proliferation rate, invasiveness, and interaction with surrounding and remote areas—information that might be useful for clinical management. Especially, decisions on type and aggressiveness of treatment require detailed information on tumor type, location, and extent but also on biologic ac- tivity of the tumor and functional state of the surrounding brain. This comprehensive assessment of anatomic, func- tional, and molecular information is usually based on the spatial correlation of imaging data acquired sequentially with separate scanners, but the accuracy of this coregistration is limited by difficulties in patient repositioning and changes occurring between the different measurements. Sophisticated image fusion algorithms have been developed and are applied in many centers, but visual comparison of images positioned side by side is still the most commonly used approach in clinical practice. Temporal and spatial coregistration of mor- phologic and functional data in a single examination without repositioning the patient can be achieved by hybrid systems, as introduced with the PET/CT scanner (1). PET/CT is cur- rently the most efficient imaging tool in general oncology, although PET and CT are still performed sequentially. Be- cause the differentiation of soft-tissue contrast in the brain Received Jan. 27, 2011; revision accepted Jul. 5, 2011. For correspondence or reprints contact: Wolf-Dieter Heiss, Max Planck Institute for Neurological Research, Gleueler Strasse 50, 50931 Cologne, Germany. E-mail: [email protected] Published online Aug. 12, 2011. *Contributed equally to this work. COPYRIGHT ª 2011 by the Society of Nuclear Medicine, Inc. TUMOR RECURRENCE ASSESSMENT • Heiss et al. 1585
Transcript of Multimodality Assessment of Brain Tumors and...

C O N T I N U I N G E D U C A T I O N
Multimodality Assessment of Brain Tumors and TumorRecurrence
Wolf-Dieter Heiss1, Peter Raab*2, and Heinrich Lanfermann*2
1Max Planck Insitute for Neurological Research, Cologne, Germany; and 2Institute for Diagnostic and InterventionalNeuroradiology, Hannover Medical School, Hannover, Germany
Learning Objectives: On successful completion of this activity, participants should be able to describe (1) the differences in the information obtained byvarious MRI and PET modalities and (2) the best combination of imaging procedures to detect brain tumors, to define the biologic activity or malignancy of atumor, to validate therapeutic effects, and to differentiate between recurrent tumor and tissue necrosis.
Financial Disclosure: The authors of this article have indicated no relevant relationships that could be perceived as a real or apparent conflict of interest.
CME Credit: SNM is accredited by the Accreditation Council for Continuing Medical Education (ACCME) to sponsor continuing education for physicians.SNM designates each JNM continuing education article for a maximum of 1.0 AMA PRA Category 1 Credit. Physicians should claim only creditcommensurate with the extent of their participation in the activity.
For CE credit, participants can access this activity through the SNM Web site (http://www.snm.org/ce_online) through October 2012.
Neuroimaging plays a significant role in the diagnosis of intra-cranial tumors, especially brain gliomas, and must consist of anassessment of location and extent of the tumor and of itsbiologic activity. Therefore, morphologic imaging modalitiesand functional, metabolic, or molecular imaging modalitiesshould be combined for primary diagnosis and for followingthe course and evaluating therapeutic effects. MRI is the goldstandard for providing detailed morphologic information andcan supply some additional insights into metabolism (MRspectroscopy) and perfusion (perfusion-weighted imaging) butstill has limitations in identifying tumor grade, invasive growthinto neighboring tissue, and treatment-induced changes, aswell as recurrences. These insights can be obtained by variousPET modalities, including imaging of glucose metabolism,amino acid uptake, nucleoside uptake, and hypoxia. Diagnosticaccuracy can benefit from coregistration of PET results andMRI, combining the high-resolution morphologic images withthe biologic information. These procedures are optimized by thenewly developed combination of PET and MRI modalities,permitting the simultaneous assessment of morphologic, func-tional, metabolic, and molecular information on the humanbrain.
Key Words: neurology; oncology; brain tumors; gliomas; PET;MRI
J Nucl Med 2011; 52:1585–1600DOI: 10.2967/jnumed.110.084210
Brain tumors are newly formed alterations of morphol-ogy, and for their diagnosis, therefore, CT or MRI is manda-tory. These imaging modalities are essential for delineatingthe normal and pathologic anatomy and also for assessingvascular supply and impairment of the blood–brain barrier(BBB) (perfusion-weighted imaging; contrast enhancement).Additionally, MRI is capable of giving functional informationon microstructural (diffusion-weighted imaging [DWI]),physiologic, and metabolic (MR spectroscopy [MRS])changes of tumor tissues. PET and MRI provide physiologic,biochemical, and molecular information related to tumor me-tabolism, proliferation rate, invasiveness, and interaction withsurrounding and remote areas—information that might beuseful for clinical management. Especially, decisions on typeand aggressiveness of treatment require detailed informationon tumor type, location, and extent but also on biologic ac-tivity of the tumor and functional state of the surroundingbrain. This comprehensive assessment of anatomic, func-tional, and molecular information is usually based on thespatial correlation of imaging data acquired sequentially withseparate scanners, but the accuracy of this coregistration islimited by difficulties in patient repositioning and changesoccurring between the different measurements. Sophisticatedimage fusion algorithms have been developed and are appliedin many centers, but visual comparison of images positionedside by side is still the most commonly used approach inclinical practice. Temporal and spatial coregistration of mor-phologic and functional data in a single examination withoutrepositioning the patient can be achieved by hybrid systems,as introduced with the PET/CT scanner (1). PET/CT is cur-rently the most efficient imaging tool in general oncology,although PET and CT are still performed sequentially. Be-cause the differentiation of soft-tissue contrast in the brain
Received Jan. 27, 2011; revision accepted Jul. 5, 2011.For correspondence or reprints contact: Wolf-Dieter Heiss, Max Planck
Institute for Neurological Research, Gleueler Strasse 50, 50931 Cologne,Germany.E-mail: [email protected] online Aug. 12, 2011.*Contributed equally to this work.COPYRIGHT ª 2011 by the Society of Nuclear Medicine, Inc.
TUMOR RECURRENCE ASSESSMENT • Heiss et al. 1585
with CT is limited, a hybrid PET/MRI system will be bettersuited for applications in neurooncology. With such an inte-grated PET/MRI system, it is feasible to assess morphologic,functional, and molecular information on the human brain ina single session, in which several MRI procedures can beperformed during a single PET study, for example, for 18F-FDG (2). This review describes the value of the differentimaging modalities in the various steps of the managementof patients with brain tumors. Therefore, it is structured ac-cording to the questions arising in the clinical work-up.
DIAGNOSIS AND GRADING
For the diagnosis and classification of tumors of thenervous system, internationally accepted guidelines havebeen formulated (3), and for many of these tumors, gradingis based primarily on histologic criteria, such as cell den-sity, nuclear and cellular atypia, number of mitoses, andvascular endothelial proliferation. The system of the WorldHealth Organization (WHO) classifies the most frequentbrain tumors, the gliomas, into 4 grades (Table 1), withgrades I and II being benign; grade III being anaplastic;and grade IV, glioblastoma multiforme, being the mostmalignant tumor with the worst prognosis (4). Histologicgrading is based on tissue biopsies, which may not be rep-resentative since gliomas are frequently heterogeneous (5).Thus, imaging indicators of tumor grade and prognosis maybe of additional value.
Morphologic Imaging
CT is often the first-line technique after the acute onset ofnew cerebral symptoms with a question of intracranialhemorrhage, ischemic stroke, or a space-occupying lesion.Tissue asymmetries or a change in tissue density, eitherdecreased or increased, are diagnostic hints for space-occupying lesions. A slightly increased tissue densityindicates an increase in tissue cellularity, whereas a strongincrease of tumor density indicates tissue calcification,which can indicate a histologic primary brain tumorsubtype such as an oligodendroglioma. A decreased tissuedensity indicates low tumor cellularity or edema. Contrast-enhanced CT can delineate a disrupted BBB, but itssensitivity is much lower than that of MRI. CT also hasdifficulties in the delineation of tumor borders or infiltrationzones, and pathologies in the neighborhood of the skullbase and the posterior fossa are better delineated by MRIbecause of the absence of artifacts caused by beam hard-
ening in CT, in particular due to the petrous bone. CT has aclear advantage over MRI in its ability to show changes ofbony structures that might be caused by tumors andadditionally can detect calcifications in tumors, which aretypically seen in oligodendrogliomas.
MRI is the major technique for the detection of thepresence of brain tumors in patients, not only for theanatomic information that can be obtained through its highsoft-tissue contrast and resolution but increasingly also forfunctional information.
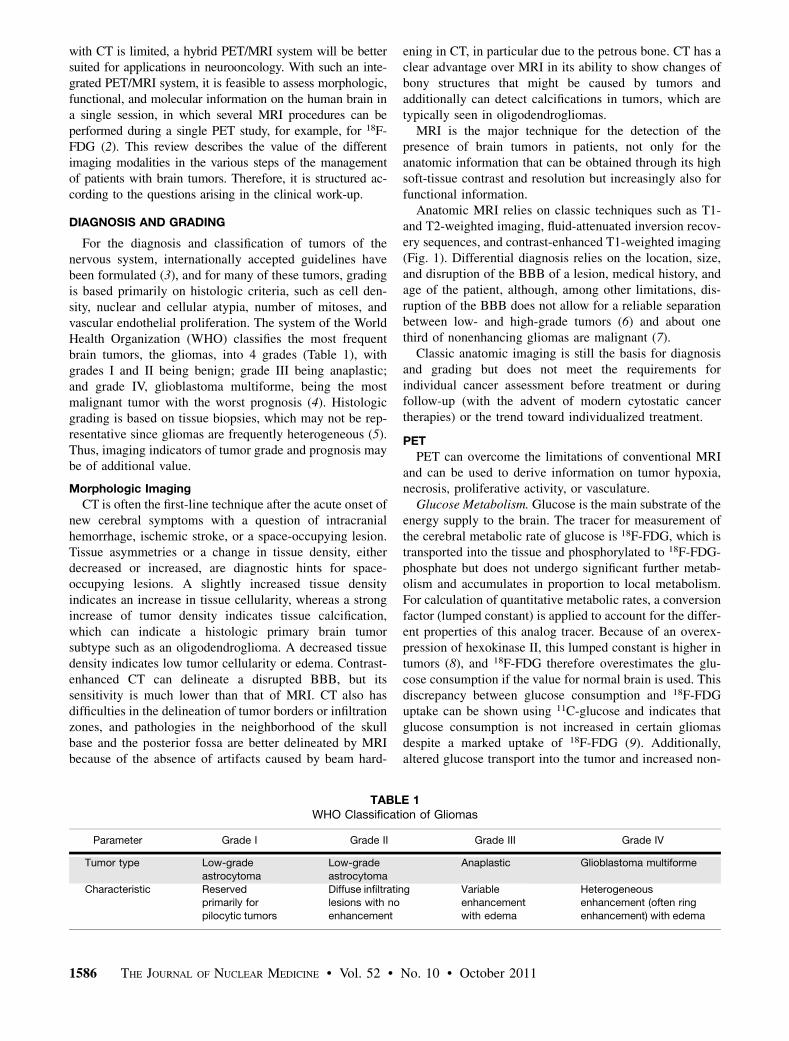
Anatomic MRI relies on classic techniques such as T1-and T2-weighted imaging, fluid-attenuated inversion recov-ery sequences, and contrast-enhanced T1-weighted imaging(Fig. 1). Differential diagnosis relies on the location, size,and disruption of the BBB of a lesion, medical history, andage of the patient, although, among other limitations, dis-ruption of the BBB does not allow for a reliable separationbetween low- and high-grade tumors (6) and about onethird of nonenhancing gliomas are malignant (7).
Classic anatomic imaging is still the basis for diagnosisand grading but does not meet the requirements forindividual cancer assessment before treatment or duringfollow-up (with the advent of modern cytostatic cancertherapies) or the trend toward individualized treatment.
PET
PET can overcome the limitations of conventional MRIand can be used to derive information on tumor hypoxia,necrosis, proliferative activity, or vasculature.
Glucose Metabolism. Glucose is the main substrate of theenergy supply to the brain. The tracer for measurement ofthe cerebral metabolic rate of glucose is 18F-FDG, which istransported into the tissue and phosphorylated to 18F-FDG-phosphate but does not undergo significant further metab-olism and accumulates in proportion to local metabolism.For calculation of quantitative metabolic rates, a conversionfactor (lumped constant) is applied to account for the differ-ent properties of this analog tracer. Because of an overex-pression of hexokinase II, this lumped constant is higher intumors (8), and 18F-FDG therefore overestimates the glu-cose consumption if the value for normal brain is used. Thisdiscrepancy between glucose consumption and 18F-FDGuptake can be shown using 11C-glucose and indicates thatglucose consumption is not increased in certain gliomasdespite a marked uptake of 18F-FDG (9). Additionally,altered glucose transport into the tumor and increased non-
TABLE 1WHO Classification of Gliomas
Parameter Grade I Grade II Grade III Grade IV
Tumor type Low-grade
astrocytoma
Low-grade
astrocytoma
Anaplastic Glioblastoma multiforme
Characteristic Reservedprimarily for
pilocytic tumors
Diffuse infiltratinglesions with no
enhancement
Variableenhancement
with edema
Heterogeneousenhancement (often ring
enhancement) with edema
1586 THE JOURNAL OF NUCLEAR MEDICINE • Vol. 52 • No. 10 • October 2011
oxidative glycolysis affect the calculation of cerebral meta-bolic rate of glucose; therefore, uptake of glucose relativeto cerebral cortex or deep white matter is usually used forthe identification of tumor tissue.Imaging of brain tumors with 18F-FDG was the first
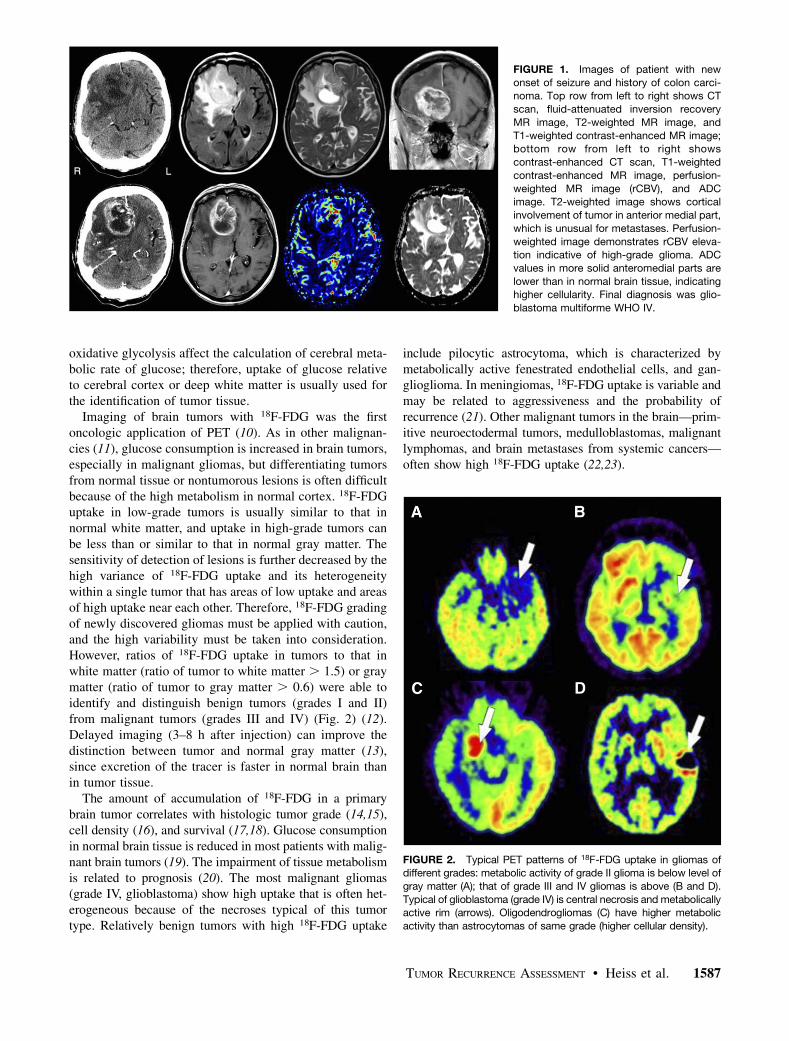
oncologic application of PET (10). As in other malignan-cies (11), glucose consumption is increased in brain tumors,especially in malignant gliomas, but differentiating tumorsfrom normal tissue or nontumorous lesions is often difficultbecause of the high metabolism in normal cortex. 18F-FDGuptake in low-grade tumors is usually similar to that innormal white matter, and uptake in high-grade tumors canbe less than or similar to that in normal gray matter. Thesensitivity of detection of lesions is further decreased by thehigh variance of 18F-FDG uptake and its heterogeneitywithin a single tumor that has areas of low uptake and areasof high uptake near each other. Therefore, 18F-FDG gradingof newly discovered gliomas must be applied with caution,and the high variability must be taken into consideration.However, ratios of 18F-FDG uptake in tumors to that inwhite matter (ratio of tumor to white matter . 1.5) or graymatter (ratio of tumor to gray matter . 0.6) were able toidentify and distinguish benign tumors (grades I and II)from malignant tumors (grades III and IV) (Fig. 2) (12).Delayed imaging (3–8 h after injection) can improve thedistinction between tumor and normal gray matter (13),since excretion of the tracer is faster in normal brain thanin tumor tissue.The amount of accumulation of 18F-FDG in a primary
brain tumor correlates with histologic tumor grade (14,15),cell density (16), and survival (17,18). Glucose consumptionin normal brain tissue is reduced in most patients with malig-nant brain tumors (19). The impairment of tissue metabolismis related to prognosis (20). The most malignant gliomas(grade IV, glioblastoma) show high uptake that is often het-erogeneous because of the necroses typical of this tumortype. Relatively benign tumors with high 18F-FDG uptake
include pilocytic astrocytoma, which is characterized bymetabolically active fenestrated endothelial cells, and gan-glioglioma. In meningiomas, 18F-FDG uptake is variable andmay be related to aggressiveness and the probability ofrecurrence (21). Other malignant tumors in the brain—prim-itive neuroectodermal tumors, medulloblastomas, malignantlymphomas, and brain metastases from systemic cancers—often show high 18F-FDG uptake (22,23).
FIGURE 1. Images of patient with new
onset of seizure and history of colon carci-noma. Top row from left to right shows CT
scan, fluid-attenuated inversion recovery
MR image, T2-weighted MR image, and
T1-weighted contrast-enhanced MR image;bottom row from left to right shows
contrast-enhanced CT scan, T1-weighted
contrast-enhanced MR image, perfusion-
weighted MR image (rCBV), and ADCimage. T2-weighted image shows cortical
involvement of tumor in anterior medial part,
which is unusual for metastases. Perfusion-
weighted image demonstrates rCBV eleva-tion indicative of high-grade glioma. ADC
values in more solid anteromedial parts are
lower than in normal brain tissue, indicatinghigher cellularity. Final diagnosis was glio-
blastoma multiforme WHO IV.
FIGURE 2. Typical PET patterns of 18F-FDG uptake in gliomas ofdifferent grades: metabolic activity of grade II glioma is below level of
gray matter (A); that of grade III and IV gliomas is above (B and D).
Typical of glioblastoma (grade IV) is central necrosis and metabolicallyactive rim (arrows). Oligodendrogliomas (C) have higher metabolic
activity than astrocytomas of same grade (higher cellular density).
TUMOR RECURRENCE ASSESSMENT • Heiss et al. 1587

For the interpretation of 18F-FDG brain scans, the sim-ilarity of 18F-FDG uptake of tumor and cortex is a limitingfactor, which is especially critical for small lesions.Because of the limited spatial resolution of PET and par-tial-volume averaging, 18F-FDG uptake can be underesti-mated in small lesions. 18F-FDG uptake in brain tumors isassessed best if coregistration with MRI permits reliablelocalization of PET data.Amino Acid Uptake. Labeled amino acids and their
analogs—L-[methyl-11C]-methionine (11C-MET), 11C-tyro-sine, 18F-fluorotyrosine, 18F-deoxyphenylalanine (F-DOPA)and O-218F-fluoroethyltyrosine—are particularly attractivefor imaging brain tumors because of the high uptake intumor tissue and low uptake in normal brain and, as aconsequence, higher tumor–to–normal-tissue contrast. Thisincreased amino acid uptake, especially in gliomas, is not adirect measure of protein synthesis or dependent on BBBbreakdown but rather is related to increased transport medi-ated by type L amino acid carriers: facilitated transport isupregulated because tumors increase transporter expressionin their vasculature (24). Additionally, the countertransportsystem A is overexpressed in neoplastic cells and seems tobe positively correlated with the rate of tumor cell growth(25). Therefore, elevated transport of amino acids not onlyis a result of increased protein synthesis but also reflects theincreased demand for the different metabolic activities inthe tumor cell. Tumors also influence growth of their vas-culature and therefore can regulate their increased demandfor nutrients, including amino acids.The most frequently used radiolabeled amino acid, 11C-
MET, can be applied only in centers with an on-site cyclo-tron. For the discrimination of brain tumors from nontumorallesions, a sensitivity of 76% and a specificity of 87% (26)have been described. In gliomas, 11C-MET uptake is greaterin high-grade than in low-grade tumors (Fig. 3) (27–29) andis increased in most low-grade gliomas in the absence ofBBB damage—a substantial advantage over CT, conventionalMRI, and 18F-FDG PET (30,31). Therefore, 11C-MET canprovide additional information when used in combination with18F-FDG PET for diagnosis of these tumors. Angiogenesisand amino acid uptake are related (32). In many instances,the extent of increased 11C-MET uptake is larger than that ofcontrast enhancement (33) and indicates tumor infiltration andtumor margins. Especially in low-grade gliomas, amino aciduptake is related to prognosis and survival (34,35). 11C-METPET therefore has special value in low-grade gliomas: fordifferentiation from nontumorous lesions, for detection ofrecurrences, for indicating changes in grade of progressingdisease, and for potentially allowing a better prediction ofprognosis. 11C-MET PETwas useful for differentiating tumor-ous from nontumorous lesions in children and young adultswhen the decision about further therapy was difficult orimpossible to make from routine structural imaging alone(36). High 18F-fluoroethyl-L-tyrosine (FET) uptake indicativeof tumor cell infiltration was associated with markers of neu-ronal cell loss in 1H MRS (37).
11C-MET uptake differs with tumor type: in oligodendro-gliomas, uptake tends to be higher than in astrocytomas ofthe same histologic grade, although oligodendrogliomas areless aggressive (38). In oligodendrogliomas, 11C-cholinePET may be useful in evaluating the potential malignancy,but 11C-MET PET is superior in detecting hot lesions (39).11C-MET uptake is increased in other malignant intracra-nial tumors but also in benign neoplasias such as meningi-omas (22).
Because of the short half-life of 11C (20 min) 18F-labeledaromatic amino acid analogs have been developed for tumorimaging. Tumor uptake of 18F-FET and dihydroxy-18F-fluoro-L-phenylalanine (F-DOPA) is similar to that of 11C-MET (40,41). In a large study, F-DOPA demonstrated excel-lent visualization of high- and low-grade tumors and wasmore sensitive and specific than 18F-FDG, but no significantrelation to tumor grade or to contrast enhancement wasobserved (42). Especially in newly diagnosed tumors,uptake was related to proliferation, whereas this correlationwas not observed in recurrent gliomas (43).
Nucleoside Uptake. Labeled nucleosides are indicators ofcellular proliferation and should provide information onhistologic grade. The thymidine analog 3-deoxy-3-18F-fluorothymidine (18F-FLT) was developed as a noninvasivetracer of tumor cell proliferation (44). Uptake of 18F-FLTcorrelates with thymidine kinase-1 activity, an enzymeexpressed during the DNA synthesis phase of the cell cycle(45), which is high in proliferating cells and low in quiescentcells. With this tracer, an excellent delineation of grade III andIV tumors with a high tumor-to-normal ratio was obtained
FIGURE 3. PET images showing uptake of 11C-MET and of 18F-
FLT in gliomas of low grade (top row) and high grade (bottom row).
Uptake of 18F-FLT is especially high in malignant glioma and alsodemonstrates infiltration into surrounding tissue.
1588 THE JOURNAL OF NUCLEAR MEDICINE • Vol. 52 • No. 10 • October 2011

(46), whereas grade II gliomas and stable lesions did not showconsiderable tracer uptake (Fig. 3); additionally, a high corre-lation of 18F-FLT uptake was seen with Ki-67 expression as asurrogate marker for tumor proliferation (47). Although abso-lute tumor uptake of 18F-FLTwas lower than that of 11C-MET,tumor–to–normal-brain uptake ratios were higher than for11C-MET because of the low 18F-FLT concentration in normalbrain. Gadolinium-enhanced MRI yields complementaryinformation on tumor extent, because 18F-FLT uptake alsooccurs in regions with a disrupted BBB and sensitivity fordetection of low-grade gliomas is lower than with 11C-MET(48). A kinetic analysis of 18F-FLT uptake permits the assess-ment of tumor proliferation rates in high-grade gliomas,whereas uptake ratios of 11C-MET and 18F-FLT failed to cor-relate with the in vitro–determined proliferation index byKi-67 immunostaining (46). In another study (49), 18F-FLTPET was superior to 11C-MET PET in tumor grading andassessment of proliferation in different gliomas, and the com-bination with 11C-MET PET added significant information.Marker of Hypoxia. Hypoxia in tumors is a consequence
of disturbed angiogenesis not balanced to the needs of thequickly proliferating tissue. As a consequence, oxygensupply is inadequate. 18F-fluoromisonidazole (18F-FMISO)is a marker of hypoxia and has potential for detecting aspecific pathophysiology of brain tumors (50). 18F-FMISO-PET demonstrated a correlation with perfusion at0–5 min after injection, whereas late persistent uptake ofthis tracer was independent of perfusion and BBB disrup-tions (51). Hypoxia is a driving force for angiogenesis, asalso expressed in a correlation between 18F-FMISO uptakeand Ki-67 and vascular endothelial growth factor (VEGF)receptor 1 expression (52), and considerable 18F-FMISOuptake was therefore found in high-grade but not in low-grade gliomas. The volume of hypoxia in a glioma as deter-mined by 18F-FMISO uptake before initiation of treatmentwas related to aggressiveness as assessed by serial MRI(53) and to progression and survival after radiotherapy (54).Somatostatin Receptor Ligands. Meningiomas express
somastatin receptors of subtype 2, which can be detected by68Ga-DOTA-phenyl-tyrosin-osteotide. In contrast to 18F-FDG, 68Ga-DOTATOC shows a high meningioma-to-back-ground ratio (55) and was helpful in visualizing the locationand extent of meningiomas near bony structures, especiallyat the base of the skull. This tracer was especially success-ful in improving volume delineation for planning intensity-modulated radiation therapy in combination with CT(56,57) and recently with simultaneous MRI (58)
Physiologic MRI
Modern MRI techniques are being increasingly used toimprove the sensitivity and specificity of tumor diagnostics;these techniques offer possibilities for the detection offunctional information. MRS can assess tumor metabolismand physiology, DWI can assess tissue microstructure bycharacterizing water mobility, and perfusion-weighted imag-ing can assess vascular integrity and function.
MRS. MRI is primarily based on the imaging of hydro-gen atoms contained in water and fat. MRS is based on thedetection of molecule-specific energy spectra, which aredependent on the chemical molecular structure and can beinterpreted as a fingerprint of the specific molecule. Such aspectrum is represented by a curve, with the area under thecurve of a certain peak representing the concentration of themetabolite within the sampled tissue, and the position ofthe peak, which is shifted away from the position of a standardsubstance, representing the metabolite. The amount of theshift is counted in parts per million and referred to a standardsubstance at 0 ppm by definition.
Single-voxel spectroscopy gives information just from acertain tissue area, whereas 2- and 3-dimensional chemicalshift imaging collect data from one or more tissue slices withseveral voxels in each slice. Multivoxel chemical shift imag-ing can therefore better delineate tissue inhomogeneities thansingle-voxel spectroscopy.
Absolute quantification of metabolites is difficult; therefore,relative quantification methods are usually used for clinicalpurposes. Metabolite data can be referred to other metaboliteswithin the same voxel, but since all the metabolites can bechanged by a tumor, it is advisable to relate tumor data tocontralateral healthy tissue.
Several metabolites can be measured by MRS; becauseof the relaxation time, the amount of assessable metabolitesis dependent on the echo time of the sequence used.
The main metabolites for tumor diagnostics are shown inTable 2.
The separation of low-grade and high-grade gliomas is ofhigh prognostic importance. Choline and lipids have shownthe best predictive value; by the use of MRS, tumors couldbe correctly diagnosed 85%–95% of the time (59,60). Ingeneral, brain tumors tend to differ from nonneoplastictissue by an elevation of choline and possibly lactate andlipids, combined with a reduction of tumor creatine ortumor N-acetylaspartate (NAA). Actively proliferatingtumors require an increased membrane turnover leadingto a choline increase. Because of destruction of neuronsby the tumor, NAA is decreased (Fig. 4); lactate indicatesanaerobic glycolysis by the tumor tissue, and lipids indicatenecrosis.
For tumor grading, lactate and lipids indicate highertumor grades (61), as does increased choline (Fig. 5)] (62).Choline as part of cell membrane phospholipids correlateswell with the Ki-67 proliferation marker in gliomas (62,63).A cutoff of 1.6 for normalized choline values was found tobe predictive of high-grade astrocytomas. Elevated cholineis unfortunately not completely specific for high-gradetumors, since pilocytic astrocytomas (64) and low-gradeoligodendrogliomas can have increased choline levels aswell. For oligodendrogliomas, a cutoff of 2 was indicatedby Xu et al. for the separation between low- and high-gradeoligodendrogliomas (65). Elevated normalized creatine val-ues indicate a shorter time to progression in WHO grade IIand III astrocytomas (66,67).
TUMOR RECURRENCE ASSESSMENT • Heiss et al. 1589

Because tumor tissue is known to be heterogeneous,MRS can also be used to guide stereotactic brain biopsies toassess the region with the highest membrane turnover(68,69), but this is still the domain of PET with 18F-FDGor amino acids.MRS can also be used to assess infiltrating brain tumors,
since choline elevation can extend to areas without contrastenhancement or to tissue that appears normal on conven-tional MRI. An increase of myoinositol indicates zones ofactive glial activation due to a reaction toward infiltratingtumor cells (70), as does the choline/NAA index (71).MRS can aid in the differential diagnosis of brain
tumors. About two thirds of meningiomas show an alanineresonance at 1.5 ppm, which is specific for meningiomas.Metastases tend to have low NAA resonances whileshowing a high lipid peak, and choline can be elevated.Metabolite concentrations in the peritumoral region canhelp in differentiating glioblastomas from metastases andlymphomas (72).MRS can also image other nuclei besides protons. One of
these so-called X-nuclei is 13C, enabling the use of 13C-labeled agents such as 13C-pyruvate for imaging. Hyper-
polarized 13C-pyruvate was used during radiotherapy inan animal model of glioma tumor and showed a reductionof 13C-lactate production within 72 h of radiotherapy (73).In a lymphoma model, this technique of evaluating thepyruvate–lactate flux showed results comparable to thoseof 18F-FDG PET during chemotherapy (74). This techniqueoffers new possibilities for assessing physiologic and patho-physiologic changes in tumors noninvasively, but the tech-nique is experimental and not available for clinical use yet.In addition, hyperpolarization is technically difficult toachieve, and the short half-life of the hyperpolarized statealso limits the applicability of the technique.
DWI. DWI is a probing of the microscopic motion ofwater molecules within tissue; this motion is driven bytemperature, following the Brownian law, and is influencedby tissue structure (75). Infiltration of healthy brain bytumorous tissue causes alterations of water diffusion assess-able by DWI (Fig. 1). An increase in cellular density, reduc-tion of extracellular space, and increase in viscosity, forexample, generate a decrease of Brownian motion of watermolecules and a decrease of the calculated and (commonlyaccepted as a measure of water diffusion) apparent diffu-
FIGURE 4. Patient with new seizure onset
and small left frontal signal elevation on T2-weighted MRI. 1H-MR spectroscopy (echo
time, 30 ms; repetition time, 1,500 ms; 2-
dimensional chemical shift imaging) shows
normal spectrum on right side (A) and slightcholine elevation with NAA reduction of
lesion on left side (B). Low-grade glioma
was found on stereotactic biopsy. Red line
represents curve fit of analysis software;area under curve, which corresponds to
metabolite concentrations, is given by num-
bers at peaks. Ins 5 inositol; Cho 5 choline;Cr 5 creatine; NAA 5 N-acetylaspartate.
TABLE 2Main Metabolites Detected by MRS, Their Chemical Shift Position, and Interpretation
Metabolite Peak position (ppm) Echo time used Interpretation Found in normal tissue?
Choline 3.2 Short and long Membrane turnover YesCreatine/phosphocreatine 3.02, 3.8 Short and long Energy metabolism Yes
NAA 2.01, 2.6 Short and long Neural tissue integrity Yes
Lipids 0–2 Short and long Tissue necrosis Only as contamination
Lactate 1.33 Short and long Anaerobic glycolysis NoTaurine 3.36 Short Pediatric tumors Below sensitivity
Myoinositol 3.56, 4.06 Short Glial activation Yes
Clinically used echo times are 20–30 ms (short), 135–144 ms (long), or 270 ms.
1590 THE JOURNAL OF NUCLEAR MEDICINE • Vol. 52 • No. 10 • October 2011

sion coefficient (ADC, mm2/s). ADC values are quantifi-able and quickly measurable with a suitable resolution. Lowvalues in ADC maps of solid gliomas are correlated with ahigher grade (76). But, as a limitation, coexistent edemamay superimpose measurements of ADC values, resultingin a decreased accuracy in separation of low- and high-grade gliomas. In children, medulloblastomas and atypicalrhabdoid-teratoid tumors of the posterior fossa show signif-icantly lower ADC values than do ependymomas and pilo-cytic astrocytomas (77,78). Central neurocytomas alsoshow low ADC values (79).Of special interest are more sophisticated higher-order
diffusion techniques such as diffusion kurtosis imaging,enabling a more profound characterization of microstruc-tural changes (80). First results are promising regardinggrading and differential diagnosis of brain tumors (81).Perfusion-Weighted Imaging. In comparison to healthy
brain tissue, high-grade gliomas develop an increasedmacro- and microvasculature. The relative cerebral bloodvolume (rCBV) is increased, predominantly as a result, andcorrelates with aggressive tumor growth (Fig. 1).At present, the preferred technique to measure brain
perfusion is tracking of a well-defined bolus of contrast
medium with a dynamic MRI sequence sensitive to T2*effects. The area under the signal curve] is an estimate ofrCBV. Extravasations of contrast medium caused by dis-ruption of the BBB affect the calculation of rCBV inhigh-grade gliomas and have to be adjusted for by sophis-ticated mathematic models (82). The application of a pre-loading dose of contrast medium is another possibilityto minimize the effects of leakage (83,84). The increaseof permeability in capillaries of high-grade gliomas canbe estimated by dynamic T1-weighted contrast-enhancedMRI. Of special interest is the so-called transport constant(85), which describes the exchange of contrast mediumfrom intra- to extravascular space. The transport constantis a quantifiable value and can be calculated on the basis ofcompartmental model estimations. This technique is quitecomplex and has been available so far only in advancedimaging centers.
Cao et al. proposed a special short T2*-weighted MRIsequence measuring perfusion parameters and permeabilityat the same time (86). Careful interpretation of dataachieved by T1- or T2*-based MRI techniques is manda-tory during therapy with corticosteroids or VEGF-specificantibodies (see the section on monitoring treatment effects
FIGURE 5. Patient with headache and no neurologic deficit despite paresthesia of left arm. At top, MRI metabolite maps of inositol (Ins)
and choline (Cho) show inhomogeneity of high-grade glioma. At bottom, disrupted BBB is demonstrated by T1-weighted contrast-
enhanced MR image (T11CM), elevation of rCBV in same area. Spectra from area with highest choline elevation contain lipid resonancesindicating necrosis (arrows).
TUMOR RECURRENCE ASSESSMENT • Heiss et al. 1591
with MRI). T2*-weighted perfusion techniques are widelyavailable, but as a shortcoming the results are barely com-parable because of a lack of standardized protocols anddifferent postprocessing algorithms dependent on the man-ufacturers of MRI devices or third-party software packages.Only large and solid parts of a glioma should be evaluated,and because of the limitations mentioned before, identicalpostprocessing parameters have to be applied to detect localdedifferentiation of gliomas or therapeutic effects by radio-chemotherapy.Perfusion-weighted imaging data can be used for tumor
grading, since high-grade tumors tend to show higher rCBVvalues (87–89) than does normal-appearing contralateraltissue. Law et al. found a threshold of 1.75 for determininga high-grade glioma (87). Oligodendrogliomas differ fromastrocytomas with respect to their rCBV cutoff for the dif-ference between low and high grade. This cutoff tends to behigher for oligodendrogliomas, at a ratio of about 2.14 (90).Higher-grade gliomas also tend to show higher capillary
leakage, although the correlation with grading was found tobe weaker than for rCBV measurements (91,92).Blood Oxygen Level–Dependent and T29 Imaging. Blood
oxygen level–dependent imaging refers to the contrasteffect between oxygenated and deoxygenated hemoglobin.Deoxygenated hemoglobin does have a paramagnetic effectand causes a slight signal loss in susceptibility sensitivesequences (T2*, echo-planar imaging), whereas oxygenatedhemoglobin has diamagnetic characteristics with no signalloss in these sequences. This blood oxygen level–dependenteffect is the technical basis of functional MRI, as well as forparts of susceptibility weighting and T29 imaging. Low T29values are thought to represent areas with high oxygenconsumption or high oxygen extraction fraction (93,94).The T29 values can be influenced by confounding factorssuch as microcalcifications, hemorrhage, and microvascu-lature. Saitta et al. (93) found a significant T29 differencebetween low- and high-grade gliomas; high-grade gliomasshowed lower T29 values indicating higher oxygen extrac-tion, possibly caused by a higher metabolic state.
Imaging of Tumor Inhomogeneities
A specific and important application of PET tracers is thedetection of especially active compartments in a tumor or ofresidual tumor after resection. Gliomas are often heteroge-neous and may contain regions of different histologic grades.The areas of higher malignancy might not show contrastenhancement on conventional MRI or CT, but they define theprognosis and must be included in the material sampled fordiagnosis in biopsy. Stereotactic biopsy based on coregis-tered 18F-FDG PET and MRI therefore improved the assess-ment of tumor grade (95). Chemical shift spectroscopicimaging can also be used for guidance of stereotactic biop-sies (69) based on choline information that indicates areaswith higher cell membrane turnover. In a comparison of 11C-MET PET and 2-dimensional chemical shift imaging, thespectroscopic technique could even show tumor areas of
increased proliferation rate when PET showed negative ornonspecific tracer uptake while the maximum changes inboth techniques correlated well (96). Perfusion-weightedimaging data can also be used to characterize spatial hetero-geneity in high-grade gliomas (97).
With regard to tumor extent and infiltration into surround-ing tissue, assessment of 11C-MET uptake is superior tomeasurement of glucose consumption (98,99) and to conven-tional contrast-enhanced MRI (100,101) or MRS (102), and11C-MET PET detects solid parts of tumors as well as theinfiltration zone with high sensitivity and specificity (103).
EFFECTS ON SURROUNDING AND REMOTEBRAIN AREAS
PET
Brain tumors are often space-occupying and infiltratinglesions and therefore affect the surrounding tissue but alsoremote brain areas. Especially in malignant tumors, there isa wide rim of reduced glucose metabolism that might bepartly due to edema formation and to functional inactiva-tion by the infiltrating tumor (19). This impairment of glu-cose metabolism in the brain outside the tumor is related toprognosis (20). Patients with brain tumors have decreasedmetabolism in the contralateral cortex, and the degree ofdecrease correlates with tumor size. This phenomenon maypartly be caused by corticosteroids, but a functional inacti-vation of the contralateral hemisphere cannot be excluded(104), and this inactivation is also observed in the contra-lateral cerebellum.
The function of the brain outside the tumor and the effectof the lesion on eloquent areas can be studied by functionalimaging such as activation PET or functional MRI. 15O-water is the most frequently used cerebral blood flow tracerfor this purpose, allowing up to 12 measurements underdifferent conditions, but 18F-FDG has also been used torecord functional changes. Coregistration and fusion imagedisplay with 3-dimensional MRI are necessary for accurateanatomic localization (105). The location of functionallyactivated areas may be altered by several effects of thetumor: the new mass can displace the primary cortical cen-ters, infiltrations can reduce the activation and impair thefunction of a specific area, or functional activations canoccur at atypical locations, even in the contralateral hemi-sphere, as an indication of the reorganization of functionalnetworks (106). Exact localization of eloquent areas is animportant clinical goal for planning tailored surgery, andinfiltrated tissue may sometimes still be functional.
Motor activity usually leads to significant activation inrespective areas of contralateral motor cortex, in the supple-mentary motor area, and in the ipsilateral cerebellum. Inpatients with brain tumors, functionally activated areas alongthe precentral gyrus that exceed displacement due to masseffects have been observed. When cortical lesions causingcontralateral spastic paresis abolish activation of motor cortex,more intense activation of secondary motor areas and of motorcortex ipsilateral to the paretic limbs is observed (107).
1592 THE JOURNAL OF NUCLEAR MEDICINE • Vol. 52 • No. 10 • October 2011

The functional activation of language is lateralized to theleft hemisphere in most right-handers, whereas in left-handers it may be represented in either hemisphere or evenbilaterally (108). The localization of sensory and motorlanguage areas is of interest for surgical planning in patientswith tumors in inferior frontal and temporoparietal areas.Active semantic or language production tasks provideclearly lateralized activations, in particular in the inferiorfrontal cortex of the dominant hemisphere, in the superiortemporal cortex, in the anterior cingulated cortex and theadjacent supplementary language area, and in the contra-lateral cerebellum. In patients with brain tumors in thedominant hemisphere, a considerable reorganization ofthe language-related network is observed (109), dependenton the speed of the development of the brain lesion: a verbgeneration paradigm increased the activation area beyondthe primary language regions to the left frontal medialgyrus, the orbital inferior frontal gyrus, the anterior insula,and the left cerebellum (Figs. 6A and 6B). Unlike thehealthy volunteers, two thirds of the right-handed patientsalso showed activation of the right inferior frontal gyrus,the area homologous to the Broca area (Fig. 6C). In 18% ofpatients, a reversed dominance was observed (110); suc-cessful resection of a left frontotemporal tumor improvedaphasia and restored left hemisphere dominance, suggestinga reversible disinhibition by removal of the primary func-tional damage (Fig. 6D). These studies support a hierarchicalorganization of the language network for speech perform-
ance and recovery and stress the importance of left-sidedareas around the primary language centers; contralateralareas activated by reduced transcallosal inhibition can onlypartially compensate for damage of left-sided centers(106,111). The hierarchy of the functional network in anindividual patient should be considered in planning surgicalinterventions.
MRI
Morphologic imaging does show signs of edema andmass effect. Functional or physiologic imaging, such asfunctional MRI using the blood oxygen level–dependenteffect, can be applied to demonstrate eloquent brain areasbefore surgery as well as functional plasticity of the brainafter therapy. Functional MRI data can easily be referencedto 3-dimensional anatomic datasets for neuronavigationalpurposes, since functional data and anatomic data areacquired within the same session without patient reposition-ing. Language examinations and motor tasks for functionalMRI can be performed within 20–30 min, and languagefunctional MRI has replaced the Wada test for probing oflanguage lateralization (112). Diffusion tensor imaging, aDWI technique applying mathematic models to calculateand visualize white matter tracts, can show displacementor disruption of fiber tracts caused by a brain tumor (Fig. 7).This information can help the neurosurgeon to plan andguide an approach to a tumor and the resection.
DWI has also been used to delineate tumor margins.Compared with the lower fractional anisotropy values of thetissue around metastases, higher peritumoral fractionalanisotropy, a marker of directed diffusion of water mole-cules, indicates peritumoral spread of neoplastic cells (113).
PROGNOSIS
PET
In most patients with malignant brain tumors, glucoseconsumption in the surrounding brain is reduced, and thisreduction correlates with prognosis (20). Especially in low-grade gliomas, amino acid uptake is related to prognosisand survival (34,35).
FIGURE 7. Diffusion tensor MRI demonstrates displaced and not
destroyed/infiltrated pontine longitudinal fiber tracts. Fibers are dis-
placed anteriorly and posteriorly by left-sided pontine glioma. Colorcoding indicates fiber direction: red5 left/right; blue5 cranial/caudal;
green 5 anterior/posterior.
FIGURE 6. Activation of H215O PET by verb generation, coregis-
tered to MRI. In patient at top, with left temporal glioma, Broca
region is rostral (A) and motoric speech region is dorsal (B). Alter-
natively, in patient at bottom, with grade III astrocytoma, Broca
region is transferred to contralateral homotopic area (C), and thisactivation of nondominant hemisphere is reversible (D).
TUMOR RECURRENCE ASSESSMENT • Heiss et al. 1593

MRI
Morphologic imaging can indicate tumor progression byincreasing mass effect and increasing areas of elevated T2signal intensities, as well as increasing or new contrastenhancement in untreated brain tumors. Prognostic informa-tion can be derived only by physiologic imaging techniques.In untreated low-grade brain tumors, an elevated rCBV
(114,115) or a near-normal or elevated creatine level (66)indicate a short progression-free survival time and poorerprognosis. rCBV elevations can precede malignant transfor-mation and new contrast enhancement by up to 12 mo (116).In children, the percentage change of choline or NAA com-bined with perfusion measurements in serial MRI examina-tions was found to be useful in predicting tumor progression(117). Before antiangiogenic therapy, ADC analysis of glio-mas tended to predict progression-free survival in recurrentglioblastoma multiforme patients (118).
MONITORING TREATMENT EFFECTS
PET
Because of the high cortical background activity, 18F-FDG is limited in the detection of residual tumor aftertherapy (119). The effects of radiation and chemotherapycan be shown only after a few weeks of treatment (120),and recurrent tumor or malignant transformation is markedby newly occurring hypermetabolism (121). Hypermetabo-lism after radiotherapy, however, can also be mimicked byinfiltration of macrophages. With these limitations, 18F-FDG PET is not the preferred method for the assessmentof therapeutic effects (122). For this application, amino acidand nucleoid tracers are better suited (123–127). Severalstudies suggested that outcomes are better for patients inwhom 11C-MET or 18F-FET PET coregistered to MRI areapplied for treatment planning and follow-up than forpatients diagnosed by MRI alone (123–126,128). In thefollow-up and for the management of patients with braintumor, the differentiation between recurrent tumor as a signof treatment failure and necrosis as an indicator of successis essential. For that application, 11C-MET PET coregis-tered to MRI has high sensitivity and specificity (;75%)(129–132). Malignant progression in nontreated and treatedpatients was detected with high sensitivity and specificity
by 11C-MET PET (Fig. 8). The increase in 11C-MET uptakeduring malignant progression was also reflected by anincrease in angiogenesis-promoting markers such as VEGF(133). The volume of metabolically active tumor in recur-rent glioblastoma multiforme was underestimated by gado-linium–diethylenetriaminepentaacetic acid–enhanced MRI(134). The additional information supplied by 11C-METPET changed management in half the cases (135).
Responses after chemotherapy can be detected by aminoacid PET early in the course (136–138), suggesting thatdeactivation of amino acid transport is an early sign ofresponse to chemotherapy. 18F-FET PET coregistered toMRI detected the effects of a multimodal treatment moresensitively than did conventional MRI alone (139) andreached a sensitivity of more than 80% and a specificityof close to 100% (140). With 18F-FLT PET, a distinctionbetween responders and nonresponders to a combinationtherapy was possible: 18F-FLT PET at 2 and 6 wk predictedsurvival better than did MRI (141). Multimodal imaging,including various PET and MRI modalities, will have agreat impact on the development of new therapeutic strate-gies, such as targeting to proliferating cells (142) or apply-ing gene therapy vectors (143).
MRI
Classic MRI techniques are still the basis for follow-upstudies, but after modern therapies such as combined radio-chemotherapy or antiangiogenic therapy, the so-calledpseudoprogression and pseudoresponse limit the usefulnessof the classic McDonald criteria (144,145) during early fol-low-up examinations. Therefore, physiologic MRI might behelpful in these situations.
Monitoring of response to radiochemotherapy by ADCmeasurements can be recommended because changes inproton diffusion during the first weeks after onset oftherapy are indicators of the intended antitumorous effectand therefore a prognostic marker for sufficient response toradiochemotherapy (146,147). In addition, DWI values ofgliomas before treatment correlated with the probability ofresponse to therapy with bevacizumab in a study performedby Pope et al. (118). Functional diffusion maps show prom-ise as a way of providing an early surrogate marker for
FIGURE 8. Decrease of 11C-MET uptake
on PET demonstrates response to chemo-
therapy and favorable prognosis, whereas
increase in amino acid uptake is related tono response to chemotherapy and unfavor-
able outcome. Gd-DTPA 5 gadolinium–
diethylenetriaminepentaacetic acid; TMZ 5temozolomide.
1594 THE JOURNAL OF NUCLEAR MEDICINE • Vol. 52 • No. 10 • October 2011

treatment response as well (146,148,149). During radiother-apy, early changes of rCBV can indicate response to treat-ment and correlate with survival (150). Especially, the useof voxel-by-voxel parametric response maps at 3 wk afterradiotherapy can help to predict overall survival (151).Anti-VEGF chemotherapy leads to new problems in
assessing tumor response using conventional MRI. Thecontrast enhancement as the major factor of the McDonaldcriteria cannot be used since the therapy leads to a markedreduction of BBB disruption. In solid gliomas, this therapymay induce lesions resembling ischemic brain, with highDWI and low ADC values (152,153). Nevertheless, changesin ADC histogram analysis may be predictive of responsein the anti-VEGF treatment of recurrent high-grade gliomas(154). It has been observed that primary brain tumors mightchange their behavior under anti-VEGF therapy from anecrotizing growth to a more infiltrative growth, whichcan best be observed on fluid-attenuated inversion recoveryimages (155).
RESIDUAL TUMOR AND RECURRENCES
PET
The capacity of PET to identify tumor compartments thatdiffer in activity is especially important for the detectionof residual or recurrent tumor after resection and for dif-ferentiation between treatment-induced changes such asnecrosis and active proliferating tissue. Actually, in indi-vidual cases, necrotic and active tissue can be found next toeach other or may even overlap (156), and 18F-FDG inmacrophages that infiltrate tissue after radiotherapy mayimpair diagnostic accuracy. However, a newly detectedhypermetabolism weeks after resection or treatment indi-cates a recurrent tumor or progression from low-grade tohigh-grade glioma (121,157,158). With a sensitivity of 75%and a specificity of 81%, 18F-FDG combined to MRI candistinguish recurrent tumor from radiation necrosis (159).Again, 11C-MET PET is more sensitive than 18F-FDG PETfor differentiating between recurrent tumor and radiation
necrosis (Fig. 9) (130,132), despite limitations in tumorgrading (160), and is especially effective in combinationwith MRI (161). Even in brain lesions that did not showincreased uptake on 18F-FDG PET, a sensitivity of between89% (tumors) and 92% (gliomas) and a specificity of 100%was obtained (162,163).
MRI
Early postsurgical imaging within 24–72 h is advised forthe detection of residual contrast-enhancing tumor massesusing conventional techniques. After 72 h, the amount ofpostsurgical granulation tissue is increasing, confoundingthe interpretation regarding residual tumor. Within the first24 h after surgery, contrast enhancement can be caused bythe surgical procedure itself; therefore, imaging should beavoided during this period.
It is important to characterize biologic changes in the tissueto be able to separate therapy-induced necrosis or changesfrom recurrence (Fig. 10). Signs of newly increased cellmembrane turnover, new disruptions of BBB, new angiogen-esis, and increased perfusion can indicate tumor recurrence.Histopathologically, radiation necrosis is characterized byendothelial damage and fibrinoid necrosis, whereas recurrenttumor contains increased microvasculature, as do primaryhigh-grade brain tumors. One study found rCBV measure-
FIGURE 9. Patient with glioma after surgery and radiation. Coreg-
istered 11C-MET PET and MR images (A) demonstrate amino aciduptake medial to area of contrast enhancement (B). Biopsy showed
recurrent tumor in this area.
FIGURE 10. T1-weighted contrast-enhanced (T11CM) and rCBV
MR images showing radiation necrosis with low rCBV values (top
row) and recurrent tumor with rCBV elevation along left ventricularwall (bottom row).
TUMOR RECURRENCE ASSESSMENT • Heiss et al. 1595

ments to be equivalent to 11C-MET PET in the follow-up ofpatients with high-grade gliomas (164). In a recent 12-patientstudy assessing progression of gliomas after resection andradiochemotherapy, MRS was more accurate in low-gradegliomas and 18F-FDG PET was more accurate in high-gradegliomas (165).A comprehensive review of multimodal imaging for the
assessment of treatment response in gliomas was publishedrecently (166).New, evolving MRI techniques such as imaging of
endogenous proteins and peptides might further help inthe differentiation of glioma and radiation necrosis. In ananimal model, detection of amide protons by a newtechnique called amide proton transfer MRI was shown toprovide a biomarker for tissue characterization in thissituation (167). Amide proton transfer MRI is based on acontrast mechanism called chemical exchange–dependentsaturation transfer (168) and can easily be incorporated intoroutine clinical examination without the use of exogenouscontrast material (169).
THE FUTURE: HYBRID PET/MRI SYSTEMS
The results of coregistration of PET and MRI data provethe added value of multimodality imaging, but this value isaffected by the necessity of positioning the patient indifferent scanners, often in different physiological condi-tions and at different times. These problems are solved byhybrid PET/MRI systems that combine the excellent soft-tissue contrast at high resolution of MRI and its additionalimaging options such as spectroscopy, functional MRI,diffusion- and perfusion-weighted imaging with the molec-ular, biochemical, and functional information obtained byPET. In contrast to PET/CT, in which the modalities areused sequentially and the subsequent results fused, dataacquisition in a hybrid PET/MRI system takes placesimultaneously, since the specially constructed PET detec-tors (170) are placed within the MRI scanner. The PETdetectors must be invisible to the MRI scanner and mustnot interfere with the field gradients or MR radiofrequencypulses. The MRI scanner must be adapted to accommodatethe PET detectors, with radiofrequency coils built forminimal interference with the PET electronics (171). Addi-tionally, completely new strategies for PET attenuation cor-rection based on MRI information had to be developed(172). After the feasibility of simultaneous PET/MRI wasdemonstrated (2), a series of dedicated brain PET/MRIscanners was installed and some of the many promisingapplications (173) were tested. The high resolving powerof the hybrid system was reported in the first clinical studies(174), which demonstrated simultaneous structural, func-tional, and molecular imaging in patients with brain tumors.The combination of PET and MRI into a single systemallows for better MRI-based motion correction of PET data.The results can be used to define biopsy targets and to betterseparate tumor tissue from scarring, inflammation, and
necrosis. Further development is directed toward a fullyintegrated whole-body PET/MRI system that will use themanifold properties of simultaneous multimodal imaging(175) in general oncology.
SUMMARY
Conventional MRI is the preferred basis for diagnosisand follow-up of brain tumors. Dedicated PET and elabo-rate MRI procedures, which can be used to analyze physi-ologic and metabolic changes in healthy and pathologictissue, are valuable complementary tools enabling bettergrading of brain tumors, monitoring of treatment effects,and detection of recurrences. Fully integrated whole-bodyPET/MRI systems will soon be available to combine theadvantages of both techniques in a single step.
ACKNOWLEDGMENT
This work was supported in part by a grant from theWDH Foundation, Cologne.
REFERENCES
1. Beyer T, Townsend DW, Brun T, et al. A combined PET/CT scanner for clinical
oncology. J Nucl Med. 2000;41:1369–1379.
2. Schlemmer HP, Pichler BJ, Schmand M, et al. Simultaneous MR/PET imaging
of the human brain: feasibility study. Radiology. 2008;248:1028–1035.
3. Kleihues P, Cavenee WK. Tumours of the Nervous System. Lyon, France:
International Agency for Research on Cancer; 1997.
4. Louis DN, Ohgaki H, Wiestler OD, et al. The 2007 WHO classification of
tumours of the central nervous system. Acta Neuropathol. 2007;114:97–109.
5. Paulus W, Peiffer J. Intratumoral histologic heterogeneity of gliomas: a quanti-
tative study. Cancer. 1989;64:442–447.
6. Ginsberg LE, Fuller GN, Hashmi M, Leeds NE, Schomer DF. The significance
of lack of MR contrast enhancement of supratentorial brain tumors in adults:
histopathological evaluation of a series. Surg Neurol. 1998;49:436–440.
7. Scott JN, Brasher PM, Sevick RJ, Rewcastle NB, Forsyth PA. How often are
nonenhancing supratentorial gliomas malignant? A population study. Neurol-
ogy. 2002;59:947–949.
8. Tyler JL, Diksic M, Villemure JG, et al. Metabolic and hemodynamic evaluation
of gliomas using positron emission tomography. J Nucl Med. 1987;28:1123–1133.
9. Krohn KA, Mankoff DA, Muzi M, Link JM, Spence AM. True tracers: comparing
FDG with glucose and FLT with thymidine. Nucl Med Biol. 2005;32:663–671.
10. Patronas NJ, Di Chiro G, Brooks RA, et al. Work in progress: [18F] fluorodeoxy-
glucose and positron emission tomography in the evaluation of radiation ne-
crosis of the brain. Radiology. 1982;144:885–889.
11. Warburg O. On the origin of cancer cells. Science. 1956;123:309–314.
12. Delbeke D, Meyerowitz C, Lapidus RL, et al. Optimal cutoff levels of F-18
fluorodeoxyglucose uptake in the differentiation of low-grade from high-grade
brain tumors with PET. Radiology. 1995;195:47–52.
13. Spence AM, Muzi M, Mankoff DA, et al. 18F-FDG PET of gliomas at delayed
intervals: improved distinction between tumor and normal gray matter. J Nucl
Med. 2004;45:1653–1659.
14. Di Chiro G, DeLaPaz RL, Brooks RA, et al. Glucose utilization of cerebral
gliomas measured by (18F) fluorodeoxyglucose and positron emission tomog-
raphy. Neurology. 1982;32:1323–1329.
15. Alavi JB, Alavi A, Chawluk J, et al. Positron emission tomography in patients
with glioma: a predictor of prognosis. Cancer. 1988;62:1074–1078.
16. Herholz K, Pietrzyk U, Voges J, et al. Correlation of glucose consumption and
tumor cell density in astrocytomas: a stereotactic PET study. J Neurosurg. 1993;
79:853–858.
17. Patronas NJ, Dichiro G, Kufta C, et al. Prediction of survival in glioma patients
by means of positron emission tomography. J Neurosurg. 1985;62:816–822.
18. Barker FG II, Chang SM, Valk PE, Pounds TR, Prados MD. 18-fluorodeoxy-
glucose uptake and survival of patients with suspected recurrent malignant
glioma. Cancer. 1997;79:115–126.
1596 THE JOURNAL OF NUCLEAR MEDICINE • Vol. 52 • No. 10 • October 2011

19. DeLaPaz RL, Patronas NJ, Brooks RA, et al. Positron emission tomography
study of suppression of gray matter glucose utilization by brain tumors. Am
J Neuroradiol. 1983;4:826–829.
20. Holzer T, Herholz K, Jeske J, Heiss WD. FDG-PET as a prognostic indicator in
radiochemotherapy of glioblastoma. J Comput Assist Tomogr. 1993;17:681–687.
21. Di Chiro G, Hatazawa J, Katz DA, Rizzoli HV, De Michele DJ. Glucose
utilization by intracranial meningiomas as an index of tumor aggressivity and
probability of recurrence: a PET study. Radiology. 1987;164:521–526.
22. Herholz K, Herscovitch P, Heiss WD. NeuroPET: Positron Emission Tomography
in Neuroscience and Clinical Neurology. Berlin, Germany: Springer; 2004.
23. Ullrich RT, Kracht LW, Jacobs AH. Neuroimaging in patients with gliomas.
Semin Neurol. 2008;28:484–494.
24. Miyagawa T, Oku T, Uehara H, et al. “Facilitated” amino acid transport is
upregulated in brain tumors. J Cereb Blood Flow Metab. 1998;18:500–509.
25. Bading JR, Kan-Mitchell J, Conti PS. System A amino acid transport in cul-
tured human tumor cells: implications for tumor imaging with PET. Nucl Med
Biol. 1996;23:779–786.
26. Herholz K, Holzer T, Bauer B, et al. 11C-methionine PET for differential
diagnosis of low-grade gliomas. Neurology. 1998;50:1316–1322.
27. Kaschten B, Stevenaert A, Sadzot B, et al. Preoperative evaluation of 54 glio-
mas by PETwith fluorine-18-fluorodeoxyglucose and/or carbon-11-methionine.
J Nucl Med. 1998;39:778–785.
28. Sasaki M, Kuwabara Y, Yoshida T, et al. Carbon-11-methionine PET in focal
cortical dysplasia: a comparison with fluorine-18-FDG PET and technetium-
99m-ECD SPECT. J Nucl Med. 1998;39:974–977.
29. Bustany P, Chatel M, Derlon JM, et al. Brain tumor protein synthesis and
histological grades: a study by positron emission tomography (PET) with
C11-L-methionine. J Neurooncol. 1986;3:397–404.
30. Ogawa T, Inugami A, Hatazawa J, et al. Clinical positron emission tomography
for brain tumors: comparison of fludeoxyglucose F 18 and L-methyl-11C-me-
thionine. AJNR. 1996;17:345–353.
31. Chang CC, Kuwana N, Ito S, Yokoyama T, Kanno H, Yamamoto I. Cerebral
haemodynamics in patients with hydrocephalus after subarachnoid haemorrhage
due to ruptured aneurysm. Eur J Nucl Med Mol Imaging. 2003;30:123–126.
32. Kracht LW, Friese M, Herholz K, et al. Methyl-(11C)-L-methionine uptake as
measured by positron emission tomography correlates to microvessel density in
patients with glioma. Eur J Nucl Med Mol Imaging. 2003;30:868–873.
33. Ericson K, Lilja A, Bergstrom M, et al. Positron emission tomography with
([11C]methyl)-L-methionine, [11C]D-glucose, and [68Ga]EDTA in supratento-
rial tumors. J Comput Assist Tomogr. 1985;9:683–689.
34. DeWitte O, Goldberg I, Wikler D, et al. Positron emission tomography with injection
of methionine as a prognostic factor in glioma. J Neurosurg. 2001;95:746–750.
35. Ribom D, Eriksson A, Hartman M, et al. Positron emission tomography 11C-methio-
nine and survival in patients with low-grade gliomas. Cancer. 2001;92:1541–1549.
36. Galldiks N, Kracht LW, Berthold F, et al. [11C]-L-methionine positron emission
tomography in the management of children and young adults with brain tumors.
J Neurooncol. 2010;96:231–239.
37. Stadlbauer A, Prante O, Nimsky C, et al. Metabolic imaging of cerebral glio-
mas: spatial correlation of changes in O-(2-18F-fluoroethyl)-L-tyrosine PET
and proton magnetic resonance spectroscopic imaging. J Nucl Med. 2008;49:
721–729.
38. Derlon JM, Petit-Taboue MC, Chapon F, et al. The in vivo metabolic pattern of
low-grade brain gliomas: a positron emission tomographic study using 18F-
fluorodeoxyglucose and 11C-L-methylmethionine. Neurosurgery. 1997;40:
276–287.
39. Kato T, Shinoda J, Oka N, et al. Analysis of 11C-methionine uptake in low-grade
gliomas and correlation with proliferative activity. AJNR. 2008;29:1867–1871.
40. Weber WA, Wester HJ, Grosu AL, et al. O-(2-[18F]fluoroethyl)-L-tyrosine and
L-[methyl-11C]methionine uptake in brain tumours: initial results of a compa-
rative study. Eur J Nucl Med. 2000;27:542–549.
41. Becherer A, Karanikas G, Szabo M, et al. Brain tumour imaging with PET: a
comparison between [18F]fluorodopa and [11C]methionine. Eur J Nucl Med Mol
Imaging. 2003;30:1561–1567.
42. Chen W, Silverman DH, Delaloye S, et al. 18F-FDOPA PET imaging of brain
tumors: comparison study with 18F-FDG PET and evaluation of diagnostic
accuracy. J Nucl Med. 2006;47:904–911.
43. Fueger BJ, Czernin J, Cloughesy T, et al. Correlation of 6-18F-fluoro-L-dopa
PET uptake with proliferation and tumor grade in newly diagnosed and recur-
rent gliomas. J Nucl Med. 2010;51:1532–1538.
44. Shields AF, Grierson JR, Dohmen BM, et al. Imaging proliferation in vivo with
[18F] FLT and positron emission tomography. Nat Med. 1998;4:1334–1336.
45. Rasey JS, Grierson JR, Wiens LW, Kolb PD, Schwartz JL. Validation of FLT
uptake as a measure of thymidine kinase-1 activity in A549 carcinoma cells.
J Nucl Med. 2002;43:1210–1217.
46. Ullrich R, Backes H, Li H, et al. Glioma proliferation as assessed by 39-fluoro-39-deoxy-L-thymidine positron emission tomography in patients with newly
diagnosed high-grade glioma. Clin Cancer Res. 2008;14:2049–2055.
47. Chen W, Cloughesy T, Kamdar N, et al. Imaging proliferation in brain tumors
with 18F-FLT PET: comparison with 18F-FDG. J Nucl Med. 2005;46:945–952.
48. Jacobs AH, Thomas A, Kracht LW, et al. 18F-fluoro-L-thymidine and 11C-
methylmethionine as markers of increased transport and proliferation in brain
tumors. J Nucl Med. 2005;46:1948–1958.
49. Hatakeyama T, Kawai N, Nishiyama Y, et al. 11C-methionine (MET) and 18F-
fluorothymidine (FLT) PET in patients with newly diagnosed glioma. Eur J Nucl
Med Mol Imaging. 2008;35:2009–2017.
50. Valk PE, Mathis CA, Prados MD, Gilbert JC, Budinger TF. Hypoxia in human
gliomas: demonstration by PET with fluorine-18-fluoromisonidazole. J Nucl
Med. 1992;33:2133–2137.
51. Bruehlmeier M, Roelcke U, Schubiger PA, Ametamey SM. Assessment of hyp-
oxia and perfusion in human brain tumors using PETwith 18F-fluoromisonidazole
and 15O-H2O. J Nucl Med. 2004;45:1851–1859.
52. Cher LM, Murone C, Lawrentschuk N, et al. Correlation of hypoxic cell
fraction and angiogenesis with glucose metabolic rate in gliomas using18F-fluoromisonidazole, 18F-FDG PET, and immunohistochemical studies. J
Nucl Med. 2006;47:410–418.
53. Szeto MD, Chakraborty G, Hadley J, et al. Quantitative metrics of net prolif-
eration and invasion link biological aggressiveness assessed by MRI with hyp-
oxia assessed by FMISO-PET in newly diagnosed glioblastomas. Cancer Res.
2009;69:4502–4509.
54. Spence AM, Muzi M, Swanson KR, et al. Regional hypoxia in glioblastoma
multiforme quantified with [18F]fluoromisonidazole positron emission tomog-
raphy before radiotherapy: correlation with time to progression and survival.
Clin Cancer Res. 2008;14:2623–2630.
55. Henze M, Schuhmacher J, Hipp P, et al. PET imaging of somatostatin receptors
using [68GA]DOTA-D-Phe1-Tyr3-octreotide: first results in patients with me-
ningiomas. J Nucl Med. 2001;42:1053–1056.
56. Nyuyki F, Plotkin M, Graf R, et al. Potential impact of 68Ga-DOTATOC PET/
CT on stereotactic radiotherapy planning of meningiomas. Eur J Nucl Med Mol
Imaging. 2010;37:310–318.
57. Milker-Zabel S, Zabel-du Bois A, Henze M, et al. Improved target volume
definition for fractionated stereotactic radiotherapy in patients with intracranial
meningiomas by correlation of CT, MRI, and [68Ga]-DOTATOC-PET. Int
J Radiat Oncol Biol Phys. 2006;65:222–227.
58. Thorwarth D, Henke G, Muller AC, et al. Simultaneous 68Ga-DOTATOC-PET/
MRI for IMRT treatment planning for meningioma: first experience. Int
J Radiat Oncol Biol Phys. February 5, 2011 [Epub ahead of print].
59. Herminghaus S, Dierks T, Pilatus U, et al. Determination of histopathological
tumor grade in neuroepithelial brain tumors by using spectral pattern analysis of
in vivo spectroscopic data. J Neurosurg. 2003;98:74–81.
60. Usenius JP, Tuohimetsa S, Vainio P, Ala-Korpela M, Hiltunen Y, Kauppinen RA.
Automated classification of human brain tumours by neural network analysis
using in vivo 1H magnetic resonance spectroscopic metabolite phenotypes. Neuro-
report. 1996;7:1597–1600.
61. Li X, Lu Y, Pirzkall A, McKnight T, Nelson SJ. Analysis of the spatial char-
acteristics of metabolic abnormalities in newly diagnosed glioma patients.
J Magn Reson Imaging. 2002;16:229–237.
62. Herminghaus S, Pilatus U, Moller-Hartmann W, et al. Increased choline levels
coincide with enhanced proliferative activity of human neuroepithelial brain
tumors. NMR Biomed. 2002;15:385–392.
63. Shimizu H, Kumabe T, Shirane R, Yoshimoto T. Correlation between choline
level measured by proton MR spectroscopy and Ki-67 labeling index in glio-
mas. AJNR. 2000;21:659–665.
64. Porto L, Kieslich M, Franz K, et al. Spectroscopy of untreated pilocytic astro-
cytomas: do children and adults share some metabolic features in addition to
their morphologic similarities? Childs Nerv Syst. 2010;26:801–806.
65. Xu M, See SJ, Ng WH, et al. Comparison of magnetic resonance spectroscopy
and perfusion-weighted imaging in presurgical grading of oligodendroglial
tumors. Neurosurgery. 2005;56:919–926.
66. Hattingen E, Delic O, Franz K, et al. 1H MRSI and progression-free survival in
patients with WHO grades II and III gliomas. Neurol Res. 2010;32:593–602.
67. Hattingen E, Raab P, Franz K, et al. Prognostic value of choline and creatine in
WHO grade II gliomas. Neuroradiology. 2008;50:759–767.
68. Burtscher IM, Skagerberg G, Geijer B, et al. Spectroscopy and preoperative
diagnostic accuracy: an evaluation of intracranial mass lesions characterized by
stereotactic biopsy findings. AJNR 2000;21:84–93.
69. Hermann EJ, Hattingen E, Krauss JK, et al. Stereotactic biopsy in gliomas
guided by 3-tesla 1H-chemical-shift imaging of choline. Stereotact Funct Neu-
rosurg. 2008;86:300–307.
TUMOR RECURRENCE ASSESSMENT • Heiss et al. 1597

70. Hattingen E, Raab P, Franz K, Zanella FE, Lanfermann H, Pilatus U. Myo-
inositol: a marker of reactive astrogliosis in glial tumors? NMR Biomed. 2008;
21:233–241.
71. Nelson SJ, Graves E, Pirzkall A, et al. In vivo molecular imaging for planning
radiation therapy of gliomas: an application of 1H MRSI. J Magn Reson Imag-
ing. 2002;16:464–476.
72. Chawla S, Zhang Y, Wang S, et al. Proton magnetic resonance spectroscopy in
differentiating glioblastomas from primary cerebral lymphomas and brain me-
tastases. J Comput Assist Tomogr. 2010;34:836–841.
73. Day SE, Kettunen MI, Cherukuri MK, et al. Detecting response of rat C6 glioma
tumors to radiotherapy using hyperpolarized [1-13C]pyruvate and 13C magnetic
resonance spectroscopic imaging. Magn Reson Med. 2011;65:557–563.
74. Witney TH, Kettunen MI, Day SE, et al. A comparison between radiolabeled
fluorodeoxyglucose uptake and hyperpolarized 13C-labeled pyruvate utiliza-
tion as methods for detecting tumor response to treatment. Neoplasia 2009;11:
574–582.
75. Le Bihan D. Molecular diffusion, tissue microdynamics and microstructure.
NMR Biomed. 1995;8:375–386.
76. Arvinda HR, Kesavadas C, Sarma PS, et al. Glioma grading: sensitivity, spe-
cificity, positive and negative predictive values of diffusion and perfusion imag-
ing. J Neurooncol. 2009;94:87–96.
77. Koral K, Gargan L, Bowers DC, et al. Imaging characteristics of atypical
teratoid-rhabdoid tumor in children compared with medulloblastoma. AJR.
2008;190:809–814.
78. Rumboldt Z, Camacho DL, Lake D, Welsh CT, Castillo M. Apparent diffusion
coefficients for differentiation of cerebellar tumors in children. AJNR. 2006;
27:1362–1369.
79. Kocaoglu M, Ors F, Bulakbasi N, Onguru O, Ulutin C, Secer HI. Central
neurocytoma: proton MR spectroscopy and diffusion weighted MR imaging
findings. Magn Reson Imaging. 2009;27:434–440.
80. Jensen JH, Helpern JA. MRI quantification of non-Gaussian water diffusion by
kurtosis analysis. NMR Biomed. 2010;23:698–710.
81. Raab P, Hattingen E, Franz K, Zanella FE, Lanfermann H. Cerebral gliomas:
diffusional kurtosis imaging analysis of microstructural differences. Radiology.
2010;254:876–881.
82. Cha S, Knopp EA, Johnson G, Wetzel SG, Litt AW, Zagzag D. Intracranial
mass lesions: dynamic contrast-enhanced susceptibility-weighted echo-planar
perfusion MR imaging. Radiology. 2002;223:11–29.
83. Boxerman JL, Schmainda KM, Weisskoff RM. Relative cerebral blood volume
maps corrected for contrast agent extravasation significantly correlate with
glioma tumor grade, whereas uncorrected maps do not. AJNR. 2006;27:859–
867.
84. Hu LS, Baxter LC, Pinnaduwage DS, et al. Optimized preload leakage-correc-
tion methods to improve the diagnostic accuracy of dynamic susceptibility-
weighted contrast-enhanced perfusion MR imaging in posttreatment gliomas.
AJNR. 2010;31:40–48.
85. Tofts PS, Brix G, Buckley DL, et al. Estimating kinetic parameters from dy-
namic contrast-enhanced T(1)-weighted MRI of a diffusable tracer: standard-
ized quantities and symbols. J Magn Reson Imaging. 1999;10:223–232.
86. Cao Y, Shen Z, Chenevert TL, Ewing JR. Estimate of vascular permeability and
cerebral blood volume using Gd-DTPA contrast enhancement and dynamic
T2*-weighted MRI. J Magn Reson Imaging. 2006;24:288–296.
87. Law M, Yang S, Wang H, et al. Glioma grading: sensitivity, specificity, and
predictive values of perfusion MR imaging and proton MR spectroscopic imag-
ing compared with conventional MR imaging. AJNR. 2003;24:1989–1998.
88. Provenzale JM, York G, Moya MG, et al. Correlation of relative permeability
and relative cerebral blood volume in high-grade cerebral neoplasms. AJR.
2006;187:1036–1042.
89. Roberts C, Issa B, Stone A, Jackson A, Waterton JC, Parker GJ. Comparative
study into the robustness of compartmental modeling and model-free analysis
in DCE-MRI studies. J Magn Reson Imaging. 2006;23:554–563.
90. Spampinato MV, Smith JK, Kwock L, et al. Cerebral blood volume measure-
ments and proton MR spectroscopy in grading of oligodendroglial tumors. AJR.
2007;188:204–212.
91. Law M, Yang S, Babb JS, et al. Comparison of cerebral blood volume and
vascular permeability from dynamic susceptibility contrast-enhanced perfusion
MR imaging with glioma grade. AJNR. 2004;25:746–755.
92. Patankar TF, Haroon HA, Mills SJ, et al. Is volume transfer coefficient (K(trans))
related to histologic grade in human gliomas? AJNR. 2005;26:2455–2465.
93. Saitta L, Heese O, Forster AF, et al. Signal intensity in T29 magnetic resonance
imaging is related to brain glioma grade. Eur Radiol. 2011;21:1068–1076.
94. Siemonsen S, Fitting T, Thomalla G, et al. T29 imaging predicts infarct growth
beyond the acute diffusion-weighted imaging lesion in acute stroke. Radiology.
2008;248:979–986.
95. Levivier M, Goldman S, Pirotte B, et al. Diagnostic yield of stereotactic brain
biopsy guided by positron emission tomography with [18F]fluorodeoxyglucose.
J Neurosurg. 1995;82:445–452.
96. Widhalm G, Krssak M, Minchev G, et al. Value of 1H-magnetic resonance
spectroscopy chemical shift imaging for detection of anaplastic foci in diffusely
infiltrating gliomas with non-significant contrast-enhancement. J Neurol Neuro-
surg Psychiatry. 2011;82:512–520.
97. Lupo JM, Cha S, Chang SM, Nelson SJ. Dynamic susceptibility-weighted
perfusion imaging of high-grade gliomas: characterization of spatial heteroge-
neity. AJNR. 2005;26:1446–1454.
98. Goldman S, Levivier M, Pirotte B, et al. Regional methionine and glucose
uptake in high-grade gliomas: a comparative study on PET-guided stereotaxic
biopsy. J Nucl Med. 1997;38:1459–1462.
99. Pirotte B, Goldman S, Massager N, et al. Comparison of 18F-FDG and 11C-
methionine for PET-guided stereotactic brain biopsy of gliomas. J Nucl Med.
2004;45:1293–1298.
100. Mineura K, Sasajima T, Kowada M, Uesaka Y, Shishido F. Innovative approach
in the diagnosis of gliomatosis cerebri using carbon-11-L-methionine positron
emission tomography. J Nucl Med. 1991;32:726–728.
101. Pauleit D, Floeth F, Hamacher K, et al. O-(2-[18F]fluoroethyl)-L-tyrosine PET
combined with MRI improves the diagnostic assessment of cerebral gliomas.
Brain. 2005;128:678–687.
102. Floeth FW, Pauleit D, Wittsack HJ, et al. Multimodal metabolic imaging of
cerebral gliomas: positron emission tomography with [18F]fluoroethyl-L-tyro-
sine and magnetic resonance spectroscopy. J Neurosurg. 2005;102:318–327.
103. Kracht LW, Miletic H, Busch S, et al. Delineation of brain tumor extent with
[11C]L-methionine positron emission tomography: local comparison with ste-
reotactic histopathology. Clin Cancer Res. 2004;10:7163–7170.
104. Roelcke U, Blasberg RG, von Ammon K, et al. Dexamethasone treatment and
plasma glucose levels: relevance for fluorine-18-fluorodeoxyglucose uptake
measurements in gliomas. J Nucl Med. 1998;39:879–884.
105. Pietrzyk U, Herholz K, Heiss WD. Three-dimensional alignment of functional
and morphological tomograms. J Comput Assist Tomogr. 1990;14:51–59.
106. Heiss WD, Thiel A. A proposed regional hierarchy in recovery of post-stroke
aphasia. Brain Lang. 2006;98:118–123.
107. Wunderlich G, Knorr U, Herzog H, Kiwit JC, Freund HJ, Seitz RJ. Precentral
glioma location determines the displacement of cortical hand representation.
Neurosurgery 1998;42:18–26.
108. Thiel A, Herholz K, von Stockhausen HM, et al. Localization of language-
related cortex with 15O-labeled water PET in patients with gliomas. Neuro-
image. 1998;7:284–295.
109. Thiel A, Herholz K, Koyuncu A, et al. Plasticity of language networks in patients
with brain tumors: a PET activation study. Ann Neurol. 2001;50:620–629.
110. Thiel A, Habedank B, Winhuisen L, et al. Essential language function of the
right hemisphere in brain tumor patients. Ann Neurol. 2005;57:128–131.
111. Thiel A, Habedank B, Herholz K, et al. From the left to the right: how the brain
compensates progressive loss of language function. Brain Lang. 2006;98:57–65.
112. Binder JR, Swanson SJ, Hammeke TA, et al. Determination of language dominance
using functional MRI: a comparison with theWada test. Neurology. 1996;46:978–984.
113. Byrnes TJ, Barrick TR, Bell BA, Clark CA. Diffusion tensor imaging discrim-
inates between glioblastoma and cerebral metastases in vivo. NMR Biomed.
2011;24:54–60.
114. Law M, Oh S, Babb JS, et al. Low-grade gliomas: dynamic susceptibility-
weighted contrast-enhanced perfusion MR imaging—prediction of patient clin-
ical response. Radiology. 2006;238:658–667.
115. Law M, Young RJ, Babb JS, et al. Gliomas: predicting time to progression or
survival with cerebral blood volume measurements at dynamic susceptibility-
weighted contrast-enhanced perfusion MR imaging. Radiology. 2008;247:490–498.
116. Danchaivijitr N, Waldman AD, Tozer DJ, et al. Low-grade gliomas: do changes
in rCBV measurements at longitudinal perfusion-weighted MR imaging predict
malignant transformation? Radiology. 2008;247:170–178.
117. Tzika AA, Astrakas LG, Zarifi MK, et al. Spectroscopic and perfusion magnetic
resonance imaging predictors of progression in pediatric brain tumors. Cancer.
2004;100:1246–1256.
118. Pope WB, Kim HJ, Huo J, et al. Recurrent glioblastoma multiforme: ADC
histogram analysis predicts response to bevacizumab treatment. Radiology.
2009;252:182–189.
119. Wurker M, Herholz K, Voges J, et al. Glucose consumption and methionine
uptake in low-grade gliomas after iodine-125 brachytherapy. Eur J Nucl Med.
1996;23:583–586.
120. Brock CS, Young H, O’Reilly SM, et al. Early evaluation of tumour metabolic
response using [18F]fluorodeoxyglucose and positron emission tomography: a
pilot study following the phase II chemotherapy schedule for temozolomide in
recurrent high-grade gliomas. Br J Cancer. 2000;82:608–615.
1598 THE JOURNAL OF NUCLEAR MEDICINE • Vol. 52 • No. 10 • October 2011

121. Glantz MJ, Hoffman JM, Coleman RE, et al. Identification of early recurrence
of primary central-nervous-system tumors by [18F] fluorodeoxyglucose positron
emission tomography. Ann Neurol. 1991;29:347–355.
122. Ricci PE, Karis JP, Heiserman JE, Fram EK, Bice AN, Drayer BP. Differenti-
ating recurrent tumor from radiation necrosis: time for re-evaluation of positron
emission tomography. AJNR. 1998;19:407–413.
123. Tanaka Y, Nariai T, Momose T, et al. Glioma surgery using a multimodal
navigation system with integrated metabolic images. J Neurosurg. 2009;110:
163–172.
124. Grosu AL, Weber WA, Riedel E, et al. L-(methyl-11C) methionine positron
emission tomography for target delineation in resected high-grade gliomas
before radiotherapy. Int J Radiat Oncol Biol Phys. 2005;63:64–74.
125. Weber DC, Zilli T, Buchegger F, et al. [18F]fluoroethyltyrosine-positron emis-
sion tomography-guided radiotherapy for high-grade glioma. Radiat Oncol.
2008;3:44.
126. Vees H, Senthamizhchelvan S, Miralbell R, Weber DC, Ratib O, Zaidi H.
Assessment of various strategies for 18F-FET PET-guided delineation of target
volumes in high-grade glioma patients. Eur J Nucl Med Mol Imaging. 2009;
36:182–193.
127. Nariai T, Tanaka Y, Wakimoto H, et al. Usefulness of L-[methyl-11C] methio-
nine-positron emission tomography as a biological monitoring tool in the treat-
ment of glioma. J Neurosurg. 2005;103:498–507.
128. Pirotte BJ, Levivier M, Goldman S, et al. Positron emission tomography-guided
volumetric resection of supratentorial high-grade gliomas: a survival analysis in
66 consecutive patients. Neurosurgery. 2009;64:471–481.
129. Thiel A, Pietrzyk U, Sturm V, Herholz K. Hovels M, Schroder R. Enhanced
accuracy in differential diagnosis of radiation necrosis by positron emission
tomography-magnetic resonance imaging coregistration: technical case report.
Neurosurgery. 2000;46:232–234.
130. Tsuyuguchi N, Takami T, Sunada I, et al. Methionine positron emission tomog-
raphy for differentiation of recurrent brain tumor and radiation necrosis after
stereotactic radiosurgery: in malignant glioma. Ann Nucl Med. 2004;18:291–296.
131. Terakawa Y, Tsuyuguchi N, Iwai Y, et al. Diagnostic accuracy of 11C-methio-
nine PET for differentiation of recurrent brain tumors from radiation necrosis
after radiotherapy. J Nucl Med. 2008;49:694–699.
132. Van Laere K, Ceyssens S, Van Calenbergh F, et al. Direct comparison of 18F-FDG
and 11C-methionine PET in suspected recurrence of glioma: sensitivity, inter-observer
variability and prognostic value. Eur J Nucl Med Mol Imaging. 2005;32:39–51.
133. Ullrich RT, Kracht L, Brunn A, et al. Methyl-L-11C-methionine PET as a
diagnostic marker for malignant progression in patients with glioma. J Nucl
Med. 2009;50:1962–1968.
134. Galldiks N, Ullrich R, Schroeter M, Fink GR, Jacobs AH, Kracht LW. Volu-
metry of [11C]-methionine PET uptake and MRI contrast enhancement in pa-
tients with recurrent glioblastoma multiforme. Eur J Nucl Med Mol Imaging.
2010;37:84–92.
135. Yamane T, Sakamoto S, Senda M. Clinical impact of 11C-methionine PET on
expected management of patients with brain neoplasm. Eur J Nucl Med Mol
Imaging. 2010;37:685–690.
136. Galldiks N, Kracht L, Burghaus L, et al. Use of 11C-methionine PET to monitor
the effects of temozolomide chemotherapy in malignant gliomas. Eur J Nucl
Med Mol Imaging. 2006;33:516–524.
137. Wyss M, Hofer S, Bruehlmeier M, et al. Early metabolic responses in temozo-
lomide treated low-grade glioma patients. J Neurooncol. 2009;95:87–93.
138. Galldiks N, Kracht LW, Burghaus L, et al. Patient-tailored, imaging-guided,
long-term temozolomide chemotherapy in patients with glioblastoma. Mol
Imaging. 2010;9:40–46.
139. Rachinger W, Goetz C, Popperl G, et al. Positron emission tomography with O-
(2-[18F]fluoroethyl)-l-tyrosine versus magnetic resonance imaging in the diag-
nosis of recurrent gliomas. Neurosurgery. 2005;57:505–511.
140. Mehrkens JH, Popperl G, Rachinger W, et al. The positive predictive value of
O-(2-[18F]fluoroethyl)-L-tyrosine (FET) PET in the diagnosis of a glioma re-
currence after multimodal treatment. J Neurooncol. 2008;88:27–35.
141. Chen W, Delaloye S, Silverman DH, et al. Predicting treatment response of
malignant gliomas to bevacizumab and irinotecan by imaging proliferation with
[18F] fluorothymidine positron emission tomography: a pilot study. J Clin On-
col. 2007;25:4714–4721.
142. Schnell O, Krebs B, Carlsen J, et al. Imaging of integrin alphavbeta3 expression
in patients with malignant glioma by [18F] galacto-RGD positron emission
tomography. Neuro Oncol. 2009;11:861–870.
143. Jacobs A, Voges J, Reszka R, et al. Positron-emission tomography of vector-medi-
ated gene expression in gene therapy for gliomas. Lancet. 2001;358:727–729.
144. van den Bent MJ, Vogelbaum MA, Wen PY, Macdonald DR, Chang SM. End
point assessment in gliomas: novel treatments limit usefulness of classical
Macdonald’s criteria. J Clin Oncol. 2009;27:2905–2908.
145. Taal W, Brandsma D, de Bruin HG, et al. Incidence of early pseudo-progression
in a cohort of malignant glioma patients treated with chemoirradiation with
temozolomide. Cancer. 2008;113:405–410.
146. Hamstra DA, Chenevert TL, Moffat BA, et al. Evaluation of the functional
diffusion map as an early biomarker of time-to-progression and overall survival
in high-grade glioma. Proc Natl Acad Sci USA. 2005;102:16759–16764.
147. Hamstra DA, Galban CJ, Meyer CR, et al. Functional diffusion map as an early
imaging biomarker for high-grade glioma: correlation with conventional radio-
logic response and overall survival. J Clin Oncol. 2008;26:3387–3394.
148. Moffat BA, Chenevert TL, Lawrence TS, et al. Functional diffusion map: a
noninvasive MRI biomarker for early stratification of clinical brain tumor re-
sponse. Proc Natl Acad Sci USA. 2005;102:5524–5529.
149. Chenevert TL, Stegman LD, Taylor JM, et al. Diffusion magnetic resonance
imaging: an early surrogate marker of therapeutic efficacy in brain tumors. J
Natl Cancer Inst. 2000;92:2029–2036.
150. Cao Y, Tsien CI, Nagesh V, et al. Survival prediction in high-grade gliomas by
MRI perfusion before and during early stage of RT. Int J Radiat Oncol Biol
Phys. 2006;64:876–885.
151. Galban CJ, Chenevert TL, Meyer CR, et al. The parametric response map is an
imaging biomarker for early cancer treatment outcome. Nat Med. 2009;15:572–576.
152. Wu J, Gilbert MR, De Groot JF, Yung WA, Puduvalli VK. Diffusion restriction
as a predictor of response in recurrent glioblastoma patients receiving bevaci-
zumab [abstract]. J Clin Oncol. 2010;28(15 suppl):2024.
153. Rieger J, Bahr O, Muller K, Franz K, Steinbach J, Hattingen E. Bevacizumab-
induced diffusion-restricted lesions in malignant glioma patients. J Neurooncol.
2010;99:49–56.
154. Nowosielski M, Recheis W, Goebel G, et al. ADC histograms predict response
to anti-angiogenic therapy in patients with recurrent high-grade glioma. Neuro-
radiology. 2010;53:291–302.
155. Norden AD, Young GS, Setayesh K, et al. Bevacizumab for recurrent malignant
gliomas: efficacy, toxicity, and patterns of recurrence. Neurology. 2008;70:779–787.
156. Levivier M, Becerra A, De Witte O, Brotchi J, Goldman S. Radiation necrosis
or recurrence. J Neurosurg. 1996;84:148–149.
157. De Witte O, Levivier M, Violon P, et al. Prognostic value of positron emission
tomography with [18F]fluoro-2-deoxy-D-glucose in the low-grade glioma. Neu-
rosurgery. 1996;39:470–476.
158. Langleben DD, Segall GM. PET in differentiation of recurrent brain tumor from
radiation injury. J Nucl Med. 2000;41:1861–1867.
159. Chao ST, Suh JH, Raja S, Lee SY, Barnett G. The sensitivity and specificity of
FDG PET in distinguishing recurrent brain tumor from radionecrosis in patients
treated with stereotactic radiosurgery. Int J Cancer. 2001;96:191–197.
160. Ceyssens S, Van Laere K, de Groot T, Goffin J, Bormans G, Mortelmans L.
[11C]methionine PET, histopathology, and survival in primary brain tumors and
recurrence. AJNR. 2006;27:1432–1437.
161. Popperl G, Gotz C, Rachinger W, Gildehaus FJ, Tonn JC, Tatsch K. Value of O-
(2-[18F]fluoroethyl)-L-tyrosine PET for the diagnosis of recurrent glioma. Eur
J Nucl Med Mol Imaging. 2004;31:1464–1470.
162. Chung JK, Kim YK, Kim SK, et al. Usefulness of 11C-methionine PET in the
evaluation of brain lesions that are hypo- or isometabolic on 18F-FDG PET. Eur
J Nucl Med Mol Imaging. 2002;29:176–182.
163. Chen W. Clinical applications of PET in brain tumors. J Nucl Med. 2007;48:
1468–1481.
164. Dandois V, Rommel D, Renard L, Jamart J, Cosnard G. Substitution of 11C-
methionine PET by perfusion MRI during the follow-up of treated high-grade
gliomas: preliminary results in clinical practice. J Neuroradiol. 2010;37:89–97.
165. Imani F, Boada FE, Lieberman FS, Davis DK, Deeb EL, Mountz JM. Compar-
ison of proton magnetic resonance spectroscopy with fluorine-18 2-fluoro-
deoxyglucose positron emission tomography for assessment of brain tumor
progression. J Neuroimaging. December 14, 2010 [Epub ahead of print].
166. Dhermain FG, Hau P, Lanfermann H, Jacobs AH, van den Bent MJ. Advanced
MRI and PET imaging for assessment of treatment response in patients with
gliomas. Lancet Neurol. 2010;9:906–920.
167. Zhou J, Tryggestad E, Wen Z, et al. Differentiation between glioma and radi-
ation necrosis using molecular magnetic resonance imaging of endogenous
proteins and peptides. Nat Med. 2011;17:130–134.
168. Ward KM, Aletras AH, Balaban RS. A new class of contrast agents for MRI
based on proton chemical exchange dependent saturation transfer (CEST). J
Magn Reson. 2000;143:79–87.
169. Zhou J, Blakeley JO, Hua J, et al. Practical data acquisition method for human brain
tumor amide proton transfer (APT) imaging. Magn Reson Med. 2008;60:842–849.
170. Judenhofer MS, Wehrl HF, Newport DF, et al. Simultaneous PET-MRI: a new
approach for functional and morphological imaging. Nat Med. 2008;14:459–465.
TUMOR RECURRENCE ASSESSMENT • Heiss et al. 1599
171. Pichler BJ, Kolb A, Nagele T, Schlemmer HP. PET/MRI: paving the way for the
next generation of clinical multimodality imaging applications. J Nucl Med.
2010;51:333–336.
172. Catana C, van der Kouwe A, Benner T, et al. Toward implementing an MRI-
based PET attenuation-correction method for neurologic studies on the MR-
PET brain prototype. J Nucl Med. 2010;51:1431–1438.
173. Heiss W-D. The potential of PET/MR for brain imaging. Eur J Nucl Med Mol
Imaging. 2009;36(suppl 1):105–112.
174. Boss A, Bisdas S, Kolb A, et al. Hybrid PET/MRI of intracranial masses: initial
experiences and comparison to PET/CT. J Nucl Med. 2010;51:1198–1205.
175. Sauter AW, Wehrl HF, Kolb A, Judenhofer MS, Pichler BJ. Combined PET/MRI:
one step further in multimodality imaging. Trends Mol Med. 2010;16:508–515.
1600 THE JOURNAL OF NUCLEAR MEDICINE • Vol. 52 • No. 10 • October 2011