
Payment System in Indonesia: Recent Developments and Policy ...
MULTIMODAL TRANSPORT IN INDONESIA: RECENT PROFILE AND STRATEGY DEVELOPMENT
Harun Al-Rasyid S. LUBIS Associate Professor Department of Civil Engineering, Institute of Technology Bandung (ITB) Jl. Ganesha 10 Bandung - 40132 Tel./Facs +62 –22-250 23 50 E-mail: [email protected]
Muhamad ISNAENI Research Associate Department of Civil Engineering, Institute of Technology Bandung (ITB) Jl. Ganesha 10 Bandung - 40132 Tel./Facs +62 –22-250 23 50 [email protected]
Ade SJAFRUDDIN Associate Professor Department of Civil Engineering, Institute of Technology Bandung (ITB) Jl. Ganesha 10 Bandung - 40132 Tel./Facs +62 –22-250 23 50 E-mail: [email protected]
Dimas B. DHARMOWIJOYO Graduate Student Department of Civil Engineering, Institute of Technology Bandung (ITB) Jl. Ganesha 10 Bandung - 40132 Tel./Facs +62 –22-250 23 50 [email protected]
Abstract: As a large archipelagic country, Indonesia has certain characteristics in terms of its transportation services. Each island or region has its own modes characteristics, the integration of which are still developing. To achieve an efficient transport system, a proportional modal share for each mode must be safeguarded and certain government regulations are needed in their implementation. In its current practice, each mode and its infrastructure was planned independently by the related authority, so that inefficient inter-modal transfer and high intermodal externalities are apparent. This paper reports a profile of multimodal transport in Indonesia. Overview of the existing supply and demand are presented. The paper also provides an initial benchmarking of the existing multimodal transport performance. Some recommendations on the strategy and measures to improve multimodal transport system in Indonesia is also discussed. Key Words: multimodal transport, benchmarking, externalities 1. INTRODUCTION 1.1 The Geographical Condition of Indonesia Indonesia is an archipelago with more than 17,000 islands spread through out the country. Nevertheless, inter-island transportation has not been perceived as having a strategic role. Being the most developed islands Java and Sumatra, in economic sense, have left the other islands behind, and these made that intra island wise transportation mainly roads becomes dominant in carrying both passengers and goods, especially when rail transportation has been decreasing since 1939. Fulfilling the mobilization needs of these areas are very challenging. Both local and central government still have plenty of work to do in order to develop transportation system which is relevant and proper to the characteristics of distribution, distance, and region. Because of
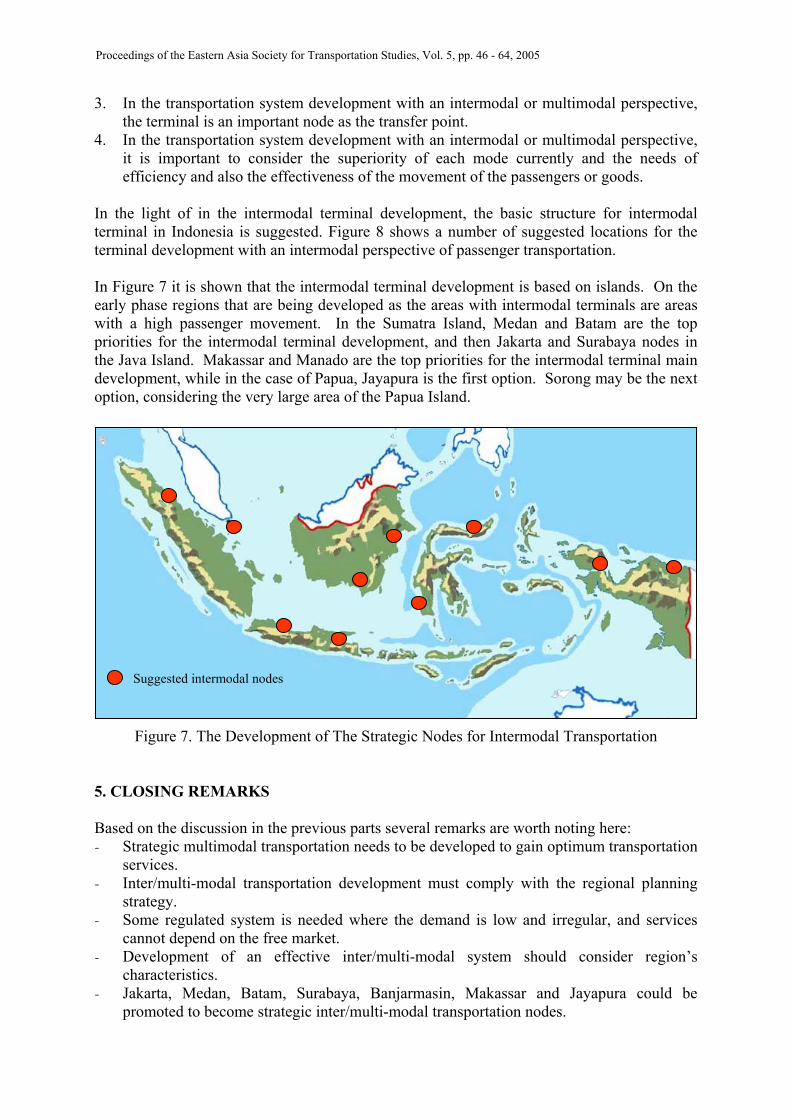
Proceedings of the Eastern Asia Society for Transportation Studies, Vol. 5, pp. 46 - 64, 2005
46
rapid developmental benefit, in many cases, roads network are considered as having more strategic role than other modes of transport. As roads function as a traffic shark with lack of intermodal facilities, these effect the transport network as a whole. As a result, mobilization from node-to-node becomes in-efficient, transport costs increase as well as intermodal externalities, these subsequently influence the purchasing power of the people. 1.2 Transportation in Global Economy Paradigm Shift The urgency of multimodal transport in Indonesia can be viewed as having, at least, two perspectives i.e. to improve the competitiveness of national product in global market and to function as a medium for national integration. The increase of trade in the free trade era, indicated by the establishment of WTO/GATS and AFTA/AFAS, demands a more efficient national economy system. Transportation as one of the costs, like it or not, has to be kept at a minimum rate. National logistics system has to be enhanced with a transportation network, which is efficient in its operation, in order to facilitate the volume of passengers and goods in order to be more competitive in the national and international market. Intermodal transportation is the answer to the global economy transportation demand. Intermodal transportation enables all production/market centers to interact with the international market. This will require a condition where each transport mode ideally has to ‘cooperate-and-compete’ well and connected structurally from the local to the international transport. 1.3 Liberalization of the Transportation Sector The inability of the government to boost the investment has left the government to entrust transportation infrastructure development to the private sector. Privatization does not occur only in Indonesia, but this is an international trend. As result, transportation is no longer entirely a public-domain. The liberalization of transportation has given a unique impact to Indonesia. Difference in characteristics for each transport mode has made difference in impact to everyone involved in such a matter, not all maybe that positive. Investment in expressways or toll roads, seemingly promising a high return, has created numerous proposals/business plans from the private sector, especially for some highly potential regions such as Trans Java, Trans Sumatra, and urban toll roads such as in Jakarta, Surabaya, Bandung, and Medan. As of air modes, tariff liberalization has caused the sprouting of more airlines, creating a highly competitive market which causes positive impacts for the consumers. As result, medium-to-long distance traveling has shifted to air modes. On the other hand, railways, buses, and passenger ships operators must rationalize their markets for medium-to-short distance traveling. Liberalization has resulted positively for service efficiency and infrastructure development acceleration. But, if not regulated properly, this may cause the fall of national transport industries. For example, PT KAI, the sole national rail corporation, is now facing serious problems that question the well being of its services. As a matter of fact, in other countries railways are the backbone of national logistics system and mass transportation in urban areas.
Proceedings of the Eastern Asia Society for Transportation Studies, Vol. 5, pp. 46 - 64, 2005
47
Competition in air modes, bad internal management, rail sector budget arrangement has not fully implemented, and low return on investment have resulted in the decrease of rail services and riderships. 1.4 High Transport Costs and Service Efficiency Global economy development has demanded for a more efficient transport operations. More efficient transportation services will cause low transport costs of passengers and goods movement. National product’s competitiveness and mobility of people will increase and be able to compete with imported products. Some facts show that raw material prices at local-owned coal mines is Rp 40,000/MT, yet sold at Rp160,000/MT not including profit margins FOB (Free on Board). This shows that there is a Rp120,000/MT difference for transport and administration costs from its origin to the shipping harbours. Low efficiency in some collection and distribution nodes has also caused high cost and operating time of transportation systems. This has affected the performance and mobility of that service and will also affect its service capacity. 2. MULTIMODAL NETWORK Transportation systems with a number of modes can be seen from two different conceptual perspectives: - Intermodal Transportation Network: a logistic system which is connected to two or more
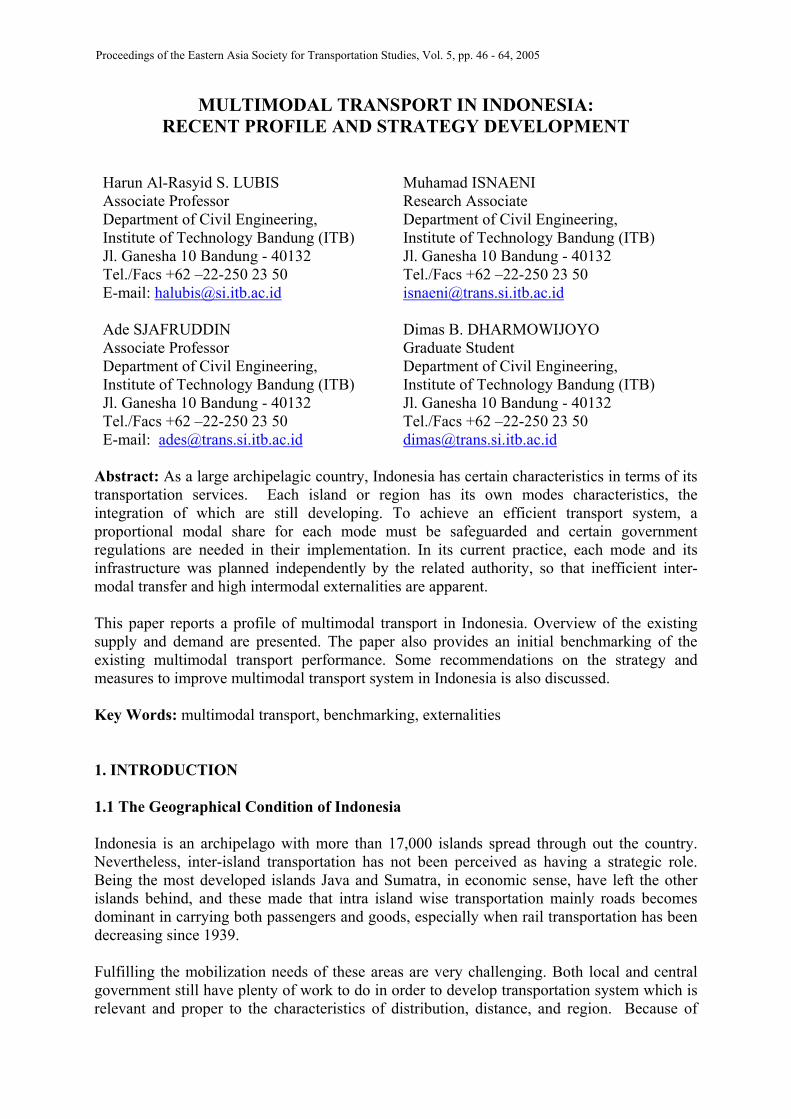
modes. Each mode has a service characteristic which generally enables goods (or passengers) to move to another existing mode in one trip from origin to destination.
- Multimodal Transportation Network: a set of transport modes which provide connection from origin to destination. Even if intermodal transportation can be applied, this is not compulsory.
(a) Multimodal Transportation Network (b) Intermodal Transportation Network
Figure 1. Description of Multi and Intermodal Transportation (Soure: Rodrigue and Comtois, 2004)
Proceedings of the Eastern Asia Society for Transportation Studies, Vol. 5, pp. 46 - 64, 2005
48
Figure 1 shows the difference between intermodal transportation network and multimodal transportation network. These two principles can be the base of efficient transportation development. In the eyes of national transportation, if efficiency is desired, then ideally in the future multimodal transportation network will be developed based on intermodal transport. 3. NATIONAL TRANSPORTATION CONDITION 3.1 Unbalanced Transportation Market Table 1 show a national estimation in passengers and goods transportation market in the year 2002. It can be seen in the table that roads dominates the transportation system, with more than 85% as a share, making it called ‘traffic shark’.
Table 1. National Transportation Market Estimation Year 2002
Passengers Goods Mode Millions/year % 1,000 tons/year % Roads 2,021.08 84.13% 2,514.51 90.34% Railroads 175.90 7.32% 17.25 0.62% Rivers 10.31 0.43% 28.00 1.01% Straits 116.03 4.83% 27.40 0.98% Sea 42.34 1.76% 194.81 7.00% Air 36.54 1.52% 1.37 0.05%
With +7.3% as passenger share, railways comes second. Yet, its share for goods is indeed very low (+0.62%). Both goods and passenger shares are seemingly declining following the decline of service quality, maintenance back-log, and competition with air mode. Air mode has experienced a quite significant increase, especially in passenger movement as a result of liberalization of air transportation sub sector (its share becomes + 1.56%). This has resulted in an increase in competitiveness of this mode, especially for long distance travels. Even if Sumatra, Kalimantan and Papua hold a huge potential for river transportation, river modes are not very popular (share: less than 1%). For example, Jambi, Riau, and South Sumatra have a great history of river transport in the past. In Kalimantan, river transport is supposed to be the backbone of transportation on that island, especially due to the fact that other transportation means have not been well developed. Low mobilization for passengers in East Indonesia is the main reason why sea shares are very low (1.76% or 42.3 million passengers/year). For goods shipping, sea modes play an important role, but for an archipelago like Indonesia, this number is still very low. Goods distribution which is based on the island wise concept has resulted in roads being the main choice of transportation especially in Western areas of Indonesia. The role other modes, such as railroads and rivers, to distribute goods in the island itself has not been very well developed. Dry ports as nodes of distribution for goods only exist in 5 locations in Java and Sumatra. The same goes for river modes for goods shipping. Very few goods are transported through rivers in Kalimantan. Coal shipment in Sungai Danau, South Kalimantan, is an exception.
Proceedings of the Eastern Asia Society for Transportation Studies, Vol. 5, pp. 46 - 64, 2005
49
Indonesia’s spacious area has caused goods production to be done island wise in order to suppress costs and no longer sees Java as the center of industries. Production centers are starting to spread to other islands, especially after the economy crisis in 1998. Security and labor issues are the main issues that are taken into consideration. In terms of goods or passenger market development, it is very interesting to study about the decision making of mode choices. Each corridor has their own characteristics in developing services other than roads. Ideally, mode to mode shares should be balanced so that high intermodal externalities i.e. economy costs resulted from traffic jams and insufficient roads maintenance can be avoided. 3.2 Multimodal Transport Profile 3.2.1 Passenger Movement As for passenger transport, roads still dominate the mobility as can be seen in Table 1. Development of roads still dominates inside Java, Sumatra, and crossing of those two islands. As a matter of fact, the crossing mobility volume between Java and Sumatra exceeds mobility volume inside Sumatra itself. Outside Java, the largest land movement occurs between Balikpapan-Banjarmasin, its corridor region and hinterland. For Sulawesi, the only significant mobilization is in South Sulawesi. Mobilization on the northern parts of Java (Pantai Utara or Pantura) is still the largest mobilization with Jakarta and Surabaya as the main two origin and destination nodes. Other than that, mobilization between Jakarta-Bandung, Surabaya-Sidoarjo-Malang, Yogyakarta-Solo, Semarang-Solo and other commuter mobilizations also contribute quite significantly to the mobilization in Java as a whole. In Sumatra, in connected areas such as Medan-Pekanbaru and Padang-Pekanbaru are areas with the largest movement in Sumatra. Connections between Medan and Padang with Riau or Riau as a whole are slightly high due to the fact that Riau is on the border of Singapore and Malaysia. Not only that, but also mobilization between Palembang-Lampung and its surroundings with Jakarta are also quite high. Lintas Tengah (Middle Route) is still the most populated intercity connections in Sumatra, even if there is Lintas Timur (Eastern Route) as an alternative. Movement of passenger via sea is more balanced throughout Indonesia. Some movement between Sumatra and Java still use sea modes even if the volume has very much decreased nowadays. Surabaya is the most important node in Java, only second to Jakarta, in terms of sea transportation to Sumatra, Kalimantan and East Indonesia. Sea movement to Kalimantan is higher than movement to Sulawesi, especially South Sulawesi. Most sea movements are long and medium distanced except between North Sulawesi and Maluku. Maluku is now the busiest of sea movement in Indonesia. The movement of air transportation modes is highly affected by major nodes in each island. Jakarta-Medan became a service route with the highest passenger number, while Jakarta-Surabaya has the second highest. Surabaya became the transit city which distributed and collected routes toward East Indonesia. From Surabaya, the movement is distributed onto Kalimantan regions, Sulawesi-Maluku-Papua, and Bali-Nusa Tenggara. The highest inter-
Proceedings of the Eastern Asia Society for Transportation Studies, Vol. 5, pp. 46 - 64, 2005
50
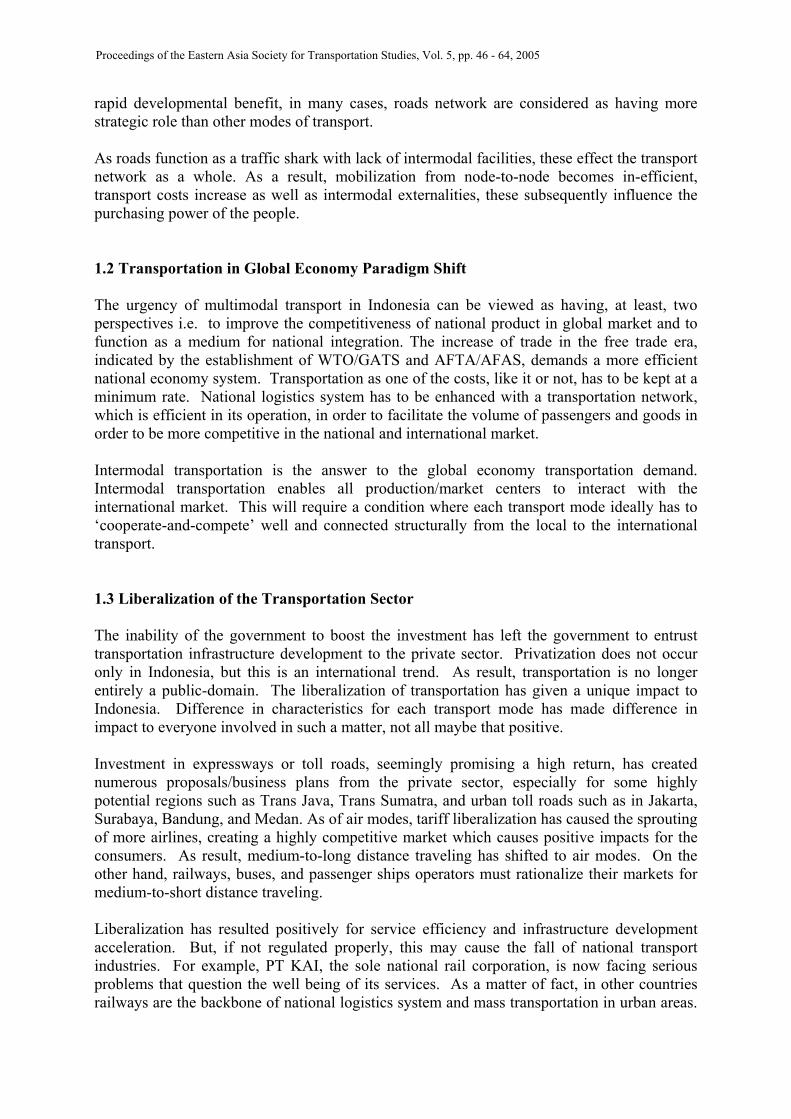
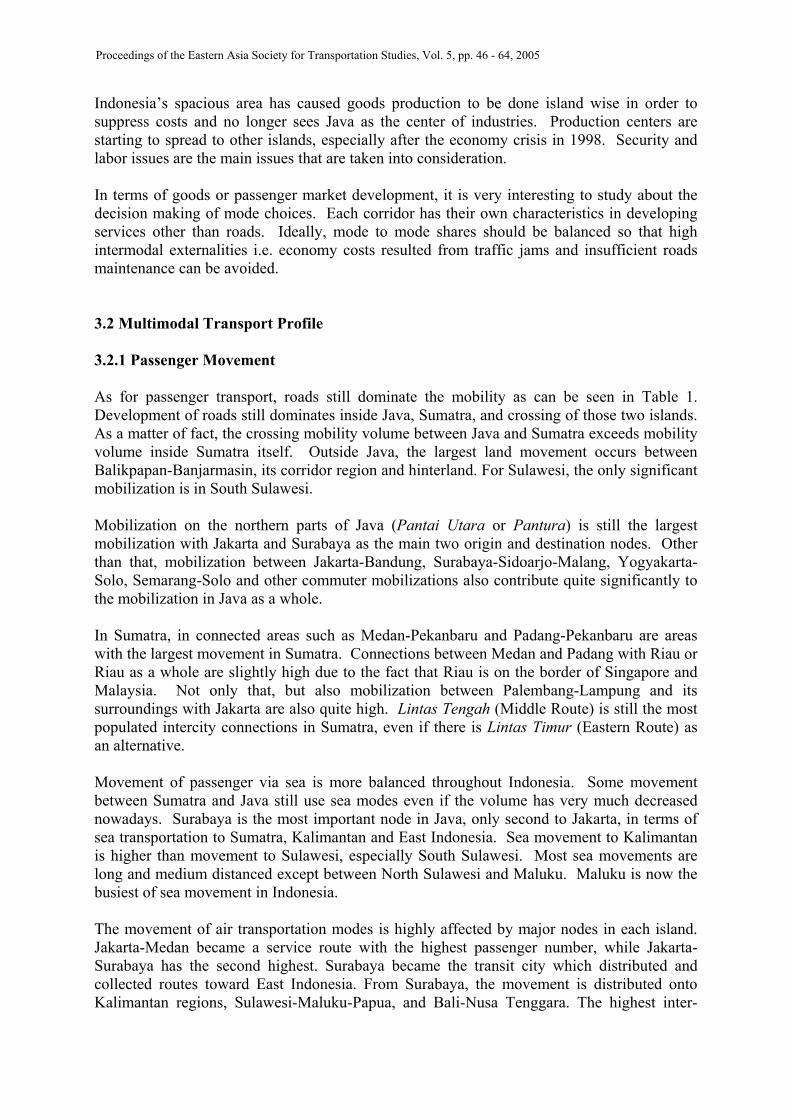
island movement outside Java-Sumatera is the movement from Surabaya-Balikpapan. Basically, air mode movements are long distance inter-island movements, but there are also some average distance and intra-island movements which contribute a pretty high. That is Jakarta-Yogyakarta and Surabaya-Bali, some average distanced routes with a high passengers number. 3.2.2 Goods Transportation The goods transportation is still dominated by road modes. In the road modes itself, most of the goods transportation services are still serving routes inside Java, Sumatera or between the two islands. The high economic growth of the two islands in comparison with other islands or regions causes highly concentrated goods movements in Java and Sumatera. International goods movements are highly dependent in sea modes. For national movement or inter-islands, sea modes only give a little share of transportation (7%). Figure 2 illustrates the distribution of sea transportation of goods from the point of loading and unloading. Loading activities are high in Kalimantan and Sumatera of which mostly go to Java (45.06% of unloading). For international movements, the transportations are still pointing to Java, while for overseas movements, every island already has its important nodes which specifically deliver the goods abroad.
Figure 2. In-Harbour Loading and Unloading of Goods Transportation (Source: BPS, 2002)
Based on the inter-port data, the inter-island movement of goods is in fact increasing. The movement between Surabaya-Balikpapan became the largest, followed by the movement between Surabaya-Jakarta. The inter-island goods transportation data shows that the movements are generally happening from west Indonesia towards East Indonesia, and vice-versa. Surabaya became an important node because the city is a distributor and collector of those movements. In comparison to Jakarta, Surabaya has the largest sea modes inter-island goods movement.
21,98% 39,84%
17,85% 39,92%
45,06% 15,90% 70,94% 7,45%
21,63% 35,68%
8,13% 48,94% 0,16%
3,05% 0,03%
0,74%
5,66% 6,01% 1,99%
2,22% 1,67% 0,71% 2,18% 2,27%
0% 20% 40% 60% 80%
100% 120%
Interisland unloading
Interisland loading
International unloading
International loading
%
Sumater J a w Bali & Nusa Kalimant Sulawei
Papua &
Proceedings of the Eastern Asia Society for Transportation Studies, Vol. 5, pp. 46 - 64, 2005
51
The inter-island goods movements by sea modes consisted of 3 kinds of goods, namely general cargo, container, and dry-bulk. General cargo still has the largest share in comparison with the other kind of goods, and general cargo services are prominent in every port (primary, secondary, and tertiary ports). Container transportations only serve the movements between primary ports such as Medan, Jakarta, Surabaya, and Makassar. However, there are some non-primary port which also serves container movements, such as Pontianak. In the other hand, dry bulk transportations are served mainly in Kalimantan’s ports, and distributed to Jakarta and Batam. This kind of service in Kalimantan is related to Kalimantan as a main production of coal. Air modes serve only a little share of goods transportation in comparison with sea and road modes. Only a little part of goods is served by this mode, such as fresh goods, express cargos, mails, and vulnerable goods. 3.3 Transportation Infrastructures 3.3.1 Road Transportation Infrastructures A. Roadways General condition of roads provisions in Indonesia is illustrated in Table 2. It is seen that the effect of Indonesian economic crisis is still happening until year 2002, where the quantity of damaged roads (unstable condition) is about 39.4% of total roads in Indonesia, including 15,739 km of National and Provincial roads and 113,215 km of District (Kabupaten)/City roads. Under the context of road and traffic development priorities, it is necessary to qualify which roadway is more important or prioritized to be handled. The strategic qualification of roadways is done based on these criteria: - Road Function: % of arterial roadways - Traffic: AADT (pcu/day) - Connectivity: % connected roads - Big cities connection: the number of National Activity Center (PKN), Regional Activity
Center (PKW), and Local Activity Center (PKL) connected.
Table 2. General Condition of Road Infrastructure in Indonesia Year 2002 Road condition Road status Length (km)
Good Average Lightly Damaged Heavily Damaged National roadway 26,886 64.3% 24.0% 6.9% 4.8% Provincial roadway 37,164 34.1% 32.1% 16.9% 16.9% Kabupaten roadway 240,946 19.0% 34.0% 28.5% 18.5% City roadway 25,518 9.0% 87.0% 4.0% 0.0% Total 330,495 23.6% 37.1% 23.6% 15.8%
Source: Directorate General of Regional Infrastructures, Department of Settlement and Regional Infrastructure, 2003 (2002) The total length of roads in Indonesia is about 33,242 km, wherein about 3,340 km of it (10.05%) is not yet connected. The highest proportion of unconnected routes is in Papua (41.25%), followed by Kalimantan (17.83%), and the Maluku (17.14%). In the other islands, unconnected routes are under 10%.
Proceedings of the Eastern Asia Society for Transportation Studies, Vol. 5, pp. 46 - 64, 2005
52
Table 3. National Strategic Roads Qualification Route Road function
(% of arterial) AADT
(pcu/day) Connectivity
% Number of PKN,
PKW, and PKL**) SUMATERA East Route *) 92.73 % 6,720 pcu/day 100 % 14 cities Central Route 66.87 % 5,459 pcu/ day 99.49 % 18 cities West Route 3.78 % 2,724 pcu/ day 89.00 % 12 cities JAWA North Route/ Pantura *) 95.73 % 15,051 pcu/day 100 % 29 cities Central Route 81.79 % 14,454 pcu/ day 100 % 17 cities South Route 54.65 % 5,661 pcu/ day 99.37 % 12 cities KALIMANTAN South Route*) 71.30 % 2,472 pcu/day 98.15 % 20 cities Central Route 11.58 % 1,393 pcu/ day 89.46 % 7 cities North Route 9.54 % 3,26 pcu/ day 44.35 % 2 cities SULAWESI West Route*) 46.27 % 4,543 pcu/ day 100 % 13 cities Central Route 100 % 4,804 pcu/ day 100 % 12 cities East Route 100 % 2,578 pcu/ day 100 % 4 cities BALI South Route*) 86.65 % 13,810 pcu/ day 86.65 % 3 cities North Route 64.57 % 3,826 pcu/ day 100 % 4 cities FLORES South Route*) 100 % 1,615 pcu/ day 100 % 4 cities North Route 57 % 66 pcu/ day 100 % 2 cities TIMOR North Route*) 100 % 4,671 pcu/ day 100 % 3 cities South Route 97.22 % 71 pcu/ day 97.22 % 1 cities PAPUA Borderline Route*) 100 % 619 pcu/ day 68.13 % 3 cities Central Route 29.04 % 689 pcu/ day 55.09 % 8 cities
Note: *) = the most strategic route in each island **) PKN: National Activity Center, PKW: Regional Activity Center, PKL: Local Activity Center
Source: Planning and International Cooperation Bureau, Department of Settlement and Regional Infrastructure, 2003 As it has shown in Table 3 above, the Java Pantura Route could have been the most strategic route with the highest number AADT and strategic cities connected. While if one look at it from the traffic aspect, it is shown that Java island has the highest volume, followed by Sumatera and Sulawesi. The traffic volume (AADT in pcu/day) shows the intensity of economic activities in the regions generally. In the context of the roads utilization for transportation, the existing roads fall into class II, IIIA, IIIB, and IIIC where class II has the maximum axle load 10 tons. The other 3 classes have the maximum axle load 8 tons. Table 4 shows the length of roads by each class and region in Indonesia.
Table 4. Road (km) Length by Each Class in Indonesia Road Class Province
II IIIA IIIB IIIC Total
Sumatera 459 7,534 9,709 17,704 Java 2,048 7,132 5,619 1,894 16,695 Sulawesi 2,695 6,392 9,089 Kalimantan 2,457 5,702 8,159 Bali+NT+Maluku+Papua 315 3,441 4,612 1,975 10,345 Indonesia 2,823 23,261 32,037 3,869 61,992
Source: Directorate of Land Transportation, Department of Communication (2003)
Proceedings of the Eastern Asia Society for Transportation Studies, Vol. 5, pp. 46 - 64, 2005
53
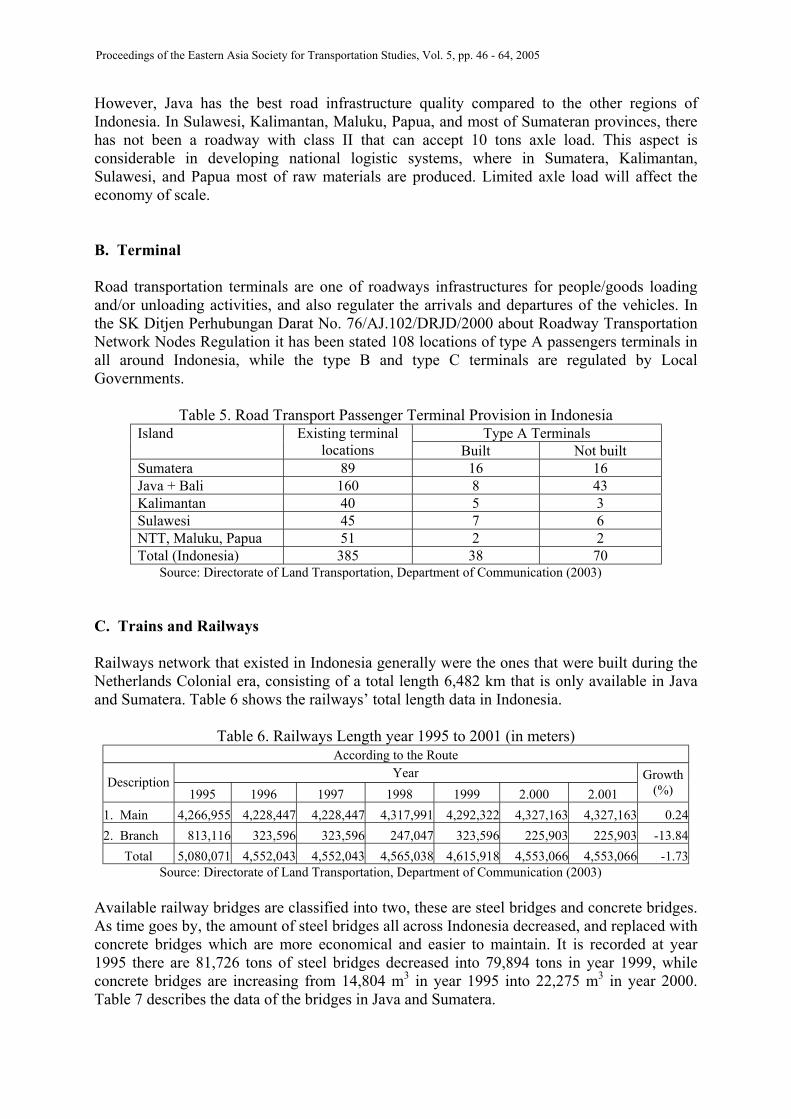
However, Java has the best road infrastructure quality compared to the other regions of Indonesia. In Sulawesi, Kalimantan, Maluku, Papua, and most of Sumateran provinces, there has not been a roadway with class II that can accept 10 tons axle load. This aspect is considerable in developing national logistic systems, where in Sumatera, Kalimantan, Sulawesi, and Papua most of raw materials are produced. Limited axle load will affect the economy of scale. B. Terminal Road transportation terminals are one of roadways infrastructures for people/goods loading and/or unloading activities, and also regulater the arrivals and departures of the vehicles. In the SK Ditjen Perhubungan Darat No. 76/AJ.102/DRJD/2000 about Roadway Transportation Network Nodes Regulation it has been stated 108 locations of type A passengers terminals in all around Indonesia, while the type B and type C terminals are regulated by Local Governments.
Table 5. Road Transport Passenger Terminal Provision in Indonesia Type A Terminals Island Existing terminal
locations Built Not built Sumatera 89 16 16 Java + Bali 160 8 43 Kalimantan 40 5 3 Sulawesi 45 7 6 NTT, Maluku, Papua 51 2 2 Total (Indonesia) 385 38 70
Source: Directorate of Land Transportation, Department of Communication (2003)
C. Trains and Railways Railways network that existed in Indonesia generally were the ones that were built during the Netherlands Colonial era, consisting of a total length 6,482 km that is only available in Java and Sumatera. Table 6 shows the railways’ total length data in Indonesia.
Table 6. Railways Length year 1995 to 2001 (in meters) According to the Route
Year Description
1995 1996 1997 1998 1999 2.000 2.001 Growth
(%)
1. Main 4,266,955 4,228,447 4,228,447 4,317,991 4,292,322 4,327,163 4,327,163 0.24 2. Branch 813,116 323,596 323,596 247,047 323,596 225,903 225,903 -13.84
Total 5,080,071 4,552,043 4,552,043 4,565,038 4,615,918 4,553,066 4,553,066 -1.73 Source: Directorate of Land Transportation, Department of Communication (2003) Available railway bridges are classified into two, these are steel bridges and concrete bridges. As time goes by, the amount of steel bridges all across Indonesia decreased, and replaced with concrete bridges which are more economical and easier to maintain. It is recorded at year 1995 there are 81,726 tons of steel bridges decreased into 79,894 tons in year 1999, while concrete bridges are increasing from 14,804 m3 in year 1995 into 22,275 m3 in year 2000. Table 7 describes the data of the bridges in Java and Sumatera.
Proceedings of the Eastern Asia Society for Transportation Studies, Vol. 5, pp. 46 - 64, 2005
54
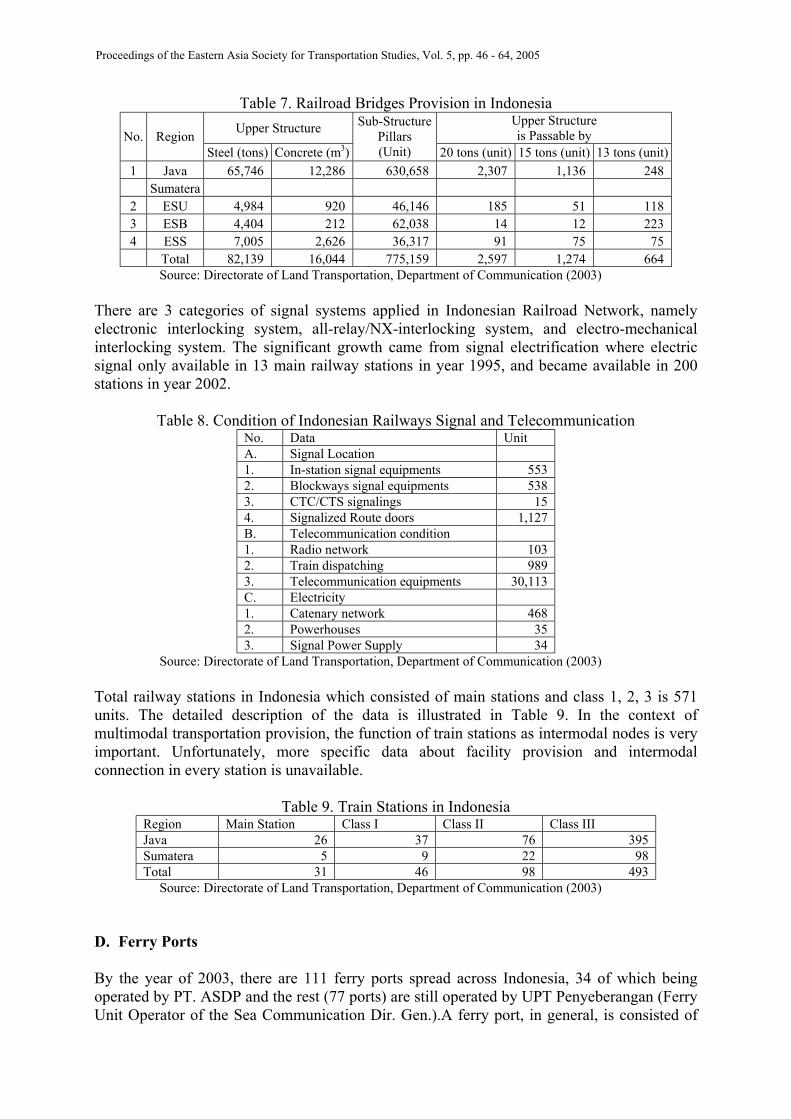
Table 7. Railroad Bridges Provision in Indonesia Upper Structure Upper Structure
is Passable by No. Region Steel (tons) Concrete (m3)
Sub-Structure Pillars (Unit) 20 tons (unit) 15 tons (unit) 13 tons (unit)
1 Java 65,746 12,286 630,658 2,307 1,136 248 Sumatera
2 ESU 4,984 920 46,146 185 51 118 3 ESB 4,404 212 62,038 14 12 223 4 ESS 7,005 2,626 36,317 91 75 75 Total 82,139 16,044 775,159 2,597 1,274 664
Source: Directorate of Land Transportation, Department of Communication (2003) There are 3 categories of signal systems applied in Indonesian Railroad Network, namely electronic interlocking system, all-relay/NX-interlocking system, and electro-mechanical interlocking system. The significant growth came from signal electrification where electric signal only available in 13 main railway stations in year 1995, and became available in 200 stations in year 2002.
Table 8. Condition of Indonesian Railways Signal and Telecommunication No. Data Unit A. Signal Location 1. In-station signal equipments 553 2. Blockways signal equipments 538 3. CTC/CTS signalings 15 4. Signalized Route doors 1,127 B. Telecommunication condition 1. Radio network 103 2. Train dispatching 989 3. Telecommunication equipments 30,113 C. Electricity 1. Catenary network 468 2. Powerhouses 35 3. Signal Power Supply 34
Source: Directorate of Land Transportation, Department of Communication (2003) Total railway stations in Indonesia which consisted of main stations and class 1, 2, 3 is 571 units. The detailed description of the data is illustrated in Table 9. In the context of multimodal transportation provision, the function of train stations as intermodal nodes is very important. Unfortunately, more specific data about facility provision and intermodal connection in every station is unavailable.
Table 9. Train Stations in Indonesia
Region Main Station Class I Class II Class III Java 26 37 76 395 Sumatera 5 9 22 98 Total 31 46 98 493
Source: Directorate of Land Transportation, Department of Communication (2003) D. Ferry Ports By the year of 2003, there are 111 ferry ports spread across Indonesia, 34 of which being operated by PT. ASDP and the rest (77 ports) are still operated by UPT Penyeberangan (Ferry Unit Operator of the Sea Communication Dir. Gen.).A ferry port, in general, is consisted of
Proceedings of the Eastern Asia Society for Transportation Studies, Vol. 5, pp. 46 - 64, 2005
55
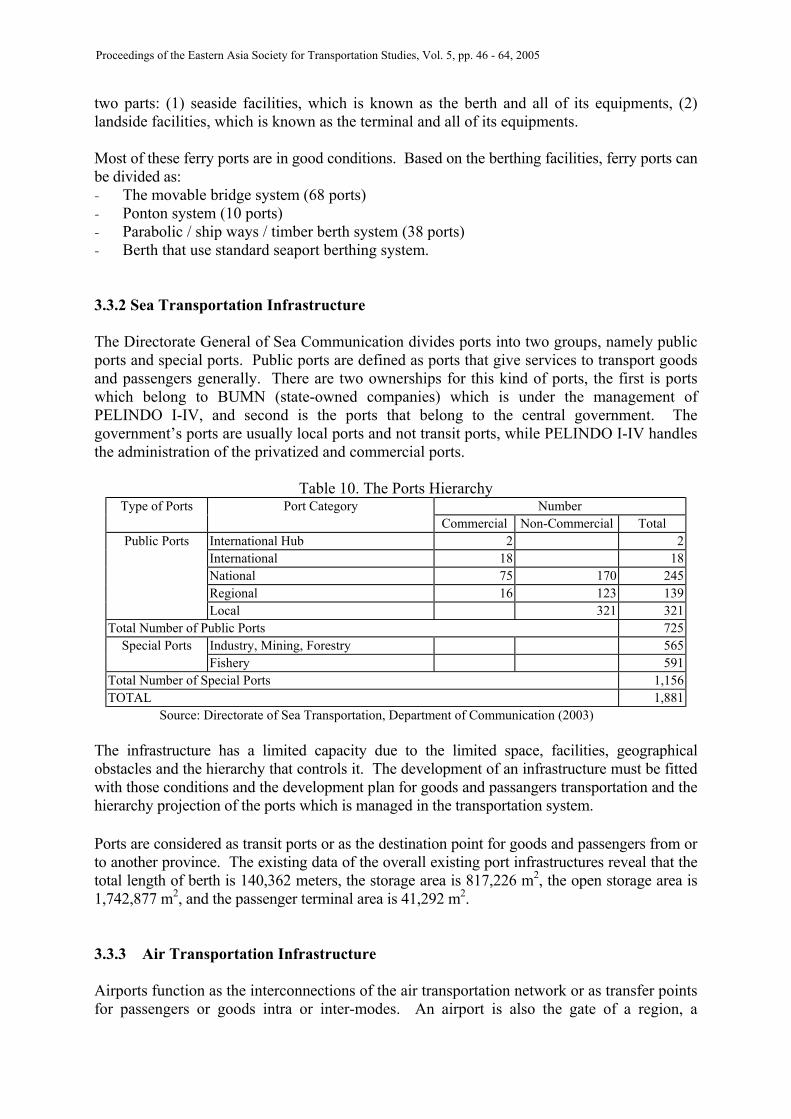
two parts: (1) seaside facilities, which is known as the berth and all of its equipments, (2) landside facilities, which is known as the terminal and all of its equipments. Most of these ferry ports are in good conditions. Based on the berthing facilities, ferry ports can be divided as: - The movable bridge system (68 ports) - Ponton system (10 ports) - Parabolic / ship ways / timber berth system (38 ports) - Berth that use standard seaport berthing system. 3.3.2 Sea Transportation Infrastructure The Directorate General of Sea Communication divides ports into two groups, namely public ports and special ports. Public ports are defined as ports that give services to transport goods and passengers generally. There are two ownerships for this kind of ports, the first is ports which belong to BUMN (state-owned companies) which is under the management of PELINDO I-IV, and second is the ports that belong to the central government. The government’s ports are usually local ports and not transit ports, while PELINDO I-IV handles the administration of the privatized and commercial ports.
Table 10. The Ports Hierarchy Number Type of Ports Port Category
Commercial Non-Commercial Total International Hub 2 2 International 18 18 National 75 170 245 Regional 16 123 139
Public Ports
Local 321 321 Total Number of Public Ports 725
Special Ports Industry, Mining, Forestry 565 Fishery 591
Total Number of Special Ports 1,156 TOTAL 1,881
Source: Directorate of Sea Transportation, Department of Communication (2003) The infrastructure has a limited capacity due to the limited space, facilities, geographical obstacles and the hierarchy that controls it. The development of an infrastructure must be fitted with those conditions and the development plan for goods and passangers transportation and the hierarchy projection of the ports which is managed in the transportation system. Ports are considered as transit ports or as the destination point for goods and passengers from or to another province. The existing data of the overall existing port infrastructures reveal that the total length of berth is 140,362 meters, the storage area is 817,226 m2, the open storage area is 1,742,877 m2, and the passenger terminal area is 41,292 m2. 3.3.3 Air Transportation Infrastructure Airports function as the interconnections of the air transportation network or as transfer points for passengers or goods intra or inter-modes. An airport is also the gate of a region, a
Proceedings of the Eastern Asia Society for Transportation Studies, Vol. 5, pp. 46 - 64, 2005
56
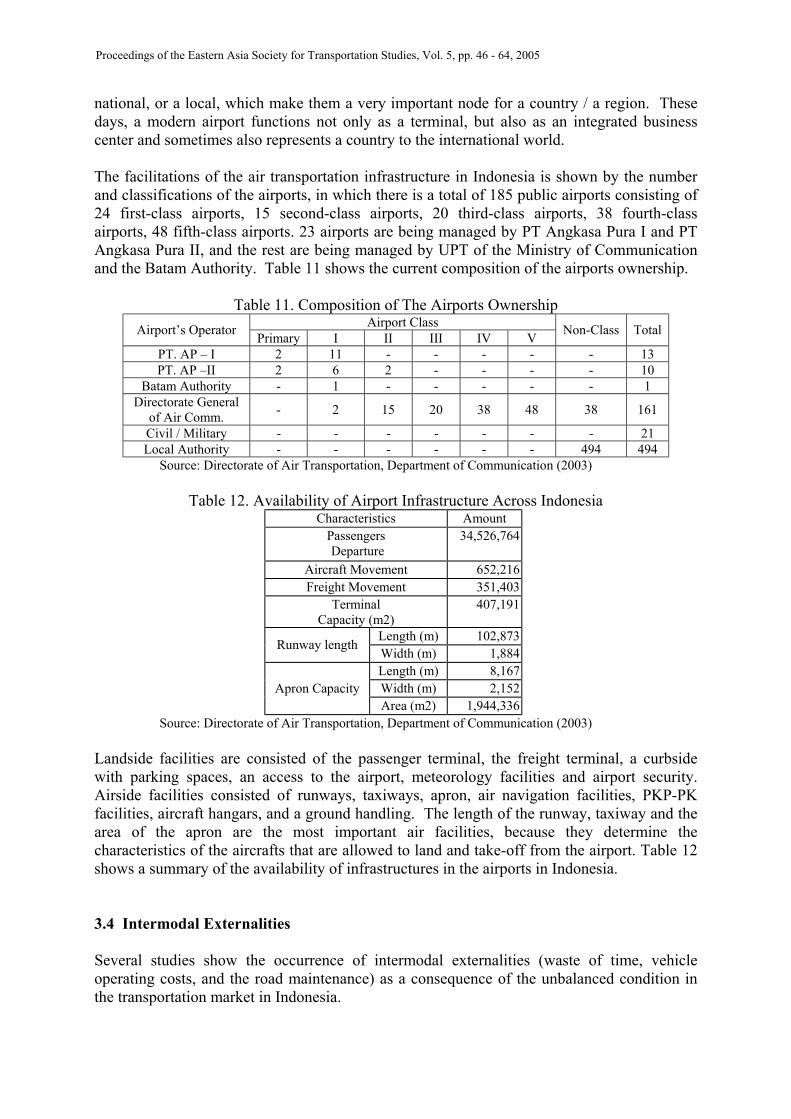
national, or a local, which make them a very important node for a country / a region. These days, a modern airport functions not only as a terminal, but also as an integrated business center and sometimes also represents a country to the international world. The facilitations of the air transportation infrastructure in Indonesia is shown by the number and classifications of the airports, in which there is a total of 185 public airports consisting of 24 first-class airports, 15 second-class airports, 20 third-class airports, 38 fourth-class airports, 48 fifth-class airports. 23 airports are being managed by PT Angkasa Pura I and PT Angkasa Pura II, and the rest are being managed by UPT of the Ministry of Communication and the Batam Authority. Table 11 shows the current composition of the airports ownership.
Table 11. Composition of The Airports Ownership Airport Class Airport’s Operator Primary I II III IV V Non-Class Total
PT. AP – I 2 11 - - - - - 13 PT. AP –II 2 6 2 - - - - 10
Batam Authority - 1 - - - - - 1 Directorate General
of Air Comm. - 2 15 20 38 48 38 161
Civil / Military - - - - - - - 21 Local Authority - - - - - - 494 494
Source: Directorate of Air Transportation, Department of Communication (2003)
Table 12. Availability of Airport Infrastructure Across Indonesia Characteristics Amount
Passengers Departure
34,526,764
Aircraft Movement 652,216 Freight Movement 351,403
Terminal Capacity (m2)
407,191
Length (m) 102,873 Runway length Width (m) 1,884 Length (m) 8,167 Width (m) 2,152 Apron Capacity Area (m2) 1,944,336
Source: Directorate of Air Transportation, Department of Communication (2003) Landside facilities are consisted of the passenger terminal, the freight terminal, a curbside with parking spaces, an access to the airport, meteorology facilities and airport security. Airside facilities consisted of runways, taxiways, apron, air navigation facilities, PKP-PK facilities, aircraft hangars, and a ground handling. The length of the runway, taxiway and the area of the apron are the most important air facilities, because they determine the characteristics of the aircrafts that are allowed to land and take-off from the airport. Table 12 shows a summary of the availability of infrastructures in the airports in Indonesia. 3.4 Intermodal Externalities Several studies show the occurrence of intermodal externalities (waste of time, vehicle operating costs, and the road maintenance) as a consequence of the unbalanced condition in the transportation market in Indonesia.
Proceedings of the Eastern Asia Society for Transportation Studies, Vol. 5, pp. 46 - 64, 2005
57
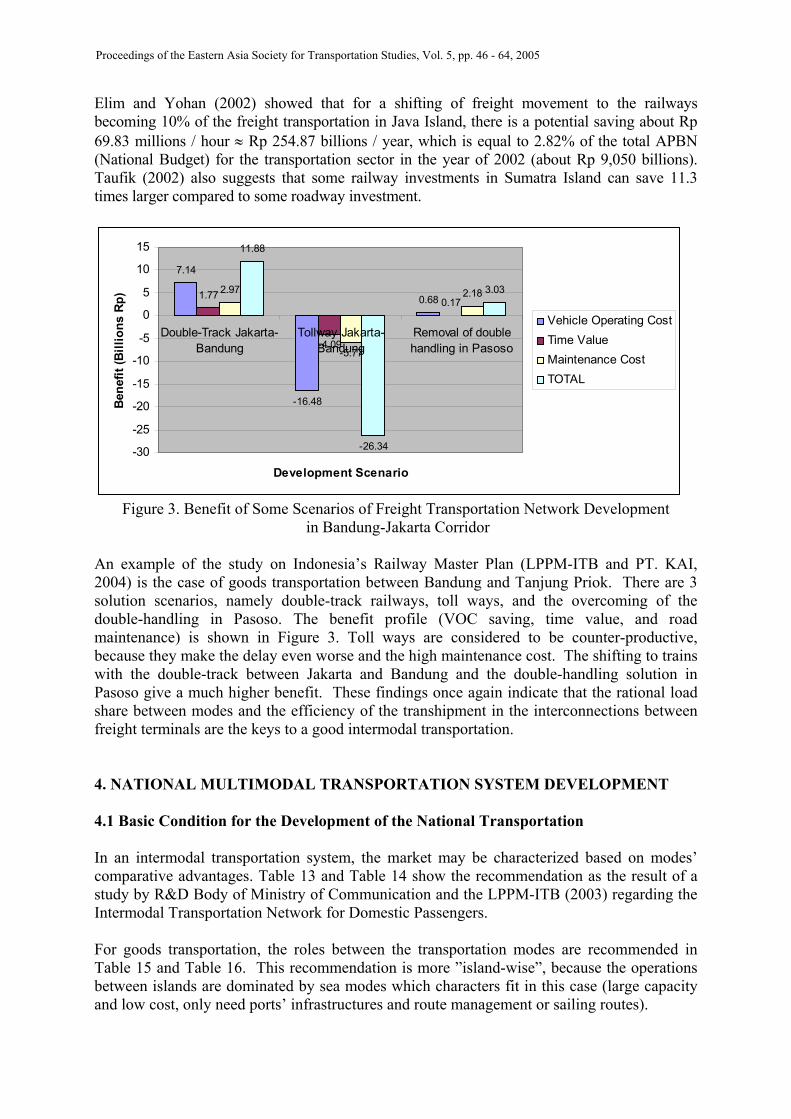
Elim and Yohan (2002) showed that for a shifting of freight movement to the railways becoming 10% of the freight transportation in Java Island, there is a potential saving about Rp 69.83 millions / hour ≈ Rp 254.87 billions / year, which is equal to 2.82% of the total APBN (National Budget) for the transportation sector in the year of 2002 (about Rp 9,050 billions). Taufik (2002) also suggests that some railway investments in Sumatra Island can save 11.3 times larger compared to some roadway investment.
7.14
-16.48
0.681.77
-4.09
0.172.97
-5.77
2.18
11.88
-26.34
3.03
-30
-25
-20
-15
-10
-5
0
5
10
15
Double-Track Jakarta-Bandung
Tollway Jakarta-Bandung
Removal of doublehandling in Pasoso
Development Scenario
Bene
fit (B
illio
ns R
p)
Vehicle Operating CostTime ValueMaintenance CostTOTAL
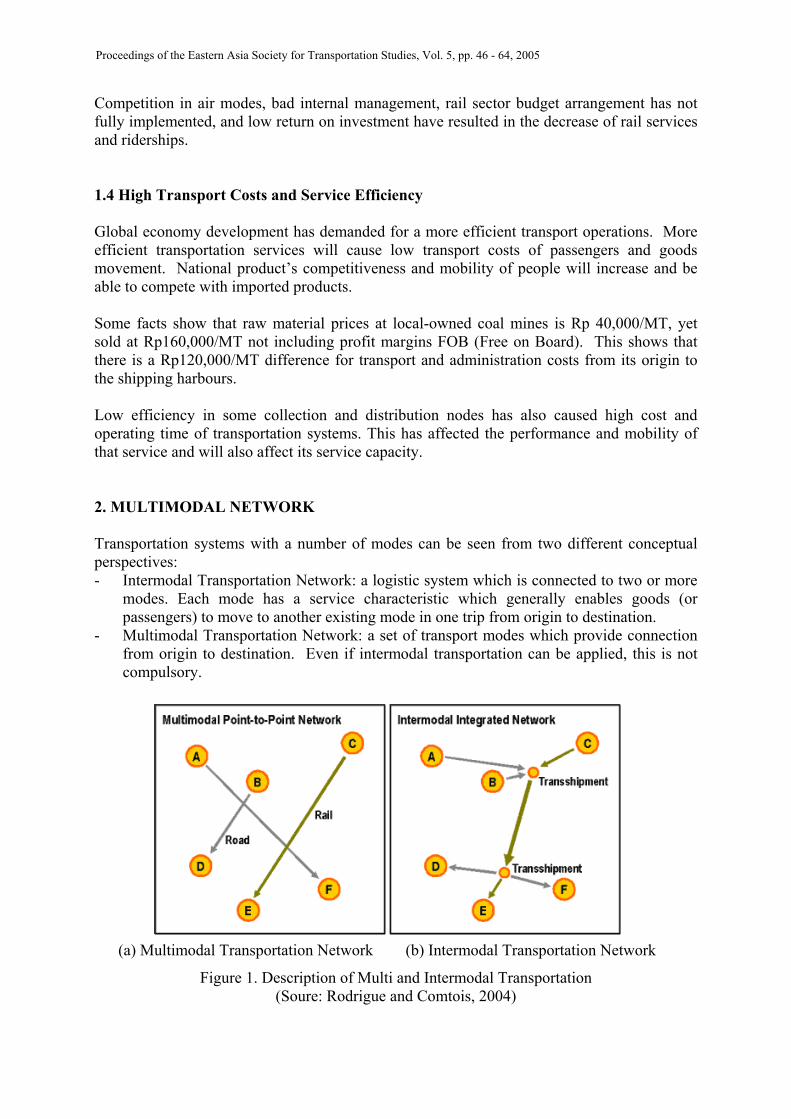
Figure 3. Benefit of Some Scenarios of Freight Transportation Network Development
in Bandung-Jakarta Corridor An example of the study on Indonesia’s Railway Master Plan (LPPM-ITB and PT. KAI, 2004) is the case of goods transportation between Bandung and Tanjung Priok. There are 3 solution scenarios, namely double-track railways, toll ways, and the overcoming of the double-handling in Pasoso. The benefit profile (VOC saving, time value, and road maintenance) is shown in Figure 3. Toll ways are considered to be counter-productive, because they make the delay even worse and the high maintenance cost. The shifting to trains with the double-track between Jakarta and Bandung and the double-handling solution in Pasoso give a much higher benefit. These findings once again indicate that the rational load share between modes and the efficiency of the transhipment in the interconnections between freight terminals are the keys to a good intermodal transportation. 4. NATIONAL MULTIMODAL TRANSPORTATION SYSTEM DEVELOPMENT 4.1 Basic Condition for the Development of the National Transportation In an intermodal transportation system, the market may be characterized based on modes’ comparative advantages. Table 13 and Table 14 show the recommendation as the result of a study by R&D Body of Ministry of Communication and the LPPM-ITB (2003) regarding the Intermodal Transportation Network for Domestic Passengers. For goods transportation, the roles between the transportation modes are recommended in Table 15 and Table 16. This recommendation is more ”island-wise”, because the operations between islands are dominated by sea modes which characters fit in this case (large capacity and low cost, only need ports’ infrastructures and route management or sailing routes).
Proceedings of the Eastern Asia Society for Transportation Studies, Vol. 5, pp. 46 - 64, 2005
58
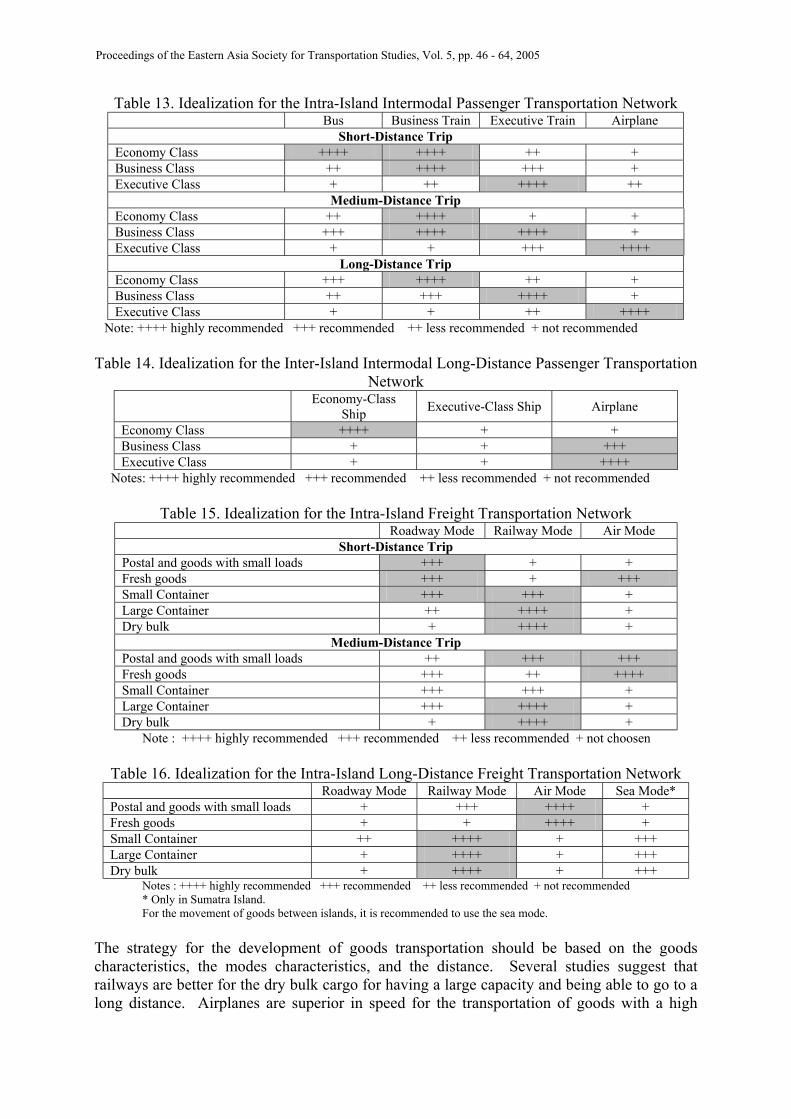
Table 13. Idealization for the Intra-Island Intermodal Passenger Transportation Network Bus Business Train Executive Train Airplane
Short-Distance Trip Economy Class ++++ ++++ ++ + Business Class ++ ++++ +++ + Executive Class + ++ ++++ ++
Medium-Distance Trip Economy Class ++ ++++ + + Business Class +++ ++++ ++++ + Executive Class + + +++ ++++
Long-Distance Trip Economy Class +++ ++++ ++ + Business Class ++ +++ ++++ + Executive Class + + ++ ++++
Note: ++++ highly recommended +++ recommended ++ less recommended + not recommended
Table 14. Idealization for the Inter-Island Intermodal Long-Distance Passenger Transportation Network
Economy-Class Ship Executive-Class Ship Airplane
Economy Class ++++ + + Business Class + + +++ Executive Class + + ++++
Notes: ++++ highly recommended +++ recommended ++ less recommended + not recommended
Table 15. Idealization for the Intra-Island Freight Transportation Network Roadway Mode Railway Mode Air Mode
Short-Distance Trip Postal and goods with small loads +++ + + Fresh goods +++ + +++ Small Container +++ +++ + Large Container ++ ++++ + Dry bulk + ++++ +
Medium-Distance Trip Postal and goods with small loads ++ +++ +++ Fresh goods +++ ++ ++++ Small Container +++ +++ + Large Container +++ ++++ + Dry bulk + ++++ +
Note : ++++ highly recommended +++ recommended ++ less recommended + not choosen
Table 16. Idealization for the Intra-Island Long-Distance Freight Transportation Network Roadway Mode Railway Mode Air Mode Sea Mode* Postal and goods with small loads + +++ ++++ + Fresh goods + + ++++ + Small Container ++ ++++ + +++ Large Container + ++++ + +++ Dry bulk + ++++ + +++
Notes : ++++ highly recommended +++ recommended ++ less recommended + not recommended * Only in Sumatra Island. For the movement of goods between islands, it is recommended to use the sea mode.
The strategy for the development of goods transportation should be based on the goods characteristics, the modes characteristics, and the distance. Several studies suggest that railways are better for the dry bulk cargo for having a large capacity and being able to go to a long distance. Airplanes are superior in speed for the transportation of goods with a high
Proceedings of the Eastern Asia Society for Transportation Studies, Vol. 5, pp. 46 - 64, 2005
59
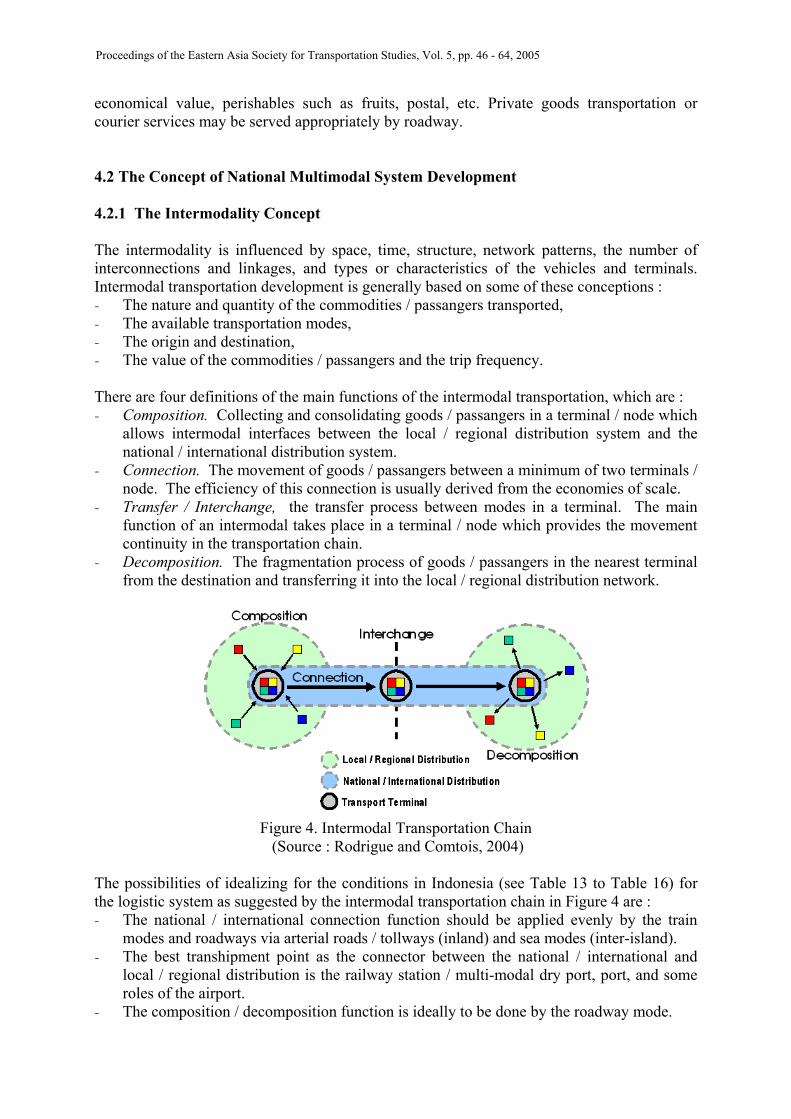
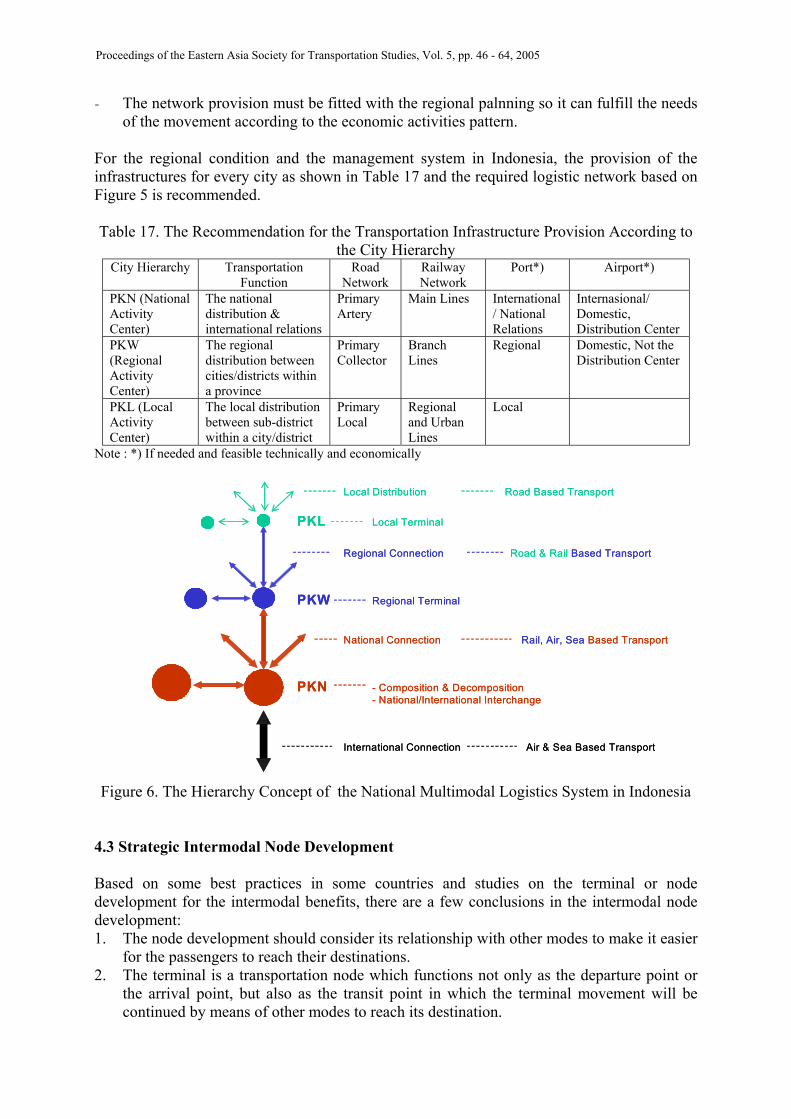
economical value, perishables such as fruits, postal, etc. Private goods transportation or courier services may be served appropriately by roadway. 4.2 The Concept of National Multimodal System Development 4.2.1 The Intermodality Concept The intermodality is influenced by space, time, structure, network patterns, the number of interconnections and linkages, and types or characteristics of the vehicles and terminals. Intermodal transportation development is generally based on some of these conceptions : - The nature and quantity of the commodities / passangers transported, - The available transportation modes, - The origin and destination, - The value of the commodities / passangers and the trip frequency. There are four definitions of the main functions of the intermodal transportation, which are : - Composition. Collecting and consolidating goods / passangers in a terminal / node which
allows intermodal interfaces between the local / regional distribution system and the national / international distribution system.
- Connection. The movement of goods / passangers between a minimum of two terminals / node. The efficiency of this connection is usually derived from the economies of scale.
- Transfer / Interchange, the transfer process between modes in a terminal. The main function of an intermodal takes place in a terminal / node which provides the movement continuity in the transportation chain.
- Decomposition. The fragmentation process of goods / passangers in the nearest terminal from the destination and transferring it into the local / regional distribution network.
Figure 4. Intermodal Transportation Chain (Source : Rodrigue and Comtois, 2004)
The possibilities of idealizing for the conditions in Indonesia (see Table 13 to Table 16) for the logistic system as suggested by the intermodal transportation chain in Figure 4 are : - The national / international connection function should be applied evenly by the train
modes and roadways via arterial roads / tollways (inland) and sea modes (inter-island). - The best transhipment point as the connector between the national / international and
local / regional distribution is the railway station / multi-modal dry port, port, and some roles of the airport.
- The composition / decomposition function is ideally to be done by the roadway mode.
Proceedings of the Eastern Asia Society for Transportation Studies, Vol. 5, pp. 46 - 64, 2005
60
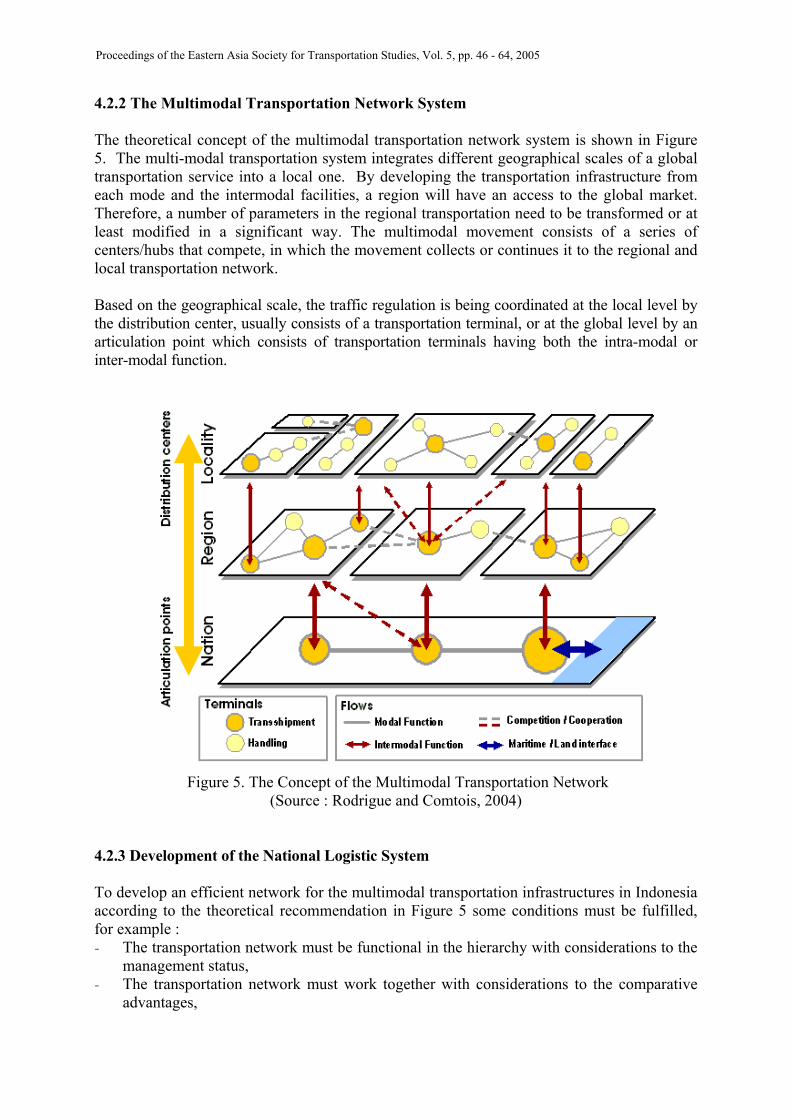
4.2.2 The Multimodal Transportation Network System The theoretical concept of the multimodal transportation network system is shown in Figure 5. The multi-modal transportation system integrates different geographical scales of a global transportation service into a local one. By developing the transportation infrastructure from each mode and the intermodal facilities, a region will have an access to the global market. Therefore, a number of parameters in the regional transportation need to be transformed or at least modified in a significant way. The multimodal movement consists of a series of centers/hubs that compete, in which the movement collects or continues it to the regional and local transportation network. Based on the geographical scale, the traffic regulation is being coordinated at the local level by the distribution center, usually consists of a transportation terminal, or at the global level by an articulation point which consists of transportation terminals having both the intra-modal or inter-modal function.
Figure 5. The Concept of the Multimodal Transportation Network (Source : Rodrigue and Comtois, 2004)
4.2.3 Development of the National Logistic System To develop an efficient network for the multimodal transportation infrastructures in Indonesia according to the theoretical recommendation in Figure 5 some conditions must be fulfilled, for example : - The transportation network must be functional in the hierarchy with considerations to the
management status, - The transportation network must work together with considerations to the comparative
advantages,
Proceedings of the Eastern Asia Society for Transportation Studies, Vol. 5, pp. 46 - 64, 2005
61


![Monitoria multimodal cerebral multimodal monitoring[2]](https://static.fdocuments.in/doc/165x107/552957004a79599a158b46fd/monitoria-multimodal-cerebral-multimodal-monitoring2.jpg)


