Behavioral paradigm development for fMRI and EEG Jason Zevin Sackler Institute
Multimodal EEG/fMRI
Imaging for
Neuroscientists
Giorgio Bonmassar, Ph.D.
Cognitive 2015
Nice, March 2015
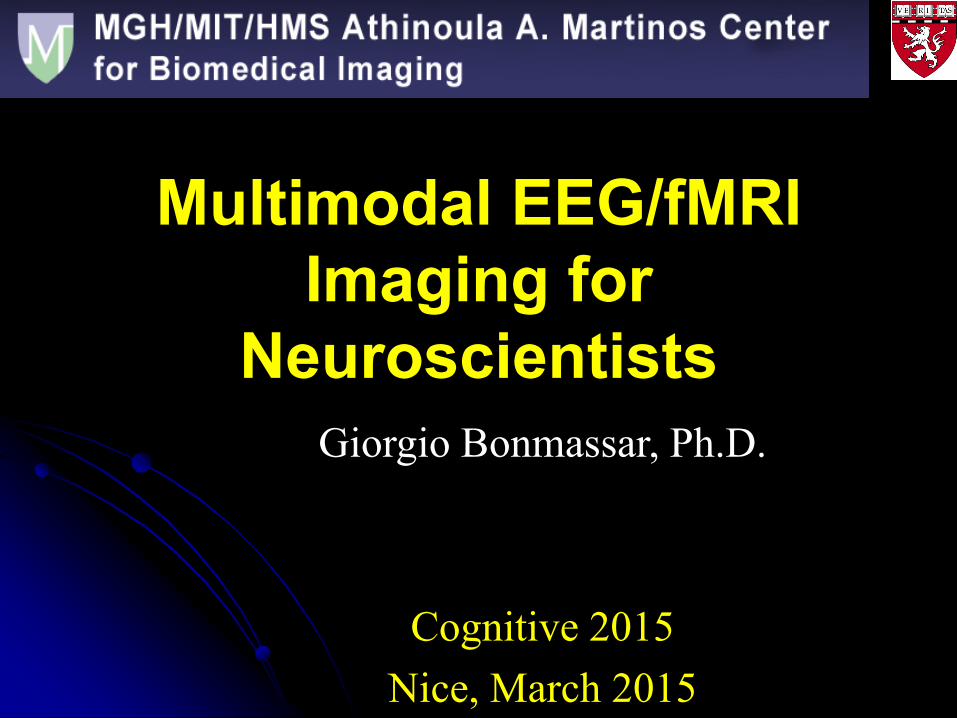
Non-invasive Brain Functional
Imaging Methods
Method Physical Principle
Positron Emission Tomography
(PET)
Emission/Detection of
Positrons
Single-Photon Emission
Computed Tomography
(SPECT)
Emission/Detection of Gamma
Rays
Magnetic Resonance Imaging
(MRI)
Nuclear Magnetic Resonance
(NMR)
Electroencephalography (EEG) Electrical Potentials
Magnetoencephalography
(MEG)Magnetic Fields
Electrical Impedance
Tomography (EIT)
Changes in Tissue Complex
Dielectric Constant
Optical Imaging (NIRS) Light Absorption/Scattering
Transcranial Doppler
Sonography (TCD)Ultrasound Doppler Effect
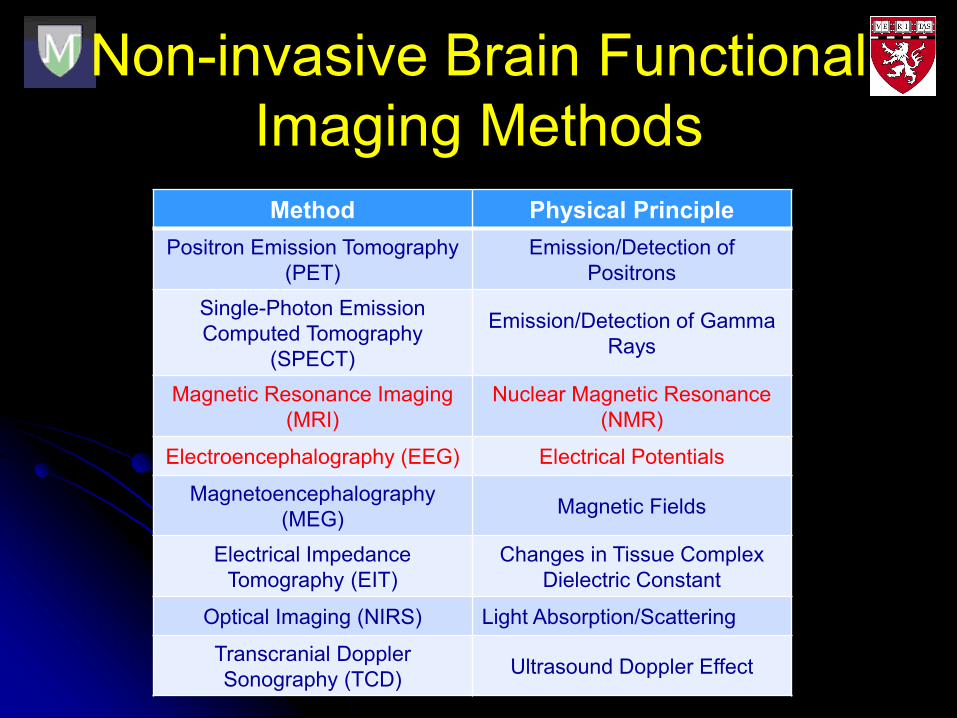
Space Vs. Time
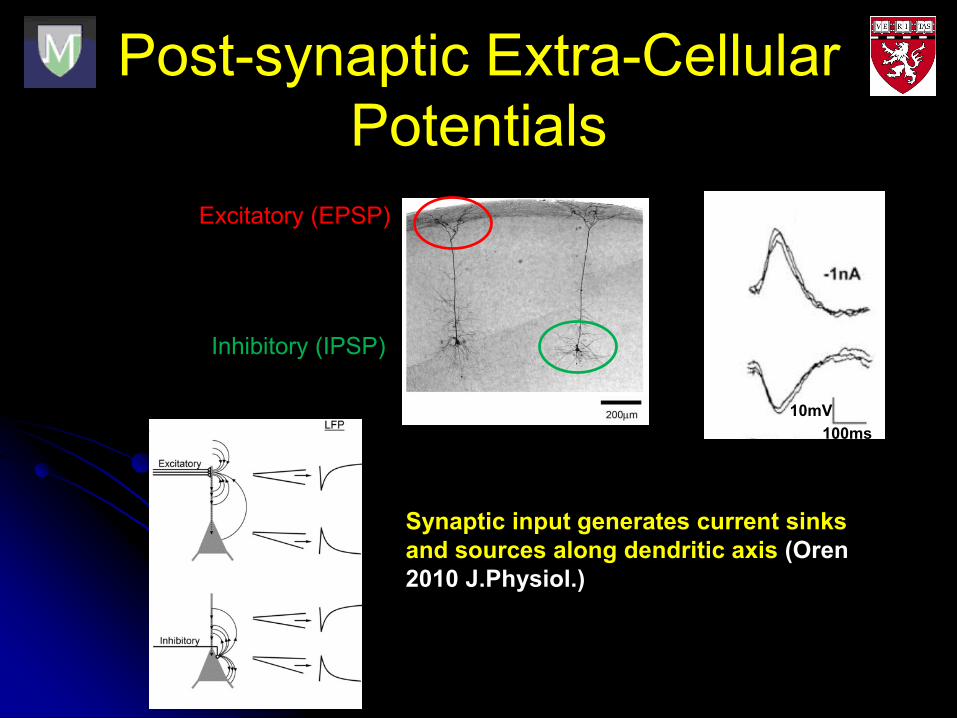
Post-synaptic Extra-Cellular
Potentials
Excitatory (EPSP)
Inhibitory (IPSP)
100ms
10mV
Synaptic input generates current sinks
and sources along dendritic axis (Oren
2010 J.Physiol.)
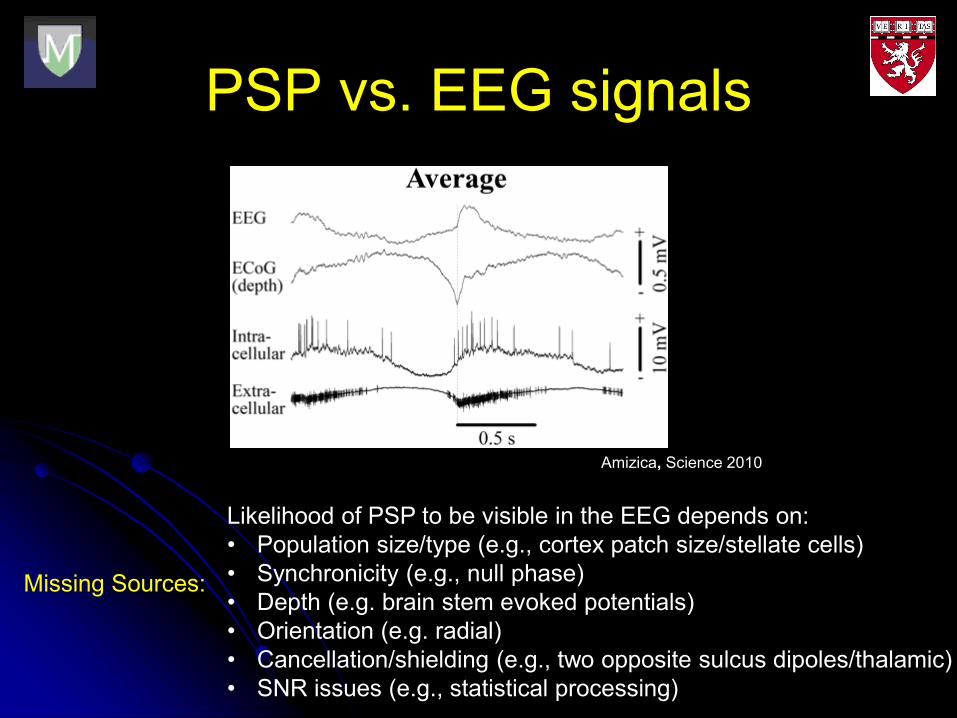
PSP vs. EEG signals
Amizica, Science 2010
Likelihood of PSP to be visible in the EEG depends on:
• Population size/type (e.g., cortex patch size/stellate cells)
• Synchronicity (e.g., null phase)
• Depth (e.g. brain stem evoked potentials)
• Orientation (e.g. radial)
• Cancellation/shielding (e.g., two opposite sulcus dipoles/thalamic)
• SNR issues (e.g., statistical processing)
Missing Sources:

PSP vs. fMRI signals
Pan, Neuroimage 2013
Likelihood of EPSP to be visible in the fMRI depends on:
• SNR issues (e.g., statistical processing)
• Presence of artifacts (e.g., temporal areas)
• Paradigm/Sequence (e.g. auditory studies)
• Random events in time (e.g., epileptic interictal spikes)
• BOLD washout/CO2 (e.g., hypercpania)
• Small modification of cortical metabolic consumption
Missing Sources:
What are the advantages of
EEG/fMRI?
High spatial (MRI – mm and sub mm resolution) and temporal (EEG - ms resolution).
Better chances to capture intrinsic brain states using multimodality (missing sources).
Allow to study brain network connections by combining sophisticated electrical source imaging and causal dynamic analysis.
Allow for studying BOLD synchronized neuronal firing, such as high frequency gamma oscillations.

Why Concurrent EEG/fMRI?
Clinical Epilepsy.
Intraoperative imaging (e.g., BIS).
Neurophysiology Sleep fMRI Studies (e.g., NREM studies)
Anesthesia and other drug research (e.g., Halothane’s sites of action)
Neuro vascular coupling between hemodynamic and electrodynamic .
Data Fusion: high temporal resolution of EEG with high spatial resolution of fMRI

Concurrent ERP/fMRI vs.
recording separately Identical sensory stimulation, neurophysiologic
events, subjective and behavioral experience (replicating the setup inside/outside the MRI can be very challenging).
Long-term priming or learning (e.g., direction of motion – any limited number of novel stimuli).
Monitoring ERPs as a prior for fMRI statistical analysis (e.g., VEPs and during migraine attack).
Scanner noise (EPI) or MRI environment can influence the timing and amplitude of ERPs (auditory and auditory/visual).
Advantages of Ultra High MRI
High-spatial resolution and high signal-to-noise ratio (SNR) BOLD signal (Gati et al. 1997; Van derZwaag et al. 2009; Yacoub et al. 2001)
Magnetic Resonance Spectroscopy (MRS):
1. energy metabolism like glucose and creatine.
2. neurotransmitters like glutamate and gamma-
aminobutyric acid (GABA).
3. compounds involved in cell growth like choline or in axon
growth like N-acetylaspartate.
4. compounds involved in osmoregulation like taurine and
inositol.
5. molecules that are antioxidants, like glutathione and
vitamin C.

Outline
1. Devices & MRI Safety No additional risks to the subjects
No effect on the quality of the diagnostic information
2. fMRI Image quality
3. EEG Signal Quality
Kalman filtering
4. Experimental Data
5. Electrocorticogram (ECoG)

1. SAR Recommendations The United States Food and Drug
Administration (USFDA) limits the exposure to RF energy SAR < 3.2 W/kg (Head)
Any pulse sequence must not raise the temperature by more than 1 Celsius
2
2ESAR c

Human Head Models for EM forward solution
Human Head Model Anatomically accurate with 44-tissues, 1x1x1 mm3 resolution (Makris et al., MBEC 2009)
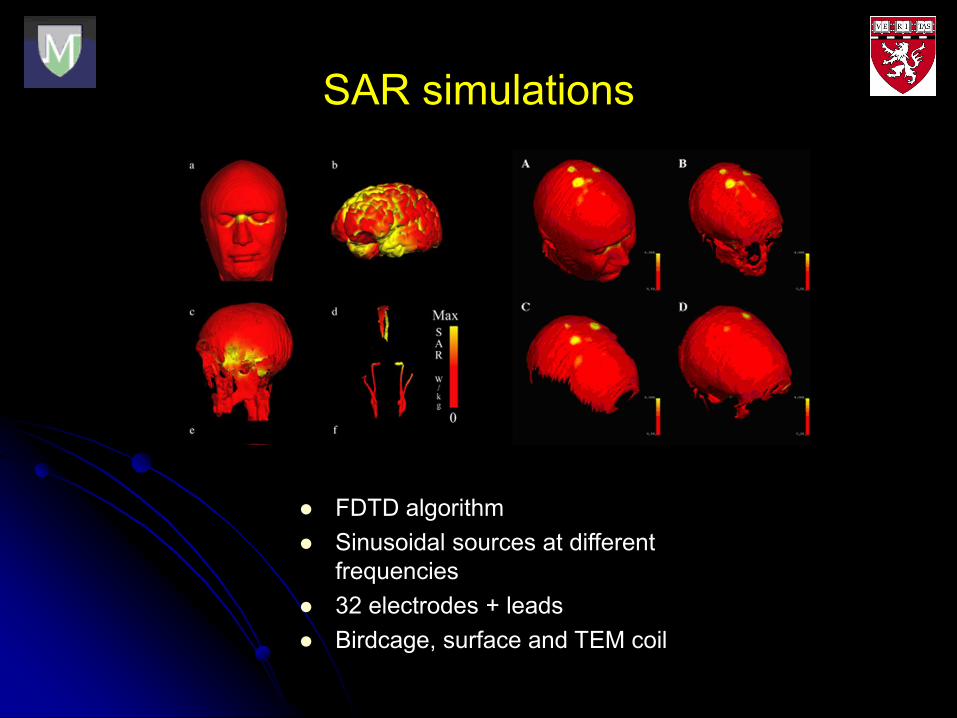
SAR simulations
FDTD algorithm
Sinusoidal sources at different
frequencies
32 electrodes + leads
Birdcage, surface and TEM coil

Dielectric Resonance
A B CD
A B CD
The SAR % Change
with/without
EEG electrodes (Birdcage)
1.5T 3T 6T
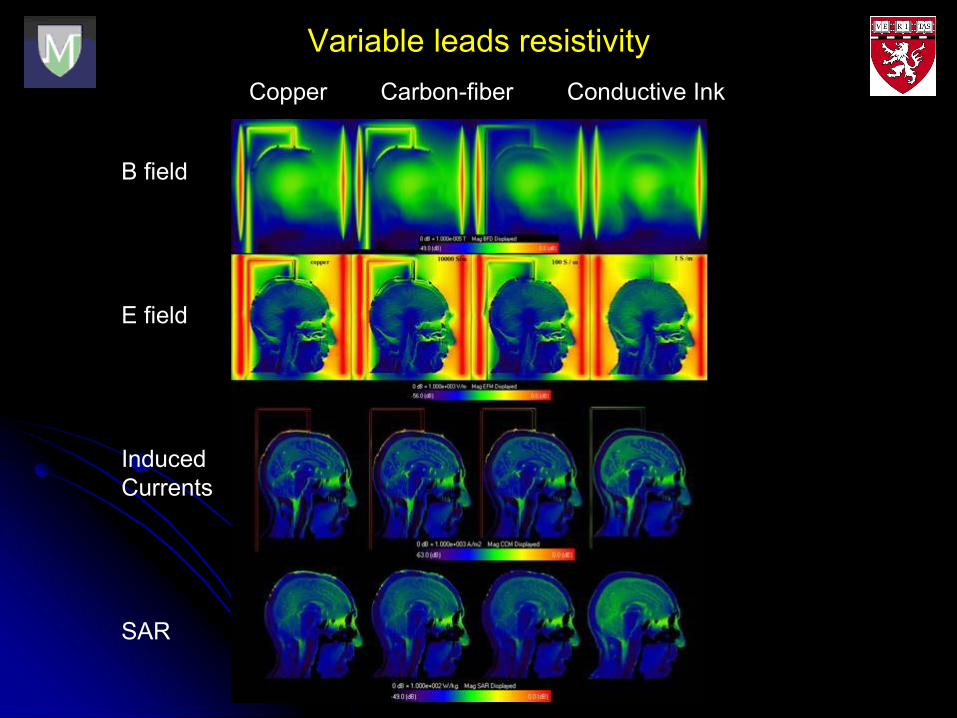
Variable leads resistivity
Copper Carbon-fiber Conductive Ink
B field
E field
Induced
Currents
SAR
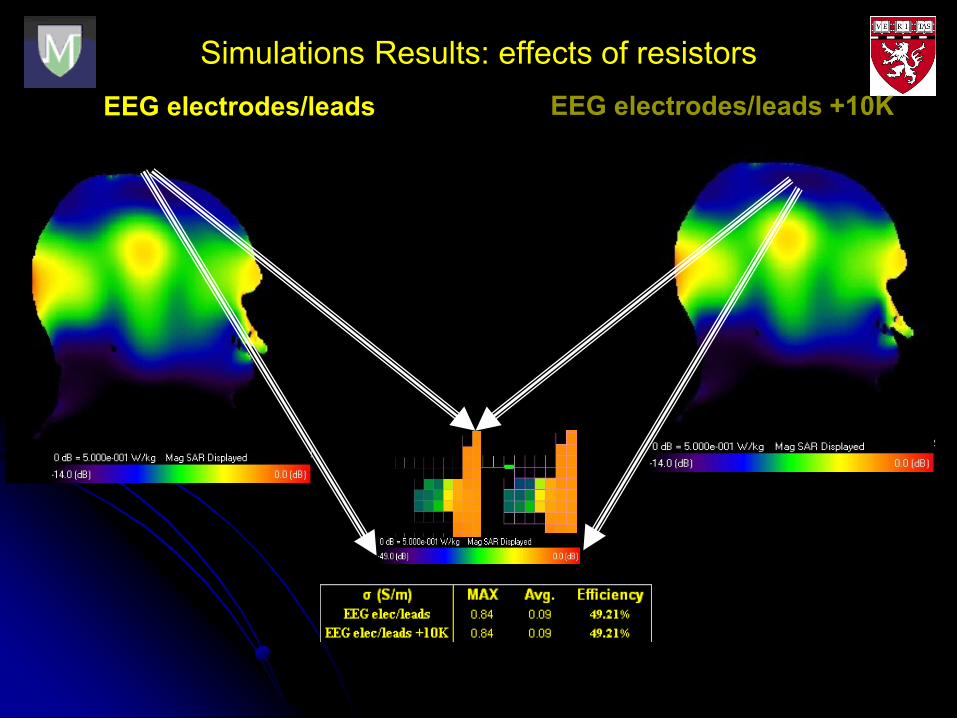
Simulations Results: effects of resistors
EEG electrodes/leads +10KEEG electrodes/leads

Temperature Measurements at 7T
Luxtron 3100 Fluoroptic Thermometer
device with 4 MRI compatible probes (0.5 oC resolution)
7T whole body system retrofitted with a
Siemens Sonata console
High power TSE sequences
C.HE.M.A: Conductive HEad Mannequin
Anthropomorphic Phantom
Anatomically accurate with head model
Composition: 4.5lt. water, 135gr. agarose,
40.5gr NaCl

The “InkNet”
32 flexible circuit boards
256 electrodes + REF + GND
Cup electrode design
PTF traces for RF transparency
electrode
AgCl
lead
slitsubstrate

No Electrodes vs. InkNet vs. Standard Net
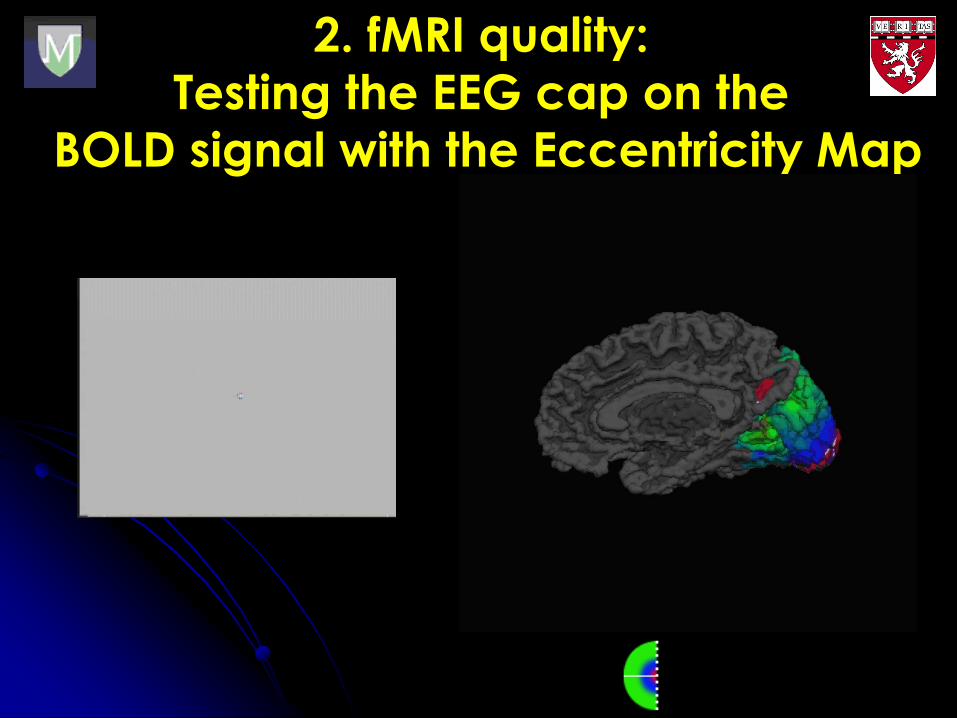
2. fMRI quality:
Testing the EEG cap on the
BOLD signal with the Eccentricity Map

Visual Field Eccentricity
Mapping on Cortex
Sereno et al., 1995

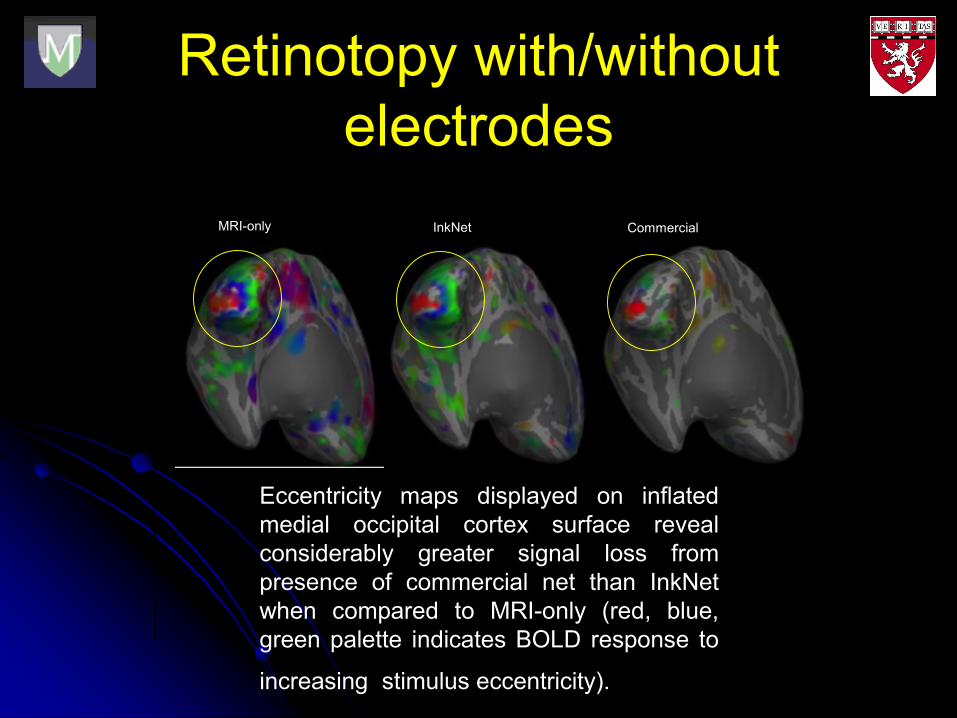
Retinotopy with/without
electrodes
Retinotopy with/without
electrodes
MRI-only InkNet Commercial
Eccentricity maps displayed on inflated
medial occipital cortex surface reveal
considerably greater signal loss from
presence of commercial net than InkNet
when compared to MRI-only (red, blue,
green palette indicates BOLD response to
increasing stimulus eccentricity).

3. Noise induced on the EEG
recordings
Static Magnetic Field:
Physiological noise (heart, breathing,
muscular, etc.)
Room vibration noise (helium pump, sounds,
etc.)
Switching Magnetic Gradient Field
RF interference

Bv
e = N —
t
Faraday’s induced noise:
Motion of the EEG electrodes and leads generates
noise
Physiological Motion is Primary Noise Source
heart beat (ballistocardiogram), breathing, subject
motion
Faraday’s Induced Noise
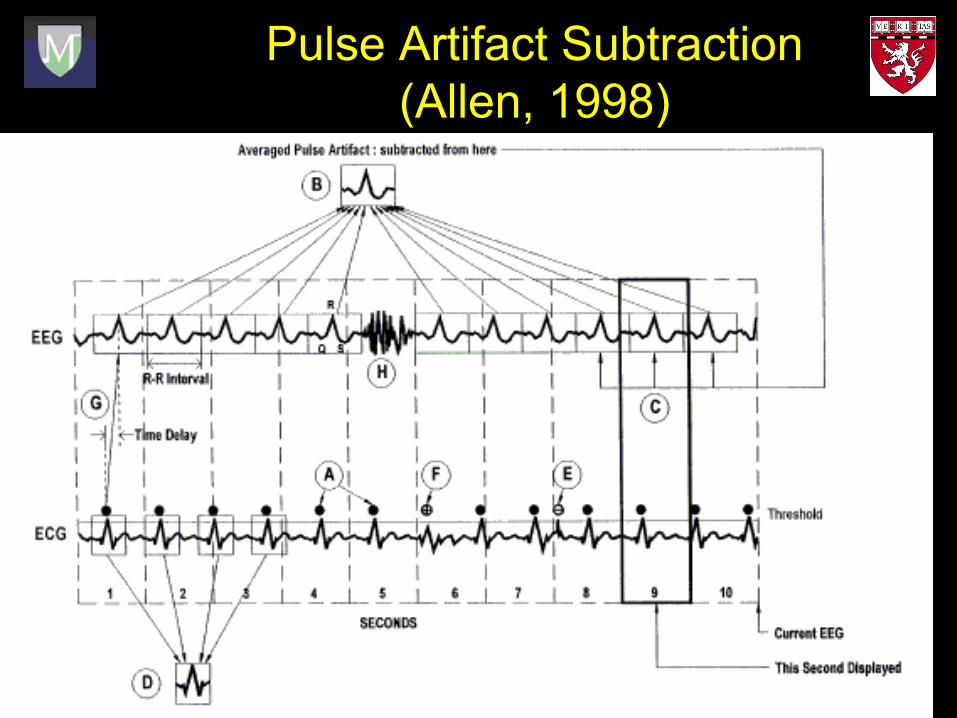
Pulse Artifact Subtraction
(Allen, 1998)

Other Noise Cancellation
Techniques
Synchronization of the EEG sampling with gradient
switching (Goldman et al., 2000; Anami et al., 2003;
Mandelkow et al).
ICA cancellation methods (Mantini et al., 2007)
Optimal basis set (Niazy et al., 2005)
Frequency based methods (Zakharov et al., 2007)
Adaptive filtering methods (Sijbers et al., 1999 and
Wan et al., 2006)

Software solution: Adaptive
Noise Cancellation
Use a motion sensor signal to remove noise
Exogenous reference signal uncorrelated with
underlying EEG signal
Time-varying algorithm
e.g., track changes in changes in impedance,
electrode position, etc.
Implementable in real-time
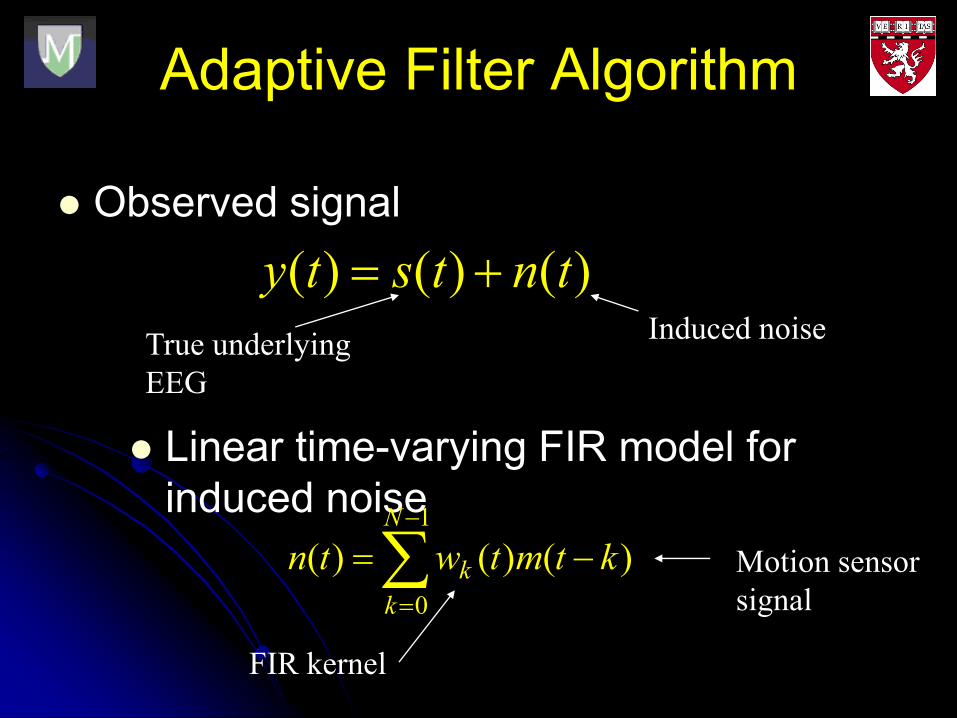
Adaptive Filter Algorithm
Linear time-varying FIR model for
induced noise
)()()( tntsty Induced noise
True underlying
EEG
Observed signal
Motion sensor
signal
1
0
)()()(
N
k
k ktmtwtn
FIR kernel

Adaptive Filtering Algorithm
Estimate filter taps wh(t) recursively using Kalman filter algorithm
Remove estimated noise signal, yielding
clean EEG
1
0
)()(ˆ)()()(ˆ)1(ˆN
k
khhh ktmtwtytktwtw
1
0
)()(ˆ)()(ˆN
k
k ktmtwtyts

Piezoelectric Motion Sensor
Adaptive ballistocardiogram noise
filtering (Bonmassar et al., NeuroImage 16,
1127–1141, 2002)
Position: Temporal Artery
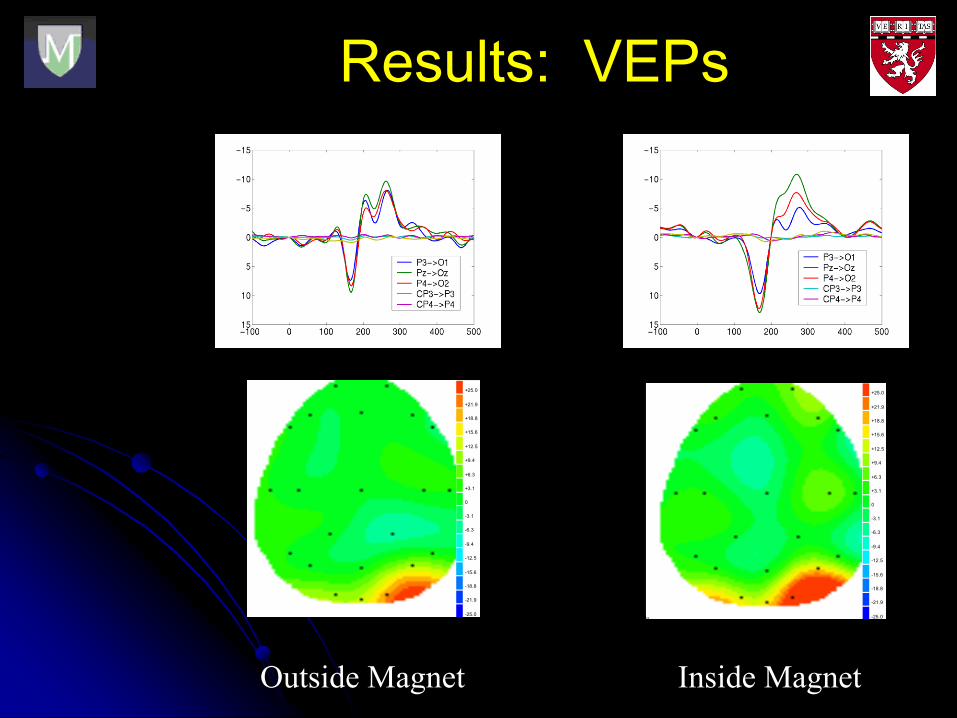
Results: VEPs
168.00 ms
+25.0
+21.9
+18.8
+15.6
+12.5
+9.4
+6.3
+3.1
0
-3.1
-6.3
-9.4
-12.5
-15.6
-18.8
-21.9
-25.0168.00 ms
+25.0
+21.9
+18.8
+15.6
+12.5
+9.4
+6.3
+3.1
0
-3.1
-6.3
-9.4
-12.5
-15.6
-18.8
-21.9
-25.0
Outside Magnet Inside Magnet
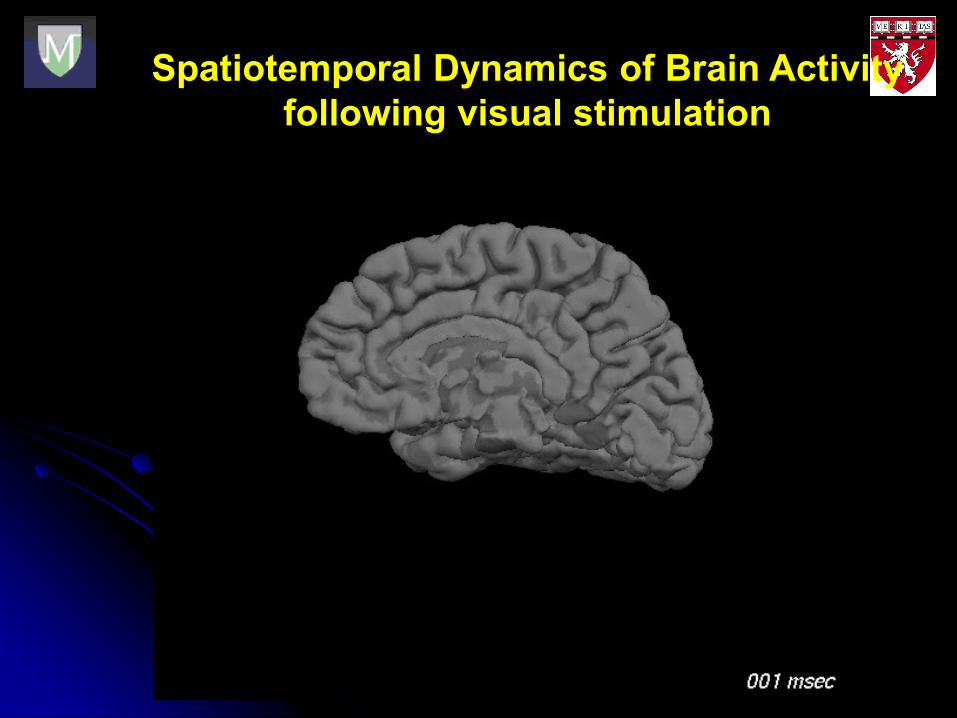
Spatiotemporal Dynamics of Brain Activity
following visual stimulation
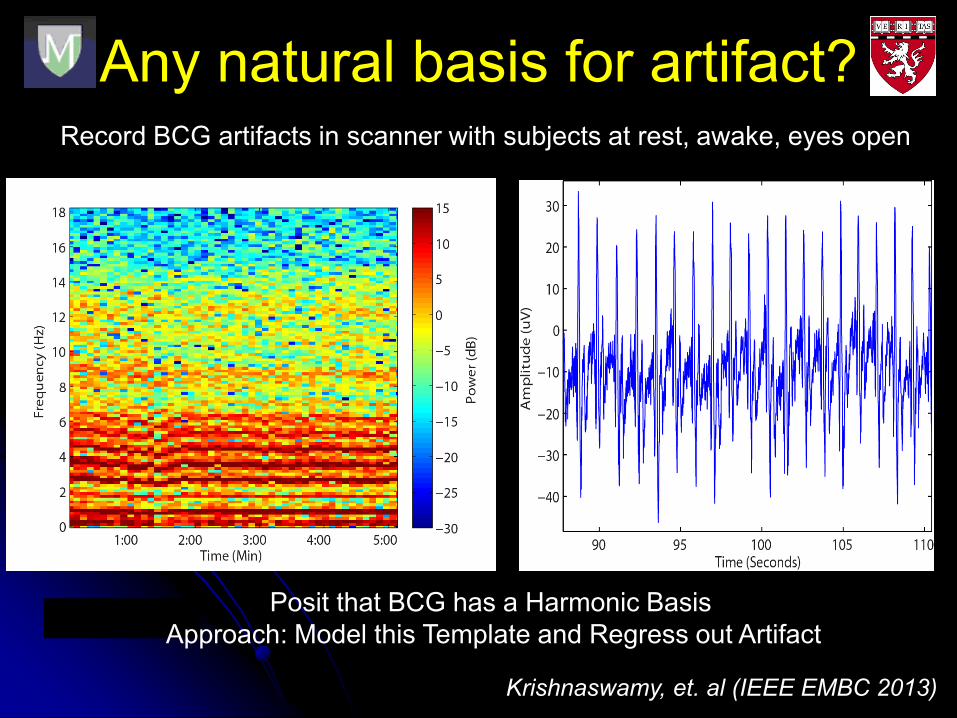
Any natural basis for artifact?
Posit that BCG has a Harmonic Basis
Approach: Model this Template and Regress out Artifact
Record BCG artifacts in scanner with subjects at rest, awake, eyes open
Krishnaswamy, et. al (IEEE EMBC 2013)
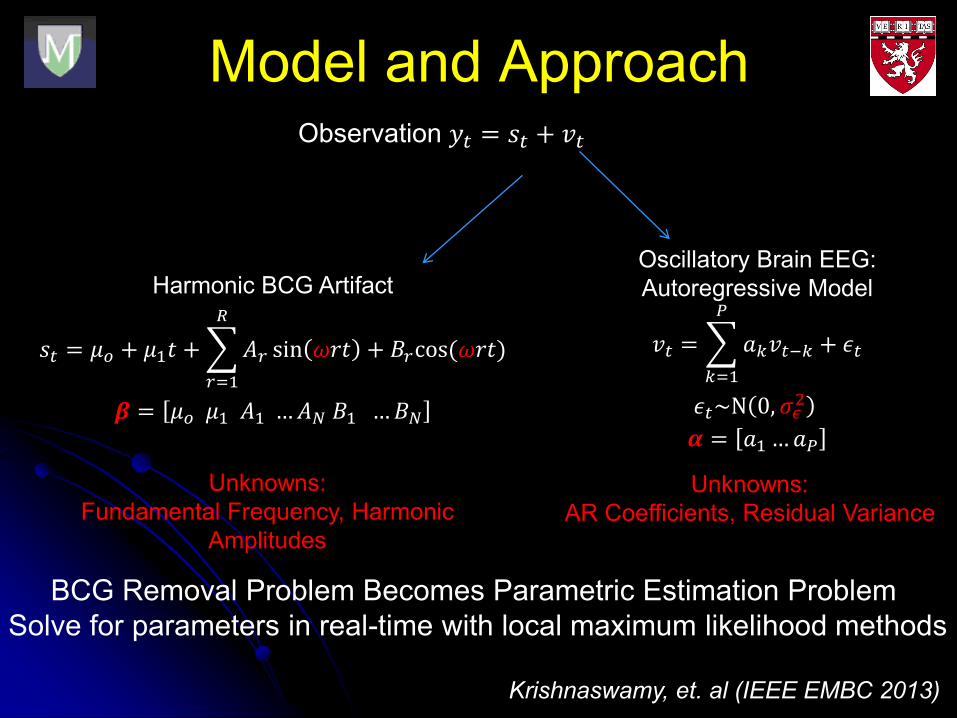
Harmonic BCG Artifact
𝑠𝑡 = 𝜇𝑜 + 𝜇1𝑡 +
𝑟=1
𝑅
𝐴𝑟 sin 𝜔𝑟𝑡 + 𝐵𝑟cos(𝜔𝑟𝑡)
𝜷 = 𝜇𝑜 𝜇1 𝐴1 …𝐴𝑁 𝐵1 …𝐵𝑁
Oscillatory Brain EEG:
Autoregressive Model
𝑣𝑡 =
𝑘=1
𝑃
𝑎𝑘𝑣𝑡−𝑘 + 𝜖𝑡
𝜖𝑡~N 0, 𝜎𝜖2
𝜶 = 𝑎1…𝑎𝑃
Unknowns:
Fundamental Frequency, Harmonic
Amplitudes
Unknowns:
AR Coefficients, Residual Variance
BCG Removal Problem Becomes Parametric Estimation Problem
Solve for parameters in real-time with local maximum likelihood methods
Observation 𝑦𝑡 = 𝑠𝑡 + 𝑣𝑡
Model and Approach
Krishnaswamy, et. al (IEEE EMBC 2013)
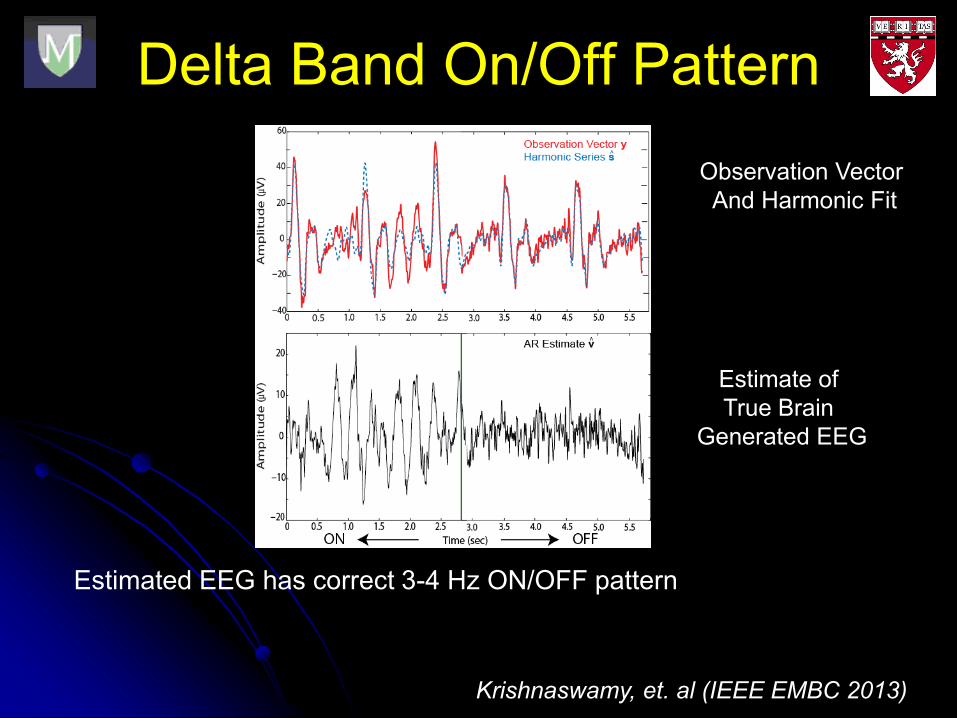
Delta Band On/Off Pattern
Estimated EEG has correct 3-4 Hz ON/OFF pattern
Estimate of
True Brain
Generated EEG
Observation Vector
And Harmonic Fit
Krishnaswamy, et. al (IEEE EMBC 2013)
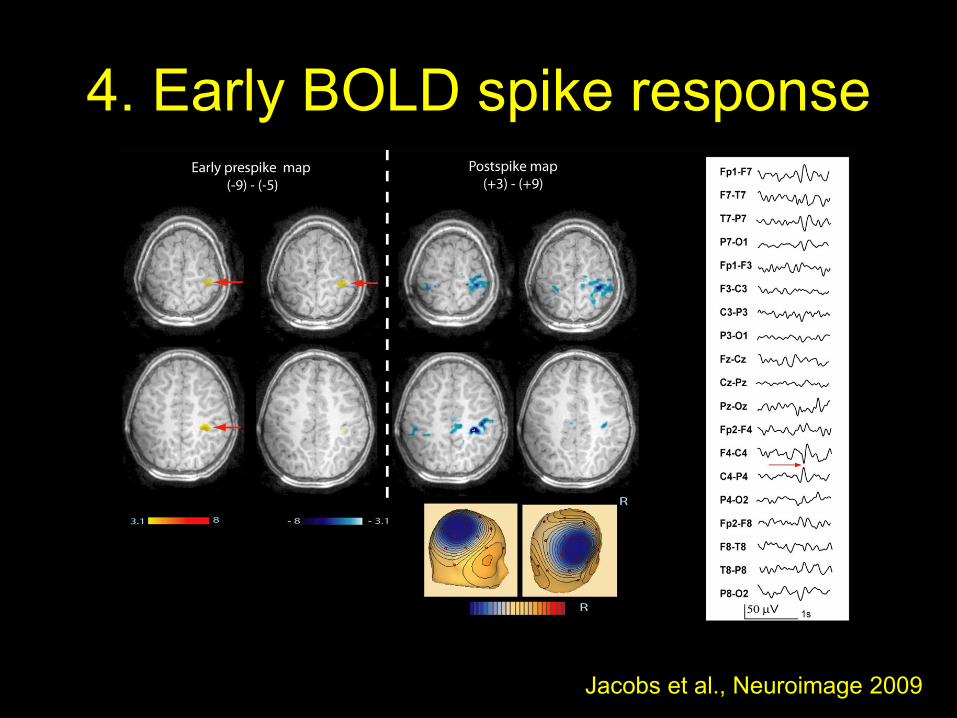
4. Early BOLD spike response
Jacobs et al., Neuroimage 2009
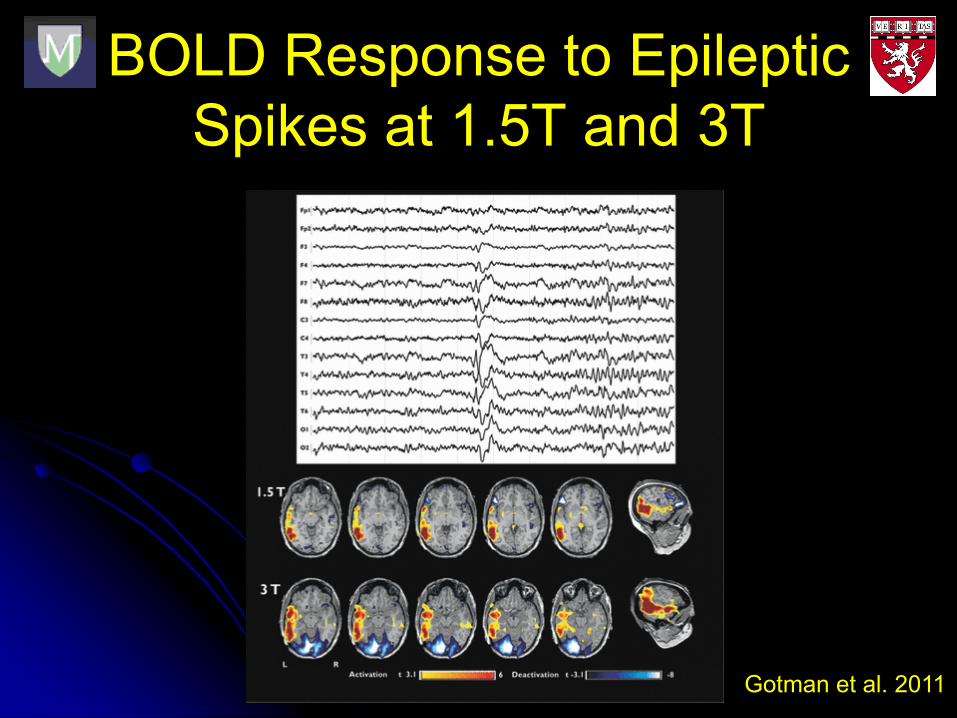
BOLD Response to Epileptic
Spikes at 1.5T and 3T
Gotman et al. 2011

BOLD Signal at 7T
Jon Polimeni, MGH.
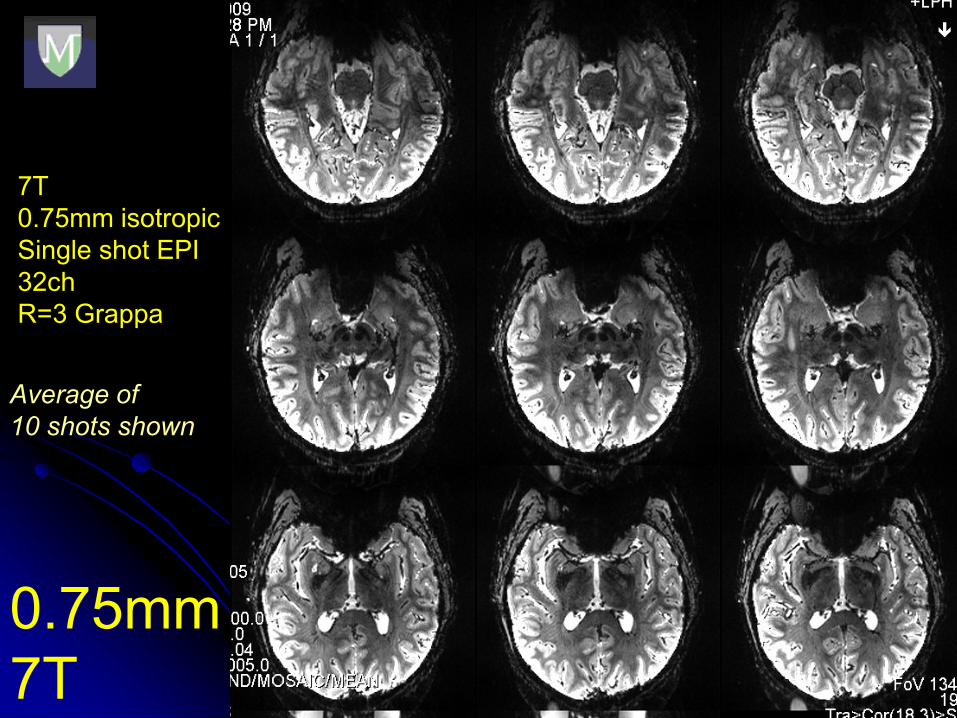
7T
0.75mm isotropic
Single shot EPI
32ch
R=3 Grappa
Average of
10 shots shown
0.75mm
7T

0.5mm isotropic
Single shot EPI
32ch
R=4 Grappa
Average of
10 shots shown
0.5mm
7T

Resolution Stimulus
left primary visual cortex (flattened)right visual hemifield
goal: imposed desired activity pattern on V1 surface
w=k log(z+a)
Jon Polimeni, MGH.

stimulus condition Bstimulus condition A
resolution stimulus
counterphase flickering (8 Hz) scaled spatial noise pattern
fixation task to minimize blurring due to eye movements
block design presentation: two stimulus conditions plus rest, 5min total
Jon Polimeni, MGH
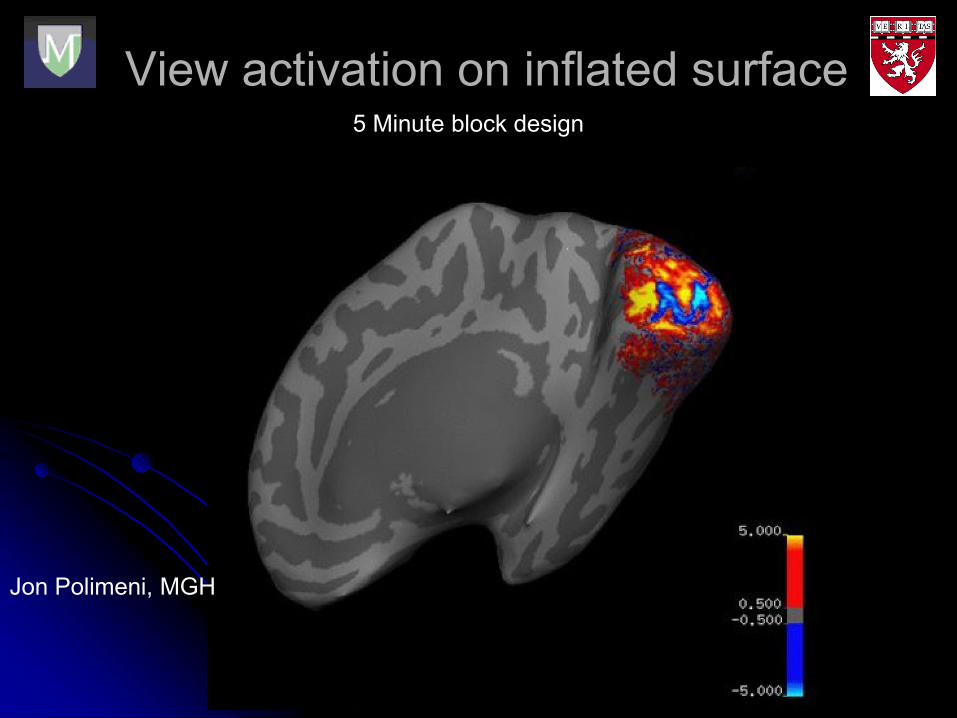
View activation on inflated surface
Jon Polimeni, MGH
5 Minute block design
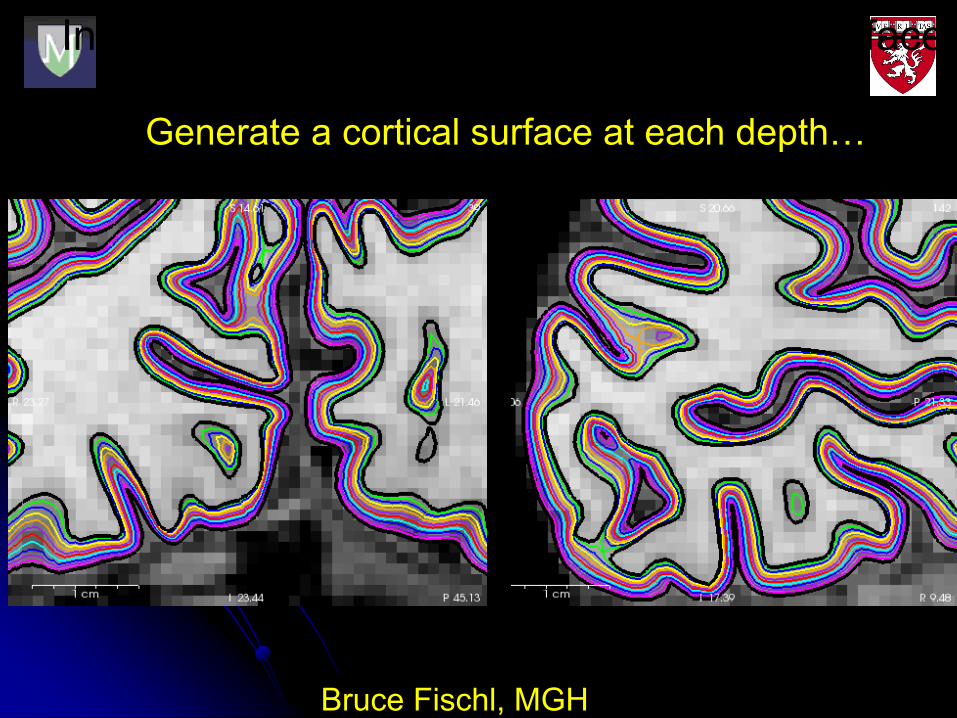
Interpolate along the path between pial surface
vertices and WM surface vertices.Generate a cortical surface at each depth…
Bruce Fischl, MGH
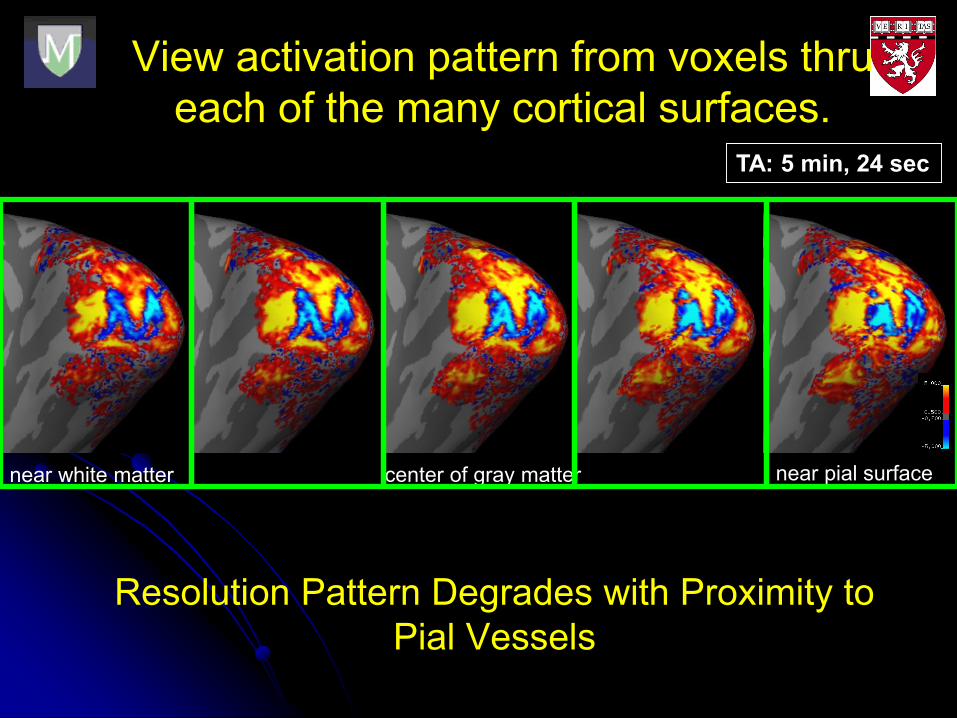
near white matter near pial surfacecenter of gray matter
TA: 5 min, 24 sec
Resolution Pattern Degrades with Proximity to
Pial Vessels
View activation pattern from voxels thru
each of the many cortical surfaces.

EEG/fMRI to study Anesthesia
Purdon et al. 2009 MGH

EEG/fMRI/Propofol• Graded Propofol Infusion
• Cardiac-Gated fMRI (Brainstem)
• EEG (40 Hz ASSR)
• Behavioral Task (Consciousness)
• Blood Gas (CO2)
• Blood Propofol Level
• Physiological Data (EtCO2,
ECG, BP, SpO2)
Cardiac
Gating
Auditory Pathway
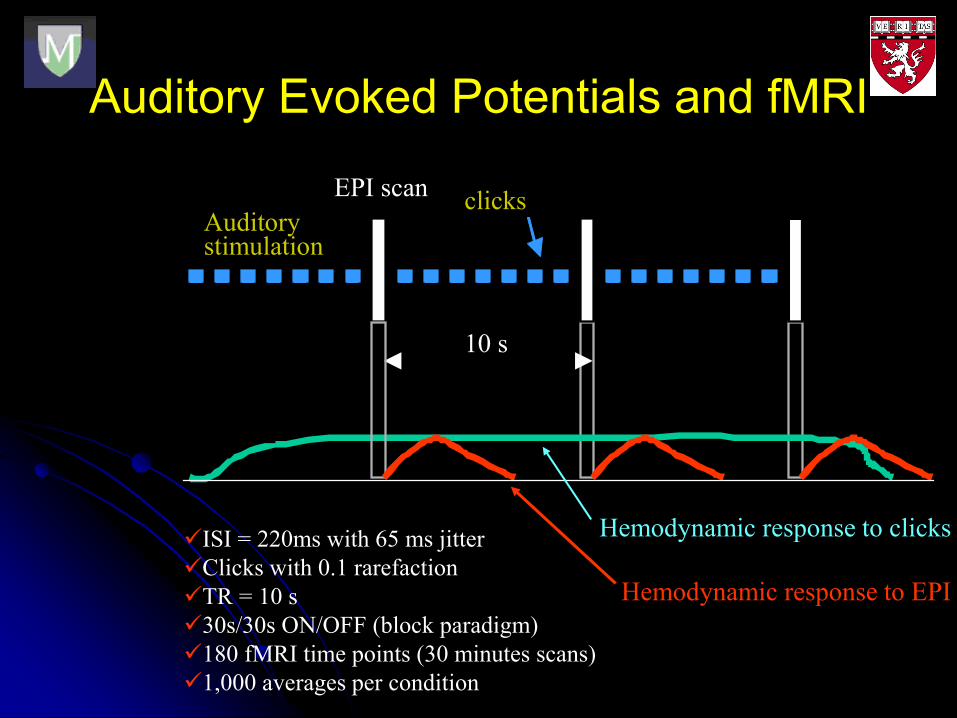
Auditory Evoked Potentials and fMRI
EPI scan
Auditory stimulation
10 s
clicks
ISI = 220ms with 65 ms jitter
Clicks with 0.1 rarefaction
TR = 10 s
30s/30s ON/OFF (block paradigm)
180 fMRI time points (30 minutes scans)
1,000 averages per condition
Hemodynamic response to clicks
Hemodynamic response to EPI
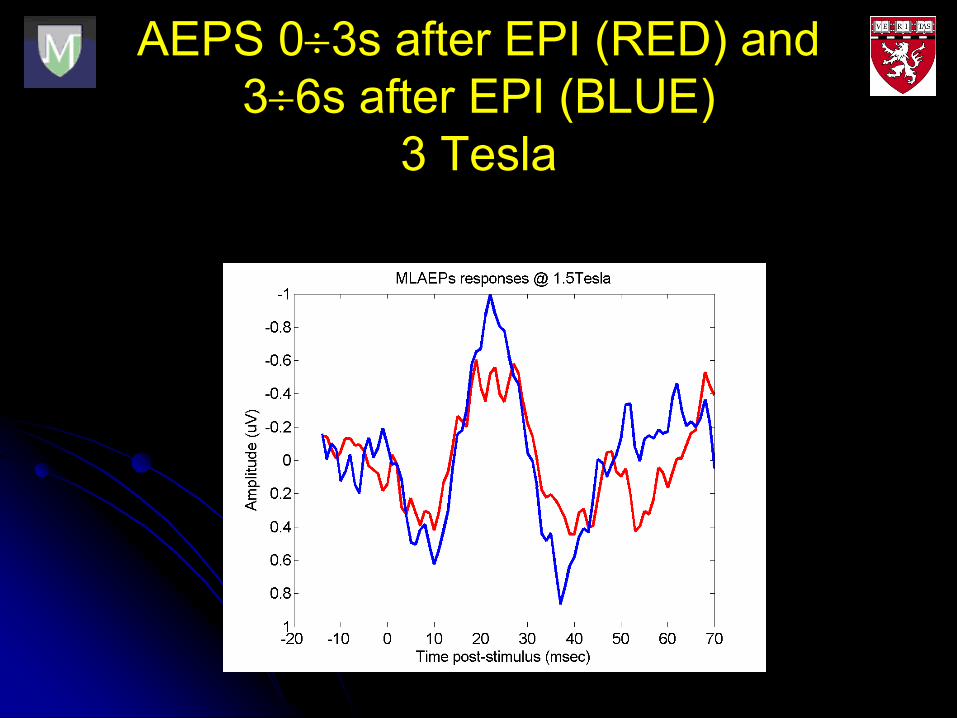
AEPS 03s after EPI (RED) and
36s after EPI (BLUE)
3 Tesla
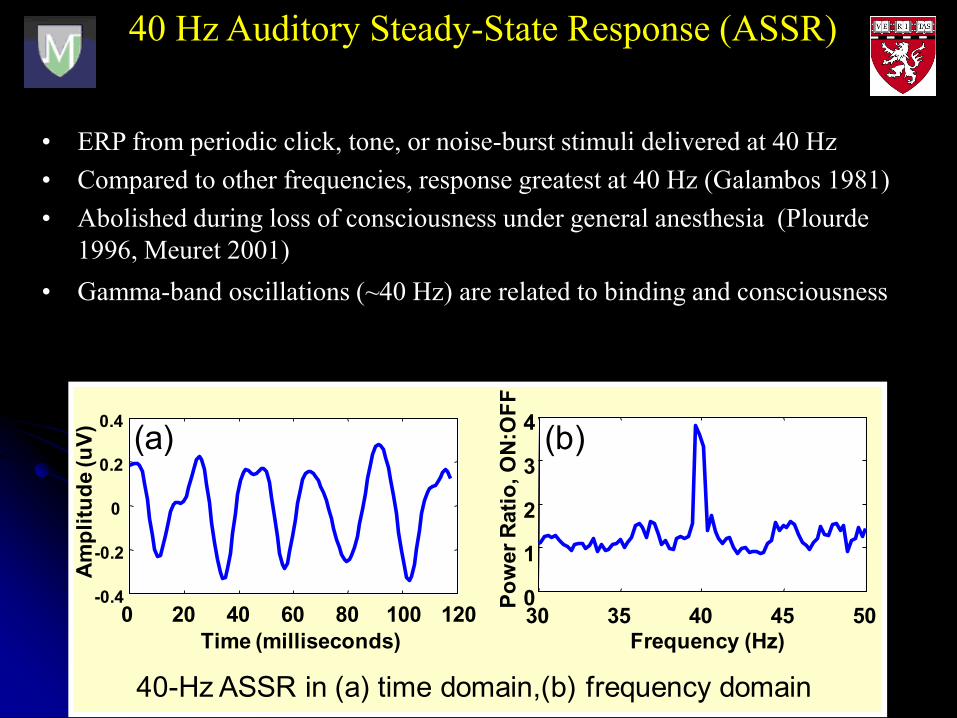
40 Hz Auditory Steady-State Response (ASSR)
• ERP from periodic click, tone, or noise-burst stimuli delivered at 40 Hz
• Compared to other frequencies, response greatest at 40 Hz (Galambos 1981)
• Abolished during loss of consciousness under general anesthesia (Plourde
1996, Meuret 2001)
• Gamma-band oscillations (~40 Hz) are related to binding and consciousness
40-Hz ASSR in (a) time domain,(b) frequency domain
30 35 40 45 500
1
2
3
4
Po
wer
Rati
o, O
N:O
FF
Frequency (Hz)
(b)
0 20 40 60 80 100 120-0.4
-0.2
0
0.2
0.4
Time (milliseconds)
Am
pli
tud
e (u
V)
(a)

Concurrent Recording of 40-Hz Auditory Steady State
Response (ASSR) and fMRI at 7T
Noise bursts (40 Hz) of 30 sec
followed by 30 sec break
ASSRs are related to thalamo-
cortical function and loss of
consciousness.
BOLD activation map
for 40Hz noise burst
stimulus
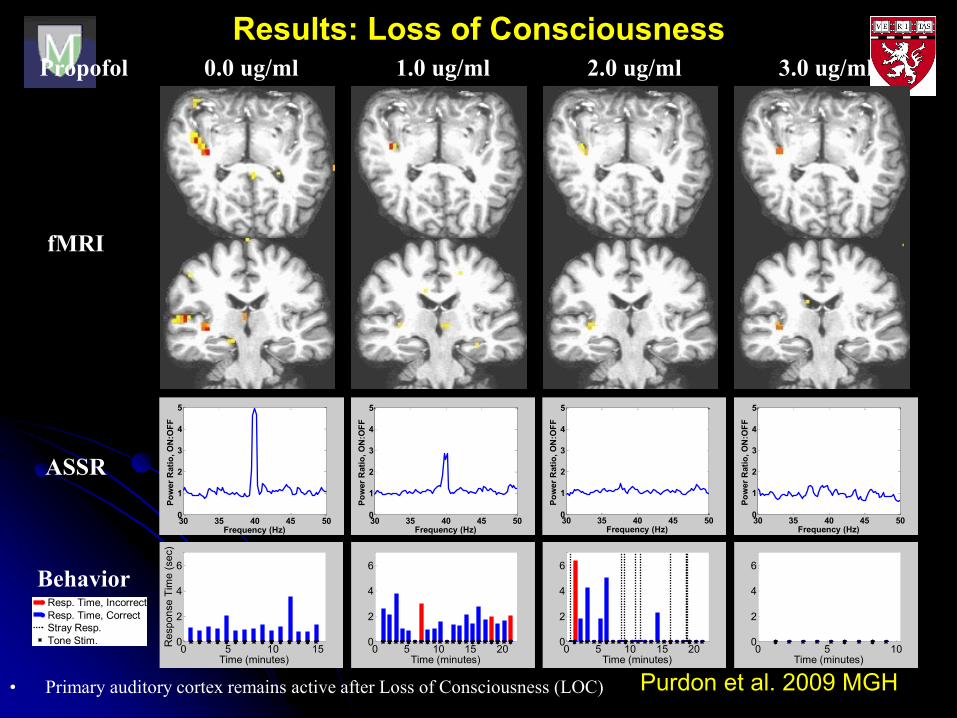
Results: Loss of Consciousness0.0 ug/ml 1.0 ug/ml 2.0 ug/ml 3.0 ug/mlPropofol
fMRI
Behavior
ASSR
30 35 40 45 500
1
2
3
4
5
Po
wer
Rati
o, O
N:O
FF
Frequency (Hz)30 35 40 45 500
1
2
3
4
5
Po
wer
Rati
o, O
N:O
FF
Frequency (Hz)30 35 40 45 500
1
2
3
4
5
Po
wer
Rati
o, O
N:O
FF
Frequency (Hz)30 35 40 45 500
1
2
3
4
5
Po
wer
Rati
o, O
N:O
FF
Frequency (Hz)
0 5 10 150
2
4
6
Time (minutes)
Re
sp
on
se
Tim
e (
se
c)
0 5 10 15 200
2
4
6
Time (minutes)0 5 10 15 20
0
2
4
6
Time (minutes)0 5 10
0
2
4
6
Time (minutes)
0 5 10 15 200
1
2
3
4
Time (minutes)
Resp. Time, Incorrect
Resp. Time, Correct
Stray Resp.
Tone Stim.
Purdon et al. 2009 MGH• Primary auditory cortex remains active after Loss of Consciousness (LOC)
EEG/fMRI to study Sleep
Yotsumoto et al., 2009

Intensive training of TDT
Tasks (~90 min)
To report which of “T” or “L” is
presented at the fixation
To report an orientation of the triplet
Always presented in a constant
quadrant of the visual field
Trained visual field was
counterbalanced across the subjects
Stimulus-to-mask onset asynchrony
(SOA) interval
The shorter SOA, the more difficult
the orientation task
To estimate subjects performance
Correct response ratio in a given SOA
A threshold SOA (80% correct
discrimination)
(13ms)
(SOA)
(100 ms)
Target
Yotsumoto et al., 2009
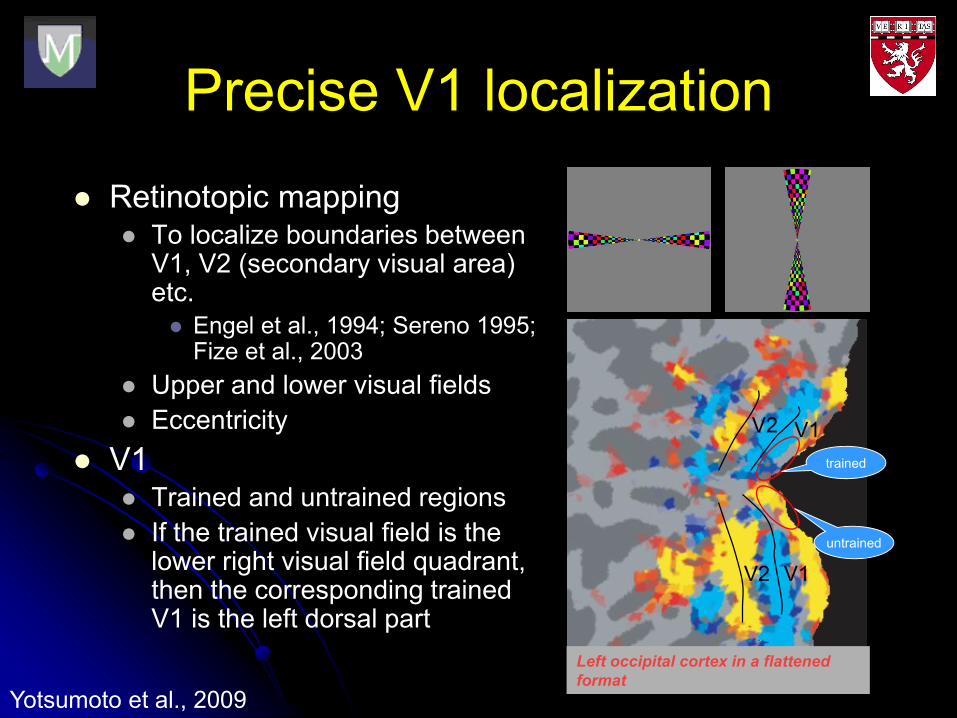
Precise V1 localization
Retinotopic mapping To localize boundaries between
V1, V2 (secondary visual area) etc.
Engel et al., 1994; Sereno 1995; Fize et al., 2003
Upper and lower visual fields
Eccentricity
V1 Trained and untrained regions
If the trained visual field is the lower right visual field quadrant, then the corresponding trained V1 is the left dorsal part
Left occipital cortex in a flattened
format
V1V2
V1V2
untrained
trained
Yotsumoto et al., 2009

PSG in 3T magnetic field
Wakefulness
Alpha waves
Cardiac noise removed from EEG
EPI noise
Yotsumoto et al., 2009
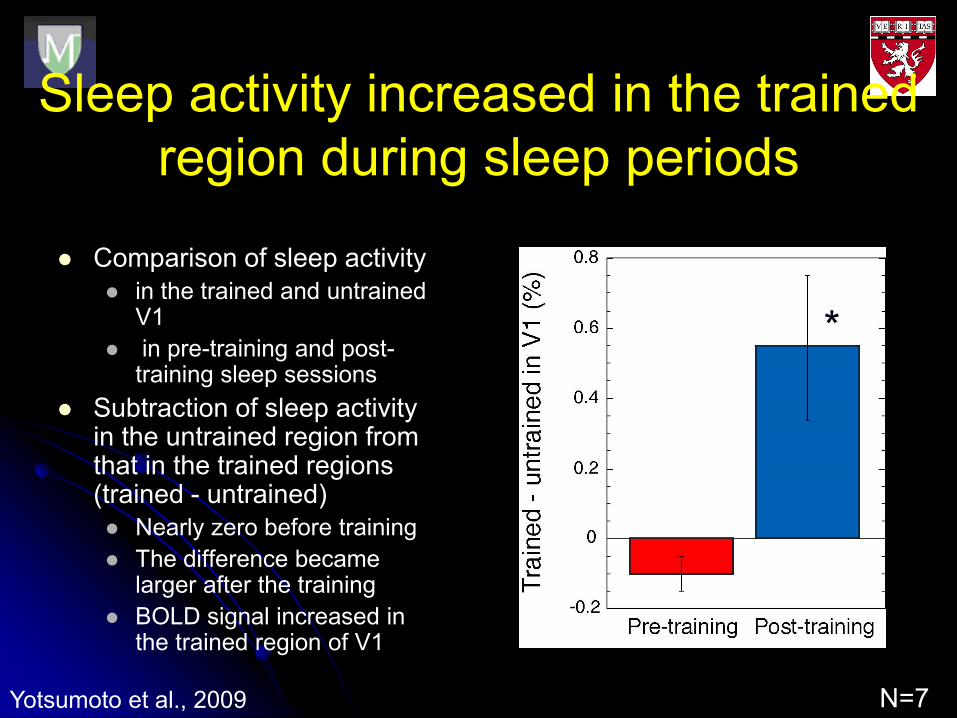
Sleep activity increased in the trained
region during sleep periods
Comparison of sleep activity
in the trained and untrained V1
in pre-training and post-training sleep sessions
Subtraction of sleep activity in the untrained region from that in the trained regions (trained - untrained)
Nearly zero before training
The difference became larger after the training
BOLD signal increased in the trained region of V1
*
N=7Yotsumoto et al., 2009

TDT performance was improved after the sleep period
A threshold SOA (80%-SOA) was calculated in both the first training session and the re-test session
In the re-test session, 80%-SOA became shorter by ~35 ms
Performance was improved in the re-test
0
20
40
60
80
100
120
140
pre re-test
80
% S
OA
(m
s) *
Initial training
before sleep
Re-test
after sleep
Thre
shold
inte
rval (m
s)
N=7

Killory, Impaired Attention…, Neuroimage 2011
Resting State EEG/fMRI in Epilepsy
Resting functional connectivity analysis. A. Medial frontal ROI seed region shows maximal connectivity with
bilateral anterior insula/frontal operculum, Mean z-score for connectivity between right In/FO
AcknowledgementsMGH Martinos Center,
Charlestown, MA
Makris N. (CMA)
Purdon P.
Krishnaswamy P.
Angelone L.
Millan H.Vasios C.
Brown E. (MIT)Hamalainen M.
Fischl B.
Sasaki Y.
Yotsumono Y.
Ahveninen J.
Polimeni J.
Wald L.
Belliveau J.W.
Brigham and Women and BIDMC Hospital, Boston, MA
Golby, A.Schomer D.
Neurological CenterTokyo, Japan
Anami, K.
Iwaki, S.
Naval Submarine Medical Research Center, US Navy
Michael, “Q” Chin.
The University of Michigan
Solo, V.
University of KU Leuven (Belgium)
Van Duffel, W.