Multimodal Display Techniques with Application to Breast
133
Multimodal Display Techniques with Application to Breast Imaging K.M. Rafferty, K.G. Baum, E. Schimdt, A. Krol, M. Helguera Biomedical and Materials Imaging Laboratory Chester F. Carlson Center for Imaging Science Rochester Institute of Technology 54 Lomb Memorial Drive Rochester, NY 14623 Department of Radiology State University of New York, Upstate Medical University 750 E. Adams Street Syracuse, NY 13210 Send Inquiries To: María Helguera Phone: 585-475-7053 Fax: 585-475-4568 Address: Chester F. Carlson Center for Imaging Science Rochester Institute of Technology 54 Lomb Memorial Drive Rochester, NY 14623 Table of Contents I. Introduction a. The Problem b. The Study c. References II. Description of Data Collected III. Walkthrough of Study
Transcript of Multimodal Display Techniques with Application to Breast

Multimodal Display Techniques with Application to
Breast Imaging
K.M. Rafferty, K.G. Baum, E. Schimdt, A. Krol, M. Helguera
Biomedical and Materials Imaging LaboratoryChester F. Carlson Center for Imaging Science
Rochester Institute of Technology54 Lomb Memorial Drive
Rochester, NY 14623
Department of RadiologyState University of New York, Upstate Medical University
750 E. Adams StreetSyracuse, NY 13210
Send Inquiries To:María HelgueraPhone: 585-475-7053Fax: 585-475-4568Address: Chester F. Carlson Center for Imaging Science Rochester Institute of Technology 54 Lomb Memorial Drive Rochester, NY 14623
Table of Contents I. Introduction
a. The Problemb. The Studyc. References
II. Description of Data CollectedIII. Walkthrough of Study

a. Walkthrough of Unfuze (side-by-side monochrome comparison) Programb. Walkthrough of Fuze (joint display) Program
IV. Fuze ProgramV. Observer Instructions
a. Fuze Instructionsi. Using the Fuze softwareii. Set upiii. Testingiv. To run an Un-Fuze test
b. Participant Instructionsi. Color Mapsii. Testingiii. Technique 4 Supplement
VI. Data Useda. Preparation of Study Datab. Fusion Techniques Studiedc. Referencesd. Images Usedb. Original Images Used
VII. ParticipantsVIII. XML Definitions
a. XML Files Created By Fuze.exeb. XML Files Created By Un-Fuze.exe
IX. XML FilesX. IDL Documentation
a. Unfuseb. Fuse
XI. Graphsa. Color Difference
i. Plots for each Individualii. Plots for each Technique
b. Comprehensionc. Difficulty vs. Image Number
i. Plots for each Individualii. Plots for each Technique
d. Difficulty vs. Positioni. Plots for each Individualiii. Plots for each Technique
e. MRI Distancei. Plot for each Individualii. Plot for each Technique
f. PET Distancei. Plot for each Individualii. Plot for each Technique
g. Physical Color Distancei. Plots for each Individual

ii. Plot for each Techniqueh. Preferencei. Time vs. Image Number
i. Plots for each Individualii. Plots for each Technique
j. Time vs. Positioni. Plots for each Individualii. Plots for each Technique
k. Unfused DistanceXII. SummaryXIII. Acknowledgment
I. Introduction
a. The Problem Application of a multimodality approach is advantageous for detection, diagnosis and management of breast cancer. In this context, F-18-FDG positron emission tomography (PET) [1, 2], and high-resolution and dynamic contrast-enhanced magnetic resonance imaging (MRI) [3, 4] have steadily gained clinical acceptance. Initial experience with combined PET (metabolic imaging) and x-ray computed tomography (CT, anatomical localization) has demonstrated sizable improvements in diagnostic accuracy, allowing better differentiation between normal and pathological uptake and by providing positive finding in CT images for lesions with low metabolic activity [2]. Obtaining the spatial relationships between these modalities and conveying them to the observer maximizes the benefit that can be achieved. The process of obtaining the spatial relationships and manipulating the images, so that corresponding voxels in them represent the same physical location, is called registration [5,6]. The next step is the visualization of the data. Traditionally the registered images are displayed side by side. However, it is believed that a combined MRI/PET display may be more beneficial. The advantage of a combined image lies in our inability to visually judge spatial relationships between images when they are viewed side by side. Depending on background shades and colors, identical shapes and lines may appear to be different sizes [8]. The fact that the spatial relationships between the modalities can better be ascertained from a combined display drives this research. The process of combining the MRI and PET 3D images into a single 3D image is called image fusion. The color tables generated and studied in this work are to be used to create fused MRI/PET images.
b. The Study To test the validity of fusion visualization eight techniques were selected to conduct an exercise with radiologists from Department of Radiology at SUNY Upstate Medical University. Nine different images with no malignant lesions were presented in random order using each of the eight techniques and four radiologists were

asked to perform the following tasks.(1) On a PET monochrome image click on the region of maximum metabolic activity (glandular tissue)(2) On a gray scale LUT select the gray level that corresponds to the gray level value of the region of maximum activity(3) On an MRI image click on the morphological region that corresponds to the region located on the PET image(4) On a gray scale LUT select the gray level that corresponds to the gray level value previously selected on the MRI image(5) Trace the region of maximum metabolic activity on the PET image and the MRI image(6) On a fused image click on the region of maximum metabolic activity(7) Click on the corresponding color on the LUT to identify PET and MRI values(8) Trace the region of maximum metabolic activity on the fused image(9) Evaluate the degree of difficulty in performing this task(10) Evaluate your understanding of the fusion scheme(11) Indicate your preference for the fusion scheme
c. References
[1] E. Bombardieri, F. Crippa, “PET imaging in breast cancer”, Quat, J. Nuc. Med., vol. 45, 245-256, 2001.[2] K. Scheidhauer, C. Walter, M. D. Seemann, “FDG PET and other imaging modalities in the primary diagnosis of suspicious breast lesions”, Eur. J. Nucl. Med. Mol. Imaging., 31, Suppl. 1, S70–S79, 2004.[3] P. A., Eliat, V. Dedieu, et al., "Magnetic resonance imaging contrast-enhanced relaxometry of breast tumors: an MRI multicenter investigation concerning 100 patients." Mag. Res. Imaging 22, 475-81, 2004.[4] P. Gibbs, G. P. Liney, et al., "Differentiation of benign and malignant sub-1 cm breast lesions using dynamic contrast enhanced MRI", Breast 13, 115-21, 2004.[5] I. Coman, A. Krol, D. Feiglin, E. Lipson, J. Mandel, K. G. Baum, M. Unlu, L. Wei, "Intermodality nonrigid breast-image registration," IEEE International Symposium on Biomedical Imaging: From Nano to Macro, Arlington, VA, USA, 15-18 April 2004.[6] A. Krol, M.Z. Unlu, K. G. Baum, J. A. Mandel, W. Lee, I. L. Coman, E. D. Lipson, D. H. Feiglin; “MRI/PET Nonrigid Breast-Image Registration Using Skin Fiducial Markers”, Physica Medica European Journal of Medical Physics, Vol. XXI, Supplement 1, 2006.
II. Description of Data Collected All of the data collected for this study were stored in XML files, and there was one file for each observer for each technique. The data collected included the subject’s name, the technique number, the subject’s level of expertise, and the date and time. Also, the location of the image file and the location of the color table file were recorded. The time (in seconds) it took the subject to click on the most metabolically active region on the image was recorded, as well as the horizontal and vertical position where the subject clicked on the image. In addition, the coordinates where the subject clicked on the color table corresponding to the same color they clicked on the image were stored. The subjects were asked to trace the region of the most metabolic activity for each image, and from that the coordinates from the trace were recorded. The level of difficulty for the subject to analyze the metabolically active region was recorded for each image, as well as each subject’s level of comprehension and level of preference for each technique. There was also room at the end of each technique for the subjects to leave any additional comments. From this data, we were also able to obtain more information. By collecting the data from the location where the subject clicked on the most metabolically active region on the PET and the same location on the MRI, the distance between the two was found for each of the 9 images. This information could also be used to find the PET distance, which was the distance between where the subject clicked on the most metabolically active region on the PET and the same location in the fused image. This was also the case for the MRI distance.

From obtaining information from the coordinates where the subject clicked on the active region on the fused image, the image file location, the color table location, and the coordinates where the subject clicked on the color table that corresponded to the color clicked on the active region on the fused image, the color distance was obtained. The color distance represented the distance between the color on the color table that the subject selected and the color at the location they selected in the fused image corresponding to the metabolically active region. Furthermore, the same previous information was used to find the color difference, which was the difference in the color between the color on the color table that the subject clicked and the correct color that represents the most metabolically active region. The difference in colors is determined by the distance between them in the CIE L*a*b color space. This data can be found in the XML Definition file.
III. Walkthrough of Study
a. Walkthrough of Unfuze (side-by-side monochrome comparison) Program
The program Unfuze.exe was the application that the subject used to perform this portion of the experiment. The subject was to inspect the images, reading and following the instructions provided at the top of the window. After entering in their name and selecting an XML output file, the subjects were instructed to read the description at the top of the screen. ‘Next’ was clicked to go to the next screen.
In the first step, the subject was instructed to click on the most metabolically active region on the PET image. Upon doing so, the point that the subject clicked on was recorded in an XML document. The horizontal and vertical positions clicked are stored in the ‘PETCoordX’ and ‘PETCoordY’ tags, respectively. The time it took for the subjects to click on the active region was also recorded in the XML document under the tag ‘TimeToClickPET.’

The next step was for the subject to select a color on the color table corresponding to the color at the point selected previously in the PET. The intensity at the point that the subject clicked on was recorded in the XML document. It was stored under the ‘PETLUTVal’ tag.
The subject was then asked to trace around the outline of the metabolically active region in the PET. The trace was stored as a set of points, and was stored in the XML document under the ‘Points’ tag, with each point in the set stored under a ‘Point’ tag and then ‘X’ and ‘Y’ tags respectively.

Next, the subject was instructed to click on the most metabolically active region in the MRI. Upon doing so, the point that the subject clicked on was recorded in an XML document. The horizontal and vertical positions clicked are stored in the ‘MRICoordX’ and ‘MRICoordY’ tags, respectively. The time it took for the subjects to click on the active region was also recorded in the XML document under the tag ‘TimeToClickMRI.’
After that, the subject was to select a color on the color table corresponding to the color at the point selected previously in the MRI. The intensity at the point that the subject clicked on was recorded in the XML document. It was stored under the ‘MRILUTVal’ tag.

The subject was then asked to trace around the outline of the metabolically active region in the MRI. The trace was stored as a set of points, and was stored in the XML document under the ‘Points’ tag, with each point in the set stored under a ‘Point’ tag and then ‘X’ and ‘Y’ tags respectively.
b. Walkthrough of Fuze (joint display) Program The program Fuze.exe was the application that the subject used to perform this portion of the experiment. The subject was to inspect the images, reading and following the instructions at the top of the window. After entering in their name and selecting an XML input and output file, and then choosing a technique, the subjects were instructed to read the description at the top of the screen. ‘Next’ was clicked to go to the next screen.
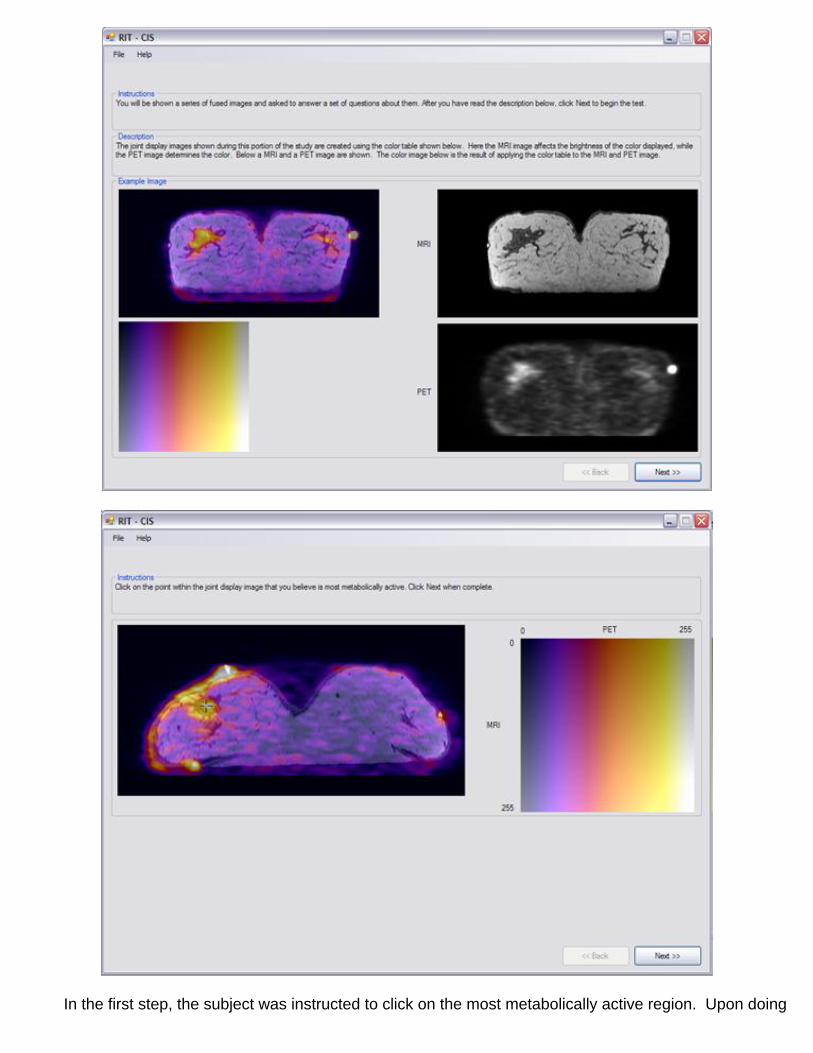
In the first step, the subject was instructed to click on the most metabolically active region. Upon doing

so, the point that the subject clicked on was recorded in an XML document. The horizontal and vertical positions clicked are stored in the ‘ImageClickPosX’ and ‘ImageClickPosY’ tags, respectively. The time it took for the subjects to click on the active region was also recorded in the XML document under the tag ‘TimeToClick.’
The next step was for the subject to select a color on the color table corresponding to the color at the point selected previously. The point that the subject clicked on was recorded in an XML document. The horizontal and vertical positions clicked are stored in the ‘ColorTableXVal’ and ‘ColorTableYVal’ tags, respectively.’

The subject was then asked to trace around the outline of the metabolically active region. They were asked to consider both the PET and MRI information while dragging the mouse to trace the active region. The trace was stored as a set of points, and was stored in the XML document under the ‘Points’ tag, with each set of points stored under the ‘Point’ tag and then ‘X’ and ‘Y’ tags respectively.
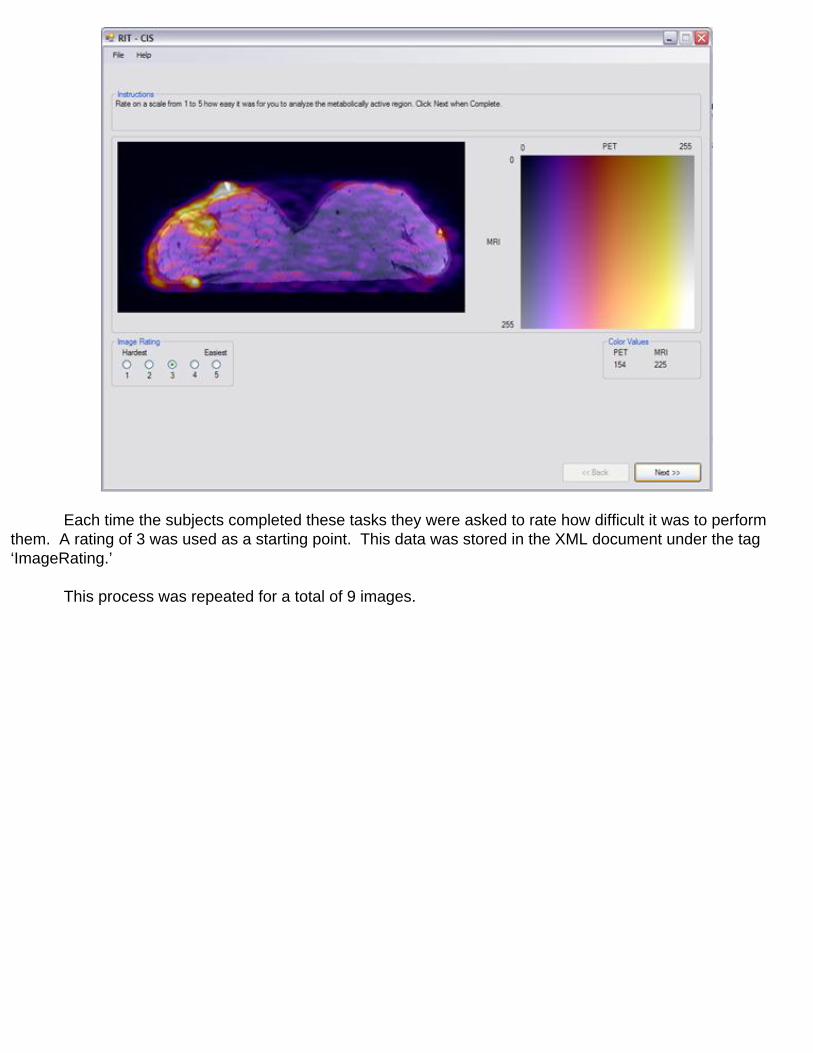
Each time the subjects completed these tasks they were asked to rate how difficult it was to perform them. A rating of 3 was used as a starting point. This data was stored in the XML document under the tag ‘ImageRating.’ This process was repeated for a total of 9 images.

Lastly, the subjects were asked to rate their ability to use the technique, or their comprehension, as a whole. This information was stored in the XML document under the tag ‘ColorRating.’ They were also asked to give their own opinion, or preference of the joint display technique, which was stored in the tag ‘OpinionRating.’ They were allowed room for additional comments. This entire process was repeated for each of the 8 techniques investigated.
IV. Fuze Program The program was written in C# and requires the .NET runtime version 2.0. The links below are folders containing the application package sent to the subjects that participated in the study and the source code for the Fuze Program.
Application Package
Source Code
V. Observer Instructions
a. Fuze Instructions
i. Using the Fuze software
● Follow the set up instructions below (in the next section of this document) to create configuration files for

each test subject.● Before a subject’s first test, have them thoroughly read a copy of the “Test Procedure.pdf” document
included in the “Fuze > Documentation” directory. It is preferable that you print a color copy of the document, but displaying it on the screen for them is an acceptable alternative. Make sure all participants in the study view the document in the same way (on paper or on screen).
● Ensure that the same computer and lighting conditions are used for each test.● Following the testing instructions (located later in this document), have each subject complete each of the
eight techniques with the “Fuze.exe” program. Run the tests in the order that they appear in the “Available Techniques” box seen when creating a new test.
● After all eight tests have been completed, follow the procedure for running an Un-Fuze test as outlined below (later in this document). This test must only be completed once for each subject.
● Each test (technique) should be completed no earlier than two days after the previous test has been taken.
● For technique 4, have the subject thoroughly read a copy of the “Technique 4 Supplement.pdf” document included in the “Fuze > Documentation” directory. You may print out color copies or display the document on the screen for this step.
ii. Set up
● Copy the entire “Fuze” directory onto the desktop.● To create a configuration file for each test subject
❍ Run the “XMLRandomizer.exe” program from the “Fuze > Applications” directory.❍ Enter the subject’s full first and last name. Use this same name when prompted to input a name in
other Fuze applications.❍ For the XML input file, browse to the “TestConfig.xml” file in the “Fuze > Test Files” directory.❍ For the XML output directory, browse to the “Fuze > Test Files > Config Files” directory.❍ Click “Create” to create the file.❍ To create files for additional subjects, change the name values and click “Create”. It is not
necessary to restart the program.❍ Once finished with all subjects, exit the program.
iii. Testing
● Run the “Fuze.exe” program from the “Fuze > Applications” directory.● From the “File” menu, click “New Test”.● Enter the subject’s full first and last name. Use the same name that you used to create the XML file.● For the XML input file, browse to the file that appears like “UserLastName_UserFirstName_TestConfig.
xml” and that corresponds to the subject’s name from the “Fuze > Test Files > Config Files” directory.● For the XML output directory, browse to the “Fuze > Test Files > Output Files” directory.● Select the subject’s next test from the “Available Techniques” box at the bottom of the window. Do not
select the numerically next test from the box. Select the one below the last test taken by the subject. The order of techniques will be random, this is intentional. If no tests have been taken by the subject, select the first test that appears in the box.
● Record the technique number being taken by the subject. You will need to know this later. The next time the same subject takes a test you will need to select the next one in the “Available Techniques” box.
● Click “Start Test” to begin the test.● When the subject has completed the entire test, you may select “New Test” from the “File” menu to begin
a test for another subject or you may quit the program.
iv. To run an Un-Fuze test
● Run the “Un-Fuze.exe” program from the “Fuze > Applications” directory.● From the “File” menu, click “New Test”.● Enter the subject’s full first and last name. Use the same name that you used to create an XML file and
that you used to start other tests.● For the XML output directory, browse to the “Fuze > Test Files > Output Files” directory.● Click “Start Test” to begin the test.● When the subject has completed the entire test, you may select “New Test” from the “File” menu to begin
a test for another subject or you may quit the program.
b. Participant Instructions
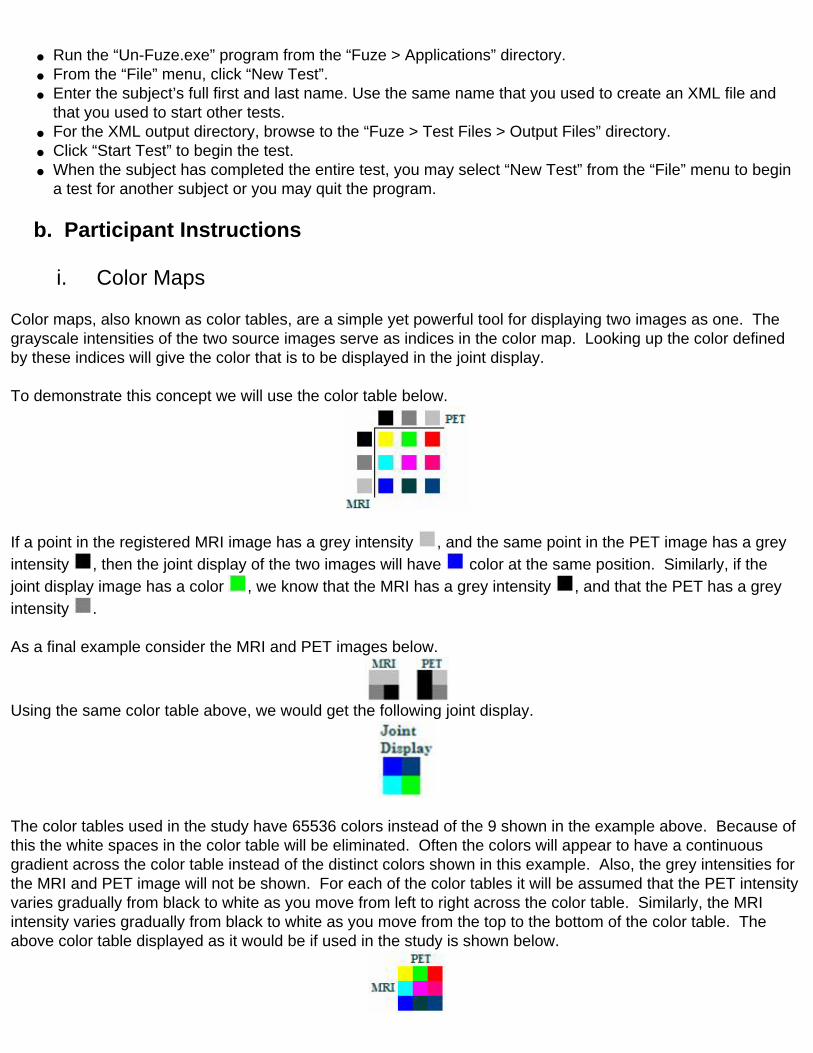
i. Color Maps Color maps, also known as color tables, are a simple yet powerful tool for displaying two images as one. The grayscale intensities of the two source images serve as indices in the color map. Looking up the color defined by these indices will give the color that is to be displayed in the joint display. To demonstrate this concept we will use the color table below.
If a point in the registered MRI image has a grey intensity , and the same point in the PET image has a grey intensity , then the joint display of the two images will have color at the same position. Similarly, if the joint display image has a color , we know that the MRI has a grey intensity , and that the PET has a grey intensity . As a final example consider the MRI and PET images below.
Using the same color table above, we would get the following joint display.
The color tables used in the study have 65536 colors instead of the 9 shown in the example above. Because of this the white spaces in the color table will be eliminated. Often the colors will appear to have a continuous gradient across the color table instead of the distinct colors shown in this example. Also, the grey intensities for the MRI and PET image will not be shown. For each of the color tables it will be assumed that the PET intensity varies gradually from black to white as you move from left to right across the color table. Similarly, the MRI intensity varies gradually from black to white as you move from the top to the bottom of the color table. The above color table displayed as it would be if used in the study is shown below.

ii. Testing Step 1:After inspecting the images and reading the description click next to begin the test. This is where you will receive an overview of how the image was constructed.
Step 2:On this screen you will be instructed to click on the most metabolically active region. When performing this task ignore the heart and the fiducial markers.
Step 3:In this step you will be told to select a color, from the color table on the right, which corresponds to the color at the point that you selected in the last step.

Step 4:In this step you will be asked to trace around the outline of the metabolically active region. Click and drag the mouse while closely tracing the outline of the active region. Remember to consider both the PET and MRI information when identifying the active region.
Step 5:Rate your ability to perform the previous tasks on this image. To give you a starting point, use a rating of 3 the first time you see this screen.
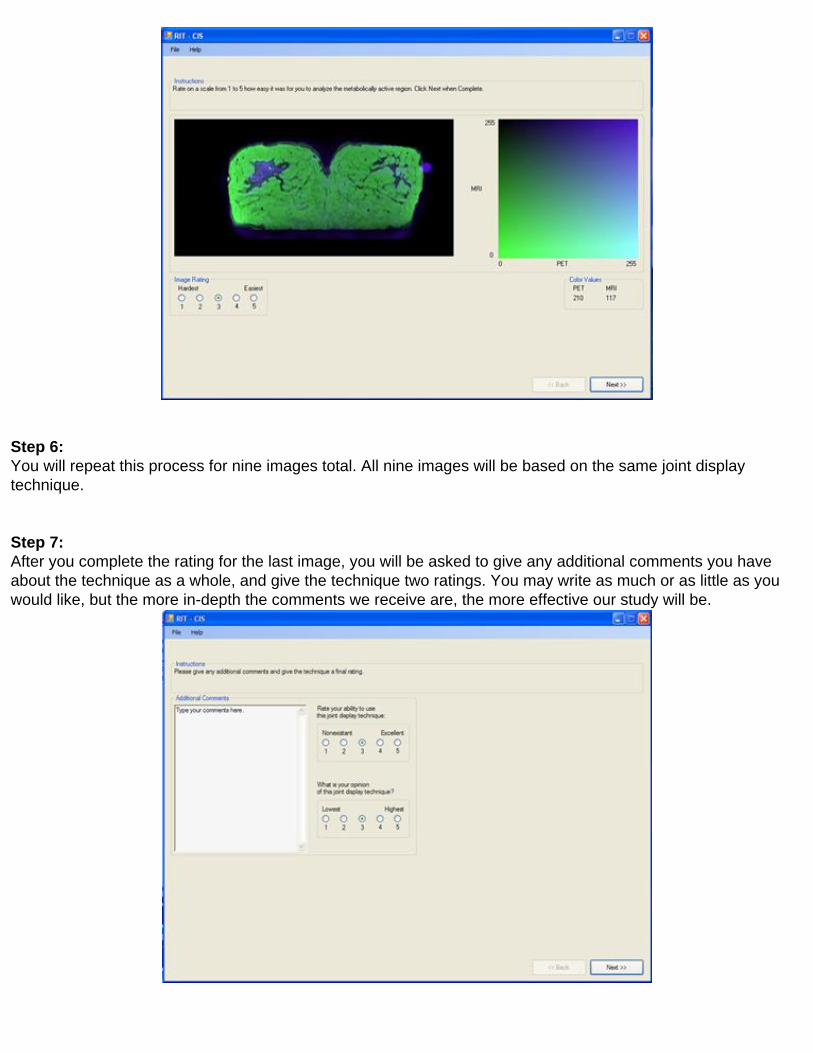
Step 6:You will repeat this process for nine images total. All nine images will be based on the same joint display technique. Step 7:After you complete the rating for the last image, you will be asked to give any additional comments you have about the technique as a whole, and give the technique two ratings. You may write as much or as little as you would like, but the more in-depth the comments we receive are, the more effective our study will be.
Step 8:At this point you may quit the test.
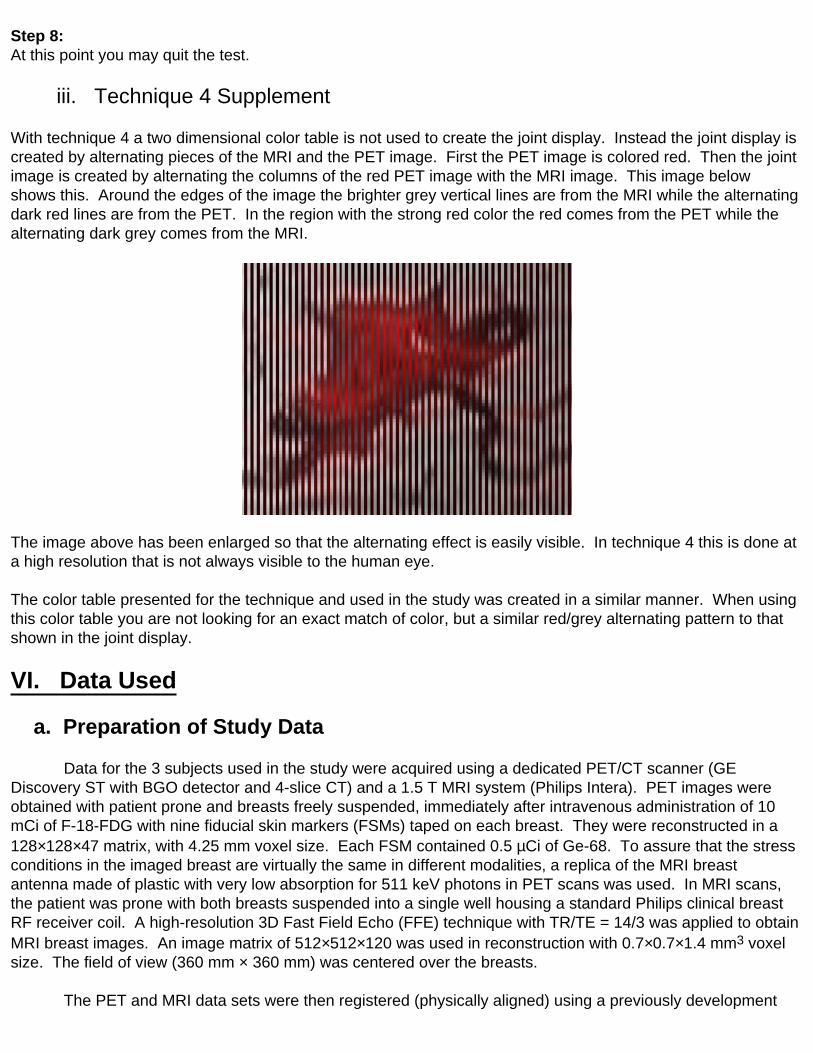
iii. Technique 4 Supplement With technique 4 a two dimensional color table is not used to create the joint display. Instead the joint display is created by alternating pieces of the MRI and the PET image. First the PET image is colored red. Then the joint image is created by alternating the columns of the red PET image with the MRI image. This image below shows this. Around the edges of the image the brighter grey vertical lines are from the MRI while the alternating dark red lines are from the PET. In the region with the strong red color the red comes from the PET while the alternating dark grey comes from the MRI.
The image above has been enlarged so that the alternating effect is easily visible. In technique 4 this is done at a high resolution that is not always visible to the human eye. The color table presented for the technique and used in the study was created in a similar manner. When using this color table you are not looking for an exact match of color, but a similar red/grey alternating pattern to that shown in the joint display.
VI. Data Used
a. Preparation of Study Data Data for the 3 subjects used in the study were acquired using a dedicated PET/CT scanner (GE Discovery ST with BGO detector and 4-slice CT) and a 1.5 T MRI system (Philips Intera). PET images were obtained with patient prone and breasts freely suspended, immediately after intravenous administration of 10 mCi of F-18-FDG with nine fiducial skin markers (FSMs) taped on each breast. They were reconstructed in a 128×128×47 matrix, with 4.25 mm voxel size. Each FSM contained 0.5 µCi of Ge-68. To assure that the stress conditions in the imaged breast are virtually the same in different modalities, a replica of the MRI breast antenna made of plastic with very low absorption for 511 keV photons in PET scans was used. In MRI scans, the patient was prone with both breasts suspended into a single well housing a standard Philips clinical breast RF receiver coil. A high-resolution 3D Fast Field Echo (FFE) technique with TR/TE = 14/3 was applied to obtain MRI breast images. An image matrix of 512×512×120 was used in reconstruction with 0.7×0.7×1.4 mm3 voxel size. The field of view (360 mm × 360 mm) was centered over the breasts. The PET and MRI data sets were then registered (physically aligned) using a previously development
non-rigid registration procedure based on the finite-element-method [1, 2]. The registration consists of two steps. First, location and displacements of corresponding FSM observed in both moving (MRI) and target (PET) volumes are determined, and then FEM is used to distribute the FSM displacements linearly over the entire breast volume. After determining the displacements at all the mesh nodes, the moving breast volume is registered to the target breast volume using an image-warping algorithm. In the second step, to correct for any residual mis-registration, displacements are estimated for a large number of corresponding surface points on the moving and the target breast images, already aligned in 3D, and the FEM model and the warping algorithm are applied again.
The registered data sets for the three subjects are available from the table below. MRI PET
Subject 1 MRI 1 PET 1Subject 2 MRI 2 PET 2Subject 3 MRI 3 PET 3
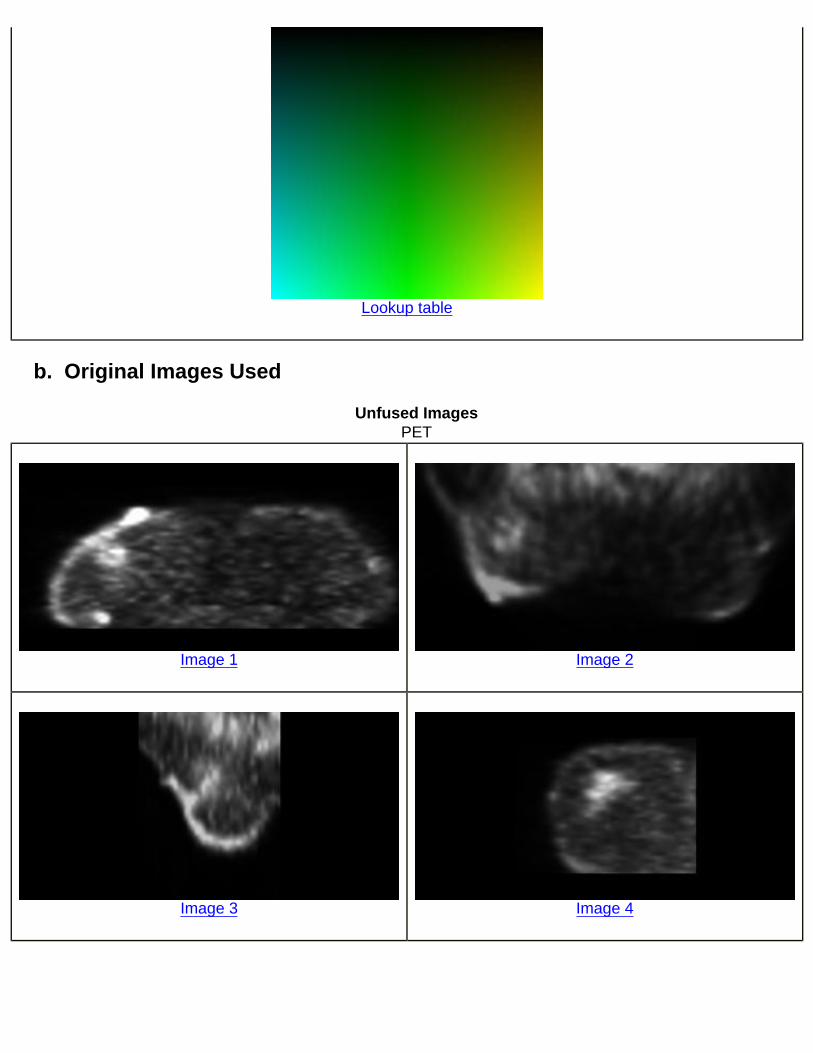
The above images are multi-page tiff files. After registration three orthogonal slices through a region of interest were selected from each data set for use in the study. The slices were extracted using the Fusion Viewer application [3, 4] and correspond to the standard views, coronal, sagittal, and axial. The regions of interest were selected to be regions containing above average metabolic activity. For subject 1 the slices were taken through a point in the upper right quadrant of the subject’s right breast (upper left quadrant of breast located on the left in the previously provided volume), for subject 2 the slices were taken through a point in the upper right quadrant of the subject’s right breast (upper left quadrant of breast located on the left in the previously provided volume), and for subject 3 the slices were taken through a point in the center of the subject’s left breast (center of breast located on the right in the previously provided volume). The fused images were then created using the Fusion Viewer application and previously created color tables.
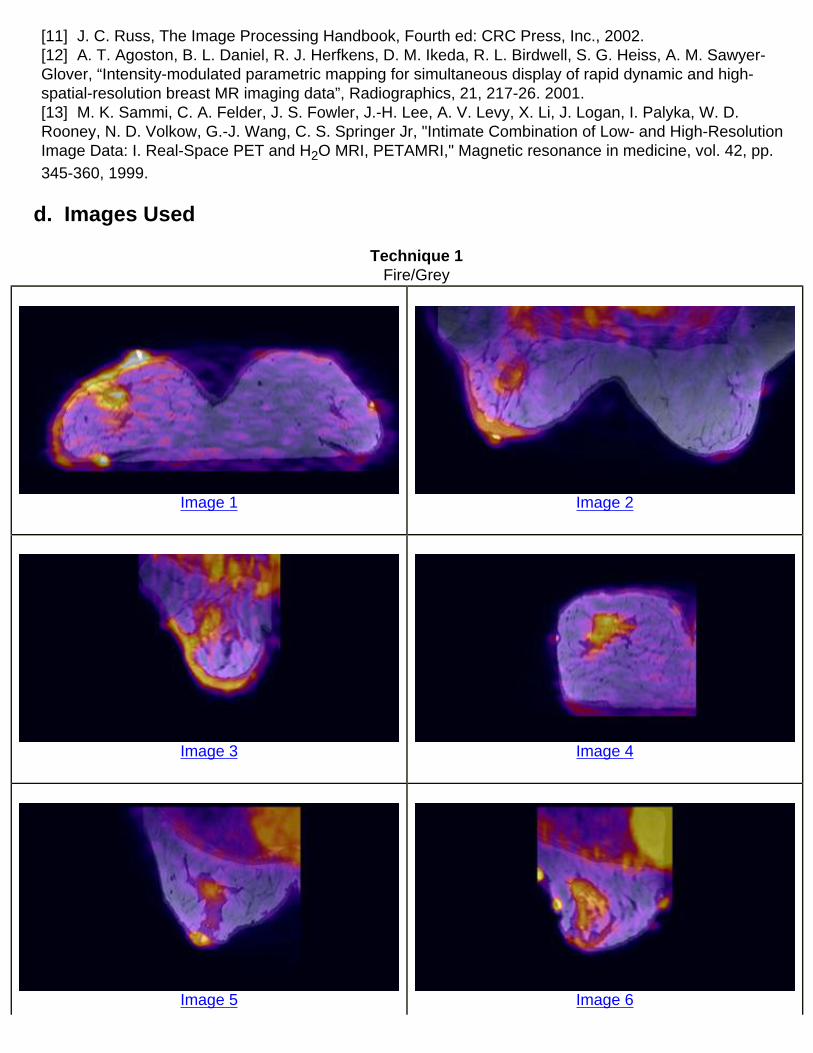
b. Fusion Techniques Studied Eight fusion techniques were selected for the study. Descriptions of them follow. 1) Fire/Grey
This color table was created by assigning Image J’s [5] fire color table to the PET image and a grayscale color table to the MRI image. Color was used for the PET and variations in intensity for the MRI because MRI is a higher resolution modality, and the human visual system is more sensitive the small changes in intensity than to small changes in color. This technique was selected for study due to its use in other research projects.
2) Red/BlueThis color table was created by assigning shades of blue to the PET image and shades of red to the MRI image. These colors were selected based on the opponent color theory. The basic assertion of opponent color theory is that red and blue are perceived separately and changes to one, will not affect the perceived amount of the other.
3) Red/GreenThe color table was created by assigning shades of red to the PET image and shades of green to the MRI image. It was selected for inclusion in the study because of its use in the Mayo Clinics Analyze software package [6].

4) Interlace
This fusion scheme combined images by taking alternating columns from each of the source images. For example, the first column of the fused image is the first column of the PET image, the second column of the fused image is the second column of the MRI image, the third column of the fused image is the third column of PET image, and so on. The PET image was first colored red. This technique was selected for the study because of its popularity in research literature [7-9].
5) Genetic 1 and 6) Genetic 2The two color tables were generated by a custom designed genetic algorithm. The algorithm searches for color tables that have high contrast, are uniform, and uses different colors for the MRI and PET data. See [10] for more information on the genetic algorithm.
7) HSVThe Hue, Saturation, Value (HSV) color space is a model designed to describe the way artists perceive color. Hue is the color, saturation is the amount of the color, and value is the intensity of the color. For this color table, the PET image was assigned to the hue, and the MRI image was assigned to the value. The saturation was kept constant. Like the Fire/Grey color table the MRI was used for the intensity, because of the human visual systems higher sensitivity for changes in intensity [11-13]. This color table was selected for study because its popularity.
8) HSV CGYThis color table is similar to the previously discussed HSV one except that it uses a constrained hue angle. Instead of allowing the color to vary over the entire spectrum color was only allowed to vary within the cyan to green to yellow (CGY) region [12]. Constraining the hue angle helps prevent false segmentation due to changes in color, and provides colors that appear to have a natural ordering to a human observer.
c. References
[1] I. Coman, A.Krol, D.Feiglin, E. Lipson, J. Mandel, K.G. Baum, M. Unlu, L. Wei, “Intermodality nonrigid breast-image registration,” IEEE International Symposium on Biomedical Imaging: From Nano to Macro, Arlington, VA, USA, 15-18 April 2004.[2] A. Krol, M.Z. Unlu, K. G. Baum, J. A. Mandel, W. Lee, I. L. Coman, E. D. Lipson, D. H. Feiglin; “MRI/PET Nonrigid Breast-Image Registration Using Skin Fiducial Markers”, Physica Medica European Journal of Medical Physics, Vol. XXI, Supplement 1, 2006.[3] KGB Technologies, KGB Fusion Viewer, http://www.kgbtechnologies.com/fusionviewer/.[4] K.G. Baum, M. Helguera, A. Krol, “A New Application for Displaying and Fusing Multimodal Data Sets,” Proc. SPIE Biomedical Optics, 6431: 64310Y, 2007.[5] NIH, ImageJ, Image Processing and Analysis in Java, http://rsb.info.nih.gov/ij/.[6] Mayo Clinic's Biomedical Imaging Resource, Analyze Software System, http://www.mayo.edu/bir/Software/Analyze/Analyze1NEW.html.[7] K. Rehm, S. C. Strother, J. R. Anderson, K. A. Schaper, D. A. Rottenberg, "Display of merged multimodality brain images using interleaved pixels with independent color scales," J Nucl Med, 35, 1815-21, 1994.[8] P. G. Spetsieris, V. Dhawan, T. Ishikawa, D. Eidelberg, "Interactive visualization of coregistered tomographic images," Biomedical Visualization Conference, Atlanta, GA, USA, 1995.[9] J. S. Lee, B. Kim, Y. Chee, C. Kwark, M. C. Lee, K. S. Park, “Fusion of coregistered cross-modality images using a temporally alternating display method”, Med. Biol. Eng. Comput., 38, 127-32. 2000.[10] K.G. Baum, M. Helguera, A. Krol, Genetic Algorithm Automated generation of Multivariate Color Tables for Visualization of Multimodal Medical Data Sets, Proc. of IS&T/SID’s Fourteenth Color Imaging Conference, 138-143, 2006.
[11] J. C. Russ, The Image Processing Handbook, Fourth ed: CRC Press, Inc., 2002.[12] A. T. Agoston, B. L. Daniel, R. J. Herfkens, D. M. Ikeda, R. L. Birdwell, S. G. Heiss, A. M. Sawyer-Glover, “Intensity-modulated parametric mapping for simultaneous display of rapid dynamic and high-spatial-resolution breast MR imaging data”, Radiographics, 21, 217-26. 2001.[13] M. K. Sammi, C. A. Felder, J. S. Fowler, J.-H. Lee, A. V. Levy, X. Li, J. Logan, I. Palyka, W. D. Rooney, N. D. Volkow, G.-J. Wang, C. S. Springer Jr, "Intimate Combination of Low- and High-Resolution Image Data: I. Real-Space PET and H2O MRI, PETAMRI," Magnetic resonance in medicine, vol. 42, pp. 345-360, 1999.
d. Images Used
Technique 1Fire/Grey
Image 1
Image 2
Image 3
Image 4
Image 5
Image 6

Image 7
Image 8
Image 9
Fire/Grey Example
Lookup table
Technique 2Red/Blue

Image 1
Image 2
Image 3
Image 4
Image 5
Image 6
Image 7
Image 8

Image 9
Red/Blue Example
Lookup table
Technique 3Red/Green
Image 1
Image 2
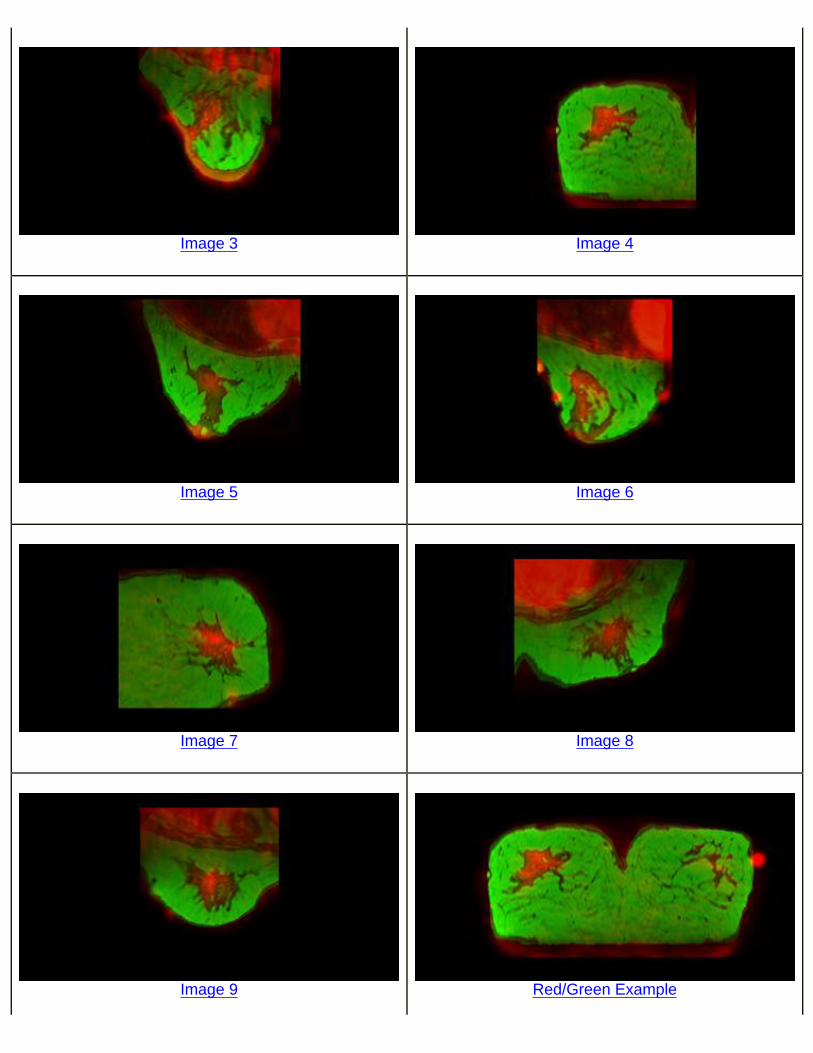
Image 3
Image 4
Image 5
Image 6
Image 7
Image 8
Image 9
Red/Green Example
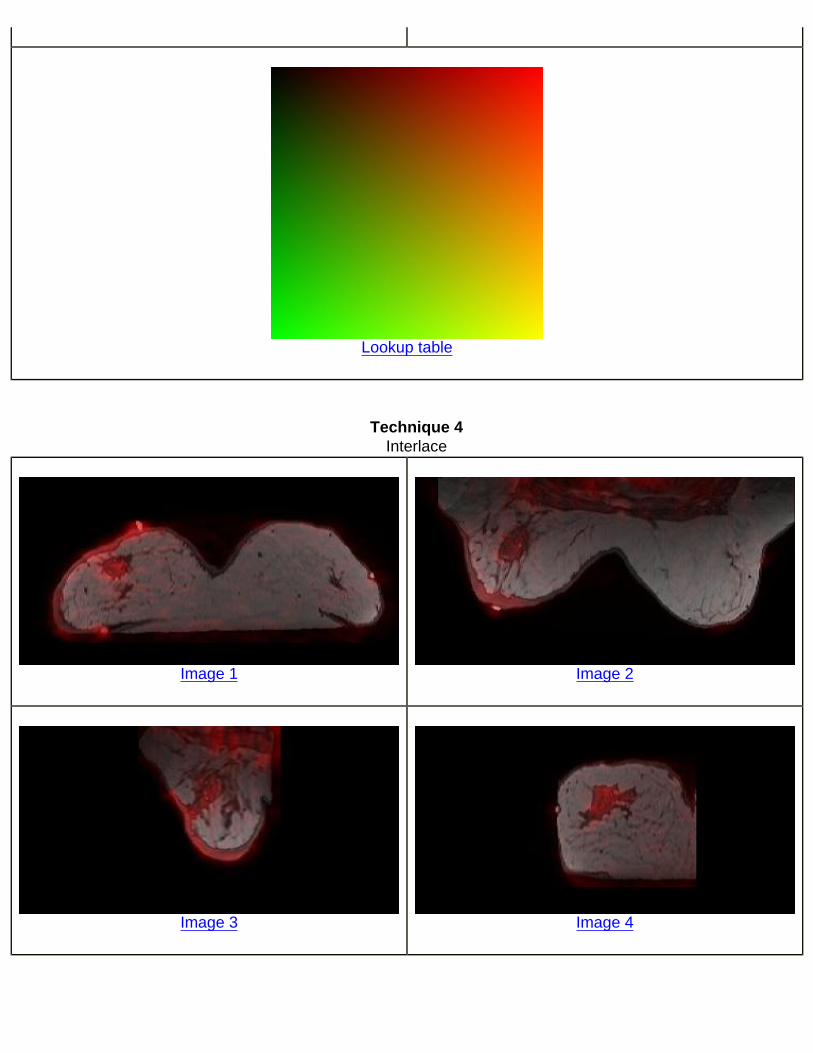
Lookup table
Technique 4Interlace
Image 1
Image 2
Image 3
Image 4
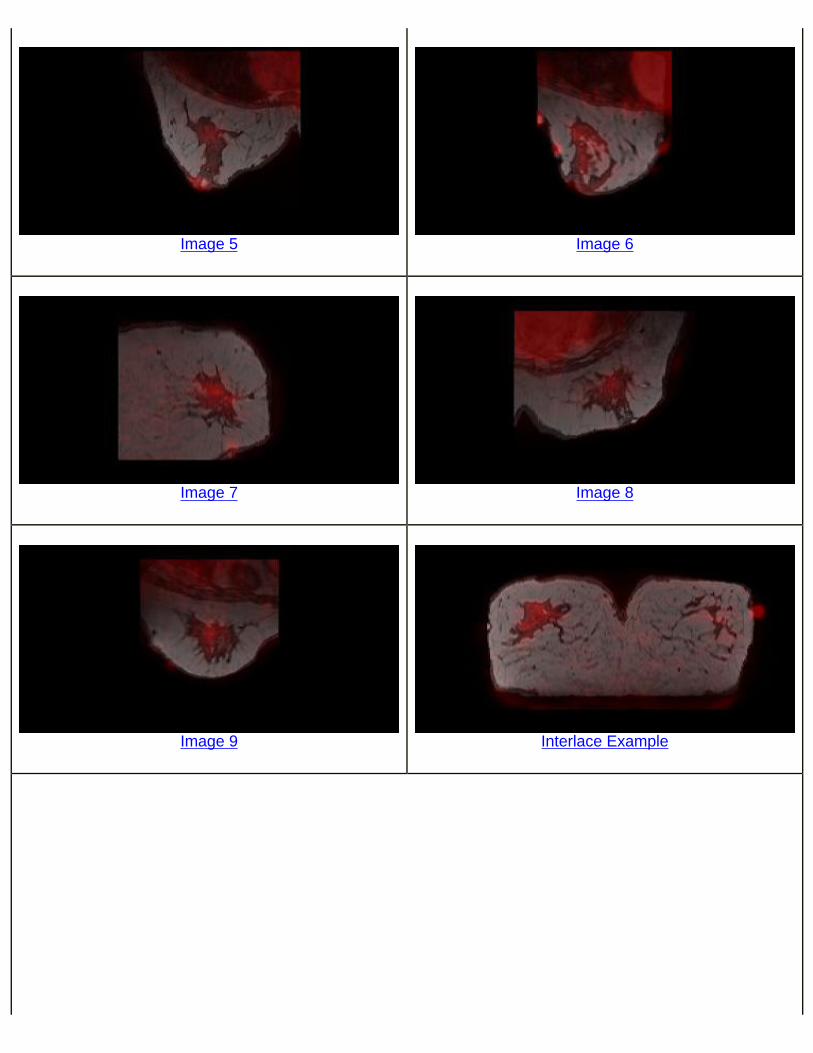
Image 5
Image 6
Image 7
Image 8
Image 9
Interlace Example

Lookup table
Technique 5Genetic 1
Image 1
Image 2
Image 3
Image 4
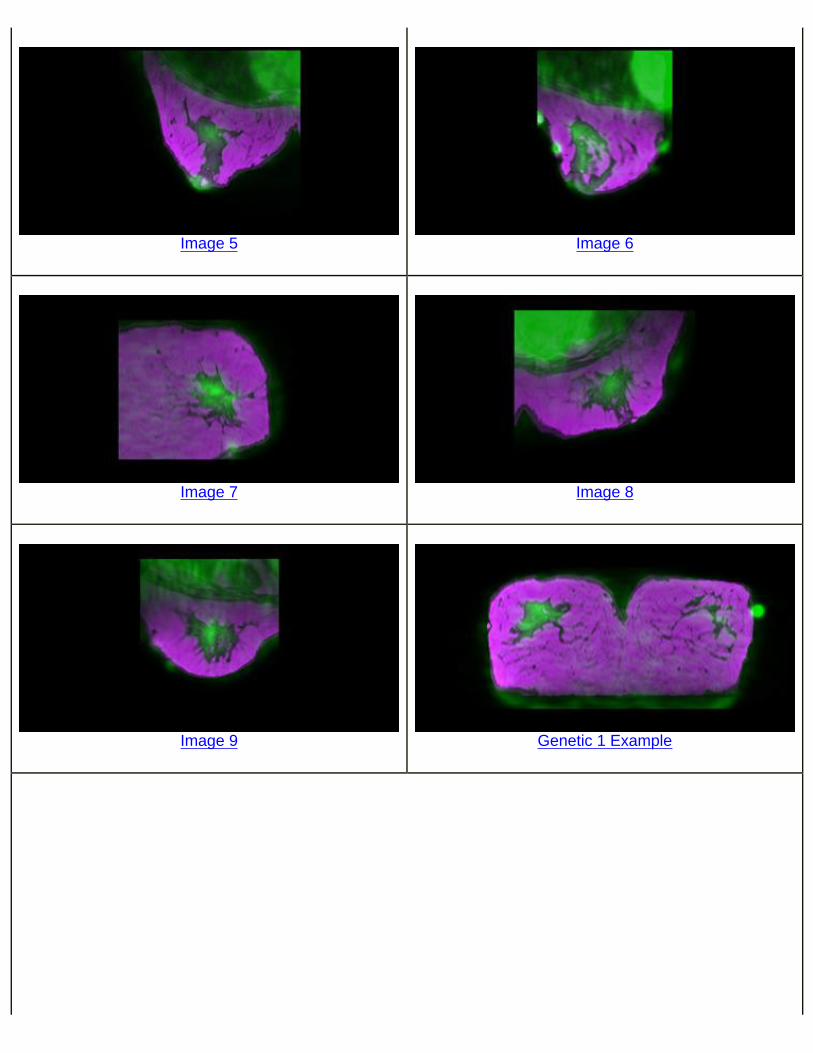
Image 5
Image 6
Image 7
Image 8
Image 9
Genetic 1 Example

Lookup table
Technique 6Genetic 2
Image 1
Image 2
Image 3
Image 4
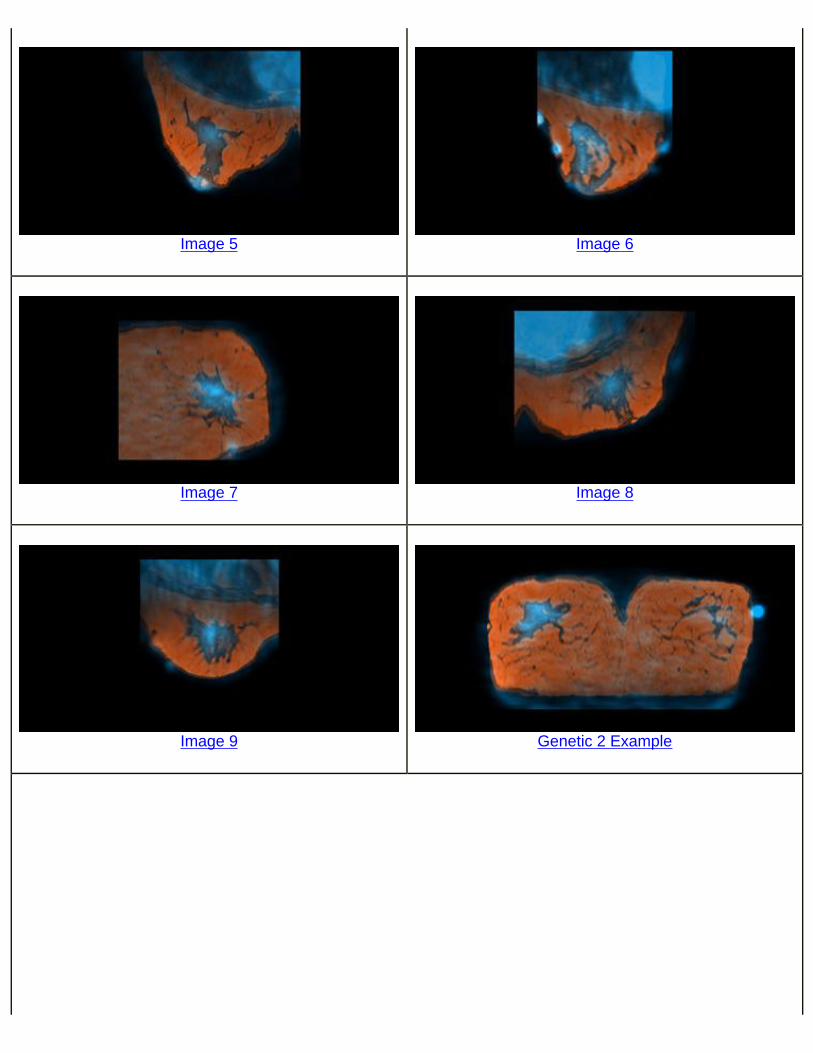
Image 5
Image 6
Image 7
Image 8
Image 9
Genetic 2 Example

Lookup table
Technique 7HSV
Image 1
Image 2
Image 3
Image 4

Image 5
Image 6
Image 7
Image 8
Image 9
HSV Example

Lookup table
Technique 8CGY HSV
Image 1
Image 2
Image 3
Image 4
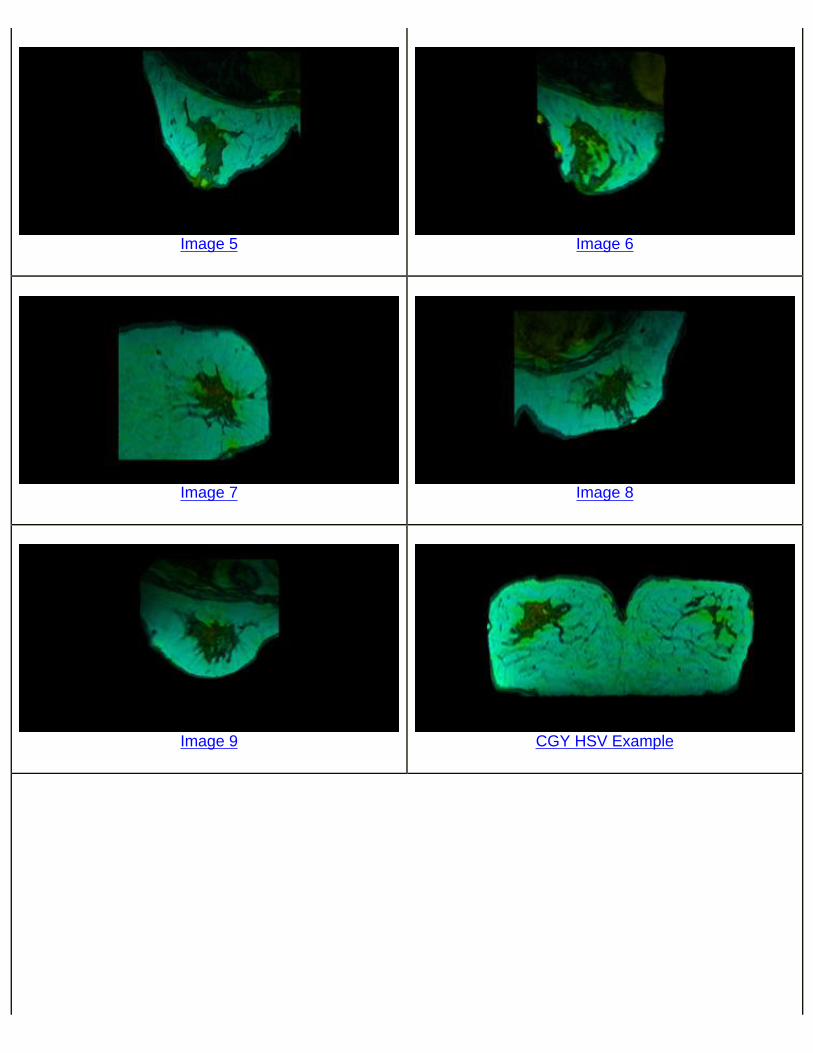
Image 5
Image 6
Image 7
Image 8
Image 9
CGY HSV Example
Lookup table
b. Original Images Used
Unfused ImagesPET
Image 1
Image 2
Image 3
Image 4

Image 5
Image 6
Image 7
Image 8
Image 9
PET Example
Lookup table
PET Stack
Unfused ImagesMRI
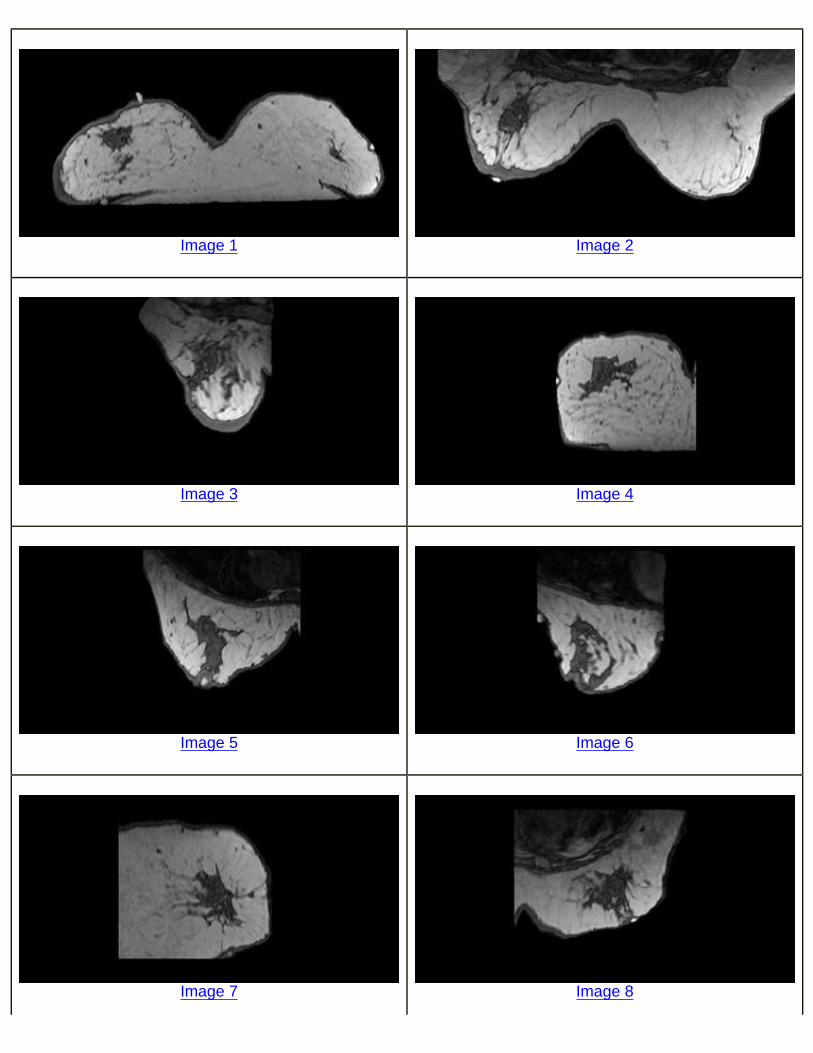
Image 1
Image 2
Image 3
Image 4
Image 5
Image 6
Image 7
Image 8

Image 9
MRI Example
Lookup table
MRI Stack
VII. Participants
The order of the participants below does not correspond to the observer numbers. Michele LisiCertification/Degrees: MD, ABR certified in diagnostic radiology and nuclear radiology Clinical Experience: 4 (in Nuclear Medicine)Position Title: Assistant Professor of Radiology
Daniel TamCertification/Degrees: MDClinical Experience: 1 (in Nuclear Medicine)Position Title: Fellow in Nuclear Medicine
Mary McGrathCertification/Degrees: MD, ABNM certifiedClinical Experience: 8 (in Nuclear Medicine)Position Title: Assistant Professor of Radiology
Mehr KhanCertification/Degrees: MDClinical Experience: 1 (in Nuclear Medicine)Position Title: Clinical Assistant Professor of Medicine
VIII. XML Definitions All of the data collected for this study was stored in XML files, and there was one file for each observer for each technique. The tables that follow specify each tag and its definition, or the data that it contains. Partial
samples of XML files is also shown below.
a. XML Files Created By Fuze.exe
Tag Name ContentsTechniques Outermost XML tag
Test Subject’s name, technique number, level of expertise, date, timeInstances Contains all of the Instance tags and the FinalRating tagInstance Contains the following tags: ID, Name, ImageFile, ColorTableFile, and TestResults
ID UnusedName Technique number and image number
ImageFile Location and name of the image fileColorTableFile Location and name of the color table file
TestResultsContains the following tags: TimeToClick, ImageClickPosX, ImageClickPosY,
ColorTableXVal, ColorTableYVal, ImageRating, and PointsTimeToClick Time (seconds) it took the subject to click on the image
ImageClickPosXX value where the subject clicked on the image, pixel coordinate with origin from upper left
corner of the image
ImageClickPosYY value where the subject clicked on the image, pixel coordinate with origin from upper left
corner of the image
ColorTableXValX value where the subject clicked on the color table, pixel coordinate with origin from upper
left corner of the image
ColorTableYValY value where the subject clicked on the color table, pixel coordinate with origin from upper
left corner of the imageImageRating Level of difficulty for the subject to perform the tasks
PointsContains all of the Point tags, set of points where the subject traced the metabolically active
regionPoint Contains each X and Y tags, single point along that trace
XSingle X value for a single point along trace, pixel coordinate with origin from upper left
corner of the image
YSingle Y value for a single point along trace, pixel coordinate with origin from upper left
corner of the imageFinalRating Contains the following tags: Comments, OpinionRating, and ColorRatingComments Comments from the subject for the particular technique
OpinionRating Level of comprehension of the given techniqueColorRating Level of preference of the given technique
Example of an XML file: <Techniques> <Test>Subject Name | Technique # | Expertise Level | Date Time</Test> <Instances> <Instance> <ID>0</ID> <Name>Technique # Image #</Name> <ImageFile>C:\Image File location.bmp</ImageFile> <ColorTableFile>C:\Color Table File location.bmp</ColorTableFile> <TestResults> <TimeToClick>6.09375</TimeToClick>

<ImageClickPosX>98</ImageClickPosX> <ImageClickPosY>99</ImageClickPosY> <ColorTableXVal>251</ColorTableXVal> <ColorTableYVal>96</ColorTableYVal> <ImageRating>3</ImageRating> <Points> <Point> <X>104</X> <Y>94</Y> </Point> </Points> </TestResults> </Instance> <FinalRating> <Comments>Type your comments here.</Comments> <OpinionRating>3</OpinionRating> <ColorRating>3</ColorRating> </FinalRating> </Instances></Techniques>
b. XML Files Created By Un-Fuze.exe
Tag Name ContentsInstances Contains all of the tags
Test Subject’s name, date, and timeInstance Contains the ID, PETImageFile, MRIImageFileFile, and TestResults tags
ID UnusedPETImageFile Location and name of the PET image fileMRIImageFile Location and name of the MRI image file
TestReslts Contains the PET and MRI tagsPET Contains the following tags: TimeToClickPET, PETCoordX, PETCoordY, PETLUTVal, and
PointsTimeToClickPET Time (seconds) it took the subject to click on the PET
PETCoordX X value where the subject clicked on the PET, pixel coordinate with origin from upper left corner of the image
PETCoordY Y value where the subject where the subject clicked on the PET, pixel coordinate with origin from upper left corner of the image
PETLUTVal The intensity of the point the subject clicked on the PET lookup tablePoints Contains all of the Point tags, set of points where the subject traced the metabolically active
regionPoint Contains each X and Y tags, single point along that trace
X Single X value for a single point along trace, pixel coordinate with origin from upper left corner of the image
Y Single Y value for a single point along trace, pixel coordinate with origin from upper left corner of the image
MRI Contains the following tags: TimeToClickMRI, MRICoordX, MRICoordY, MRILUTVal, and Points
TimeToClickMRI Time (seconds) it took the subject to click on the MRI

MRICoordX X value where the subject clicked on the MRI, pixel coordinate with origin from upper left corner of the image
MRICoordY Y value where the subject clicked on the MRI, pixel coordinate with origin from upper left corner of the image
MRILUTVal The intensity of the point the subject clicked on the MRI lookup table Example of an XML file:
<Instances> <Test>Subject Name | Ground Truth | Date Time</Test> <Instance> <ID>0</ID> <PETImageFile>C:\PET Image File location.bmp</PETImageFile> <MRIImageFile>C:\MRI Image File location.bmp</MRIImageFile> <TestReslts> <PET> <TimeToClickPET>15.90625</TimeToClickPET> <PETCoordX>129</PETCoordX> <PETCoordY>125</PETCoordY> <PETLUTVal>254</PETLUTVal> <Points> <Point> <X>132</X> <Y>132</Y> </Point> </Points> </PET> <MRI> <TimeToClickMRI>8.9375</TimeToClickMRI> <MRICoordX>133</MRICoordX> <MRICoordY>117</MRICoordY> <MRILUTVal>37</MRILUTVal> <Points> <Point> <X>137</X> <Y>125</Y> </Point> </MRI> </TestReslts> </Instance></Instances>
IX. XML Files
These files have been made anonymous.

Ground Truth
Subject 1Subject 2Subject 3Subject 4
Configuration Files
Subject 1Subject 2Subject 3Subject 4
Technique 1
Fire/Grey
Subject 1Subject 2Subject 3Subject 4
Technique 2Red/Blue
Subject 1Subject 2Subject 3Subject 4
Technique 3Red/Green
Subject 1Subject 2Subject 3Subject 4
Technique 4Interlace
Subject 2Subject 3Subject 4
Technique 5Genetic 1
Subject 1Subject 2Subject 3Subject 4
Technique 6Genetic 2
Subject 1Subject 2Subject 3Subject 4
Technique 7
HSV
Subject 1Subject 2Subject 3Subject 4
Technique 8CGY HSV
Subject 1Subject 2Subject 3Subject 4
X. IDL Documentation The code to import and analyze the XML files was written in IDL (interactive data language). IDL is a product of Research Systems Inc. (RSI) and ITT Industries. All of the IDL code can be found in the following folder called ‘IDL_Code.’
IDL_Code

The following are descriptions of the functions written to extract the information from the XML files. The Unfuse files were written to get information from the monotone MRI and PET portion of the study and its corresponding images, and the Fuse files were written to get information from the joint display portion of the study and its corresponding images.
a. Unfuse FUNCTION GET_DATE, filename, PRINTone Filename is the name of the XML file that the program will run. PRINTone will print, when true, the date from which the XML file was made. This function returns the date. FUNCTION GET_MRI_ALLPOINTS, filename, Image_number, PRINTone, PLOTone Filename is the name of the XML file that the program will run. Image_number is the image from the XML file that will obtain the MRI image X and Y points. When true, PRINTone will print the X and Y values from the MRI image number given. PLOTone plots the X and Y values to the screen. This function returns the X and Y values from where the subject traced the metabolically active region on the MRI image. FUNCTION GET_MRI_DISTANCE, filename, unfused_filename, image_number, PRINTone Filename is the name of the fused XML file that the program will run. Unfused_filename is the name of the unfused XML file that the program will run. Image_number is the image from the XML file that will obtain the X and Y values clicked on the fused image, and the X and Y values clicked on the MRI, respectively. PRINTone is the parameter that when true, will print the distance between the point clicked on the MRI and the point clicked on the fused image.This function returns the distance between the point clicked on the MRI and the point clicked on the fused image. FUNCTION GET_MRI_IMAGEFILE, filename, Image_number, PRINTone, PRINTtable Filename is the name of the XML file that the program will run. Image_number is the image from the XML file that will obtain the location of the MRI image file. PRINTone is the parameter that when true, will print the file location from the image number given. PRINTtable will print, when true, all of the image numbers and their corresponding file locations. This function returns the PET file locations. FUNCTION GET_MRI_LUT, filename, Image_number, PRINTone, PRINTtable Filename is the name of the XML file that the program will run. Image_number is the image from the XML file that will obtain the MRI image LUT (lookup table) value. PRINTone is the parameter that when true, will print the MRI LUT value from the image number given. PRINTtable will print, when true, all of the image numbers and their corresponding MRI LUT values. This function returns the MRI image lookup table value that the subject chose.
FUNCTION GET_MRI_TIME, filename, Image_number, PRINTone, PRINTtable Filename is the name of the XML file that the program will run. Image_number is the image from the XML file that will obtain the MRI time. When true, PRINTone will print the time from the image number given. When true, PRINTtable will pring all of the image numbers and their corresponding times. This function returns the time the subject took to click on the MRI image. FUNCTION GET_MRI_X_COORD, filename, Image_number, PRINTone, PRINTtable Filename is the name of the XML file that the program will run. Image_number is the image from the XML file that will obtain the X position on the MRI image clicked. PRINTone is the parameter that when true, will print the X value on the MRI image clicked, from the image number that was given. PRINTtable will print, when true, all of the image numbers and their corresponding X values on the MRI image clicked. This function returns the X values that the subject clicked on the MRI image. FUNCTION GET_MRI_XPOINTS, filename, Image_number, PRINTone Filename is the name of the XML file that the program will run. Image_number is the image from the XML file that will obtain the MRI image X points. When true, PRINTone will print the X values from the MRI image number given. This function returns the X values from where the subject traced the metabolically active region on the MRI image. FUNCTION GET_MRI_Y_COORD, filename, Image_number, PRINTone, PRINTtable Filename is the name of the XML file that the program will run. Image_number is the image from the XML file that will obtain the Y position on the MRI image clicked. PRINTone is the parameter that when true, will print the Y value on the MRI image clicked, from the image number that was given. PRINTtable will print, when true, all of the image numbers and their corresponding Y values on the MRI image clicked. This function returns the Y values that the subject clicked on the MRI image. FUNCTION GET_MRI_YPOINTS, filename, Image_number, PRINTone Filename is the name of the XML file that the program will run. Image_number is the image from the XML file that will obtain the MRI image Y points. When true, PRINTone will print the Y values from the MRI image number given. This function returns the Y values from where the subject traced the metabolically active region on the MRI image. FUNCTION GET_PET_ALLPOINTS, filename, Image_number, PRINTone, PLOTone Filename is the name of the XML file that the program will run. Image_number is the image from the XML file that will obtain the PET image X and Y points. When true, PRINTone will print the X and Y values from the PET image number given. PLOTone plots the X and Y values to the screen.

This function returns the X and Y values from where the subject traced the metabolically active region on the PET image. FUNCTION GET_PET_DISTANCE, filename, unfused_filename, image_number, PRINTone Filename is the name of the fused XML file that the program will run. Unfused_filename is the name of the unfused XML file that the program will run. Image_number is the image from the XML file that will obtain the X and Y values clicked on the fused image, and the X and Y values clicked on the PET, respectively. PRINTone is the parameter that when true, will print the distance between the point clicked on the PET and the point clicked on the fused image.This function returns the distance between the point clicked on the PET and the point clicked on the fused image. FUNCTION GET_PET_IMAGEFILE, filename, Image_number, PRINTone, PRINTtable Filename is the name of the XML file that the program will run. Image_number is the image from the XML file that will obtain the location of the PET image file. PRINTone is the parameter that when true, will print the file location from the image number given. PRINTtable will print, when true, all of the image numbers and their corresponding file locations. This function returns the PET file locations. FUNCTION GET_PET_LUT, filename, Image_number, PRINTone, PRINTtable Filename is the name of the XML file that the program will run. Image_number is the image from the XML file that will obtain the PET image LUT (lookup table) value. PRINTone is the parameter that when true, will print the PET LUT value from the image number given. PRINTtable will print, when true, all of the image numbers and their corresponding PET LUT values. This function returns the PET image lookup table value that the subject chose. FUNCTION GET_PET_TIME, filename, Image_number, PRINTone, PRINTtable Filename is the name of the XML file that the program will run. Image_number is the image from the XML file that will obtain the PET time. When true, PRINTone will print the time from the image number given. When true, PRINTtable will pring all of the image numbers and their corresponding times. This function returns the time the subject took to click on the PET image. FUNCTION GET_PET_X_COORD, filename, Image_number, PRINTone, PRINTtable Filename is the name of the XML file that the program will run. Image_number is the image from the XML file that will obtain the X position on the PET image clicked. PRINTone is the parameter that when true, will print the X value on the PET image clicked, from the image number that was given. PRINTtable will print, when true, all of the image numbers and their corresponding X values on the PET image clicked. This function returns the X values that the subject clicked on the PET image. FUNCTION GET_PET_XPOINTS, filename, Image_number, PRINTone

Filename is the name of the XML file that the program will run. Image_number is the image from the XML file that will obtain the PET image X points. When true, PRINTone will print the X values from the PET image number given. This function returns the X values from where the subject traced the metabolically active region on the PET image. FUNCTION GET_PET_Y_COORD, filename, Image_number, PRINTone, PRINTtable Filename is the name of the XML file that the program will run. Image_number is the image from the XML file that will obtain the Y position on the PET image clicked. PRINTone is the parameter that when true, will print the Y value on the PET image clicked, from the image number that was given. PRINTtable will print, when true, all of the image numbers and their corresponding Y values on the PET image clicked. This function returns the Y values that the subject clicked on the PET image. FUNCTION GET_PET_YPOINTS, filename, Image_number, PRINTone Filename is the name of the XML file that the program will run. Image_number is the image from the XML file that will obtain the PET image Y points. When true, PRINTone will print the Y values from the PET image number given.This function returns the Y values from where the subject traced the metabolically active region on the PET image. FUNCTION GET_SUBJECT_NAME, filename, PRINTone Filename is the name of the XML file that the program will run. PRINTone is the parameter that when true, will print the name of the subject who completed the file that was given.This function returns the subject name. FUNCTION MRI_DISTANCE_VS_IMAGE_NUMBER, PRINTone, PLOTone, completeAverage PRINTone is the parameter that when true, will print the distance between the point clicked on the fused image and the point clicked on the MRI, which was obtained by the functions GET_SUBJECT_NAME and GET_MRI_DISTANCE. PLOTone is the parameter that when true, will plot the MRI distance versus image number. CompleteAverage is the parameter that when true, will average each technique and plot MRI distance versus technique. FUNCTION PET_DISTANCE_VS_IMAGE_NUMBER, PRINTone, PLOTone, completeAverage PRINTone is the parameter that when true, will print the distance between the point clicked on the fused image and the point clicked on the PET, which was obtained by the functions GET_SUBJECT_NAME and GET_PET_DISTANCE. PLOTone is the parameter that when true, will plot the PET distance versus image number. CompleteAverage is the parameter that when true, will average each technique and plot PET distance versus technique.
b. Fuse

FUNCTION COLOR, x, y, ImageName X is the value that is returned from the function GET_IMAGE_CLICKPOSX, and Y is the value that is returned from the function GET_IMAGECLICKPOSY. ImageName is a filename that is returned from the function GET_IMAGEFILE.This function returns an RGB color. FUNCTION COLORDISTANCE, PRINTone, PLOTone, completeAverage PRINTone is the parameter that when true, will print the physical distance between the color clicked on the MRI or PET image and the color clicked on the color table. PLOTone is the parameter that when true, will plot the color distance (in pixels) versus image number. CompleteAverage is the parameter that when true, will average each technique and will plot color distance versus technique. FUNCTION COMPREHENSION, PRINTone, PLOTone, completeAverage PRINTone is the parameter that when true, will print the comprehension, which was obtained by the function GET_OPINION_RATING. PLOTone is the parameter that when true, will plot comprehension versus image number. CompleteAverage is the parameter that when true, will average each technique and plot comprehension versus technique. FUNCTION DIFFICULTY_VS_IMAGE_NUMBER, PRINTone, PLOTone, completeAverage PRINTone is the parameter that when true, will print the difficulty, which was obtained by the function GET_IMAGERATING. PLOTone is the parameter that when true, will plot difficulty versus image number. CompleteAverage is the parameter that when true, will average each technique and plot difficulty versus technique. FUNCTION DIFFICULTY_VS_POSITION, PRINTone, PLOTone PRINTone is the parameter that when true, will print the difficulty, which was obtained by the function GET_IMAGERATINGP. PLOTone is the parameter that when true, will plot difficulty versus position. This function returns the difficulty. FUNCTION DISTANCE, filename, image_number, PRINTone This function includes the following functions: GET_IMAGECLICKPOSX, GET_IMAGECLICKPOSY, GET_IMAGEFILE, COLOR, GET_COLORTABLEFILE, WHERE_COLOR, GET_COLORTABLEX, and GET_COLORTABLEY. Filename is the name of the file that is passed to the other functions, which is the name of the XML file that the program will run. Image_number is the image from the XML file from which the data will be obtained. PRINTone is the parameter that when true, will print the physical distance between the color clicked on the MRI or PET image and the color clicked on the color table. This function returns the physical color distance between the color clicked on the MRI or PET image and the color clicked on the color table.

FUNCTION DISTANCE_BETWEEN_COLORS, filename, image_number, PRINTone This function includes the following functions: GET_IMAGECLICKPOSX, GET_IMAGECLICKPOSY, GET_IMAGEFILE, COLOR, GET_COLORTABLEFILE, GET_COLORTABLEX, GET_COLORTABLEY, RGB_to_XYZ, and XYZ_TO_LAB. Filename is the name of the file that is passed to the other functions, which is the name of the XML file that the program will run. Image_number is the image from the XML file from which the data will be obtained. PRINTone is the parameter that when true, will print the distance.This function returns the distance between the actual color on the color table and the color clicked on the color table. DISTANCEBETWEENCOLORS, PRINTone, PLOTone, completeAverage PRINTone is the parameter that when true, will print the actual color distance, which was obtained by the function DISTANCE_BETWEEN_COLORS. PLOTone is the parameter that when true, will plot the color distance versus image number. CompleteAverage is the parameter that when true, will average each technique and plot the distance between the actual color on the color table and the color clicked on the color table versus technique. FUNCTION GET_ALL_POINTS, filename, Image_number, PRINTone, PLOTone Filename is the name of the XML file that the program will run. Image number is the image from the XML file that will pull out the corresponding points. PRINTone is the parameter that when true will print an array of X and Y. PLOTone will plot, when true, X and Y.This function returns all of the points where the subject clicked on the image from the image number given. FUNCTION GET_ALL_POINTSP, filename, position_number, PRINTone, PLOTone Filename is the name of the XML file that the program will run. Position number is the given position in the XML file that will pull out the corresponding points. PRINTone is the parameter that when true, will print an array of X and Y. PLOTone will plot, when true, X and Y. This function returns an array of the X and Y values. FUNCTION GET_COLOR_RATING, filename Filename is the name of the XML file that the program will run.This function returns the color rating that the subject chose after completing the technique. FUNCTION GET_ColorTableALL, filename, Image_number, PRINTone, PRINTtable Filename is the name of the XML file that the program will run. Image_number is the image from the XML file that will obtain the X and Y positions on the color table. PRINTone is the parameter that when true, will print the color table X and Y values from the image number given. PRINTtable will print, when true, all of the image numbers and their corresponding color table X and Y values.This function returns the X and Yvalues where the subject clicked on the color table.

FUNCTION GET_COLORTABLEFILE, filename, Image_number, PRINTone, PRINTtable Filename is the name of the XML file that the program will run. Image_number is the image from the XML file that will obtain the name of the color table file. PRINTone is the parameter that when true, will print the color table name from the image number chosen. PRINTtable will print, when true, all of the image numbers and their corresponding color table file names. This function returns the color table file locations. FUNCTION GET_COLORTABLEFILEP, filename, position_number, PRINTone, PRINTtable Filename is the name of the XML file that the program will run. Position_number is the given position in the XML file that will obtain the name of the color table file. PRINTone is the parameter that when true, will print the color table name from the position in the file. PRINTtable will print, when true, all of the positions and their corresponding color table file names. This function returns the color table file locations. FUNCTION GET_ColorTableX, filename, Image_number, PRINTone, PRINTtable Filename is the name of the XML file that the program will run. Image_number is the image from the XML file that will obtain the X position on the color table. PRINTone is the parameter that when true will print the color table X value from the image number given. PRINTtable will print, when true, all of the image numbers and their corresponding color table X values. This function returns the X values where the subject clicked on the color table. FUNCTION GET_ColorTableXP, filename, position_number, PRINTone, PRINTtable Filename is the name of the XML file that the program will run. Position_number is the given position in the XML file that will obtain the X position on the color table. PRINTone is the parameter that when true, will print the color table X value from the given position. PRINTtable will print, when true, all of the positions and their corresponding color table X values. This function returns the X values where the subject clicked on the color table. FUNCTION GET_ColorTableY, filename, Image_number, PRINTone, PRINTtable Filename is the name of the XML file that the program will run. Image_number is the image from the XML file that will obtain the Y position on the color table. PRINTone is the parameter that when true, will print the color table Y value from the image number given. PRINTtable will print, when true, all of the image numbers and their corresponding color table Y values. This function returns the Y values where the subject clicked on the color table. FUNCTION GET_ColorTableYP, filename, position_number, PRINTone, PRINTtable Filename is the name of the XML file that the program will run. Position_number is the given position in the XML file that will obtain the Y position on the color table. PRINTone is the parameter that when true, will print the color table Y value from the given position. PRINTtable will print, when true, all of the positions

and their corresponding color table Y values. This function returns the Y values where the subject clicked on the color table. FUNCTION GET_COMMENTS, filename, PRINTone Filename is the name of the XML file that the program will run. PRINTone will print, when true, the comments of the given XML file. This function returns the comments that the subject wrote from the file given. FUNCTION GET_DATE, filename, PRINTone Filename is the name of the XML file that the program will run. PRINTone will print, when true, the date from which the XML file was made. This function returns the date. FUNCTION GET_DIFFERENCE, filename, image_number, PRINTone, PRINTtable Filename is the name of the XML file that the program will run. Image_number is the image from the XML file that will obtain the X and Y positions on the color table. PRINTone is the parameter that when true, will print the color table X and Y values from the image number given. PRINTtable will print, when true, all of the image numbers and their corresponding color table X and Y values. This function returns the X and Y values where the subject clicked on the color table. FUNCTION GET_EXPERTISE, filename, PRINTone Filename is the name of the XML file that the program will run. PRINTone will print, when true, the subject expertise from the given XML file. This function returns the subject expertise. FUNCTION GET_ID, filename, Image_number, PRINTone, PRINTtable Filename is the name of the XML file that the program will run. Image_number is the image from the XML file that will obtain the ID number from each image. PRINTone is the parameter that when true, will print the ID number from the image number given. PRINTtable will print, when true, all of the image numbers and their corresponding ID numbers. This function returns the ID numbers. FUNCTION GET_IMAGECLICKPOSX, filename, Image_number, PRINTone, PRINTtable Filename is the name of the XML file that the program will run. Image_number is the image from the XML file that will obtain the X position on the image clicked. PRINTone is the parameter that when true, will print the X value on the image clicked, from the image number that was given. PRINTtable will print, when true, all of the image numbers and their corresponding X values on the image clicked. This function returns the X values that the subject clicked on the fused image.

FUNCTION GET_IMAGECLICKPOSXP, filename, position_number, PRINTone, PRINTtable Filename is the name of the XML file that the program will run. Position_number is the given position in the XML file that will obtain the X position on the image clicked. PRINTone is the parameter that when true, will print the X value on the image clicked, from the position that was given. PRINTtable will print, when true, the image numbers and their corresponding X values on the image clicked. This function returns the X values that the subject clicked on the fused image. FUNCTION GET_IMAGECLICKPOSY, filename, Image_number, PRINTone, PRINTtable Filename is the name of the XML file that the program will run. Image_number is the image from the XML file that will obtain the Y position on the image clicked. PRINTone is the parameter that when true, will print the Y value on the image clicked, from the image number that was given. PRINTtable will print, when true, all of the image numbers and their corresponding Y values on the image clicked. This function returns the Y values that the subject clicked on the fused image. FUNCTION GET_IMAGECLICKPOSYP, filename, position_number, PRINTone, PRINTtable Filename is the name of the XML file that the program will run. Position_number is the given position in the XML file that will obtain the Y position on the image clicked. PRINTone is the parameter that when true, will print the Y value on the image clicked, from the position that was given. PRINTtable will print, when true, all of the positions and their corresponding Y values on the image clicked. This function returns the Y values that the subject clicked on the fused image. FUNCTION GET_IMAGEFILE, filename, Image_number, PRINTone, PRINTtable Filename is the name of the XML file that the program will run. Image_number is the image from the XML file that will obtain the location of the file. PRINTone is the parameter that when true, will print the file location from the image number given. PRINTtable will print, when true, all of the image numbers and their corresponding file locations. This function returns the image file name. FUNCTION GET_IMAGEFILEP, filename, position_number, PRINTone, PRINTtable Filename is the name of the XML file that the program will run. Position_number is the given position in the XML file that will obtain the location of the file. PRINTone is the parameter that when true, will print the file location from the position number given. PRINTtable will print, when true, all of the positions and their corresponding file locations. This function returns the file locations. FUNCTION GET_ImageRating, filename, Image_number, PRINTone, PRINTtable Filename is the name of the XML file that the program will run. Image_number is the image from the XML file that will obtain the image rating. PRINTone is the parameter that when true, will print the image rating from the image number given. PRINTtable will print, when true, all of the image numbers and their

corresponding image ratings. This function returns the image rating, chosen by the subject. FUNCTION GET_NAME, filename, Image_number, PRINTone, PRINTtable Filename is the name of the XML file that the program will run. Image_number is the image from the XML file that will obtain the name of the technique and image number. PRINTone is the parameter that when true, will print the technique and image number from the image number given. PRINTtable will print, when true, all of the image numbers and their corresponding technique and image numbers.This function returns the name of the technique and image numbers. FUNCTION GET_NAMEP, filename, position_number, PRINTone, PRINTtable Filename is the name of the XML file that the program will run. Position_number is the given position from the XML file that will obtain the name of the technique and image number. PRINTone is the parameter that when true, will print the technique and image number from the position number given. PRINTtable will print, when true, all of the image numbers and their corresponding technique and image numbers.This function returns the name of the technique and image numbers. FUNCTION GET_OPINION_RATING, filename Filename is the name of the XML file that the program will run.This function returns the opinion rating, which was chosen by the subject at the end of a technique. FUNCTION GET_SUBJECT_NAME, filename, PRINTone Filename is the name of the XML file that the program will run. PRINTone is the parameter that when true, will print the name of the subject who completed the file that was given. This function returns the subject name. FUNCTION GET_TECHNIQUE_NUMBER, filename, PRINTone Filename is the name of the XML file that the program will run. PRINTone is the parameter that when true, will print the technique number of the file given. This function returns the technique number. FUNCTION GET_TEST_NAME, filename, Image_number, PRINTone, PRINTtable Filename is the name of the XML file that the program will run. Image_number is the image from the XML file that will obtain the test name. When true, PRINTone will print the test name from the image number given. When true, PRINTtable will print all of the image numbers and their corresponding test names. This function returns the test names, which contains the name of the subject, technique number, level of expertise, and the time and date which the file was saved.

FUNCTION GET_TIME, filename, Image_number, PRINTone, PRINTtable Filename is the name of the XML file that the program will run. Image_number is the image from the XML file that will obtain the time. When true, PRINTone will print the time from the image number given. When true, PRINTtable will print all of the image numbers and their corresponding times. This function returns the time the subject took to click on the fused image. FUNCTION GET_TIMEP, filename, position_number, PRINTone, PRINTtable Filename is the name of the XML file that the program will run. Position_number is the given position from the XML file that will obtain the time. When true, PRINTone will print the time from the position number given. When true, PRINTtable will print the image numbers and their corresponding times. This function returns the time the subject took to click on the fused image. FUNCTION GET_UNFUSED_DISTANCE, filename, image_number, PRINTone This function includes the following functions: GET_PET_X_COORD, GET_PET_Y_COORD, GET_MRI_X_COORD, and GET_MRI_Y_COORD. Filename is the name of the file that is passed to the other functions, which is the name of the XML file that the program will run. Image_number is the image from the XML file from which the data will be obtained. PRINTone is the parameter that when true, will print the distance between the point clicked on the MRI and the point clicked on the PET.This function returns the distance between the point clicked on the MRI and the point clicked on the PET. FUNCTION GET_XPOINTS, filename, Image_number, PRINTone Filename is the name of the XML file that the program will run. Image_number is the image from the XML file that will obtain the X points. When true, PRINTone will print the X values from the image number given. This function returns the X values from where the subject traced the metabolically active region on the fused image. FUNCTION GET_XPOINTSP, filename, position_number, PRINTone Filename is the name of the XML file that the program will run. Position_number is the given position from the XML file that will obtain the X points. When true, PRINTone will print the X values from the position number given. This function returns the X values from where the subject traced the metabolically active region on the fused image. FUNCTION GET_YPOINTS, filename, Image_number, PRINTone Filename is the name of the XML file that the program will run. Image_number is the image from the XML file that will obtain the Y points. When true, PRINTone will print the Y values from the image number given. This function returns the Y values from where the subject traced the metabolically active region on the fused image.
FUNCTION GET_YPOINTSP, filename, position_number, PRINTone Filename is the name of the XML file that the program will run. Position_number is the given position from the XML file that will obtain the Y points. When true, PRINTone will print the Y values from the position number given. This function returns the Y values from where the subject traced the metabolically active region on the fused image. FUNCTION PREFERENCE, PRINTone, PLOTone, completeAverage PRINTone is the parameter that when true, will print the preference of the technique, which was obtained by the function GET_COLOR_RATING. PLOTone is the parameter that when true, will plot the preference versus image number. CompleteAverage is the parameter that when true, will average each technique and plot preference versus technique. FUNCTION RGB_to_XYZ, c c is the parameter that is returned by the function COLOR. This function converts RGB to CIE XYZ color space coordinates and returns that value. FUNCTION TIME_VS_IMAGE_NUMBER, PRINTone, PLOTone PRINTone is the parameter that when true, will print the time the subject took to click on the fused image, which was obtained by the function GET_TIME. PLOTone is the parameter that when true, will plot time versus image number. FUNCTION TIME_VS_POSITION, PRINTone, PLOTone PRINTone is the parameter that when true, will print the time the subject took to click on the fused image, which was obtained by the function GET_TIME. PLOTone is the parameter that when true, will plot time versus position. FUNCTION UNFUSED_DISTANCE_VS_IMAGE_NUMBER, PRINTone, PLOTone PRINTone is the parameter that when true, will print the distance between the point clicked on the MRI and the point clicked on the PET, which was obtained by the function GET_UNFUSED_DISTANCE. PLOTone is the parameter that when true, will plot the unfused distance versus image number. FUNCTION WHERE_COLOR, c, LUTname C is the parameter that is returned by the function COLOR. LUTname is the parameter that is returned by the function GET_COLORTABLEFILE.This function returns the CIE L*a*b color.

FUNCTION XYZ_to_LAB, xyz Xyz is the parameter returned by the function RGB_to_XYZ.This function converts CIE XYZ color space coordinates to CIE L*a*b color space coordinates.
XI. Graphs The links underneath each graph point to the associated IDL iPlot. IDL iPlots provide a customizable way to examine the plotted data. All the error bars represent the standard error.
a. Color Difference
i. Plots for each Individual
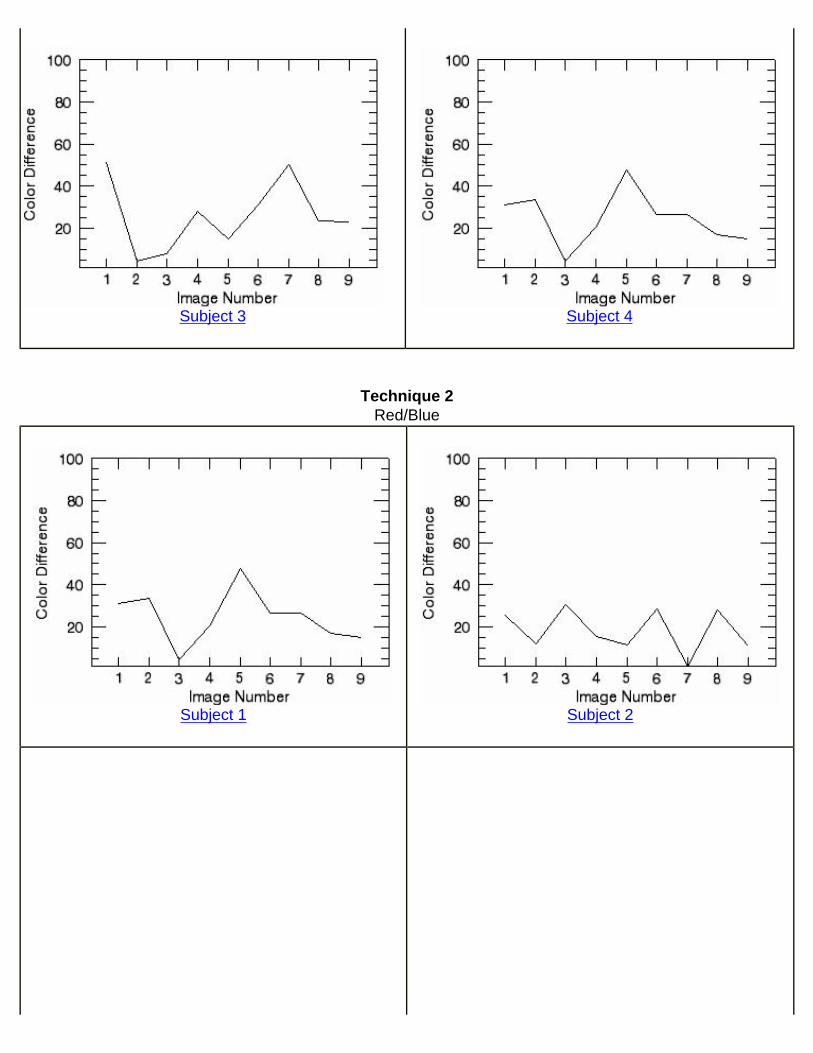
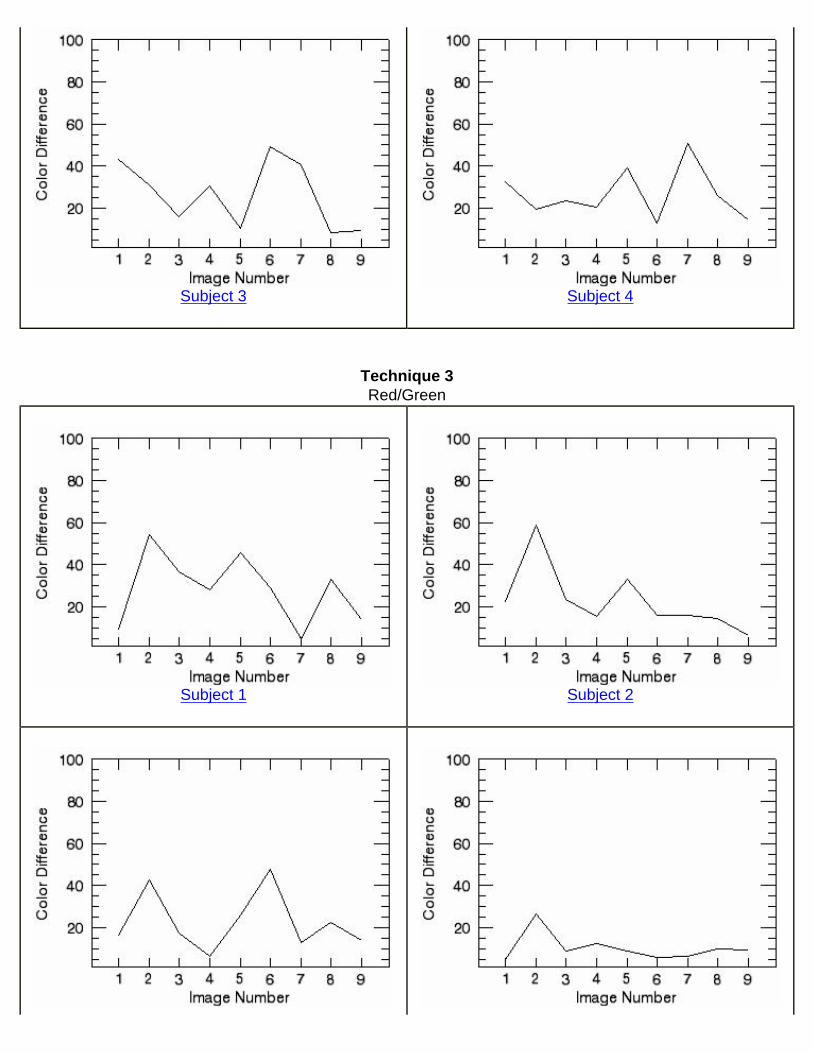
These graphs represent the color difference, which is the difference in color between the color on the color table that the subject clicked and the correct color that represents the most metabolically active region previously selected by the observer. The difference in colors is determined by the distance between them in the CIE L*a*b color space. For each technique there are graphs for each of the four subjects. Technique 4 is excluded since due to its interlacing it has the same color at multiple locations on its color table.
Technique 1
Fire/Grey
Subject 1
Subject 2
Subject 3
Subject 4
Technique 2Red/Blue
Subject 1
Subject 2
Subject 3 Subject 4
Technique 3Red/Green
Subject 1
Subject 2

Subject 3 Subject 4
Technique 5Genetic 1
Subject 1
Subject 2
Subject 3
Subject 4
Technique 6Genetic 2

Subject 1
Subject 2
Subject 3
Subject 4
Technique 7HSV

Subject 1
Subject 2
Subject 3
Subject 4
Technique 8CGY HSV
Subject 1
Subject 2
Subject 3
Subject 4
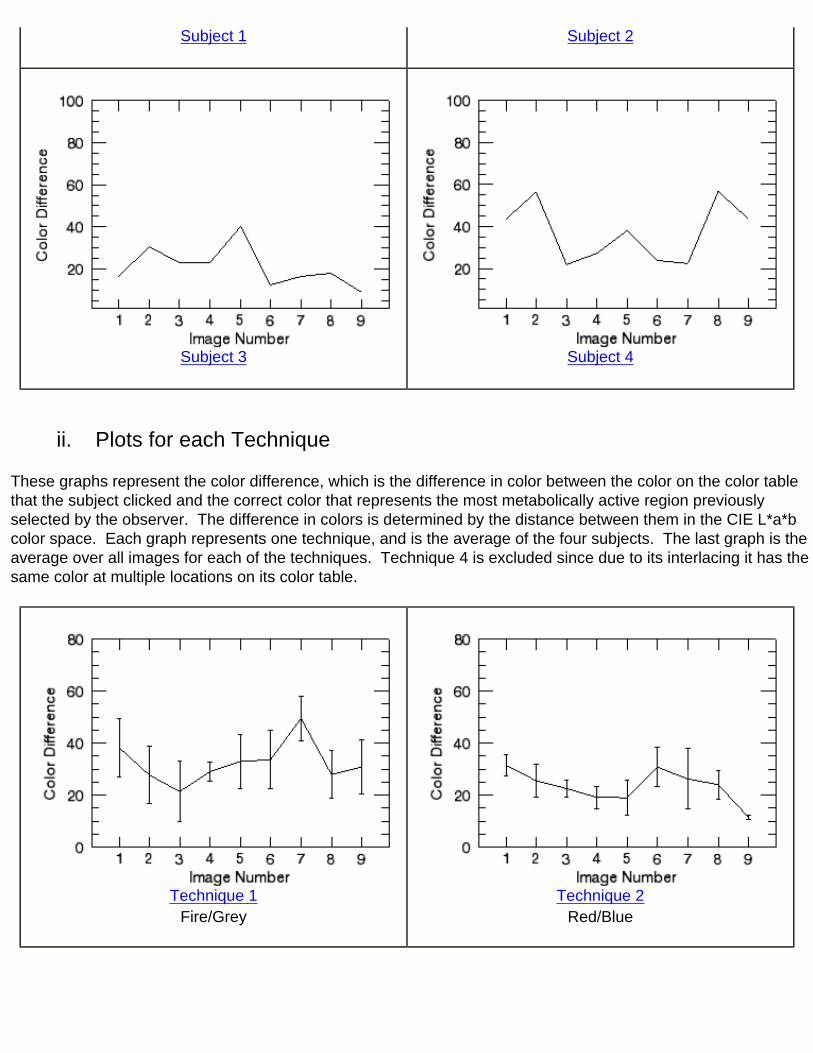
ii. Plots for each Technique These graphs represent the color difference, which is the difference in color between the color on the color table that the subject clicked and the correct color that represents the most metabolically active region previously selected by the observer. The difference in colors is determined by the distance between them in the CIE L*a*b color space. Each graph represents one technique, and is the average of the four subjects. The last graph is the average over all images for each of the techniques. Technique 4 is excluded since due to its interlacing it has the same color at multiple locations on its color table.
Technique 1Fire/Grey
Technique 2Red/Blue

Technique 3Red/Green
Technique 5Genetic 1
Technique 6Genetic 2

Technique 7HSV
Technique 8CGY HSV
Average
b. Comprehension
These graphs represent the level of comprehension that each subject chose for each of the 8 techniques. The comprehension was based on a 1 to 5 scale, where 1 represents no understanding and 5 represents excellent understanding. There are 4 graphs, one for each subject, and the last graph represents the average of all of the subjects.

Subject 1
Subject 2
Subject 3
Subject 4
Average of all 4 subjects

c. Difficulty vs. Image Number
i. Plots for each Individual
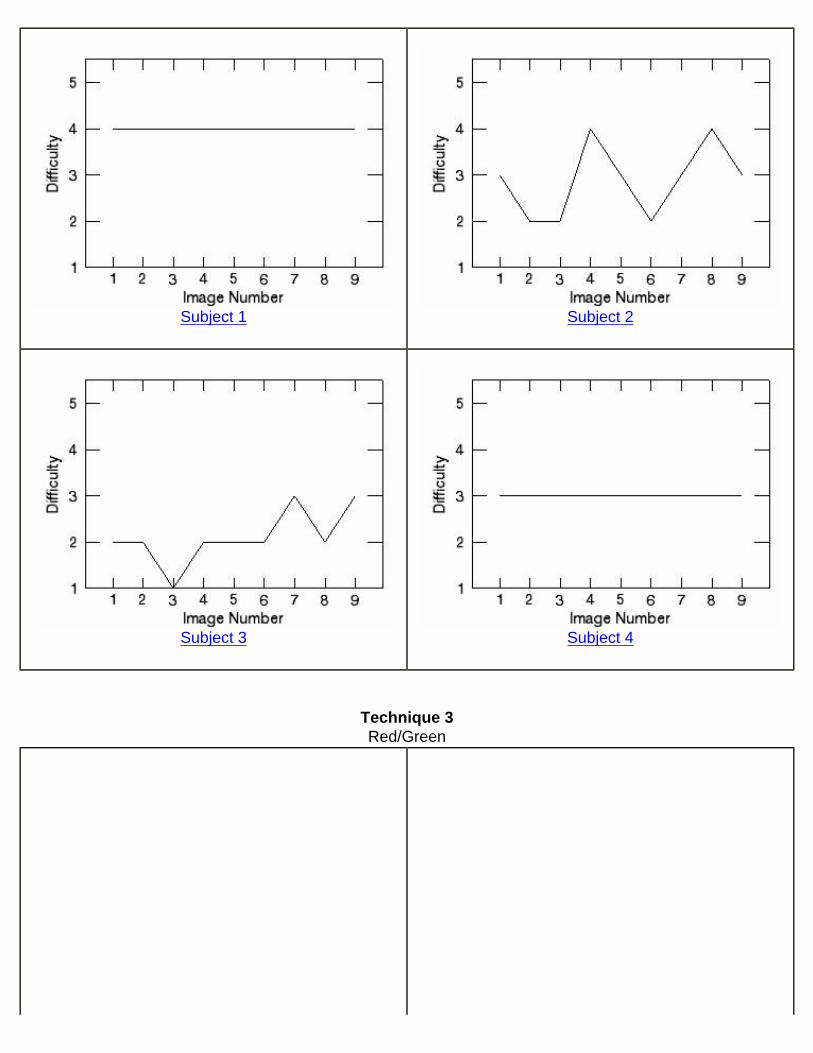
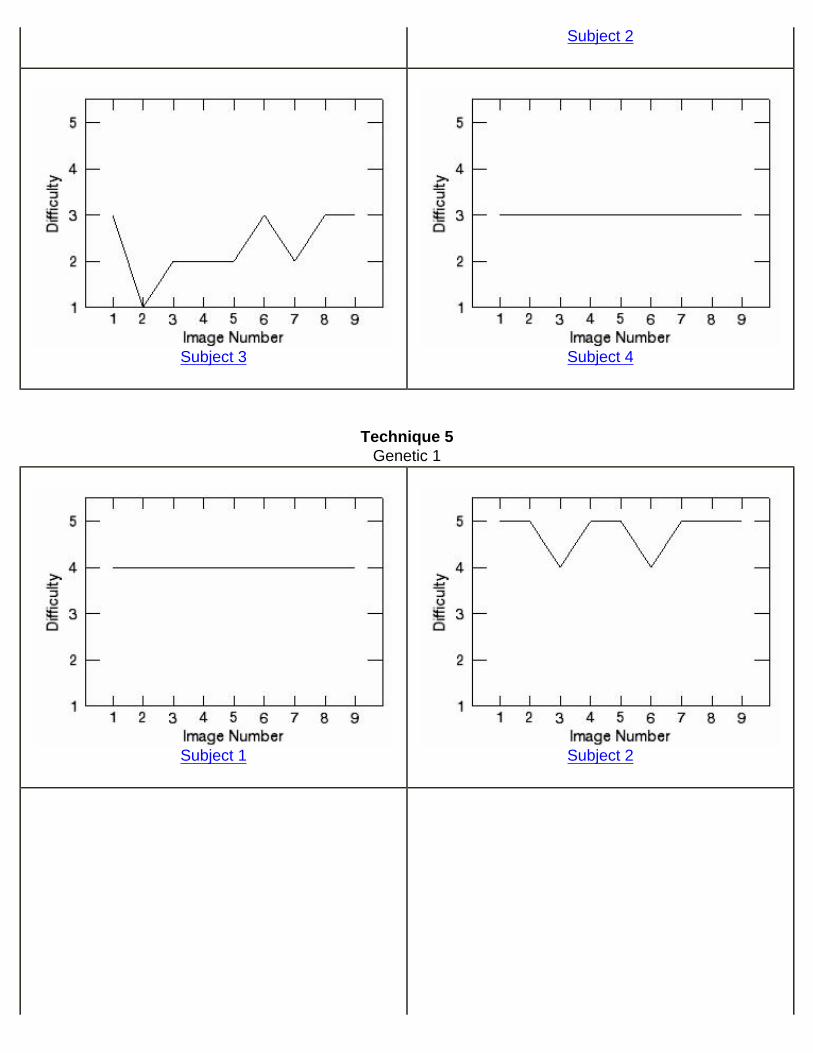
These graphs represent the level of difficulty for the subjects experienced performing the experiment for each image. The difficulty was based on a 1 to 5 scale, where 5 represents easy and 1 represents hard. For each technique there are graphs for each of the four subjects, with the exception of technique 4 which we only have the results for three subjects.
Technique 1
Fire/Grey
Subject 1
Subject 2
Subject 3
Subject 4
Technique 2Red/Blue
Subject 1
Subject 2
Subject 3
Subject 4
Technique 3Red/Green

Subject 1
Subject 2
Subject 3
Subject 4
Technique 4Interlace
Subject 2
Subject 3
Subject 4
Technique 5Genetic 1
Subject 1
Subject 2

Subject 3 Subject 4
Technique 6Genetic 2
Subject 1
Subject 2

Subject 3
Subject 4
Technique 7HSV
Subject 1
Subject 2
Subject 3
Subject 4
Technique 8CGY HSV

Subject 1
Subject 2
Subject 3
Subject 4
ii. Plots for each Technique
These graphs represent the level of difficulty the subjects experienced performing the experiment for each image. The difficulty was based on a 1 to 5 scale, where 5 represents easy and 1 represents hard. Each graph represents one technique, and is the average for the four subjects. The last graph is the average of all eight techniques.

Technique 1Fire/Grey
Technique 2Red/Blue
Technique 3Red/Green
Technique 4Interlace

Technique 5Genetic 1
Technique 6Genetic 2
Technique 7HSV
Technique 8CGY HSV
Average

d. Difficulty vs. Position
i. Plots for each Individual
These graphs represent the level of difficulty the subjects experienced performing the experiment for each image. The difficulty was based on a 1 to 5 scale, where 5 represents easy and 1 represents hard. For each technique there are graphs for each of the four subjects, with the exception of technique 4 which we only have the results for three subjects. The position is the order the images were viewed by the subject. For example, position=1 is the first image of a given technique that the subject analyzed.
Technique 1
Fire/Grey
Subject 1
Subject 2
Subject 3
Subject 4
Technique 2

Red/Blue
Subject 1
Subject 2
Subject 3
Subject 4
Technique 3Red/Green

Subject 1 Subject 2
Subject 3
Subject 4
Technique 4Interlace

Subject 2
Subject 3
Subject 4
Technique 5Genetic 1
Subject 1
Subject 2

Subject 3
Subject 4
Technique 6Genetic 2
Subject 1
Subject 2

Subject 3
Subject 4
Technique 7HSV
Subject 1
Subject 2
Subject 3
Subject 4
Technique 8CGY HSV

Subject 1
Subject 2
Subject 3
Subject 4
iii. Plots for each Technique
These graphs represent the level of difficulty the subjects experienced performing the experiment for each image. The difficulty was based on a 1 to 5 scale, where 5 represents easy and 1 represents hard. Each graph represents one technique, and is the average of the four subjects. The last graph is the overall average for each of the eight techniques. The position is the order the images were viewed by the subject. For example, position=1 is the first image of a given technique that the subject analyzed.

Technique 1Fire/Grey
Technique 2Red/Blue
Technique 3Red/Green
Technique 4Interlace

Technique 5Genetic 1
Technique 6Genetic 2
Technique 7HSV
Technique 8CGY HSV
Average
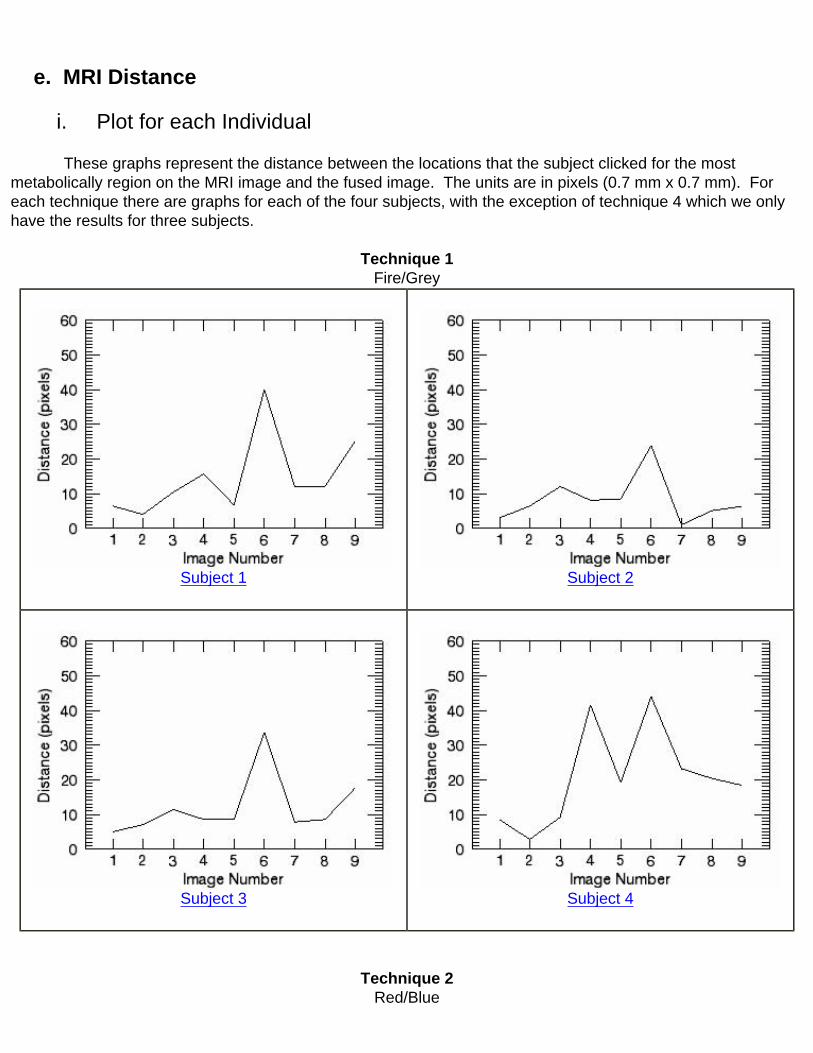
e. MRI Distance
i. Plot for each Individual These graphs represent the distance between the locations that the subject clicked for the most metabolically region on the MRI image and the fused image. The units are in pixels (0.7 mm x 0.7 mm). For each technique there are graphs for each of the four subjects, with the exception of technique 4 which we only have the results for three subjects.
Technique 1
Fire/Grey
Subject 1
Subject 2
Subject 3
Subject 4
Technique 2Red/Blue

Subject 1
Subject 2
Subject 3
Subject 4
Technique 3Red/Green
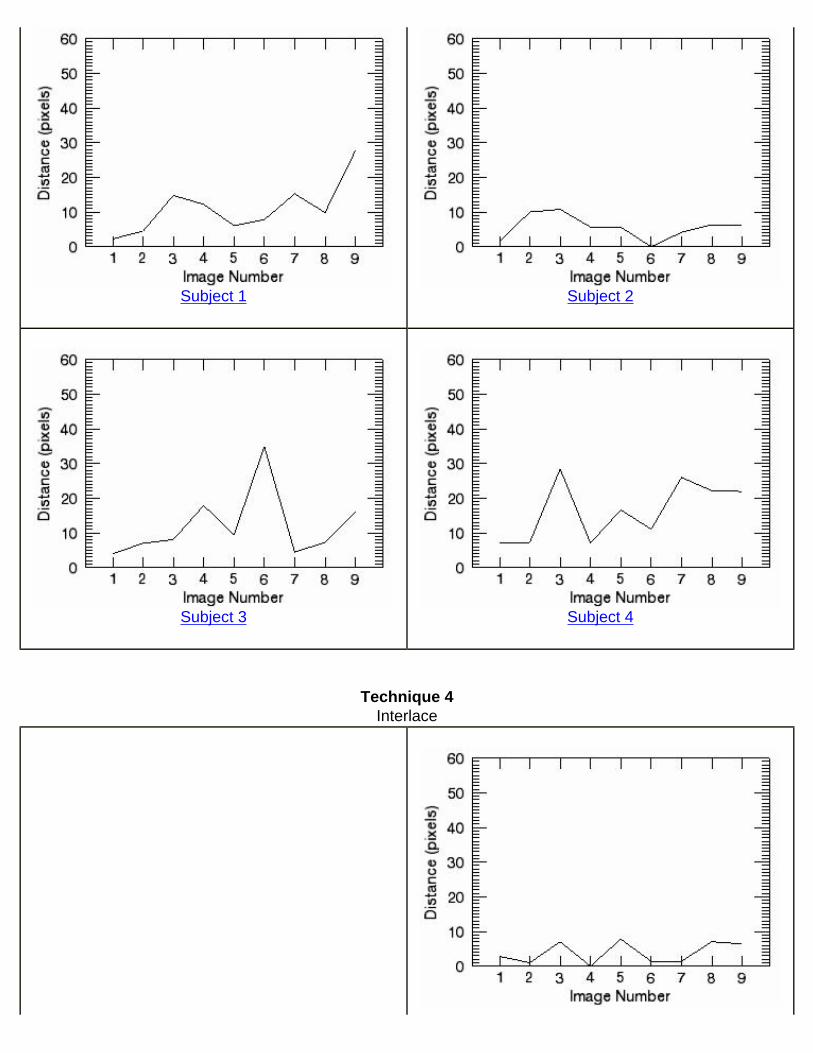
Subject 1
Subject 2
Subject 3
Subject 4
Technique 4Interlace
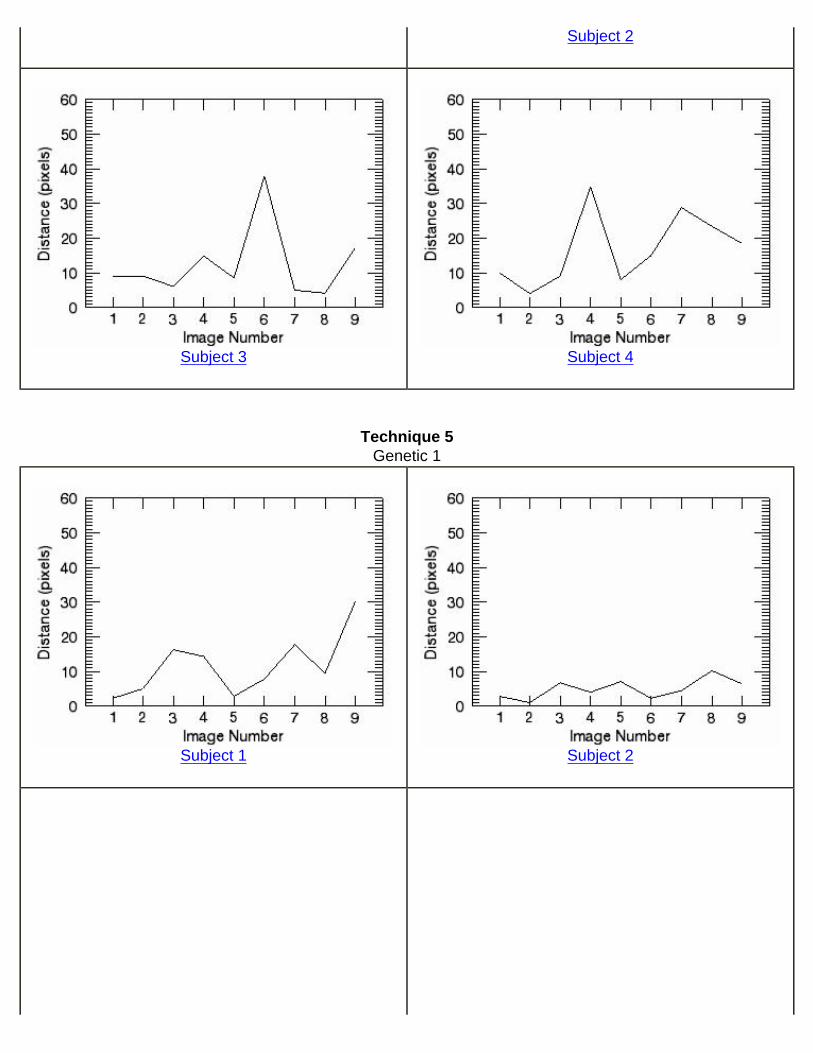
Subject 2
Subject 3
Subject 4
Technique 5Genetic 1
Subject 1
Subject 2
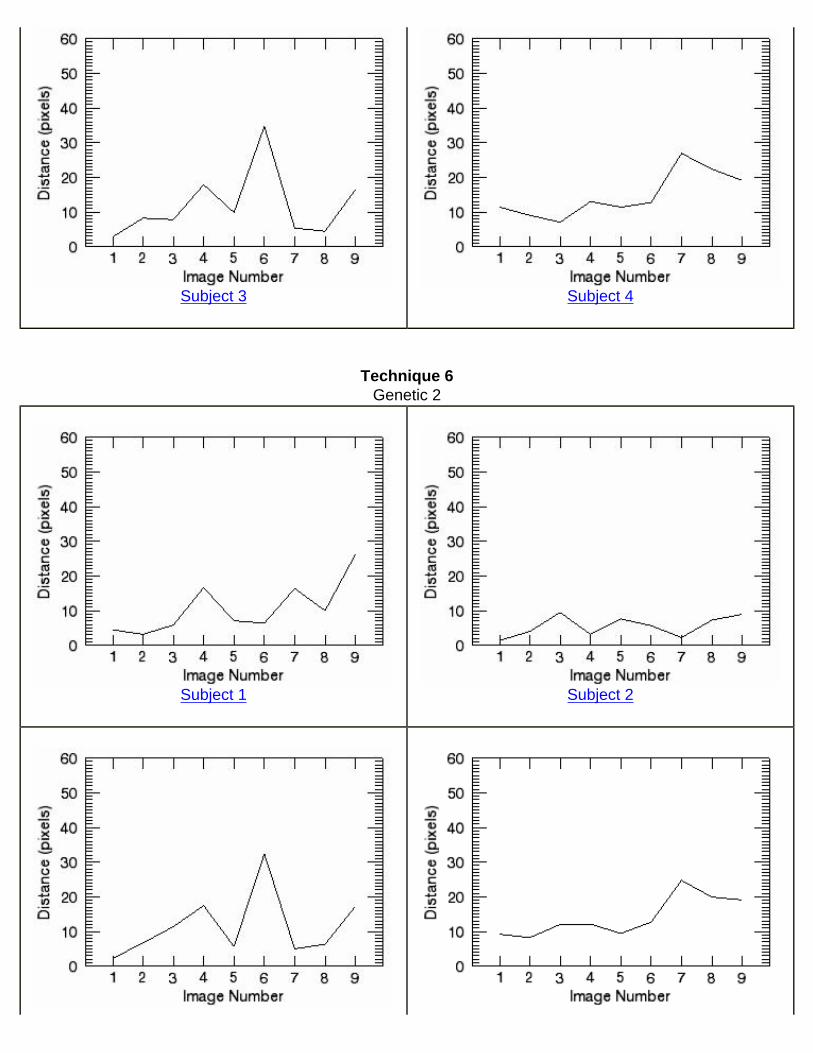
Subject 3
Subject 4
Technique 6Genetic 2
Subject 1
Subject 2
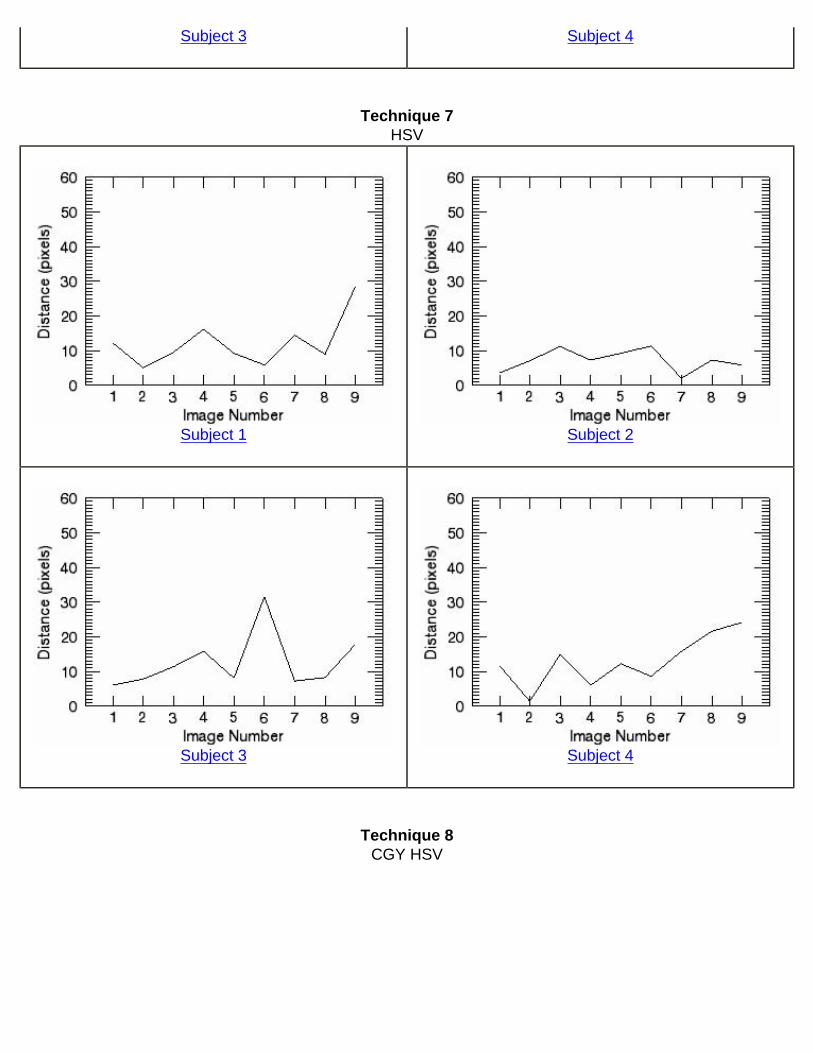
Subject 3
Subject 4
Technique 7HSV
Subject 1
Subject 2
Subject 3
Subject 4
Technique 8CGY HSV

Subject 1
Subject 2
Subject 3
Subject 4
ii. Plot for each Technique
These graphs represent the distance between the locations that the subject clicked for the most metabolically region on the MRI image and the fused image. The units are in pixels (0.7 mm x 0.7 mm). Each graph represents one technique, and is the average of the four subjects. The last graph is the overall average for each of the eight techniques.

Technique 1Fire/Grey
Technique 2Red/Blue
Technique 3Red/Green
Technique 4Interlace
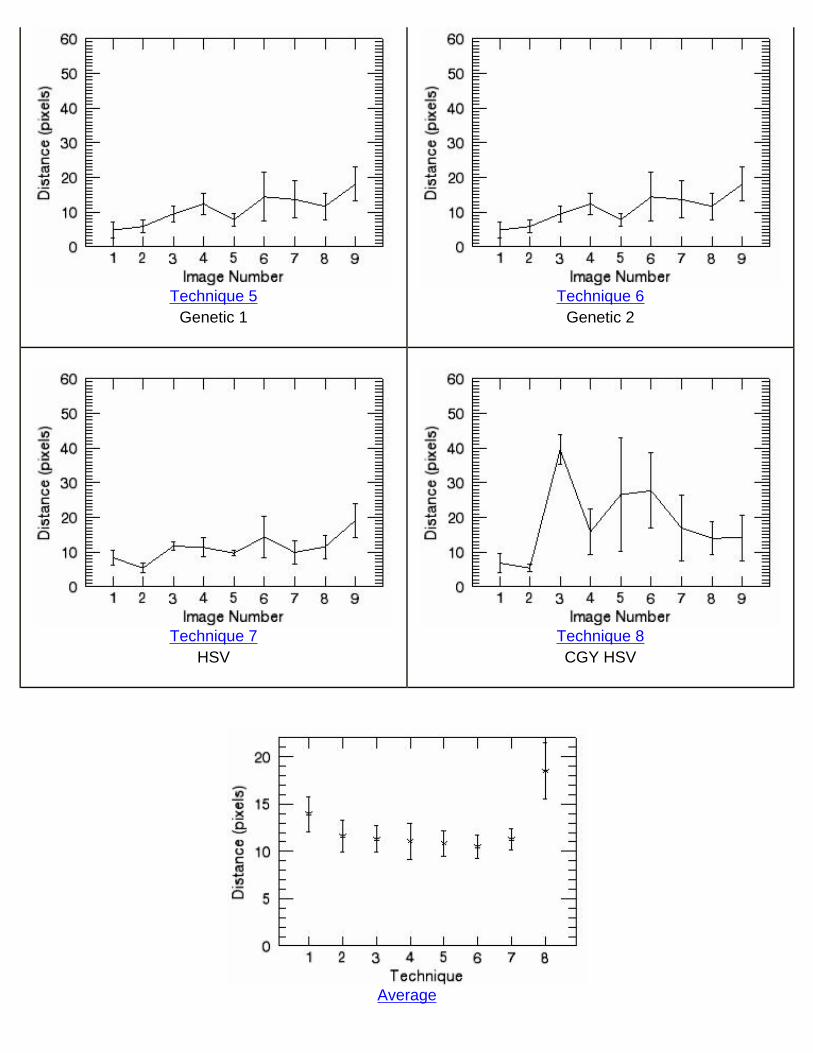
Technique 5Genetic 1
Technique 6Genetic 2
Technique 7HSV
Technique 8CGY HSV
Average

f. PET Distance
i. Plot for each Individual
These graphs represent the distance between the locations that the subject clicked for the most metabolically region on the PET image and the fused image. The units are in pixels (0.7 mm x 0.7 mm). For each technique there are graphs for each of the four subjects, with the exception of technique 4 which we only have the results for three subjects.
Technique 1
Fire/Grey
Subject 1
Subject 2
Subject 3
Subject 4
Technique 2Red/Blue

Subject 1
Subject 2
Subject 3
Subject 4
Technique 3Red/Green
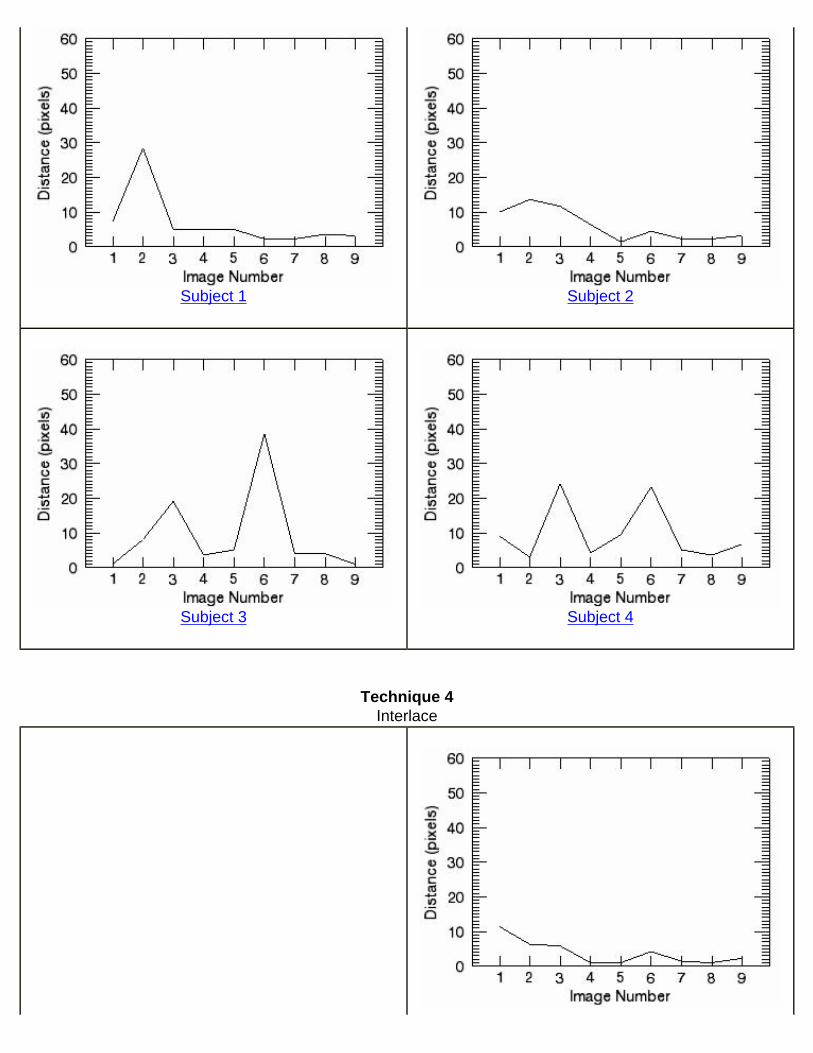
Subject 1
Subject 2
Subject 3
Subject 4
Technique 4Interlace

Subject 2
Subject 3
Subject 4
Technique 5Genetic 1
Subject 1
Subject 2

Subject 3
Subject 4
Technique 6Genetic 2
Subject 1
Subject 2
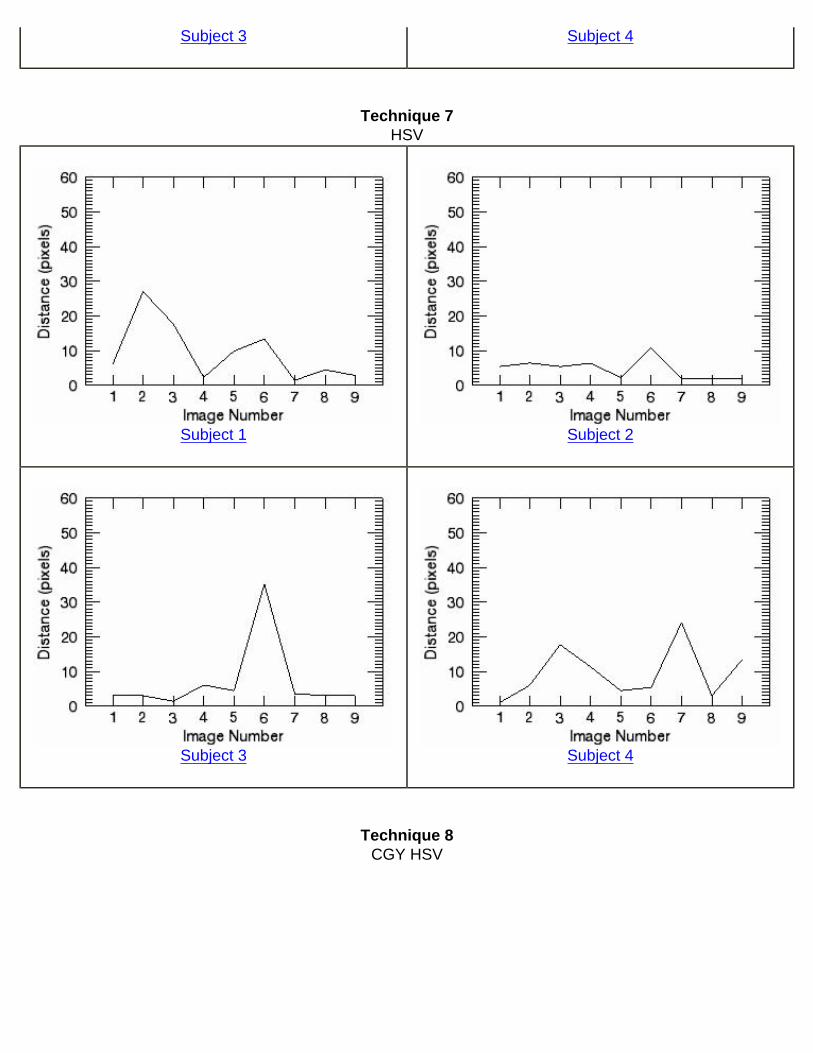
Subject 3
Subject 4
Technique 7HSV
Subject 1
Subject 2
Subject 3
Subject 4
Technique 8CGY HSV

Subject 1
Subject 2
Subject 3
Subject 4
ii. Plot for each Technique These graphs represent the distance between the locations that the subject clicked for the most metabolically region on the PET image and the fused image. The units are in pixels (0.7 mm x 0.7 mm). Each graph represents one technique, and is the average of the four subjects. The last graph is the overall average for each of the eight techniques.
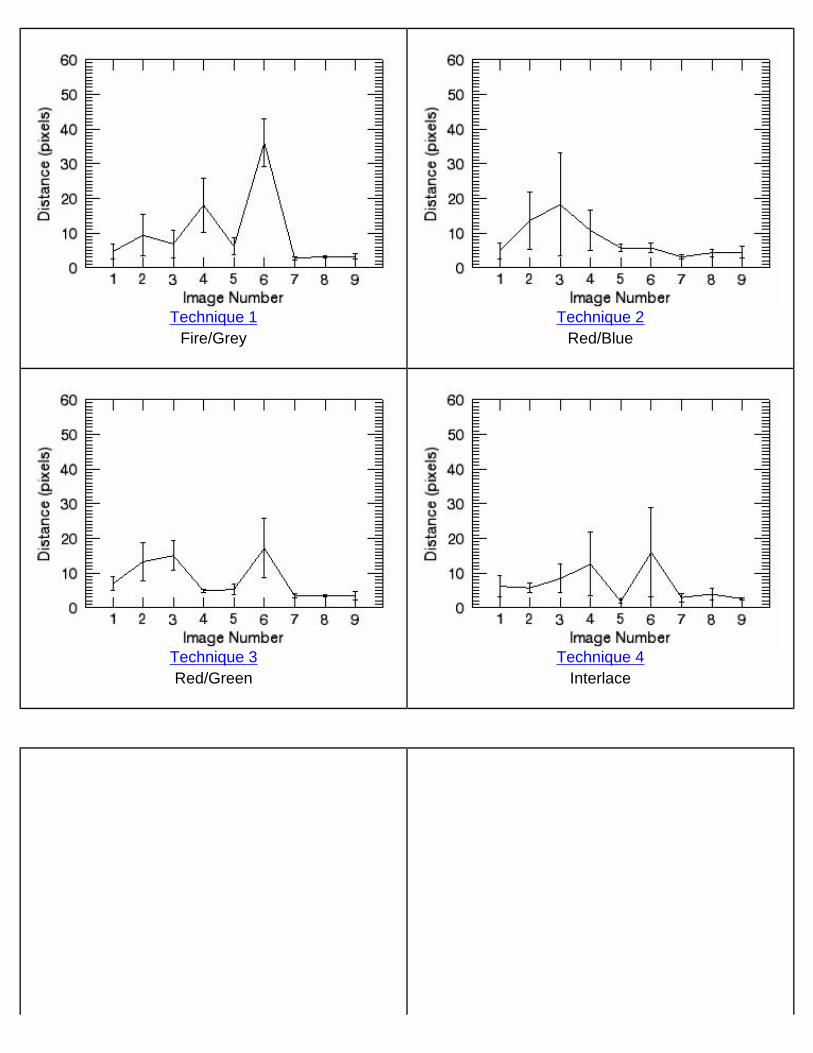
Technique 1Fire/Grey
Technique 2Red/Blue
Technique 3Red/Green
Technique 4Interlace

Technique 5Genetic 1
Technique 6Genetic 2
Technique 7HSV
Technique 8CGY HSV
Average

g. Physical Color Distance
i. Plots for each Individual
These graphs represent the color distance, which is the distance between the color on the color table that the subject selected and the color at the location they selected on the fused image corresponding to the metabolically active region. The color distance is in units of pixels. For each technique there are graphs for each of the four subjects. Technique 4 is excluded since due to its interlacing it has the same color at multiple locations on its color table.
Technique 1Fire/Grey
Subject 1
Subject 2
Subject 3
Subject 4
Technique 2

Red/Blue
Subject 1
Subject 2
Subject 3
Subject 4
Technique 3Red/Green
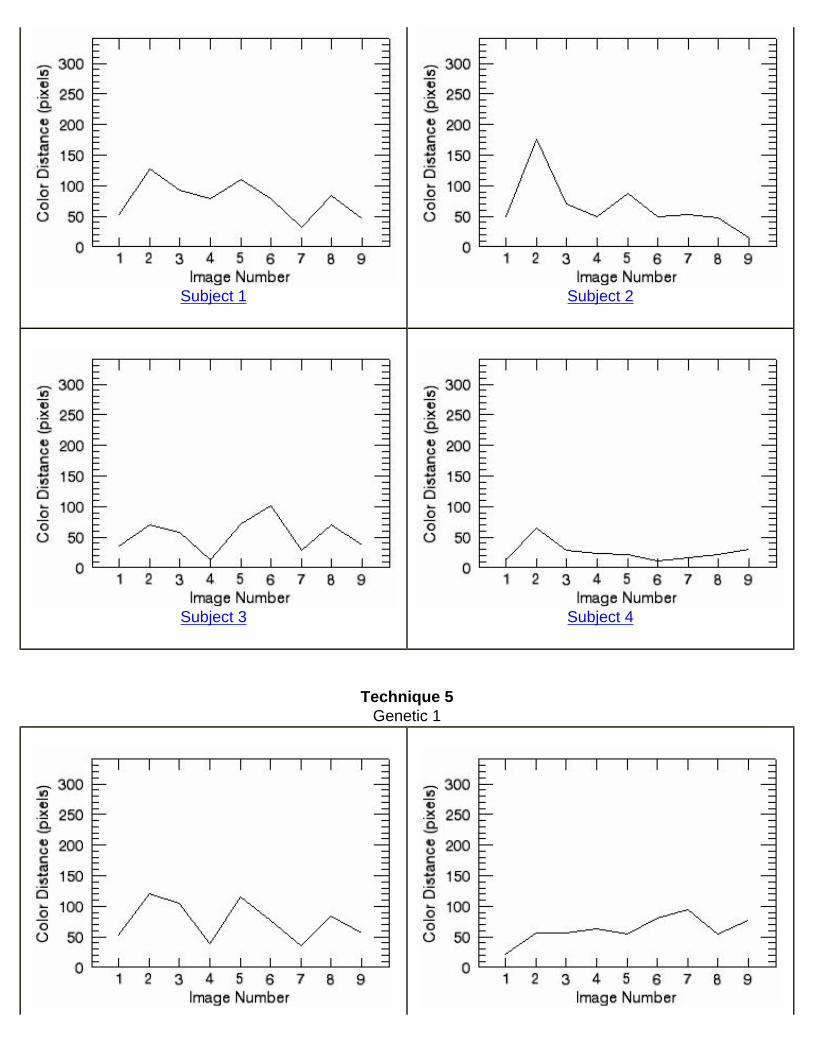
Subject 1
Subject 2
Subject 3
Subject 4
Technique 5Genetic 1

Subject 1
Subject 2
Subject 3
Subject 4
Technique 6Genetic 2
Subject 1
Subject 2

Subject 3 Subject 4
Technique 7HSV
Subject 1
Subject 2

Subject 3 Subject 4
Technique 8CGY HSV
Subject 1
Subject 2
Subject 3
Subject 4
ii. Plot for each Technique
These graphs represent the color distance, which is the distance between the color on the color table that the subject selected and the color at the location they selected on the fused image corresponding to the metabolically active region. The color distance is in units of pixels. Each graph represents one technique, and is the average of the four subjects. The last graph is the overall average for each of the techniques. Technique 4 is excluded since due to its interlacing it has the same color at multiple locations on its color table.

Technique 1Fire/Grey
Technique 2Red/Blue
Technique 3Red/Green

Technique 5Genetic 1
Technique 6Genetic 2
Technique 7HSV
Technique 8CGY HSV
Average

h. Preference
These graphs represent the preference that each subject assigned to the 8 techniques. The preference was based on a 1 to 5 scale, where 1 represents the lowest preference and 5 represents the highest preference. There are 4 graphs, one for each subject, and the last graph represents the average of all of the subjects.
Subject 1
Subject 2
Subject 3
Subject 4

Average of 4 subjects
i. Time vs. Image Number
i. Plots for each Individual These graphs represent the time it took for the subject to click on the most metabolically active region on the image. The units are seconds. For each technique there are graphs for each of the four subjects, with the exception of technique 4 which we only have the results for three subjects. Care needs to be taken when analyzing the time. Due to some excessively long times, it appear that some subjects were distracted or were interrupted during the experiment.
Technique 1Fire/Grey
Subject 1
Subject 2

Subject 3
Subject 4
Technique 2Red/Blue
Subject 1
Subject 2
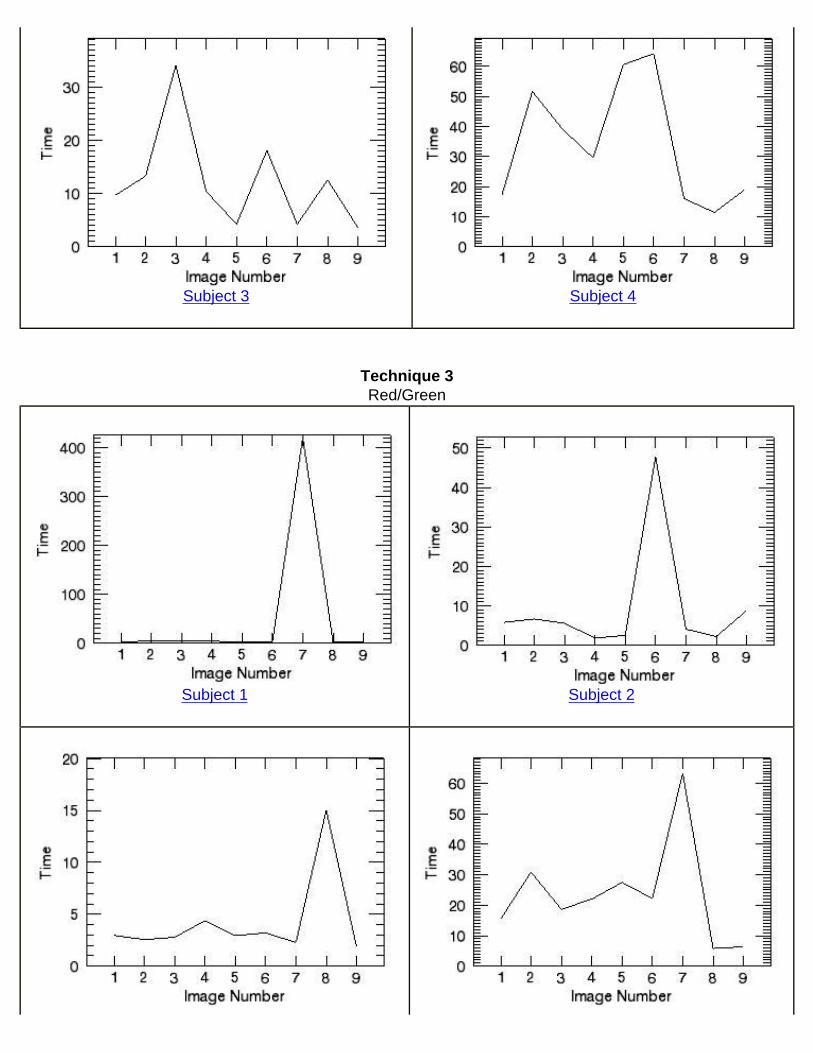
Subject 3
Subject 4
Technique 3Red/Green
Subject 1
Subject 2

Subject 3
Subject 4
Technique 4Interlace
Subject 2
Subject 3
Subject 4
Technique 5Genetic 1

Subject 1
Subject 2
Subject 3
Subject 4
Technique 6Genetic 2
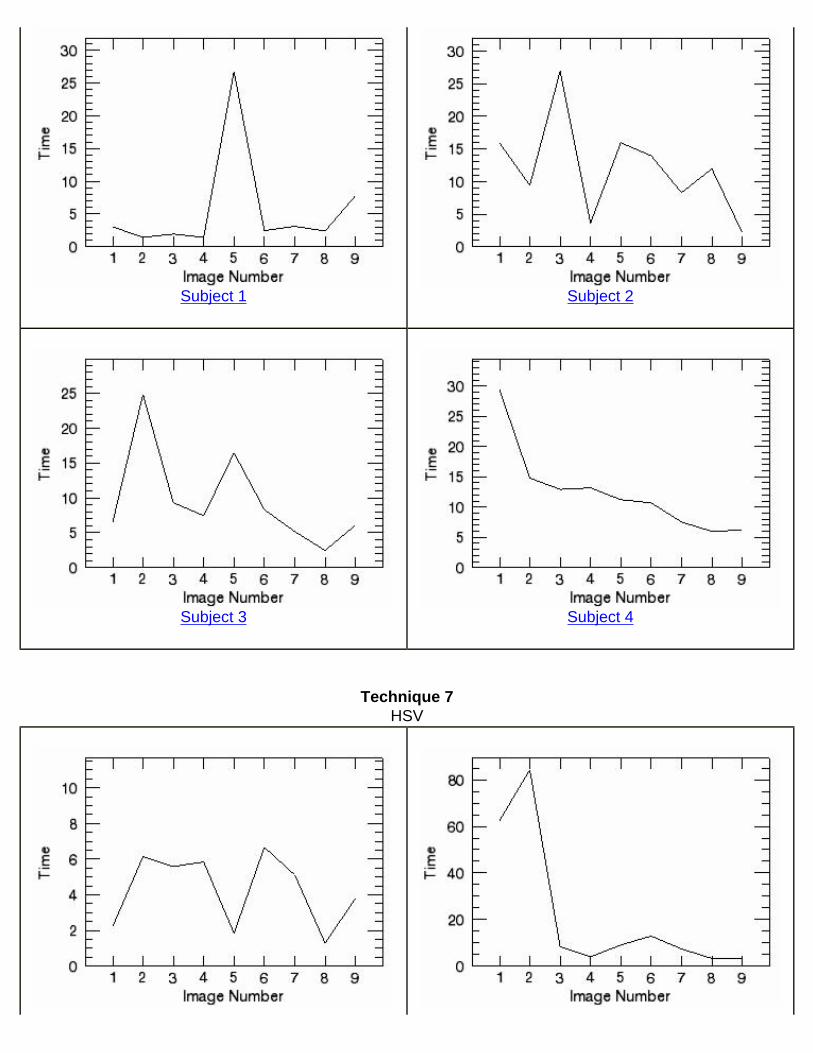
Subject 1
Subject 2
Subject 3
Subject 4
Technique 7HSV
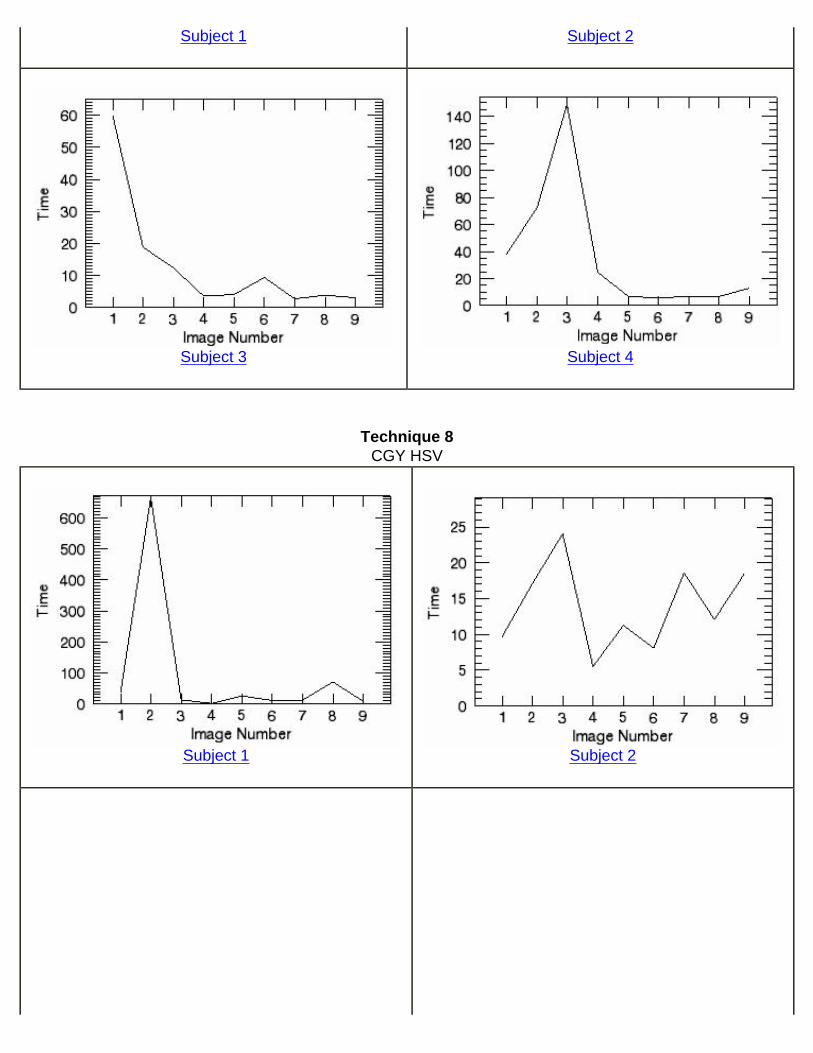
Subject 1
Subject 2
Subject 3
Subject 4
Technique 8CGY HSV
Subject 1
Subject 2

Subject 3
Subject 4
ii. Plots for each Technique
These graphs represent the time it took for the subject to click on the most metabolically active region on the image. The units are seconds. Each graph represents one technique, and is the average of the four subjects. The second to last graph shows the overall average for each of the eight techniques, and the last graph shows the overall median for each of the eight techniques. Care needs to be taken when analyzing the time. Due to some excessively long times, it appear that some subjects were distracted or were interrupted during the experiment.
Technique 1Fire/Grey
Technique 2Red/Blue
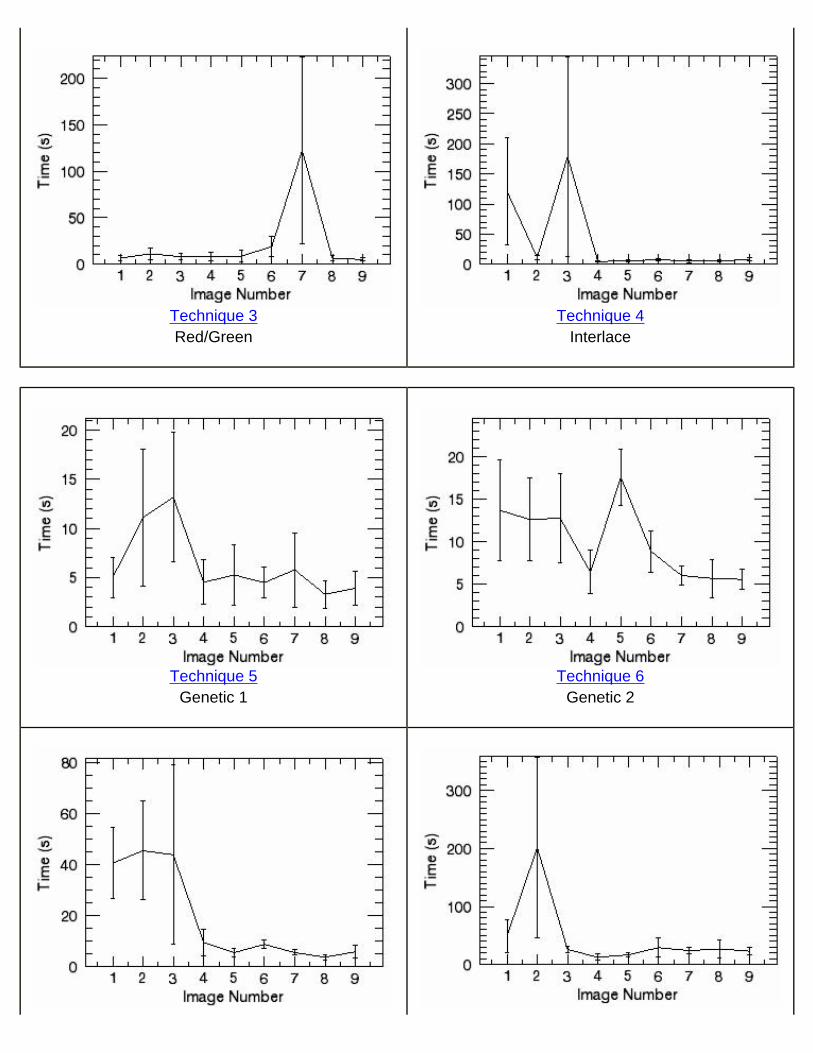
Technique 3Red/Green
Technique 4Interlace
Technique 5Genetic 1
Technique 6Genetic 2
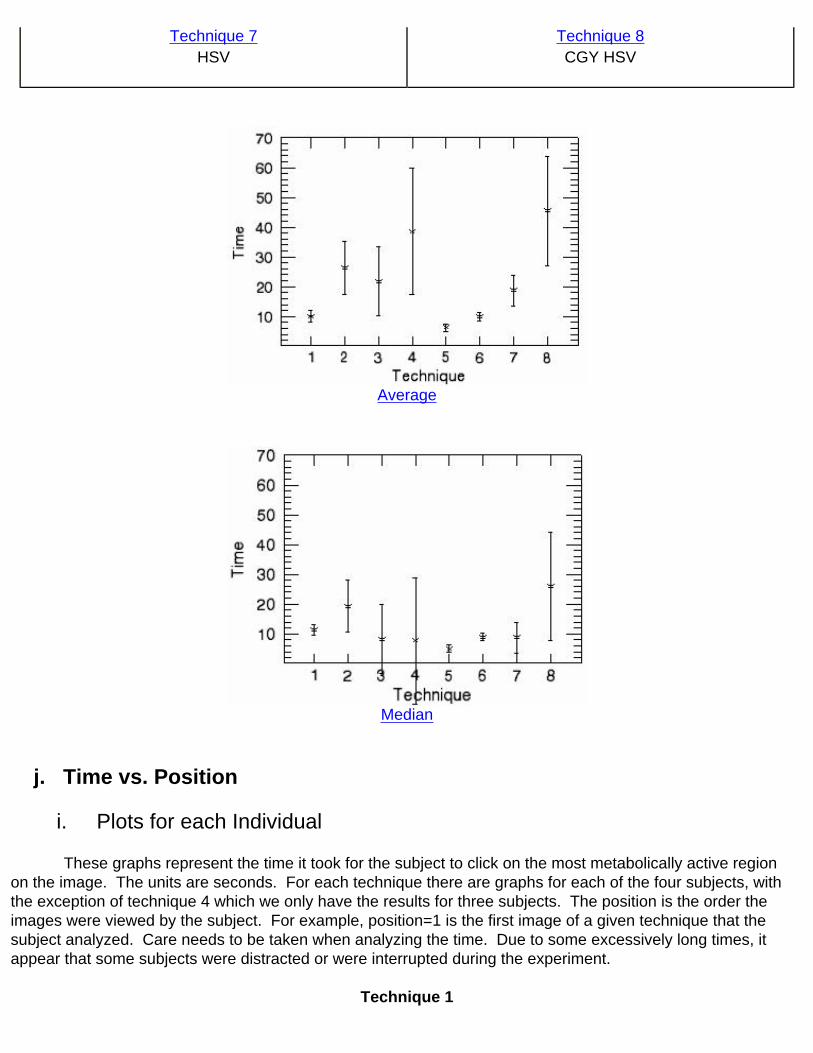
Technique 7HSV
Technique 8CGY HSV
Average
Median
j. Time vs. Position
i. Plots for each Individual
These graphs represent the time it took for the subject to click on the most metabolically active region on the image. The units are seconds. For each technique there are graphs for each of the four subjects, with the exception of technique 4 which we only have the results for three subjects. The position is the order the images were viewed by the subject. For example, position=1 is the first image of a given technique that the subject analyzed. Care needs to be taken when analyzing the time. Due to some excessively long times, it appear that some subjects were distracted or were interrupted during the experiment.
Technique 1
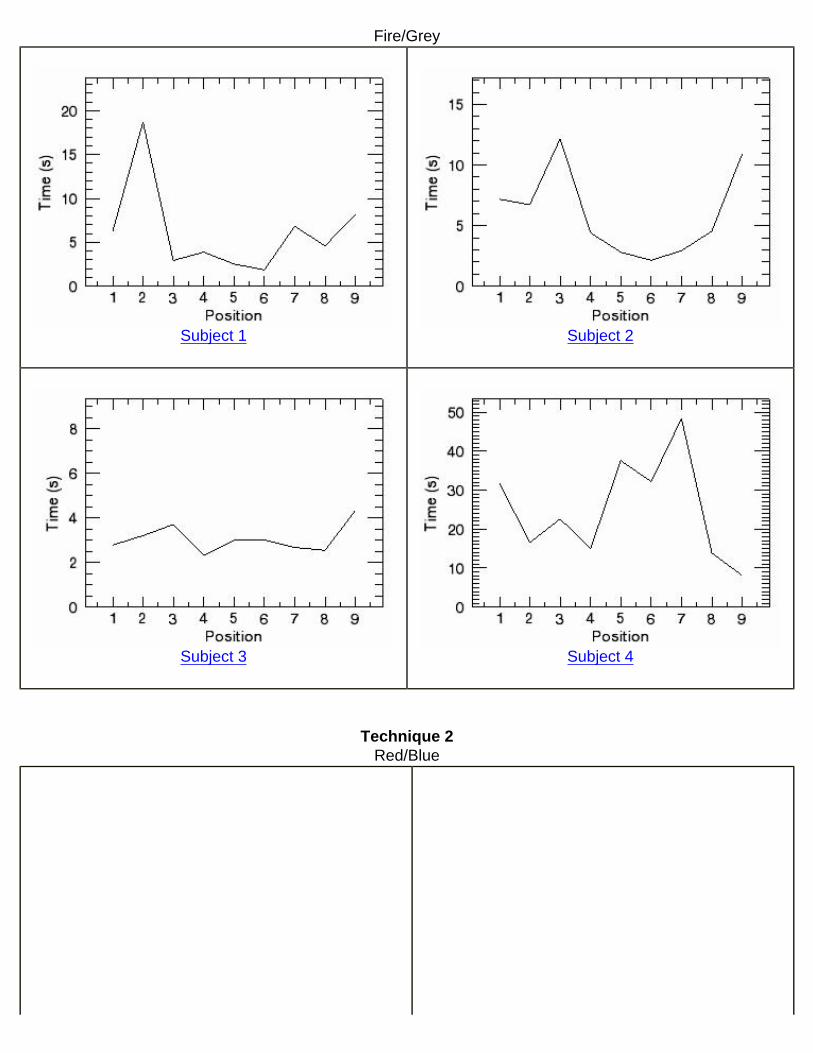
Fire/Grey
Subject 1
Subject 2
Subject 3
Subject 4
Technique 2Red/Blue

Subject 1
Subject 2
Subject 3
Subject 4
Technique 3Red/Green

Subject 1
Subject 2
Subject 3
Subject 4
Technique 4Interlace
Subject 2
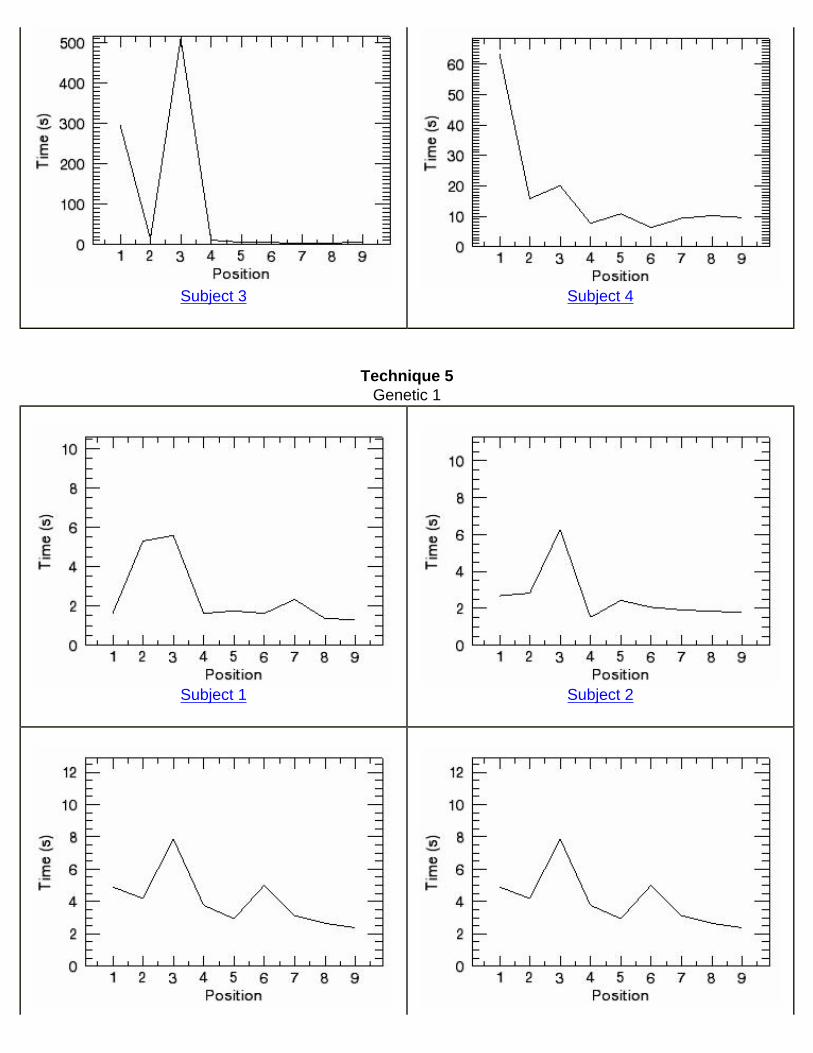
Subject 3
Subject 4
Technique 5Genetic 1
Subject 1
Subject 2

Subject 3
Subject 4
Technique 6Genetic 2
Subject 1
Subject 2
Subject 3
Subject 4
Technique 7HSV

Subject 1
Subject 2
Subject 3
Subject 4
Technique 8CGY HSV
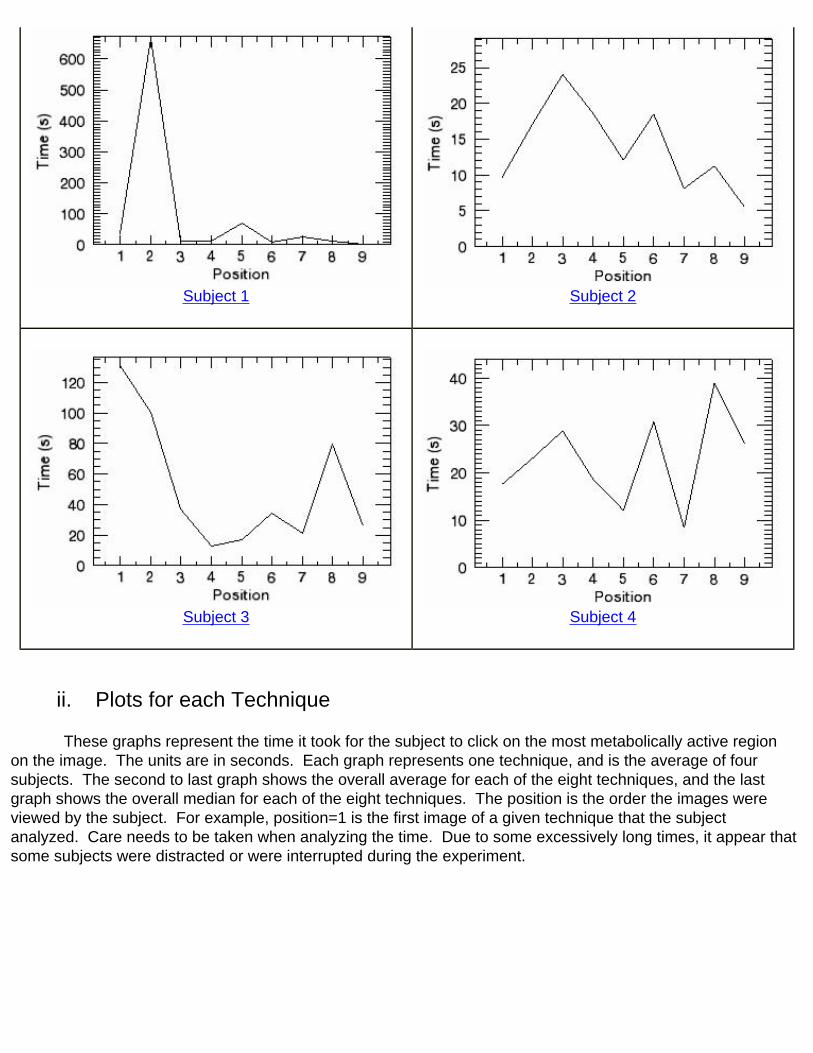
Subject 1
Subject 2
Subject 3
Subject 4
ii. Plots for each Technique
These graphs represent the time it took for the subject to click on the most metabolically active region on the image. The units are in seconds. Each graph represents one technique, and is the average of four subjects. The second to last graph shows the overall average for each of the eight techniques, and the last graph shows the overall median for each of the eight techniques. The position is the order the images were viewed by the subject. For example, position=1 is the first image of a given technique that the subject analyzed. Care needs to be taken when analyzing the time. Due to some excessively long times, it appear that some subjects were distracted or were interrupted during the experiment.

Technique 1Fire/Grey
Technique 2Red/Blue
Technique 3Red/Green
Technique 4Interlace

Technique 5Genetic 1
Technique 6Genetic 2
Technique 7HSV
Technique 8CGY HSV
Average

Median
k. Unfused Distance
These graphs represent the unfused distance, which is the distance between the location clicked by the subject on the most metabolically active region on the PET and the same location clicked on the MRI. The units are in pixels (0.7 mm x 0.7 mm). There are 4 graphs, one for each subject, and the last graph represents the average of all of the subjects.
Subject 1
Subject 2

Subject 3
Subject 4
Average
XII. Summary The study procedure, the tools used to administer the study, the data collected, and the tools used to analyze the collected data have been presented and made available through this document. The authors hope is that others will be able to perform similar experiments reusing these tools to examine other fusion techniques. The authors encourage others to analyze the data presented here, coming to their own conclusions. See other publications by the authors for more information on the fusion techniques studied, alternative fusion techniques, the Fusion Viewer software, and their conclusions to this study.
XIII. Acknowledgment
The authors would like to thank the radiologists that participated in the study, Mehr Khan, Michele Lisi, Mary McGrath, and Daniel Tam. Thanks also go to those that made sure the study went smoothly. Most notably the Center for Imaging Science’s 2006 summer interns who participated in the trial run of the study, and to Alphonso Magri who participated in administering the study to the radiologists.

The authors are grateful for the support for the project received from Kodak, the Center for Imaging Science at the Rochester Institute of Technology, the Radiology Department at SUNY Upstate Medical University and its director Dr. David Feiglin, and the College of Science at the Rochester Institute of Technology.


![Learning Multimodal Clarification Strategies › ~dgroup › papers › DoDpresentation05.pdfBy Madonna or Don McLean? Any of the songs here? [display list] Any of these playlists?](https://static.fdocuments.in/doc/165x107/60d5c26d1797785b4d205e88/learning-multimodal-clarification-a-dgroup-a-papers-a-dodpresentation05pdf.jpg)