Multimodal detection of sleep apnoea using...
21
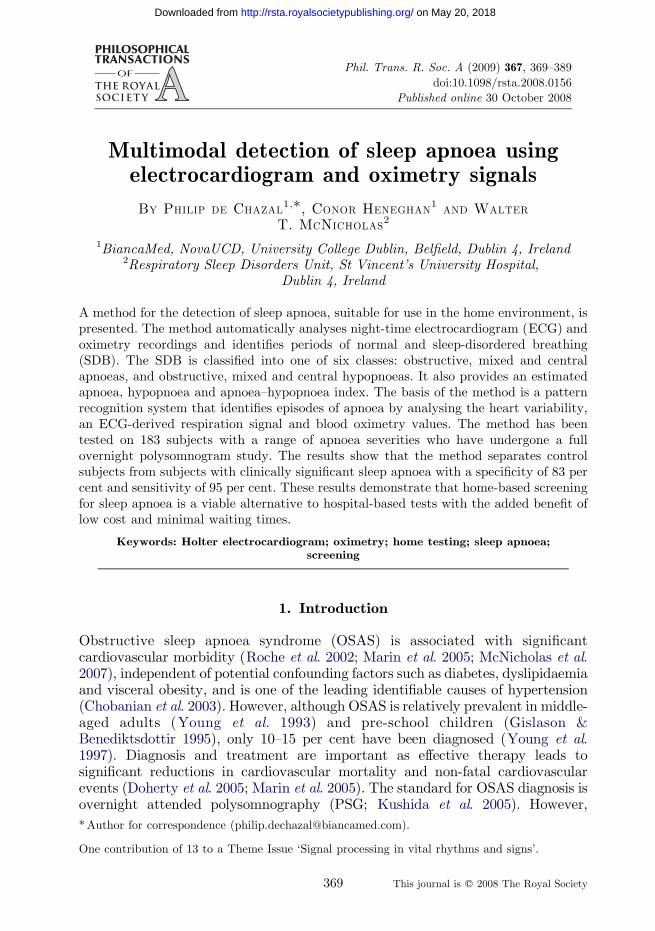
Multimodal detection of sleep apnoea using electrocardiogram and oximetry signals BY PHILIP DE CHAZAL 1, * ,CONOR HENEGHAN 1 AND WALTER T. MCNICHOLAS 2 1 BiancaMed, NovaUCD, University College Dublin, Belfield, Dublin 4, Ireland 2 Respiratory Sleep Disorders Unit, St Vincent’s University Hospital, Dublin 4, Ireland A method for the detection of sleep apnoea, suitable for use in the home environment, is presented. The method automatically analyses night-time electrocardiogram (ECG) and oximetry recordings and identifies periods of normal and sleep-disordered breathing (SDB). The SDB is classified into one of six classes: obstructive, mixed and central apnoeas, and obstructive, mixed and central hypopnoeas. It also provides an estimated apnoea, hypopnoea and apnoea–hypopnoea index. The basis of the method is a pattern recognition system that identifies episodes of apnoea by analysing the heart variability, an ECG-derived respiration signal and blood oximetry values. The method has been tested on 183 subjects with a range of apnoea severities who have undergone a full overnight polysomnogram study. The results show that the method separates control subjects from subjects with clinically significant sleep apnoea with a specificity of 83 per cent and sensitivity of 95 per cent. These results demonstrate that home-based screening for sleep apnoea is a viable alternative to hospital-based tests with the added benefit of low cost and minimal waiting times. Keywords: Holter electrocardiogram; oximetry; home testing; sleep apnoea; screening 1. Introduction Obstructive sleep apnoea syndrome (OSAS) is associated with significant cardiovascular morbidity ( Roche et al. 2002; Marin et al. 2005; McNicholas et al. 2007), independent of potential confounding factors such as diabetes, dyslipidaemia and visceral obesity, and is one of the leading identifiable causes of hypertension (Chobanian et al. 2003). However, although OSAS is relatively prevalent in middle- aged adults ( Young et al . 1993) and pre-school children (Gislason & Benediktsdottir 1995), only 10–15 per cent have been diagnosed ( Young et al. 1997). Diagnosis and treatment are important as effective therapy leads to significant reductions in cardiovascular mortality and non-fatal cardiovascular events (Doherty et al. 2005; Marin et al. 2005). The standard for OSAS diagnosis is overnight attended polysomnography (PSG; Kushida et al. 2005). However, Phil. Trans. R. Soc. A (2009) 367, 369–389 doi:10.1098/rsta.2008.0156 Published online 30 October 2008 One contribution of 13 to a Theme Issue ‘Signal processing in vital rhythms and signs’. * Author for correspondence ([email protected]). 369 This journal is q 2008 The Royal Society on May 20, 2018 http://rsta.royalsocietypublishing.org/ Downloaded from
Transcript of Multimodal detection of sleep apnoea using...
on May 20, 2018http://rsta.royalsocietypublishing.org/Downloaded from
Multimodal detection of sleep apnoea usingelectrocardiogram and oximetry signals
BY PHILIP DE CHAZAL1,*, CONOR HENEGHAN
1AND WALTER
T. MCNICHOLAS2
1BiancaMed, NovaUCD, University College Dublin, Belfield, Dublin 4, Ireland2Respiratory Sleep Disorders Unit, St Vincent’s University Hospital,
Dublin 4, Ireland
A method for the detection of sleep apnoea, suitable for use in the home environment, ispresented. The method automatically analyses night-time electrocardiogram (ECG) andoximetry recordings and identifies periods of normal and sleep-disordered breathing(SDB). The SDB is classified into one of six classes: obstructive, mixed and centralapnoeas, and obstructive, mixed and central hypopnoeas. It also provides an estimatedapnoea, hypopnoea and apnoea–hypopnoea index. The basis of the method is a patternrecognition system that identifies episodes of apnoea by analysing the heart variability,an ECG-derived respiration signal and blood oximetry values. The method has beentested on 183 subjects with a range of apnoea severities who have undergone a fullovernight polysomnogram study. The results show that the method separates controlsubjects from subjects with clinically significant sleep apnoea with a specificity of 83 percent and sensitivity of 95 per cent. These results demonstrate that home-based screeningfor sleep apnoea is a viable alternative to hospital-based tests with the added benefit oflow cost and minimal waiting times.
Keywords: Holter electrocardiogram; oximetry; home testing; sleep apnoea;screening
On
*A
1. Introduction
Obstructive sleep apnoea syndrome (OSAS) is associated with significantcardiovascular morbidity (Roche et al. 2002; Marin et al. 2005; McNicholas et al.2007), independent of potential confounding factors such as diabetes, dyslipidaemiaand visceral obesity, and is one of the leading identifiable causes of hypertension(Chobanian et al. 2003). However, although OSAS is relatively prevalent in middle-aged adults (Young et al. 1993) and pre-school children (Gislason &Benediktsdottir 1995), only 10–15 per cent have been diagnosed (Young et al.1997). Diagnosis and treatment are important as effective therapy leads tosignificant reductions in cardiovascular mortality and non-fatal cardiovascularevents (Doherty et al. 2005; Marin et al. 2005). The standard for OSAS diagnosis isovernight attended polysomnography (PSG; Kushida et al. 2005). However,
Phil. Trans. R. Soc. A (2009) 367, 369–389
doi:10.1098/rsta.2008.0156
Published online 30 October 2008
e contribution of 13 to a Theme Issue ‘Signal processing in vital rhythms and signs’.
uthor for correspondence ([email protected]).
369 This journal is q 2008 The Royal Society
P. de Chazal et al.370
on May 20, 2018http://rsta.royalsocietypublishing.org/Downloaded from
resource constraints in many countries mean polysomnography suffers from a lowavailability (Flemons et al. 2004). By definition, an apnoea is a cessation of airflowthrough the upper airway for a period of 10 s or longer, and is typically associatedwith a fall in the blood oxygen saturation (SpO2), which is termed a desaturation.A hypopnoea is a reduction in airflow to less than 50 per cent of normal airflow thatleads to a desaturation of 3 per cent or an electrocortical arousal (AASM 1999).Apnoeas and hypopnoeas are classified into three types:
—obstructive, in which respiratory effort is present, but the upper airway ispartially or completely blocked,
—central, in which the upper airway is open, but respiratory effort is absent orreduced, and
—mixed, in which both central and obstructive aspects are present. A typicalmixed apnoea (MA) may show a period of central apnoea (CA) for severalseconds, during which the upper airway occludes, followed by increasedrespiratory effort against the obstruction.
Most apnoeic events are terminated by recovery breaths, frequently (though notalways) accompanied by an electrocortical arousal, which is visible in an EEGrecording.
Therefore, there is considerable interest in the development of reliable low-costtechniques for the identification of subjects with sleep apnoea, particularly in thosesystems that can be reliably used in a home environment.
The most widely explored low-cost option has been unattended overnightambulatory oximetry. However, there have been mixed reports in the literature onthe efficacy of this technique. Overnight oximetry can be useful if it shows a patternof cyclic desaturation, but, in practice, the limiting factor appears to be the negativepredictive value (NPV) of the method. For example, Chiner et al. (1999) quoted anNPV ranging from 38 to 48 per cent. This low NPV probably reflects the fact thatthe sensitivity of oximetry is limited in that some obstructive events may not leadto an obvious desaturation, i.e. the definition of an obstructive hypopnoea (OH)typically includes a desaturation or microarousal, whereas an obstructive apnoea(OA) is defined purely by a cessation of flow for more than 10 s and does notnecessarily involve a desaturation (Series 2002). Oximeters are also subject toartefact due to motion and poor perfusion, which can lead to a significant loss ofdata. For example, Yamashiro et al. used nocturnal oximetry as a screener forobstructive sleep apnoea (OSA) but had to reject 10 per cent of subjects from thestudy due to poor SpO2 signal quality (Yamashiro & Kryger 1995).
The observation of changes in heart rate associated with apnoeic events has longbeen suggested as a possible technique for the simple identification of subjects withsleep apnoea syndrome (Guilleminault et al. 1984). Following the initial work ofGuilleminault et al. in this area, several researchers have proposed techniques forusing electrocardiogram (ECG)-based analysis for sleep apnoea screening (Rocheet al. 1999, 2003; Dingli et al. 2003; Stein et al. 2003). The physiological rationalefor this approach is as follows. Apnoeic events are typically (though not always)associated with a bradycardia, which is followed by an abrupt tachycardiasimultaneously with recovery breaths. Therefore, the tachogramofRR intervalswillshow a characteristic sawtooth pattern with a duration approximately correspondingto the duration of the apnoea plus recovery breaths (15–20 s). This time-domain
Phil. Trans. R. Soc. A (2009)

371Multimodal detection of sleep apnoea
on May 20, 2018http://rsta.royalsocietypublishing.org/Downloaded from
fluctuation has been termed a cyclical variation in heart rate. Alternatively,frequency-domain analysis of the RR interval series will reveal augmented energiesat the corresponding very low frequencies—typically, 0.02–0.05 Hz. In addition, asurface ECG also contains direct information about respiratory effort, since itsamplitude is typically modulated by the movement of the ribcage.
We reported an algorithm (de Chazal et al. 2003) for identifying patients withobstructive sleep apnoea that recognized autonomic and respiratory effort patternsin the modified lead V2 ECG that were associated with apnoeic events. Thealgorithm carries out an automated classification of an ECG recording by dividinga recording into one-minute epochs, and then estimates the probability of eachepoch being from an ‘apnoeic’ minute or a ‘normal respiration’ minute. The per-epoch classifications are then combined to form an overall classification of therecording in terms of average minutes/hour of obstructive sleep apnoea, which isthen mapped to an estimated apnoea–hypopnoea index (AHI) using a lineartransformation. The result of applying this algorithm to an independent test set of35 ECG recordings taken from the Marburg database (Penzel 2000) was that itcorrectly separated all clinically significant sleep apnoea (AHIO15) cases fromcontrol subjects (AHI!5).
More recently, we reported an algorithm for identifying epochs of sleep-disordered breathing (SDB; de Chazal et al. 2007) using ECG and oximetry. Themethod had been tested on 125 subjects who had undergone a full overnightpolysomnogram study. The results show that the method correctly annotates 89per cent of epochs as either normal or SDB and that it separates control subjectsfrom subjects with clinically significant sleep apnoea with a specificity andsensitivity exceeding 93 per cent. It also demonstrated that best performance andacquisition reliability was achieved when using ECG and oximetry together.
This study provides a major extension of our work of 2007 by expanding thesystem so that it annotates recordings with six classes of SDB (CA, centralhypopnoea (CH), OA, OH, MA and mixed hypopnoea (MH)). Using these high-resolution annotations, the system provides the clinician with a breakdown of theSDB indices into apnoeas and hypopnoeas, as well as isolating events into central,obstructive or mixed origins. The database used to develop and assess the systemhas also been expanded to 183 subjects.
2. Database
(a ) Subjects
The dataset used for development and testing of our system comprised 183subjects. These data were drawn from 186 subjects, with three subjects removeddue to poor-quality signal acquisition reasons.
The first cohort comprised 89 subjects recruited over two six-month periods(September 2002 to February 2003 and November 2006 to April 2007) frompatients referred to the sleep disorders clinic at St Vincent’s University Hospital(Dublin, Ireland). These subjects were referred to the clinic for evaluation ofsuspected OSA. Subjects were over 18 years of age, had no known cardiac diseaseand autonomic dysfunction, and were not on medication known to interfere withheart rate, such as beta-blockers, digoxin or calcium receptor antagonists. Datafrom two subjects could not be used due to technical reasons.
Phil. Trans. R. Soc. A (2009)
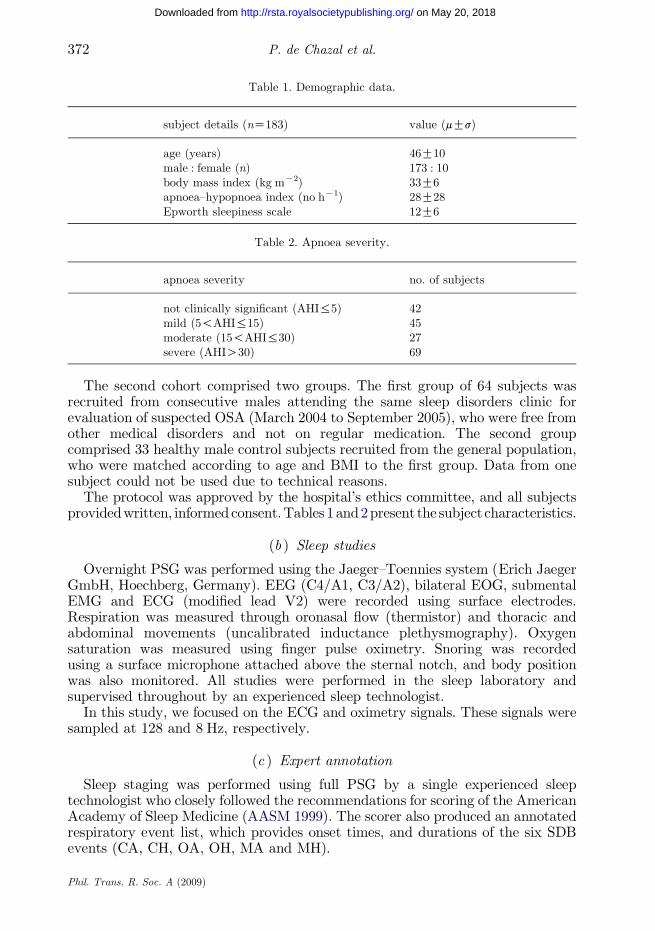
Table 1. Demographic data.
subject details (nZ183) value (mGs)
age (years) 46G10male : female (n) 173 : 10body mass index (kg mK2) 33G6apnoea–hypopnoea index (no hK1) 28G28Epworth sleepiness scale 12G6
Table 2. Apnoea severity.
apnoea severity no. of subjects
not clinically significant (AHI%5) 42mild (5!AHI%15) 45moderate (15!AHI%30) 27severe (AHIO30) 69
P. de Chazal et al.372
on May 20, 2018http://rsta.royalsocietypublishing.org/Downloaded from
The second cohort comprised two groups. The first group of 64 subjects wasrecruited from consecutive males attending the same sleep disorders clinic forevaluation of suspected OSA (March 2004 to September 2005), who were free fromother medical disorders and not on regular medication. The second groupcomprised 33 healthy male control subjects recruited from the general population,who were matched according to age and BMI to the first group. Data from onesubject could not be used due to technical reasons.
The protocol was approved by the hospital’s ethics committee, and all subjectsprovidedwritten, informedconsent.Tables1and2present the subject characteristics.
(b ) Sleep studies
Overnight PSG was performed using the Jaeger–Toennies system (Erich JaegerGmbH, Hoechberg, Germany). EEG (C4/A1, C3/A2), bilateral EOG, submentalEMG and ECG (modified lead V2) were recorded using surface electrodes.Respiration was measured through oronasal flow (thermistor) and thoracic andabdominal movements (uncalibrated inductance plethysmography). Oxygensaturation was measured using finger pulse oximetry. Snoring was recordedusing a surface microphone attached above the sternal notch, and body positionwas also monitored. All studies were performed in the sleep laboratory andsupervised throughout by an experienced sleep technologist.
In this study, we focused on the ECG and oximetry signals. These signals weresampled at 128 and 8 Hz, respectively.
(c ) Expert annotation
Sleep staging was performed using full PSG by a single experienced sleeptechnologist who closely followed the recommendations for scoring of the AmericanAcademy of Sleep Medicine (AASM 1999). The scorer also produced an annotatedrespiratory event list, which provides onset times, and durations of the six SDBevents (CA, CH, OA, OH, MA and MH).
Phil. Trans. R. Soc. A (2009)

373Multimodal detection of sleep apnoea
on May 20, 2018http://rsta.royalsocietypublishing.org/Downloaded from
Obstructive events were distinguished from central events by the presence orabsence of paradoxical thoracic and abdominal movements during apnoeas orhypopnoeas. The sleep scorer was blind to the output of the automated analysissystem. Subjects were also asked to complete the Epworth sleepiness scalequestionnaire (Johns 1991). It is worth noting that, in practice, respiratory eventsdo not always fall uniquely into one of the above annotation classes and thisinevitably leads to some ambiguity. In addition, periodic breathing events wereannotated but were not included in any further processing.
The apnoea index (AI), hypopnoea index (HI) and AHI were determined bysumming the number of relevant respiratory events from above and dividing bythe number of hours of sleep time.
3. Methods
The physiological knowledge of the manifestation of apnoea in the ECG andoximetry signals was used to identify ‘features’ for distinguishing between thenormal breathing and the six classes of SDB. With features identified, a black-boxpattern recognition method was used to design a system for identifying epochs ofSDB from the ECG and oximetry signals.
The system is shown in figure 1. The system processes the ECG and oximetrysignals and provides a number of outputs, which are as follows.
—An epoch-by-epoch sequence of annotations of seven-class annotations: normal(NM); OA; OH; CA; CH; MA; or MH.
—An epoch-by-epoch sequence of annotations of four-class annotations: NM;obstructive and MA (O); CA; and hypopnoea (H).
—An epoch-by-epoch sequence of annotations of three-class annotations: NM;apnoea (A); or H.
—An epoch-by-epoch sequence of annotations of two-class annotations: NMor SDB—An estimated AI, HI and AHI.
(a ) Overall system design
This study has adopted a pattern recognition approach using supervised learningto obtain the system.Classifiermethodswere based on linear discriminants (LD) andour selected signal representationsderived fromtheECGandoximetrydata streams.
At its most fundamental level, the system processes an epoch of data andallocates the epoch to either ‘normal’ or one of the six classes of SDB. To combinethis with supervised learning, a first step was to map the event-based annotationsof the expert to epoch-based annotations and this is discussed below.
Representations of the ECG and SpO2 signals were considered independentlyusing a range of features. Previous studies using ECG had shown that featuresbased on the timing of QRS complexes (Guilleminault et al. 1984; Hilton et al. 1999;Roche et al. 1999), and the amplitude of the ECG (Moody et al. 1986; Travagliniet al. 1998), might be useful for apnoea identification. We previously consideredboth types of features and successfully designed an ECG-based apnoea detectionsystem (de Chazal et al. 2003). Similar features were considered in this study.
Phil. Trans. R. Soc. A (2009)

RR intervalfeatures
heartbeat(fiducial point)
detection
LDclassifier
SpO2 signal
preprocessing
processing
epoch classification
baseline andhigh-frequency
filter
RR intervalcorrection
ECG modified lead V2
high-resolution (seven-way)epoch classifications
SpO2 classifierECG classifier
AHI estimation
proportion oftime in SDBcalculation
index calculation
EDRfeatures
EDRcalculation
SpO2features
SpO2 resampler
artefactrejection
baselineresampler
SpO2 baselineestimate
LDclassifier
two-way epochclassifications
classifier combiner
four-way epoch classifications
AI and HIestimation
proportion oftime in A andH calculation
three-way epoch classifications
AI
HIAHI
combinerclass
combiner class combining
Figure 1. Simultaneous ECG and oximetry system for identifying epochs of apnoea and estimatingAI, HI and AHI from overnight recordings.
P. de Chazal et al.374
Phil. Trans. R. Soc. A (2009)
on May 20, 2018http://rsta.royalsocietypublishing.org/Downloaded from
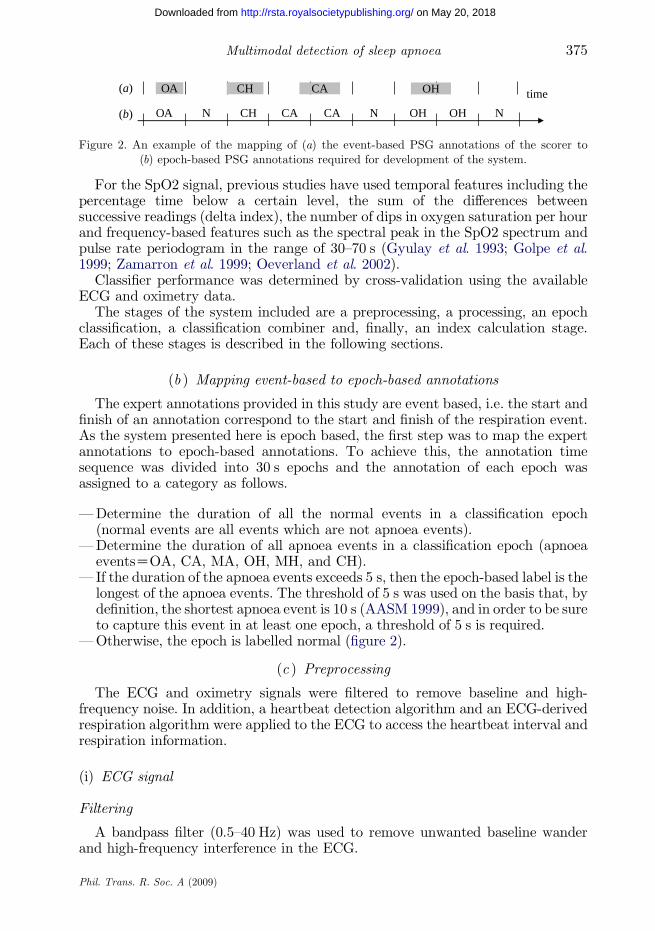
timeOA CH CA OH
(b)
(a)
OA N CH CA CA N OH OH N
Figure 2. An example of the mapping of (a) the event-based PSG annotations of the scorer to(b) epoch-based PSG annotations required for development of the system.
375Multimodal detection of sleep apnoea
on May 20, 2018http://rsta.royalsocietypublishing.org/Downloaded from
For the SpO2 signal, previous studies have used temporal features including thepercentage time below a certain level, the sum of the differences betweensuccessive readings (delta index), the number of dips in oxygen saturation per hourand frequency-based features such as the spectral peak in the SpO2 spectrum andpulse rate periodogram in the range of 30–70 s (Gyulay et al. 1993; Golpe et al.1999; Zamarron et al. 1999; Oeverland et al. 2002).
Classifier performance was determined by cross-validation using the availableECG and oximetry data.
The stages of the system included are a preprocessing, a processing, an epochclassification, a classification combiner and, finally, an index calculation stage.Each of these stages is described in the following sections.
(b ) Mapping event-based to epoch-based annotations
The expert annotations provided in this study are event based, i.e. the start andfinish of an annotation correspond to the start and finish of the respiration event.As the system presented here is epoch based, the first step was to map the expertannotations to epoch-based annotations. To achieve this, the annotation timesequence was divided into 30 s epochs and the annotation of each epoch wasassigned to a category as follows.
—Determine the duration of all the normal events in a classification epoch(normal events are all events which are not apnoea events).
—Determine the duration of all apnoea events in a classification epoch (apnoeaeventsZOA, CA, MA, OH, MH, and CH).
— If the duration of the apnoea events exceeds 5 s, then the epoch-based label is thelongest of the apnoea events. The threshold of 5 s was used on the basis that, bydefinition, the shortest apnoea event is 10 s (AASM 1999), and in order to be sureto capture this event in at least one epoch, a threshold of 5 s is required.
—Otherwise, the epoch is labelled normal (figure 2).
(c ) Preprocessing
The ECG and oximetry signals were filtered to remove baseline and high-frequency noise. In addition, a heartbeat detection algorithm and an ECG-derivedrespiration algorithm were applied to the ECG to access the heartbeat interval andrespiration information.
(i) ECG signal
Filtering
A bandpass filter (0.5–40 Hz) was used to remove unwanted baseline wanderand high-frequency interference in the ECG.
Phil. Trans. R. Soc. A (2009)

P. de Chazal et al.376
on May 20, 2018http://rsta.royalsocietypublishing.org/Downloaded from
Heartbeat detection
Our own QRS detector that determines QRS peaks (R-wave peaks) using fuzzyclassification of two ECG parameters was applied to the ECG data. The firstparameter is the normalized absolute amplitude of the ECG and the secondparameter is a measure derived from the three points of inflection in the QRS. Thedetection performance of the system has been validated on the MIT–BIHarrhythmia database (Mark & Moody 1997). It detects over 99 per cent of QRScomplexes with a false detection rate of less than 1 per cent.
RR interval correction
RR intervals were defined as the interval between successive QRS detectionpoints. Owing to poor signal quality and errors in the automatically generatedQRS detections, the RR interval sequences generated from the QRS detectiontimes contained physiologically unreasonable times. A first preprocessing stepprior to calculating the ECG features was to calculate a corrected RR intervalsequence where all intervals were physiologically reasonable. The followingautomatic algorithm was developed for this purpose.
Suspect RR intervals could be due to either spurious QRS detections ormissed QRS complexes. To identify them, a median filter of width 5 was appliedto the sequence of RR intervals, with the output of the filter providing a robustestimate of the expected value for each RR interval. Spurious QRS detectionswere found by comparing the sum of adjacent RR intervals with the robust RRinterval estimate. If this sum was numerically closer to the robust estimatethan either of the individual RR intervals, then a spurious detection wasdeemed to be present. The two RR intervals were merged to form a singleRR interval.
Conversely, we determined heuristically that if an RR interval was a factor of1.8 times or greater than the robust estimate, then it was probable that one ormore QRS complexes were missed. To estimate (interpolate) the times of themissing QRS complexes, the RR interval was divided by the sequence of integers 2,3, 4,. until it best matched the robust estimate of the RR interval. The singleRR interval was then subdivided by the appropriate integer to form a series ofnew detections.
(ii) ECG-derived respiratory signal
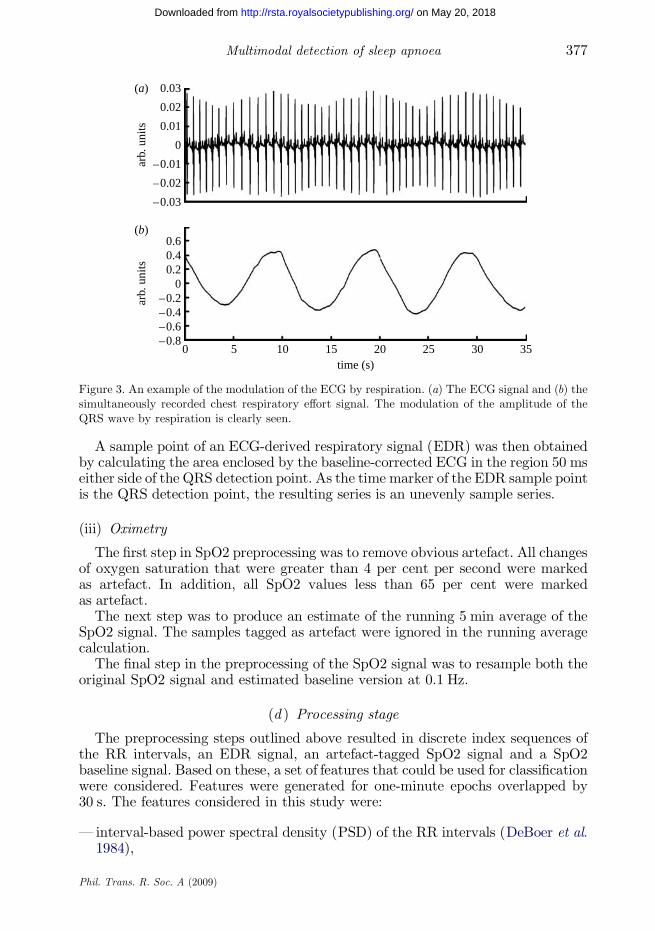
During the breathing cycle, the body surface ECG is influenced by electrodemotion relative to the heart and by changes in thoracic electrical impedance as thelungs fill with air and empty. The effect is most obviously seen as a slowmodulation of the ECG amplitude at the same frequency as the breathing cycle(Moody et al. 1986; Travaglini et al. 1998), as shown in figure 3.
To access this signal, the original ECG signal was filtered with two medianfilters to remove the baseline wander. The original ECG signal was processed witha median filter of 200 ms width to remove QRS complexes and P waves. Theresulting signal was then processed with a median filter of 600 ms width to removeT waves. The signal resulting from the second filter operation contained thebaseline of the ECG signal, which was then subtracted from the original signal toproduce the baseline-corrected ECG signal.
Phil. Trans. R. Soc. A (2009)
0
arb.
uni
tsar
b. u
nits
5 10 15 20time (s)
25 30 35
0.03(a)
(b)
0.02
0.01
0
–0.01
–0.02
–0.03
–0.8–0.6–0.4–0.2
00.20.40.6
Figure 3. An example of the modulation of the ECG by respiration. (a) The ECG signal and (b) thesimultaneously recorded chest respiratory effort signal. The modulation of the amplitude of theQRS wave by respiration is clearly seen.
377Multimodal detection of sleep apnoea
on May 20, 2018http://rsta.royalsocietypublishing.org/Downloaded from
A sample point of an ECG-derived respiratory signal (EDR) was then obtainedby calculating the area enclosed by the baseline-corrected ECG in the region 50 mseither side of the QRS detection point. As the time marker of the EDR sample pointis the QRS detection point, the resulting series is an unevenly sample series.
(iii) Oximetry
The first step in SpO2 preprocessing was to remove obvious artefact. All changesof oxygen saturation that were greater than 4 per cent per second were markedas artefact. In addition, all SpO2 values less than 65 per cent were markedas artefact.
The next step was to produce an estimate of the running 5 min average of theSpO2 signal. The samples tagged as artefact were ignored in the running averagecalculation.
The final step in the preprocessing of the SpO2 signal was to resample both theoriginal SpO2 signal and estimated baseline version at 0.1 Hz.
(d ) Processing stage
The preprocessing steps outlined above resulted in discrete index sequences ofthe RR intervals, an EDR signal, an artefact-tagged SpO2 signal and a SpO2baseline signal. Based on these, a set of features that could be used for classificationwere considered. Features were generated for one-minute epochs overlapped by30 s. The features considered in this study were:
— interval-based power spectral density (PSD) of the RR intervals (DeBoer et al.1984),
Phil. Trans. R. Soc. A (2009)

Table 3. Summary of the features per epoch used for the ECG and oximetry classifier.
ECG (72 features) oximetry (7 features)
32 RR PSD mean SpO2 value5 serial correlation minimum SpO2 valuestandard deviation of RR number of samples of SpO2!92%SDSD 5–95% spread of SpO2mean(RR) mean of absolute differences of SpO232 EDR PSD number of samples of (SpO2-baseline(SpO2))O3%
number of samples of (SpO2-baseline(SpO2))!K3%
P. de Chazal et al.378
on May 20, 2018http://rsta.royalsocietypublishing.org/Downloaded from
—heart rate variability time-domain features (Task 1996; Hilton et al. 1999; Teichet al. 2000),
— the PSD of the EDR signal, and—oximetry time-domain features.
It is worth noting that none of the measures listed above consider themorphology of the ECG. It is implicitly assumed that the processes leading toapnoea occur at a location external to the heart and thus do not directly affect thegenerated cardiac potentials. Table 3 summarizes the features used in this study.
(i) ECG-based features
The first step in calculating features from the RR intervals was to assess thequality of the RR interval sequence. If the average calculated heart rate was below30 beats per minute (bpm) or greater than 180 bpm or if four or more RR intervalswere interpolated, then the RR intervals were considered artefact and RR featureswere not calculated for the epoch. If RR quality was acceptable, then featuresbased on frequency and time-domain calculations were calculated.
(ii) RR interval frequency features
An interval-based RR interval PSD was calculated in the following way.A sequence of RR intervals was associated with each one-minute segment. Theindex for this sequence was beat number, not time. The mean RR interval for thatsegment was removed from each value, to yield a zero-mean sequence. Thesequence was zero padded to length 256, and the fast Fourier transform (FFT) wastaken of the entire sequence. The magnitudes of the FFT coefficients were squaredto yield a periodogram estimate of the PSD, which had high variance. Averaging offour adjacent frequency bins yielded a 64-point PSD estimate of which only thefirst 32 points were used as features (due to the symmetry of the upper and lowerPSD point estimates). The x -axis has units of cycles per interval.
(iii) RR interval time-domain features
Time-domain features used included:
— the first five serial correlation coefficients corresponding to a delay of one to fiveRR intervals,
Phil. Trans. R. Soc. A (2009)

379Multimodal detection of sleep apnoea
on May 20, 2018http://rsta.royalsocietypublishing.org/Downloaded from
—the standard deviation of the RR intervals,— the standard deviation of the change in RR intervals (SDSD), and—the mean epoch RR interval.
(iv) EDR features
Before features were extracted for the EDR signal, the influence of ectopic beatsand position changes were first removed. A 100-point moving sorting filter wasapplied to the EDR signal and the 50 per cent output tap saved as an EDRmedian
signal. The filter was then reapplied and the difference of the 3 per cent and 97 percent taps of the sorting filter was calculated (a measure of spread) and saved asEDRspread. Differences between the original EDR and EDRmedian greater than 1.8times EDRspread were labelled as artefact in the EDR signal. The effect of this filterwas that when the proportion of ectopic beats was less than 3 per cent, then thesebeats were excluded from the EDR feature calculation, otherwise they wereincluded.
If no artefact was detected in the EDR signal, then the EDR signal wasnormalized by subtracting the mean and dividing by the standard deviation foreach epoch of values. Features were obtained from the EDR PSD in a similarfashion to the RR interval PSD except that the normalized EDR values wereinputs for the PSD calculation. The spectral variable was also defined as cyclesper interval.
(v) Oximetry-based features
If no artefact was detected in the oximetry signal in an epoch, then the followingtemporal SpO2 saturation features were calculated for each one-minute epoch,using the resampled signal:
— the mean SpO2 value,— the minimum SpO2 value,— the number of SpO2 values of less than 92 per cent saturation,— the 5–95 per cent spread in the sorted SpO2 values, and—the mean of the absolute differences between successive SpO2 samples.
In addition, the following two features were calculated using both the resampledSpO2 and estimated SpO2 baseline signals:
— count the number of times the SpO2 is greater than the SpO2 estimatedbaseline by 3 per cent or more (i.e. a resaturation of 3% or more), and
—count the number of times the SpO2 is less than the SpO2 estimated baseline by3 per cent or more (i.e. a desaturation of 3% or more).
(e ) Epoch classification stage
Classifier models based on LD were used throughout this study. The modelparameters mk, class conditional mean vectors, and S, common covariance matrix,were determined using the training data using ‘plug-in’ maximum-likelihoodestimates (Ripley 1996; de Chazal et al. 2007). The prior probabilities of theclasses were set equal.
Phil. Trans. R. Soc. A (2009)

two-way classes
three-way classes
seven-way classes
SDB
obstructive (O) H
OA OHMA MH CH
normal (NM)
NM
CA
apnoea (A)
four-way classes
CA
NM
NM hypopnoea (H)
Figure 4. Flow graph demonstrating how the high-resolution annotations (seven-way classes) arecombined to form the lower resolution classes.
P. de Chazal et al.380
on May 20, 2018http://rsta.royalsocietypublishing.org/Downloaded from
(i) Combining classifiers
To obtain a classification based on processing information from multiple featuresets (i.e. multimodal) simultaneously, the posterior probabilities obtained fromtwo feature sets were combined across the separate classifier outputs. The outputsfrom two classifiers were combined using the weighted Bayesian additionintegration scheme (Bloch 1996). We used a weight of 80 per cent for theoximetry classifier and 20 per cent for the ECG classifier. The final posteriorprobability output �PðkjxÞ was calculated from the individual classifier outputs(PECG(kjx) and PSpO2ðkjxÞ) using
�PðkjxÞZ 0:2 PECGðkjxÞC0:8 PSpO2ðkjxÞ: ð3:1ÞThe final classification is obtained by choosing the class with the highest
posterior probability estimate, i.e.
CðxÞZ arg maxð �PðkjxÞÞ; k Z 1;.; c: ð3:2ÞIn the event that one of PECG(kjx) or PSpO2ðkjxÞ cannot be calculated due to
signal artefact, then �PðkjxÞ is set equal to the output of the good classifier output.If both outputs are corrupted by artefact, then �PðkjxÞ is not defined and the epochis not classified.
(f ) Class combining stage
The high-resolution annotations (NM, CA, CH, MA, MH, OA and OH) that areprovided by the classification stage are combined into a series of class groups andfinally end up as a sequence of NM and SDB classifications. Starting with the high-resolution annotations, the flow graph in figure 4 shows the progression ofcombining classes from the seven-way to the two-way classifications. Usingfigure 4, the following examples demonstrate the method of combining.
If the high-resolution annotation is
—NM, then the four-way, three-way and two-way annotation is NM;—MA, then the four-way annotation is O, the three-way annotation is A and the
two-way annotation is SDB; and—CH, then the four-way annotation is H, the three-way annotation is H and the
two-way annotation is SDB.
Phil. Trans. R. Soc. A (2009)

381Multimodal detection of sleep apnoea
on May 20, 2018http://rsta.royalsocietypublishing.org/Downloaded from
(g ) AHI calculation stage
The final step was to estimate the indices AI, HI and AHI using the epoch-basedannotations. We first note that
AHIZAICHI; ð3:3Þand the relationship between the estimated average minutes per hour of apnoea(MA), hypopnoea (MH) and SDB (MSDB) is
MSDB ZMACMH; ð3:4Þwhere MA (MH) is determined by summing the duration of epochs in minuteslabelled as apnoea (hypopnoea) from the three-way annotations and dividing bythe duration of the recording in hours. In a similar fashion,MSDB is calculated fromthe two-way annotations.
We then assumed a linear relationship (with the intercept passing through theorigin) between the estimated average minutes-per-hour figure and thecorresponding index, i.e.
AIZKMA HIZKMH
AHIZKMSDB
)ð3:5Þ
noting that in order to satisfy equations (3.3) and (3.4), the same K must be usedthroughout.
The value of K was calculated using linear regression with no intercept(Armitage 1987) applied to the AHI values and the MSDB values from availabletraining data. The value of K was then used in all subsequent recordings processed.It is worth noting that the AI and MA or the HI and MH values could also havebeen used to estimate K.
(h ) Performance measures
(i) Epoch based
To evaluate the performance of the systems, the classification matrix in table 4was formed and then specificity, sensitivities, predictivities, accuracy and kappacalculated as follows:
— sensitivity for class i: Sei ZNii=Ni�—specificity: SpZN00=N0�—accuracy: AccZ
XNii=N��; and
— kappa: K Z ðAccKEVÞ=ð1KEVÞ : EVZX
Ni�N�i=N2��:
(ii) AHI estimation
The second set of performance measures examined the performance of the systemin separating normal subjects (AHI%5) from apnoea subjects (AHIO15) on thebasis of AHI. It is worth noting that mild (borderline) cases (5!AHI%15) weredeliberately excluded from this performance measure. First, the clinicallydetermined AHIs were used to determine the clinical classification using thepredetermined AHI thresholds and used to categorize the record as ‘normal’,‘borderline’ or ‘apnoea’. Second, the estimated AHI was determined and the recordcategorized as normal or apnoea using a predetermined threshold on the predictedAHI value (table 5).
Phil. Trans. R. Soc. A (2009)

Table 4. Multiway confusion matrix.
diagnostic allocation
true status normal class 1 class 2 . class n sum
normal N00 N01 N02 N0n N0�class 1 N10 N11 N12 N1n N1�class 2 N20 N21 N22 N2n N2*
«class n Nn0 Nn1 Nn2 Nnn Nn�sum N�0 N�1 N�2 N�n N��
Table 5. Confusion matrix for per-subject AHI assessment. (AHIP, predicted AHI value; AHIC,clinical AHI value.)
clinical AHI
normal(AHIC%5)
borderline(5!AHIC%15)
apnoea(AHICO15)
predicted AHI normal (AHIP%10) TN – FNapnoea (AHIPO10) FP – TP
P. de Chazal et al.382
on May 20, 2018http://rsta.royalsocietypublishing.org/Downloaded from
By inspecting each record label as predicted by the system and the associatedexpert annotation, a comparison was made of the labels and the outcomedetermined as one of the following.
—True positive (TP): a record is labelled as Apnoea by the expert and labelled asApnoea by the system.
—True negative (TN): a record is labelled as Normal by the expert and labelled asNormal by the system.
—False positive (FP): a record is labelled as Normal by the expert and labelled asApnoea by the system.
—False negative (FN): a record is labelled as Apnoea by the expert and labelled asNormal by the system.
Counts of these outcomes over all records were made and the confusion matrixformed as shown in table 5.Next, the following performancemeasureswere calculated:
— specificityZTN/(TNCFP),—sensitivityZTP/(TPCFN), and—accuracyZ(TNCTP)/(TPCTNCFNCFP).
(i ) Classifier performance estimation
In this study, we used the leave-one-out cross-validation scheme (Bishop 1995;Kohavi 1995), where all but one available examples are used for training and oneexample used for testing. To achieve this, in turn, each recording was reserved as
Phil. Trans. R. Soc. A (2009)

383Multimodal detection of sleep apnoea
on May 20, 2018http://rsta.royalsocietypublishing.org/Downloaded from
the test record and the remaining 182 records used as the training data. As we wereprocessing 183 recordings to complete a run of cross-validation, 183 classifiers weretrained and tested.
To ensure that there was no bias in the AHI results, the 182 recordings used astraining data were used to determine the value of K in equation (3.5), which wasthen applied to the minutes-per-hour figures of the test record.
4. Results and discussion
(a ) Epoch-based classification
Table 6 reports the epoch-based classification performance in terms of specificity,sensitivity, accuracy and Cohen’s kappa coefficient. While specificity of the systemis high (87%), none of the six classes of SDB shown in the seven-way results columnachieved high sensitivities. They ranged between 9 per cent for OHs and 27 per centfor MAs. The kappa value was 0.35, with an overall accuracy of 69 per cent.
The picture improved after combining the hypopnoea classes and combiningthe MA and OA classes to form the four-way classification results. In thisset of results, the sensitivity of the O (OACMA) class was 51 per cent, thesensitivity of the hypopnoea class was 48 per cent while, as for the seven-wayresults, the CA sensitivity and the specificity remained at 12 per cent and87 per cent, respectively.
The three-way results focus on the capability of the system to separate epochs ofnormal breathing from apnoeas and hypopnoeas. The system achieved a 55 per centsensitivity for identifying apnoeas and 48 per cent for identifying hypopnoeas. Weascribe the lower sensitivity for hypopnoea to the fact that hypopnoeas have lessbreathing amplitude changes and may lead to relatively modest desaturations, andthus are more difficult to detect.
Finally, the two-way results (all SDB classes treated as one class) resulted in asensitivity of 84 per cent for the SDB class and, as before, a specificity of 87 per cent.The overall accuracy was 86 per cent and a kappa value of 0.66.
(b ) Apnoea and hypopnoea index estimation
From the clinician’s viewpoint, a more useful insight into the system is theperformance of the system on a per-subject basis as shown in table 7 and figure 5. Thesystem shows excellent performance in terms of sensitivity, and also has highspecificity.Wealsonote that all caseswere classifiedby the system,whereas a separateset of experiments usingapurely oximetry-based systemandECG-based systemcouldnot classify eight and two cases, respectively, due to poor signal quality.
It is instructive to carefully consider the 138 non-borderline cases (i.e. AHI%5 orAHIO15) in order to determine the confounding factors in the analysis.
The system successfully classified all the severe apnoea cases (AHIO30). All thefalse negatives corresponded to expert-determined AHIs in the range between 15and 25, with the majority of events for these records being either hypopnoeas orCAs. These results suggest (not surprisingly) that the system performs best atidentifying OAs and less well at hypopnoeas. Levy et al. (1996) also noted thathypopnoeas often lead to minimal desaturations. The sensitivity and specificity ofour system are comparable with other reported systems.
Phil. Trans. R. Soc. A (2009)

Table 6. Epoch-based classification results for the range of annotation resolutions (information onannotation combining is shown in figure 4).
seven-way four-way three-way two-way
class OA OH CA CH MA MH O CA H A H SDBsensitivity (%) 22 9 12 25 27 22 51 12 48 55 48 84specificity (%) 87 87 87 87
accuracy (%) 69 77 78 86kappa 0.35 0.49 0.50 0.66
P. de Chazal et al.384
on May 20, 2018http://rsta.royalsocietypublishing.org/Downloaded from
Stein et al. (2003) reported on a technique to identify subjects with OSAS byvisual inspection of RR tachograms by training a human scorer to recognizecharacteristic cyclical variations in heart rate (CVHR) associated with obstructiveevents. The magnitude and frequency of occurrence of these CVHRs were thenused to classify 11 control subjects and 46 clinical subjects in terms of OSAS. Thepositive predictive accuracy was 86 per cent and the negative predictive accuracywas 94 per cent (which corresponds to a sensitivity of 97% and a specificity of 77%)in distinguishing subjects with AHIO15 from those with lower AHIs. The need forthe human scorer may limit the clinical application of this method.
Roche et al. (1999) have presented several reports on automated recognition ofsubjects with OSAS using analysis of heart rate variability (interbeat interval times:Roche et al. 2002; and wavelet-based analysis of the RR interval series: Roche et al.2003). Their best system was their wavelet-based analysis applied to 147 subjects,which resulted in a sensitivity and specificity of 92 per cent and 90 per cent,respectively. Their techniques do not provide any temporal information about theoccurrence of the apnoeic events, nor do they attempt to map their output variablesto AHI. Another issue is that they do not report on differences between subjectswith primarily central versus OA.
Levy et al. (1996) using an oximetry-only system reported on a study of 301adults and found a sensitivity of 98 per cent with a specificity of 46 per cent indistinguishing AHIO15. Yamashiro & Kryger (1995) used nocturnal oximetry as ascreener for OSA and achieved a sensitivity of 90 per cent and specificity of 75 percent; however, they had to reject 10 per cent of subjects from the study due to poorSpO2 signal quality. In an adult population, Zamarron et al. (1999) used spectralanalysis of the oximetry signal to screen for OSA and found a sensitivity of 78 percent and a specificity of 89 per cent.
In our own study (de Chazal et al. 2007) on 125 subjects, we compared an ECG-only, an oximetry-only and an ECG–oximetry system and concluded that thesensitivity (Se) and specificity (Sp) of the oximetry-only system (SeZ94%, SpZ93%) was superior to the ECG-only system (SeZ92%, SpZ65%) and comparablewith the ECG–oximetry system (SeZ94%, SpZ94%). The principal benefits of theECG–oximetry system were the ability of the system to perform an analysis inthe event of either the ECG or oximetry channels providing poor-quality data andthe possibility of linking periods of apnoea with any associated arrhythmia events.
As a final comment, it is worth noting that the performance of the system on the45 borderline recordings was a sensitivity of 84 per cent and a specificity of 60 percent using a decision threshold of AHIZ10. These results highlight the fact that
Phil. Trans. R. Soc. A (2009)
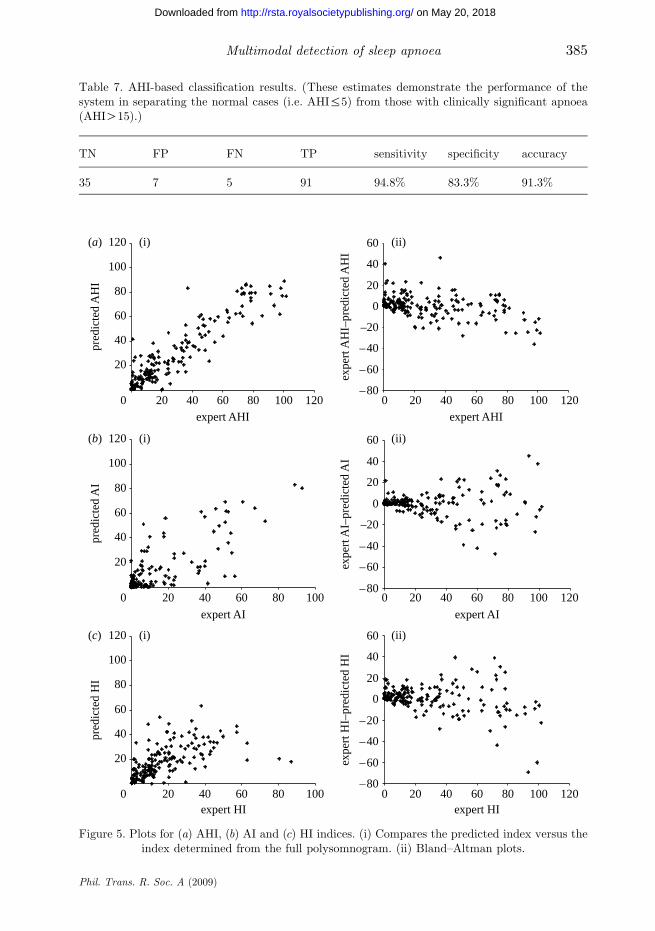
Table 7. AHI-based classification results. (These estimates demonstrate the performance of thesystem in separating the normal cases (i.e. AHI%5) from those with clinically significant apnoea(AHIO15).)
TN FP FN TP sensitivity specificity accuracy
35 7 5 91 94.8% 83.3% 91.3%
0
20
40
60
80
100
120(a) (i) (ii)
(i) (ii)
(i) (ii)
(b)
(c)
20 40 60 80 100 120expert AHI
20 40 60 80 100
expert AI
20 40 60 80 100expert HI
0 20 40 60 80 100 120expert HI
0 20 40 60 80 100 120
expert AI
0 20 40 60 80 100 120expert AHI
pred
icte
d A
HI
–80
–60
–40
–20
0
20
40
60
expe
rt A
HI–
pred
icte
d A
HI
0
20
40
60
80
100
120
pred
icte
d A
I
–80
–60
–40
–20
0
20
40
60
expe
rt A
I–pr
edic
ted
AI
0
20
40
60
80
100
120
pred
icte
d H
I
–80
–60
–40
–20
0
20
40
60
expe
rt H
I–pr
edic
ted
HI
Figure 5. Plots for (a) AHI, (b) AI and (c) HI indices. (i) Compares the predicted index versus theindex determined from the full polysomnogram. (ii) Bland–Altman plots.
385Multimodal detection of sleep apnoea
Phil. Trans. R. Soc. A (2009)
on May 20, 2018http://rsta.royalsocietypublishing.org/Downloaded from

P. de Chazal et al.386
on May 20, 2018http://rsta.royalsocietypublishing.org/Downloaded from
borderline recordings are more difficult to classify than non-borderline cases andthat other clinical evidence is generally required to make an accurate diagnosis.
(i) Clinical impact
It is well documented that sleep apnoea impacts significantly on thecardiovascular system and that many sufferers of cardiovascular disease haveassociated sleep apnoea (Nieto et al. 2000; Newman et al. 2001; Phillips &Somers 2002; Sjostrom et al. 2002; Shamsuzzaman et al. 2003; McNicholaset al. 2007).
We believe that it makes sense from a clinical perspective to perform cardiacmonitoring and sleep apnoea screening analysis simultaneously. Holter monitoring isalready widely carried out (nearly 1 million Holter tests are carried out per annumin the USA), and has been suggested as a mechanism for simultaneous screening forsleep apnoea. We believe that a more clinically accurate and physiologicallymeaningful screening tool can be provided by combining a standard Holter ECGrecorder with a simultaneous oximetry recording. The benefits of a system includeits robustness to signal acquisition problems, ability to identify different types ofsleep-disordered events, direct identification of desaturation events and the facilityto investigate nocturnal arrhythmias to understand whether their underlyingcause is apnoea related. In this way, cardiologists could routinely identify candidatesfor full evaluation by sleep laboratories, who have a high likelihood of havingsleep apnoea.
Finally, it is worth noting that we have selected subjects that are free ofarrhythmias (apart from those induced by apnoea) and of concurrent diseases ormedication affecting the autonomous nervous system. While any influence thatcauses a cyclical variation of heart rate similar to the changes seen during apnoeawill undoubtedly impact on our system, we believe the impact will be minimized asour final classification is based on information from heart rate variability, EDRand oximetry.
5. Conclusion
We have presented a system for the automatic classification of simultaneouslyrecorded ECG and oximetry signals for screening subjects for sleep apnoea. Thesystem identifies epochs of SDB and annotates them as obstructive, central or MAsor hypopnoeas. This system has been trained and validated on a clinicallysignificant group of 183 subjects. The system provides estimated indices includingAHI, HI and AI, and the temporal sequence of apnoea events during the night,which can assist a clinician in forming a diagnosis. The performance of the reportedscreening systems either matches or surpasses other systems that have previouslybeen reported. Using ECG and oximetry signals offers benefits over using eithersignal alone. First, the combination is inherently more robust, as in the event ofeither channel being poor quality, the system can continue to make an analysisbased on the other channel. Second, periods of apnoea and hypopnoea can bedirectly linked to oxygen desaturations and any associated arrhythmia events.Third, the profile of sleep apnoea has risen in recent years among cardiologistsdue to increased recognition of the disorder as an important contributing factorto cardiovascular morbidity. The proposed system may facilitate a higher
Phil. Trans. R. Soc. A (2009)
387Multimodal detection of sleep apnoea
on May 20, 2018http://rsta.royalsocietypublishing.org/Downloaded from
involvement of cardiologists in the clinical management of SDB since theevaluation of possible sleep apnoea by this technique can be performed as partof routine Holter monitoring.
References
American Academy of Sleep Medicine Task Force 1999 Sleep-related breathing disorders in adults:
recommendations for syndrome definition and measurement techniques in clinical research. Sleep
22, 667–689.
Armitage, P. 1987 Statistical methods in medical research, 2nd edn. Boston, MA: Blackwell Scientific
Publications.
Bishop, C. M. 1995 Neural networks for pattern recognition. New York, NY: Oxford University Press.
Bloch, I. 1996 Information combination operators for data fusion: a comparative review with
classification. IEEE Trans. Syst. Man Cybernet. A 26, 52–67. (doi:10.1109/3468.477860)
Chiner, E., Signes-Costa, J., Arriero, J. M., Marco, J., Fuentes, I. & Sergado, A. 1999 Nocturnal
oximetry for the diagnosis of the sleep apnoea hypopnoea syndrome: a method to reduce the
number of polysomnographies? Thorax 54, 968–971.
Chobanian, A. V. et al. 2003 Seventh report of the joint national committee on prevention, detection,
evaluation, and treatment of high blood pressure. Hypertension. 42, 1206–1252. (doi:10.1161/01.
HYP.0000107251.49515.c2)
Dingli, K., Assimakopoulos, T., Wraith, P. K., Fietze, I., Witt, C. & Douglas, N. J. 2003 Spectral
oscillations of RR intervals in sleep apnoea/hypopnoea syndrome patients. Eur. Respir. J. 22,
943–950. (doi:10.1183/09031936.03.00098002)
DeBoer, R. W., Karemaker, J. M. & Strackee, J. 1984 Comparing spectra of a series of point events
particularly for heart rate variability data. IEEE Trans. Biomed. Eng. 31, 384–387. (doi:10.1109/
TBME.1984.325351)
de Chazal, P., Heneghan, C., Sheridan, E., Reilly, R., Nolan, P. & O’Malley, M. 2003 Automated
processing of the single lead electrocardiogram for the detection of obstructive sleep apnoea. IEEE
Trans. Biomed. Eng. 50, 686–696. (doi:10.1109/TBME.2003.812203)
de Chazal, P., Heneghan, C., Chua, C. P., Shouldice, R., Liam, D., Ryan, S. & McNicholas, W. T.
2007 Home-based assessment of sleep apnea using simultaneous electrocardiogram and oximtery
signals. In Progress in sleep apnea research (ed. R. T. Ferber), pp. 115–139, Hauppauge, NY: Nova
Science Publishers.
Doherty, L. S., Kiely, J. L., Swan, V. & McNicholas, W. T. 2005 Long-term effects of nasal continuous
positive airway pressure therapy on cardiovascular outcomes in sleep apnea syndrome. Chest 127,
2076–2084. (doi:10.1378/chest.127.6.2076)
Flemons, W. W., Douglas, N. J., Kuna, S. T., Rodenstein, D. O. & Wheatley, J. 2004 Access to
diagnosis and treatment of patients with suspected sleep apnea. Am. J. Respir. Crit. Care Med.
169, 668–672. (doi:10.1164/rccm.200308-1124PP)
Gislason, T. & Benediktsdottir, B. 1995 Snoring, apneic episodes, and nocturnal hypoxemia among
children 6 months to 6 years old. An epidemiologic study of lower limit of prevalence. Chest 107,
963–966. (doi:10.1378/chest.107.4.963)
Golpe, R., Jimenez, A., Carpizo, R. & Cifrian, J. M. 1999 Utility of home oximetry as a screening test
for patients with moderate to severe symptoms of obstructive sleep apnoea. Sleep 22, 932–937.
Guilleminault, C., Connolly, S. J., Winkle, R., Melvin, K. & Tilkian, A. 1984 Cyclical variation of the
heart rate in sleep apnoea syndrome. Mechanisms and usefulness of 24h electrocardiography as a
screening technique. Lancet 1, 126–131. (doi:10.1016/S0140-6736(84)90062-X)
Gyulay, S., Olson, L. G., Hensley, M. J., King, M. T., Allen, K. M. & Saunders, N. A. 1993 A
comparison of clinical assessment and home oximetry in the diagnosis of obstructive sleep apnoea.
Am. Rev. Respir. Dis. 147, 50–53.
Phil. Trans. R. Soc. A (2009)

P. de Chazal et al.388
on May 20, 2018http://rsta.royalsocietypublishing.org/Downloaded from
Hilton, M. F., Bates, R. A., Godfrey, K. R., Chappell, M. J. & Cayton, R. M. 1999 Evaluation of
frequency and time–frequency spectral analysis of heart rate variability as a diagnostic marker ofthe sleep apnoea syndrome. Med. Biol. Eng. Comput. 37, 760–769. (doi:10.1007/BF02513379)
Johns, M. W. 1991 A new method for measuring data and sleepiness: Epworth sleepiness scale. Sleep14, 540–545.
Kohavi, R. 1995 A study of cross validation and bootstrap for accuracy estimation and modelselection. In Proc. 14th Int. Joint Conference on Artificial Intelligence, pp. 1137–1143.
Kushida, C. A. et al. 2005 Practice parameters for the indications for polysomnography and related
procedures: an update for 2005. Sleep 28, 499–521.Levy, P., Pepin, J. L., Deschaux-Blanc, C., Paramelle, B. & Brambilla, C. 1996 Accuracy of oximetry
for detection of respiratory disturbances in sleep apnoea syndrome. Chest 109, 395–399. (doi:10.1378/chest.109.2.395)
Marin, J. M., Carrizo, S. J., Vicente, E. & Agusti, A. G. 2005 Long-term cardiovascular outcomes inmen with obstructive sleep apnoea–hypopnoea with or without treatment with continuous positive
airway pressure: an observational study. Lancet 365, 1046–1053.Mark, R. & Moody, G. 1997 MIT-BIH arrhythmia database. See http://ecg.mit.edu/dbinfo.html.McNicholas, W. T., Bonsignore, M. R. & Management Committee of EU COST ACTION B26 2007
Sleep apnoea as an independent risk factor for cardiovascular disease: current evidence, basic
mechanisms and research priorities. Eur. Respir. J. 29 156–178.Moody, G. B., Mark, R. G., Zoccola, A. & Mantero, S. 1986 Clinical validation of the ECG-derived
respiration (EDR) technique. In Computers in cardiology, vol. 13, pp. 507–510. Washington, DC:IEEE Computer Society Press.
Newman, A. B., Nieto, F. J., Guidry, U., Lind, B. K., Redline, S., Shahar, E., Pickering, T. G., Quan,S. F. & for the Sleep Heart Health Study Research Group 2001 Relation of sleep-disordered
breathing to cardiovascular disease risk factors—the sleep heart health study. Am. J. Epidemiol.154, 50–59.
Nieto, F. J. et al. 2000 Association of sleep-disordered breathing, sleep apnoea, and hypertension in alarge community-based study. J. Am.Med. Assoc. 283, 1829–1836. (doi:10.1001/jama.283.14.1829)
Oeverland, B., Skatvedt, O., Kvaerner, K. J. & Akre, H. 2002 Pulse oximetry: sufficient to diagnosesevere sleep apnoea. Sleep Med. 3, 133–138. (doi:10.1016/S1389-9457(01)00122-8)
Penzel, T. 2000 The apnoea-ECG database. In Computers in cardiology, vol. 27, pp. 255–258.Piscataway, NJ: IEEE Press.
Phillips, B. G. & Somers, V. K. 2002 Sleep disordered breathing and risk factors for cardiovascular
disease. Curr. Opin. Pulm. Med. 8, 516–520. (doi:10.1097/00063198-200211000-00006)Ripley, B. D. 1996 Pattern recognition and neural networks. Cambridge, UK: Cambridge University
Press.Roche, F., Gaspoz, J. M., Court-Fortune, I., Minini, P., Pichot, V., Duverney, D., Costes, F., Lacour,
J. R. & Barthelemy, J. C. 1999 Screening of obstructive sleep apnoea syndrome by heart ratevariability analysis. Circulation 100, 1411–1415.
Roche, F., Duverney, D., Court-Fortune, I., Pichot, V., Costes, F., Lacour, J. R., Antoniadis, A.,Gaspoz, J. M. & Barthelemy, J. C. 2002 Cardiac interbeat interval increment for the identification
of obstructive sleep apnoea. Pacing Clin. Electrophysiol. 25, 1192–1199. (doi:10.1046/j.1460-9592.2002.01192.x)
Roche, F., Pichot, V., Sforza, E., Court-Fortune, I., Duverney, D., Costes, F., Garet, M. &Barthelemy, J. C. 2003 Predicting sleep apnoea from heart period: a time–frequency wavelet
analysis. Eur. Respir. J. 22, 937–942. (doi:10.1183/09031936.03.00104902)Series, F. 2002 Interpretation of home oximetry tracings. Chest 121, 1006–1007. (doi:10.1378/chest.
121.3.1006-a)Shamsuzzaman, A. S., Gersh, B. J. & Somers, V. K. 2003 Obstructive sleep apnoea: implications for
cardiac and vascular disease. J. Am. Med. Assoc. 290, 1906–1914. (doi:10.1001/jama.290.14.1906)Sjostrom, C., Lindberg, E., Elmasry, A., Hagg, A., Svardsudd, K. & Janson, C. 2002 Prevalence of
sleep apnoea and snoring in hypertensive men: a population based study. Thorax 57, 602–607.(doi:10.1136/thorax.57.7.602)
Phil. Trans. R. Soc. A (2009)

389Multimodal detection of sleep apnoea
on May 20, 2018http://rsta.royalsocietypublishing.org/Downloaded from
Stein, P. K., Duntley, S. P., Domitrovich, P. P., Nishith, P. & Carney, R. M. 2003 A simple method toidentify sleep apnoea using Holter recordings. J. Cardiovasc. Electrophyiol. 14, 467–473. (doi:10.1046/j.1540-8167.2003.02441.x)
Task Force of the European Society of Cardiology and the North American Society of Pacing andElectrophysiology 1996 Heart rate variability—standards of measurement, physiological interpre-tation and clinical use. Eur. Heart J. 17, 354–382.
Teich, M. C., Lowen, S. B., Jost, B. M., Vibe-Rheymer, K. & Heneghan, C. 2000 Heart ratevariability: measures and models. In Nonlinear biomedical signal processing, vol. II (ed. M. Akay),pp. 159–213. Piscataway, NJ: IEEE Press.
Travaglini, A., Lamberti, C., DeBie, J. & Ferri, M. 1998 Respiratory signal derived from eight-leadECG. In Computers in cardiology, vol. 25, pp. 65–68. Piscataway, NJ: IEEE Press.
Yamashiro, Y. & Kryger, M. H. 1995 Nocturnal oximetry: is it a screening tool for sleep disorders?Sleep 18, 167–171.
Young, T., Palta, M., Dempsey, J., Skatrud, J., Weber, S. & Badr, S. 1993 The occurrence of sleep-disordered breathing among middle-aged adults. N. Engl. J. Med. 328, 1230–1235. (doi:10.1056/NEJM199304293281704)
Young, T., Evans, L., Finn, L. & Palta, M. 1997 Estimation of the clinically diagnosed proportion ofsleep apnoea syndrome in middle-aged men and women. Sleep 20, 705–706.
Zamarron, C., Romero, P. V., Rodriguez, J. R. & Gude, F. 1999 Oximetry spectral analysis in thediagnosis of obstructive sleep apnoea. Clin. Sci. (Lond.) 97, 467–473.
Phil. Trans. R. Soc. A (2009)

![Screening Obstructive Sleep Apnoea Syndrome from … · A machine learning technique [support vector machines (SVM)] for automated recognition of obstructive sleep apnoea syndrome](https://static.fdocuments.in/doc/165x107/60003a93cf04ca4fd73b50dc/screening-obstructive-sleep-apnoea-syndrome-from-a-machine-learning-technique-support.jpg)