
Multimodal Chromatography Handbook - Sigma-Aldrich · Multimodal Chromatography – Handbook ......
115
GE Healthcare Life Sciences Multimodal Chromatography Handbook
Transcript of Multimodal Chromatography Handbook - Sigma-Aldrich · Multimodal Chromatography – Handbook ......
Multim
odal Chrom
atography – Handbook
imagination at work29-0548-08 AA 11/2013
GE, imagination at work, and GE monogram are trademarks of General Electric Company.
ÄKTA, ÄKTAmicro, ÄKTApilot, AxiChrom, BioProcess, Capto, Chromaflow, Cytodex, HiTrap, HiPrep, HiScale, HiScreen, HiTrap, MabSelect, MabSelect SuRe, Mono Q, PhastGel, PreDictor, ReadyToProcess, Sepharose, Superdex, Tricorn, ULTA, UNICORN, and Drop design are trademarks of GE Healthcare companies.
UNICORN software: Any use of UNICORN software is subject to GE Healthcare Standard Software End-User License Agreement for Life Sciences Software Products. A copy of this Standard Software End-User License Agreement is available on request.
Capto Q chromatography media: Separating viral particles with Capto Q chromatography media may require a license under United States Patent 6,537,793 B2 and foreign equivalents owned by Centelion SAS.
Applikon is a trademark of Applikon Biotechnology BV. Benzonase is a trademark of Merck KGaA. Breox and Pluronic are trademarks of BASF Corp. Coomassie and Tween are trademarks of Imperial Chemical Industries, PLC. Desmophen is a trademark of the Bayer Group. Freedom EVO and Tecan are trademarks of Tecan Group Ltd. MODDE is a trademark of Umetrics AB. RoboColumn is a trademark of Atoll GmbH. Struktol is a trademark of Schill + Seilacher “Struktol” GmbH. Triton is a trademark of Dow Chemical Co.
© 2013 General Electric Company – All rights reserved. First published Nov. 2013.
All goods and services are sold subject to the terms and conditions of sale of the company within GE Healthcare which supplies them. A copy of these terms and conditions is available on request. Contact your local GE Healthcare representative for the most current information.
GE Healthcare UK Limited Amersham Place Little Chalfont Buckinghamshire, HP7 9NA UK
GE Healthcare Europe, GmbH Munzinger Strasse 5 D-79111 Freiburg Germany
GE Healthcare Bio-Sciences Corp. 800 Centennial Avenue, P.O. Box 1327 Piscataway, NJ 08855-1327 USA
GE Healthcare Japan Corp. Sanken Bldg., 3-25-1, Hyakunincho Shinjuku-ku, Tokyo 169-0073 Japan
For local office contact information,please visit www.gelifesciences.com/contact
www.gelifesciences.com/bioprocess
GE Healthcare Bio-Sciences AB Björkgatan 30 751 84 Uppsala Sweden
imagination at work
GE Healthcare Life Sciences
imagination at work
Multimodal Chromatography Handbook

Handbooks from GE Healthcare Life SciencesFor more information refer to www.gelifesciences.com/handbooks
2-D ElectrophoresisPrinciples and Methods
GE HealthcareLife Sciences 2-D Electrophoresis using
immobilized pH gradients Principles and Methods 80-6429-60
Affinity ChromatographyPrinciples and Methods
GE HealthcareLife Sciences Affinity Chromatography
Principles and Methods 18-1022-29
GE HealthcareLife Sciences
ÄKTA™ Laboratory-scale Chromatography SystemsInstrument Management Handbook
ÄKTA Laboratory-scale Chromatography Systems Instrument Management Handbook 29-0108-31
GE HealthcareLife Sciences
Antibody PurificationHandbook
Antibody Purification Handbook 18-1037-46
GE HealthcareLife Sciences
Biacore™ Assay Handbook
Biacore Assay Handbook 29-0194-00
GE HealthcareLife Sciences
BiacoreSensor Surface Handbook
Biacore Sensor Surface BR-1005-71
GE HealthcareLife Sciences
Cell Separation MediaMethodology and applications
Cell Separation Media Methodology and Applications 18-1115-69
GE HealthcareLife Sciences
Gel filtrationPrinciples and Methods
Gel Filtration Principles and Methods 18-1022-18
GE Healthcare Life Sciences
GST Gene Fusion System Handbook
GST Gene Fusion System Handbook 18-1157-58
GE HealthcareLife Sciences
High-throughputProcess Developmentwith PreDictor™ PlatesPrinciples and Methods
High-throughput Process Development with PreDictor Plates Principles and Methods 28-9403-58
Hydrophobic Interactionand Reversed PhaseChromatographyPrinciples and Methods
GE HealthcareLife Sciences Hydrophobic Interaction
and Reversed Phase Chromatography Principles and Methods 11-0012-69
GE HealthcareLife Sciences
ImagingPrinciples and Methods
Laser
CCD IRUV
IRUV
trans
epi
630 710520
W
460365
312
473 532 635 650 685 785
epi
Imaging Principles and Methods 29-0203-01
GE HealthcareLife Sciences
Ion Exchange Chromatography & ChromatofocusingPrinciples and Methods
Ion Exchange Chromatography and Chromatofocusing Principles and Methods 11-0004-21
GE HealthcareLife Sciences
Isolation of mononuclear cellsMethodology and applications
Isolation of mononuclear cells Methodology and Applications 18-1152-69
GE HealthcareLife Sciences
MicroCal™ CalorimetersAchieving high quality data
MicroCal Calorimetry—Achieving High Quality Data Handbook 29-0033-51
GE HealthcareLife Sciences
Microcarrier Cell CulturePrinciples and Methods
Microcarrier Cell Culture Principles and Methods 18-1140-62
imagination at work
GE Healthcare Life Sciences
Multimodal Chromatography Handbook
Multimodal Chromatography Handbook 29-0548-08
GE Healthcare Life Sciences
Nucleic Acid Sample Preparation for Downstream AnalysesPrinciples and Methods
Nucleic Acid Sample Preparation for Downstream Analyses Principles and Methods 28-9624-00
GE HealthcareLife Sciences
Protein Sample PreparationHandbook
Protein Sample Preparation Handbook 28-9887-41
GE HealthcareLife Sciences
Purifying Challenging Proteins Principles and Methods
Purifying Challenging Proteins Principles and Methods 28-9095-31
GE HealthcareLife Sciences
Recombinant Protein Purification Principles and Methods
Recombinant Protein Purification Handbook Principles and Methods 18-1142-75
GE HealthcareLife Sciences
SpectrophotometryHandbook
Spectrophotometry Handbook 29-0331-82
GE HealthcareLife Sciences
Strategies for Protein Purif icationHandbook
Strategies for Protein Purification Handbook 28-9833-31
GE HealthcareLife Sciences
Western BlottingPrinciples and Methods
Western Blotting Principles and Methods 28-9998-97

Multimodal Chromatography Handbook

Foreword
Biopharmaceuticals represent the success of the modern pharma industry and are forecasted to take over as the most important category of drugs in the near future. After 30 years of research/development focused on therapeutic proteins, the industry’s maturation is visible through increasing competition and a general drive to improve the efficiency of process development and manufacturing operations (technology upgrades and fine tuning of solutions established over the years). The cost of a legacy process launched in the 1990s can be reduced by 80% to 90%, with downstream processing improvements playing a significant role in these attempts, next only to cell culture productivity increases. Flexible facility design and 10- to 100-fold more efficient processing tools are available to those working in today’s development arena for biologics. These design and tool improvements enable the manufacturer to leapfrog the cost situation of their legacy competition.
Purification of biologics, whether with industrial or research scope, is powered by selectivity provided through the features of the ligands on a chromatography support. From that perspective, multimodal chromatography media represent one of the most powerful additions to the process development scientist’s toolkit in the recent two decades.
Thus, in addition to addressing the increasing technical challenges arising from high-biomass upstream processes and the growing economic pressure on manufacturing operations, the biopharma industry is discovering that the truly new selectivities with broad applicability that multimodal materials offer are rare innovations, and is adopting them throughout the industry.
Operating conditions for multimodal chromatography media are not as easily predicted as for classic ion exchangers, a fact that initially delayed their acceptance. However, with the availability of high-throughput process development (HTPD) approaches for screening for optimum conditions, these conditions can be found in a very short amount of time despite the fact that a larger number of conditions needs to be investigated.
During the development of a multimodal purification step, an operating window can usually be identified that, more often than not, enables reduction of the number of purifications steps by employing the new selectivities the multimodal ligands offer. Combining hydrophobic and/or other types of interactions with an ion exchange modality encourages the search for operating conditions that would eliminate the need for conditioning of process streams, thus simplifying the corresponding installation of process hardware. As with standard ion exchangers, multimodal chromatography media can be operated in both flowthrough and bind/elute modes. For the former, smaller columns can be used to handle large quantities of target product, as the steps serve as impurity scavengers. In conclusion, use of multimodal chromatography media enables effective and economical purification processes.
We hope you will find this handbook to be a helpful guide to the vast number of opportunities that multimodal selectivities offer to your work in purification development. Working with modern tools will help you unlock great cost savings and even open up growing revenue opportunities for your facility. Use them wisely and with scientific rigor. You will find them worth your time!
Günter Jagschies Strategic Customer Relations Leader

29-0548-08 AA 3
Contents
Introduction...................................................................................................................................... 5Common acronyms and abbreviations .............................................................................................................6
Chapter 1 Chromatography principles and process development .......................................................... 7Protein purification methods ..................................................................................................................................7
Protein purification strategies ........................................................................................................................9Limiting the number of steps in a purification procedure ............................................................10Bind/elute vs flowthrough mode ...............................................................................................................10Performance parameters ..............................................................................................................................11
Workflow—screening, optimization, and scale-up ...................................................................................13Large-scale purification ......................................................................................................................................... 14
Practical considerations in scale-up ........................................................................................................ 14
Chapter 2 Overview of multimodal chromatography .............................................................................. 17Multimodal ligand approach ................................................................................................................................18Multimodal chromatography in a purification workflow .......................................................................19Determining optimal experimental conditions ...........................................................................................20Bind/elute vs flowthrough mode in multimodal chromatography ..................................................20Salt types and additives .........................................................................................................................................22
Chapter 3 Multimodal chromatography media ......................................................................................... 23Capto adhere ..............................................................................................................................................................25
pH operating window ......................................................................................................................................25Removal of aggregates ..................................................................................................................................26Viral clearance .....................................................................................................................................................26Removal of other impurities and contaminants ................................................................................27Salt type and additives....................................................................................................................................27Regeneration .......................................................................................................................................................28
Capto adhere ImpRes ..............................................................................................................................................28Fast mass transfer ............................................................................................................................................28High resolution and small pool volumes ................................................................................................29Regeneration .......................................................................................................................................................30
Capto MMC ....................................................................................................................................................................30High salt tolerance ............................................................................................................................................30Unique selectivity .............................................................................................................................................. 31Salt type and additives....................................................................................................................................33Regeneration .......................................................................................................................................................34
Capto MMC ImpRes ...................................................................................................................................................34Fast mass transfer ............................................................................................................................................34Salt tolerance .......................................................................................................................................................34High resolution and high capacity ............................................................................................................35Regeneration .......................................................................................................................................................35
Capto Core 700 ...........................................................................................................................................................35Designed for flowthrough chromatography ........................................................................................35Improved productivity .....................................................................................................................................36Regeneration .......................................................................................................................................................37
Multimodal libraries ..................................................................................................................................................37Multimodal libraries from Custom Designed Media (CDM) ...........................................................37Custom Designed Products (CDP) ..............................................................................................................38
Formats of multimodal chromatography products .................................................................................39

4 29-0548-08 AA
Chapter 4 Applications .................................................................................................................................... 41Capto adhere applications .................................................................................................................................... 41
1. Optimization of loading conditions on Capto adhere using DoE ............................................ 41Method design and optimization .......................................................................................................... 41Results ................................................................................................................................................................45Conclusions—optimal loading conditions and general trends ..............................................48
2. Development of operational excellence in MAb process development and manufacturing using Capto adhere ......................................................................................................492a. HTS and optimization of a multimodal polishing step in a MAb purification process using Capto adhere ....................................................................................................................49Materials and methods ..............................................................................................................................50Results and discussion ...............................................................................................................................53Conclusions ......................................................................................................................................................602b. Scale-up of a downstream MAb purification process using HiScreen and AxiChrom columns with Capto adhere ................................................................ 612c. A flexible antibody purification process based on ReadyToProcess products with Capto adhere ........................................................................................................................................63
3. Viral clearance using Capto adhere ......................................................................................................64Capto adhere ImpRes applications...................................................................................................................65
1. Polishing of MAbs using Capto adhere ImpRes in bind/elute mode .......................................65Materials and methods ..............................................................................................................................65Results and discussion ...............................................................................................................................67Conclusions ......................................................................................................................................................73
2. Viral clearance using Capto adhere ImpRes ..................................................................................... 74Capto MMC applications ........................................................................................................................................ 74
1. HTS and process development for capture of recombinant pro-insulin from E. coli using Capto MMC.............................................................................................................................. 74Materials and methods .............................................................................................................................. 74Results and discussion ...............................................................................................................................76Conclusions ......................................................................................................................................................82
2. Evaluation of three media for capture of recombinant human serum albumin from Pichia pastoris and scale-up using Capto MMC ..................................................................83
Capto MMC ImpRes applications .......................................................................................................................841. Polishing of MAbs using Capto MMC ImpRes in bind/elute mode ...........................................84
Materials and methods ..............................................................................................................................84Results and discussion ...............................................................................................................................85Conclusions ......................................................................................................................................................92
2. Effective polishing of domain antibodies (DAbs) using Capto MMC ImpRes ......................92Capto Core 700 application ..................................................................................................................................94
Purification of influenza A/H1N1 using Capto Core 700 ............................................................94
References ...................................................................................................................................... 97
Appendix 1 Characteristics of multimodal chromatography media ......................................................100
Appendix 2 Maintenance of media and storage conditions .....................................................................103
Appendix 3 Use of multimodal media for MAb purification ......................................................................106
Product index ................................................................................................................................108
Related literature ........................................................................................................................109
Ordering information ..................................................................................................................110

29-0548-08 AA 5
Introduction
This handbook explores the advantages of using multimodal chromatography in the field of large-scale (bioprocess) protein purification. In multimodal chromatography, the medium (resin) provides more than one type of interaction between ligand and sample components. Although use of traditional media (such as affinity, ion exchange, hydrophobic interaction, etc.) is fine in most instances, under certain purification challenges the required level of purity is not reached. Challenges arise, for example, when there is a need for salt-tolerant ion exchange media for capture of recombinant proteins or when the goal is to effectively remove aggregates, host cell protein (HCP), viruses, or protein A in purification of monoclonal antibodies (MAbs). Because multimodal media can be uniquely designed, multimodal chromatography offers an alternative to traditional media, providing new selectivities for specific targets. Multimodal chromatography may also improve performance.
The Multimodal Chromatography handbook is targeted toward scientists working in the fields of process development and large-scale (bioprocess) protein purification who desire to learn more about the benefits of adding multimodal chromatography to their arsenal of purification strategies. The handbook begins in Chapter 1 with a brief overview of protein purification terminology, methods, and strategies, to put the principles of multimodal chromatography in context with other purification tools. It continues with an overview of multimodal chromatography itself (Chapter 2), followed by a description of multimodal chromatography media from GE Healthcare (Chapter 3). Chapter 4 introduces both theoretical and practical aspects of incorporating multimodal chromatography into a purification strategy, by providing application examples using multimodal media from GE Healthcare. Appendices provide additional support information.

6 29-0548-08 AA
Common acronyms and abbreviations
A280 UV absorbance at specified wavelength (in this example, 280 nanometers)
AC affinity chromatography
AIEX anion exchange chromatography
CDM Custom Designed Media
CDP Custom Designed Products
CHO Chinese hamster ovary
CIEX cation exchange chromatography
CIP cleaning-in-place
CIPP capture, intermediate purification, polishing
CCS cell culture supernatant
CV column volume(s)
D/A dimers and aggregates
DAb/DAbs domain antibody/antibodies
DoE design of experiment(s)
DBC dynamic binding capacity
ECP E. coli protein
GF gel filtration (also referred to as SEC, size exclusion chromatography)
HA hemagglutinin
HIC hydrophobic interaction chromatography
HCP host cell protein(s)
HTPD high-throughput process development
HTS high-throughput screening
IEX ion exchange chromatography
IMAC immobilized metal ion affinity chromatography
IPA isopropyl alcohol
kD kilodaltons
LOQ limit of quantitation
MAb/MAbs monoclonal antibody/antibodies
mAU milli absorbance units
MDCK Madin-Darby canine kidney
MF microfiltration
MM multimodal
MMC multimodal chromatography
mS millisiemens
MuLV Murine Leukemia Virus
MVM Minute Virus of Mice
ND not determined
pI isoelectric point
QbD quality by design
RPC reversed phase chromatography
SBC static binding capacity
SEC size exclusion chromatography (referred to in this handbook as gel filtration, GF)
TCID tissue culture infectious dose
UF/DF ultrafiltration/diafiltration

29-0548-08 AA 7
Chapter 1 Chromatography principles and process development
In order to appreciate where multimodal chromatography fits into the overall scheme of protein purification, it is helpful to review current protein purification terminology, methods, and strategies.
In protein purification, the stationary phase is termed the chromatography medium (sometimes also called chromatography resin). The medium is composed of a porous matrix to which a ligand can be coupled. This coupling is often referred to as functionalizing the matrix. The matrix, generally in the form of spherical beads, and the coupled ligand that contains a specific molecular group giving a tailored function to the chromatography medium, are utilized for binding of either the target protein or contaminants. With gel filtration (GF), no ligand is present, and separation of molecules is achieved based on the accessibility of the bead pores for the different sized molecules.
The term multimodal, sometimes also referred to as mixed-mode, is broadly used in the context of an object having more than one mode of action. These different modes of action can operate independently of one another or in concert. In the field of protein purification, multimodal chromatography refers to media that provide more than one type of interaction between ligand and sample components. Several such media from GE Healthcare are discussed in Chapter 3. In addition, a special type of multimodal medium (Capto™ Core 700) is described for which both multimodal ligand interaction and principles of size exclusion are used for the separation of molecules.
Protein purification methodsBiomolecules are purified using methods that separate according to differences in specific properties. The main properties upon which protein purification is based are listed in Table 1.1. For more information, refer to the numerous handbooks from GE Healthcare (see “Related literature” at the end of this handbook).
8 29-0548-08 AA
Table 1.1. Protein properties exploited in chromatographic purification
Protein property Method Description
Various (e.g., charge, hydrophobicity, and hydrogen bonding)
Multimodal chromatography Separation through at least one ligand type that has more than one interaction site. Different modes of interaction can be expected depending on experimental conditions, e.g., electrostatic, hydrophobic, π-π interaction, hydrogen bonding, and thiophilic interaction. These interactions can cooperate or work independently.
Specific ligand recognition
Affinity chromatography (AC) Separation through specific interaction between target molecule and an immobilized affinity ligand.
Immobilized metal ion affinity chromatography (IMAC)
Separation through affinity of proteins with His, Cys, or Trp amino acid residues and immobilized metal ions.
For further information refer to the handbooks Affinity Chromatography: Principles and Methods (18-1022-29) and Antibody Purification (18-1037-46) from GE Healthcare (see also “Related literature” at the end of this handbook).
Charge Ion exchange chromatography (IEX), encompassing anion and cation exchange chromatography (AIEX and CIEX, respectively)
Separation based on electrostatic interactions between solutes and chromatography medium.
For further information refer to the handbook Ion Exchange Chromatography and Chromatofocusing: Principles and Methods (11-0004-21 from GE Healthcare (see also “Related literature” at the end of this handbook).
Size Gel filtration ([GF], also referred to as size exclusion chromatography [SEC])
Separation of solutes according to size.
For further information refer to the handbook Gel Filtration: Principles and Methods (18-1022-18 from GE Healthcare (see also “Related literature” at the end of this handbook).
Hydrophobicity Hydrophobic interaction chromatography (HIC)
and
Reversed phase chromatography (RPC)
Separation based on hydrophobic interactions.
HIC is run in aqueous solutions while RPC is run in combination with organic solvents.
For further information refer to the handbook Hydrophobic Interaction and Reversed Phase Chromatography: Principles and Methods (11-0012-69) from GE Healthcare (see also “Related literature” at the end of this handbook).
Isoelectric point (pI) Chromatofocusing Separation based on pI.
For further information refer to the handbook Ion Exchange Chromatography and Chromatofocusing: Principles and Methods (11-0004-21) from GE Healthcare (see also “Related literature” at the end of this handbook).

29-0548-08 AA 9
Protein purification strategiesRegardless of the technique chosen to purify a target protein (or proteins), the scientist generally faces the need to obtain the protein with sufficient purity and quantity in an efficient and economical manner. The purification strategy Capture, Intermediate Purification, and Polishing (CIPP) (Fig 1.1) has been developed to both describe a protein purification process by assigning a specific task to each unit operation and to simplify planning and execution of protein purification at any scale. The strategy gives guidelines for how to combine purification methods optimally to reach the set goals.
Step
ytiruP
Capture
Intermediatepurification
Polishing
Preparation,extraction,clarification
Achieve finalhigh-level purity
Remove bulkimpurities
Isolate, concentrate,and stabilize
Fig 1.1. Illustration of the different stages in a purification process.
Sample preparation is the starting point of any purification strategy. The purpose of sample preparation is generally to obtain a clarified extract of the source material, although techniques are available to address situations in which the starting material is unclarified. The extract should be prepared under or adjusted to conditions that are compatible with the first chromatography step.
In the capture stage, the objectives are to isolate, concentrate, and stabilize the target product. The product should be concentrated and transferred to an environment that will conserve potency/activity. At best, significant removal of critical contaminants can also be achieved.
During the intermediate purification stage, the key objective is to remove most of the bulk impurities, such as other proteins and nucleic acids, endotoxins, and viruses. If the capture step is highly efficient, the intermediate purification stage is often omitted in favor of one or more polishing steps.
The objective of the polishing stage is to achieve final purity. In this stage, remaining impurities, often at trace levels, and possibly also undesirable product variants and proteins closely related to the target protein, are removed, and the target protein may be transferred to conditions suitable for use or storage.
General advice:
• Apply a systematic approach to development of a purification strategy.
• Assign a specific objective to each step within the purification process.

10 29-0548-08 AA
Limiting the number of steps in a purification procedure The purification strategy described above does not mean that all protocols must have a set number of chromatography purification steps. The number of steps to be included will depend on the purity requirements, intended use of the protein, and the complexity of the starting material. Keep in mind that increasing the number of purification steps will often decrease the overall protein yield (Fig 1.2) and that more steps mean a longer purification time, which can be detrimental to protein stability and activity. For most laboratory-scale and bioprocess-scale work, a two- or three-step purification protocol will be sufficient, although difficult purifications may require additional steps.
95%/step
75%/step
90%/step
85%/step
80%/step
100
80
60
40
20
0101 2 3 4 5
Number of steps6 7 8 9
Yiel
d (%
)
Fig 1.2. Total yield versus number of purification steps.
Because multimodal media are characterized by selectivities that are different from those of “traditional” ligands, their use opens up new opportunities for solving challenging purification problems. Multimodal media can often reduce the number of steps needed to reach the required level of purity.
Bind/elute vs flowthrough modeThe mode of operation also plays a part in the successful multimodal chromatography purification scheme. Using IEX as an example method, the bind/elute mode of separation works by binding sample components to the chromatography medium based on electrostatic charges. If the medium has negatively charged functional groups (as in CIEX), sample components with positively charged ions will bind to it; if the medium has positively charged functional groups (as in AIEX), then protein sample components with negatively charged ions will bind to it. Once sample components are bound, the medium is washed, and nonbound material is washed through, after which the bound material is eluted under conditions of increasing ionic strength or change in pH. With increasing salt concentration, salt ions in the buffer compete for binding with the charges on the medium, and the bound material is displaced and eluted. Alternatively, when pH is changed, bound proteins are titrated and eventually become noncharged or have the same charge as the ligand, leading to repulsion and elution of the bound protein.
In flowthrough mode, on the other hand, the pH of the sample and buffer is selected to modifiy the charge of the protein of interest or the chromatography medium such that the protein will not bind but will rather flow through the column, leaving most impurities bound. Thus, the advantages of flowthrough mode are that higher loads can be used and there are fewer washing and elution steps—one needs mainly to be concerned with maximizing recovery and binding of impurities. The purity of the protein of interest found in the flowthrough fractions can be increased by optimizing conditions such as pH, buffer, and salt. A wash step is used for increasing the yield of the target protein by allowing weakly bound proteins to be collected. An elution step is sometimes used to remove/elute some bound contaminants before the cleaning-in-place (CIP) step is applied.

29-0548-08 AA 11
Performance parametersFor optimal productivity in process-scale chromatography, four important performance parameters should be considered when planning each purification step: resolution, capacity, speed, and yield. The importance of each parameter will vary depending on whether a purification step is used for capture, intermediate purification, or polishing. Purification methods should be selected and optimized to meet the objectives for each purification step. Purity of the final product can never be compromised, but the way this purity is achieved must keep productivity and process economy in mind. In today’s competitive environment in the pharmaceutical and biotech industries, all process as well as individual unit operations need to be optimized for these factors. Productivity, often defined as gram or kilogram of product produced per hour or day per liter of chromatography medium used, needs to be high to facilitate a good process economy (e.g., cost per gram of product produced).
Resolution depends on the selectivity and efficiency of the packed bed, sample, and conditions (e.g., flow rate) used. In general, high resolution is more important at the final stage of purification because at this point the impurities and target protein are likely to have very similar properties.
Capacity refers to how much sample can be loaded onto the column. The amount of sample that can be loaded may be limited by volume (as in GF) or by total amount of target protein and impurities that can be bound to the column without loss or reduction of purity. (Purity may decrease with high sample loads.) The amount of sample and usually also the volume of sample decreases toward the final stage of the purification.
Speed is most important at the beginning of purification where contaminants, such as proteases, must be removed as quickly as possible.
Yield becomes increasingly important as the purification proceeds because of the increased value of the purified product. Yield may be decreased by destructive processes in the sample and by unfavorable conditions during the purification.
Each protein purification method has inherent characteristics that determine how it should be optimized for the key performance parameters described above: resolution, capacity, speed, and yield. Table 1.2 is a guide to the suitability of each purification method for the stages in CIPP. Refer to the GE Healthcare handbooks (see “Related literature” at the end of this handbook) for in-depth discussion of these and other chromatography techniques.
AC is the method of choice and the most common capture step when a specific ligand is available against the target protein, for example, protein A media for antibody purification. AC can often combine resolution, capacity, speed, and yield in a single purification step, although it is more common that it is followed by at least one polishing step.
IMAC is an excellent capture step for histidine-tagged proteins and is used with or without a subsequent polishing step. The technique is generally not used in bioprocess applications.
GF is seldom used as a capture step because of limitation in sample volume, but it is sometimes used as a polishing step despite the sample volume limitation.
IEX is a common method for any purification stage. IEX columns are suitable for the capture stage because they have high binding capacity, allow high flow rates, and are resistant to harsh cleaning conditions that may be needed after purification of crude samples. CIEX is more common in capture than AIEX, and generally also has higher capacity than AIEX. IEX is frequently used as a polishing step.
12 29-0548-08 AA
Tabl
e 1.
2. S
uita
bilit
y of
pur
ifica
tion
met
hods
for C
IPP
Typi
cal c
hara
cter
istic
sPu
rific
atio
n ph
ase
Cond
ition
s
Sele
ctiv
ityCa
paci
tyCa
ptur
eIn
term
edia
tePo
lishi
ngSa
mpl
e st
art c
ondi
tions
Sam
ple
end
cond
ition
s
Mul
timod
al++
+++
+++
+++
+++
pH d
epen
ds o
n pr
otei
n an
d ty
pe
of li
gand
; sal
t tol
eran
ce o
f bin
ding
can
in
som
e ca
ses
be e
xpec
ted
(see
Tab
le 1
.1)
pH a
nd io
nic
stre
ngth
dep
ends
on
pro
tein
and
liga
nd ty
pe
AC++
+++
+++
+++
+++
Vario
us b
indi
ng c
ondi
tions
Spec
ific
elut
ion
cond
ition
s
IMAC
+++
++++
+++
+Lo
w c
once
ntra
tion
of im
idaz
ole
an
d hi
gh c
once
ntra
tion
of N
aCl
Hig
h co
ncen
trat
ion
of im
idaz
ole,
pH
>7, 5
00 m
M N
aCl
GF
+++
++
+++
Mos
t con
ditio
ns a
ccep
tabl
e;
limite
d sa
mpl
e vo
lum
eBu
ffer
exc
hang
e po
ssib
le, d
ilute
d sa
mpl
e
IEX
+++
+++
+++
+++
+++
Low
ioni
c st
reng
th; p
H d
epen
ds
on p
rote
in a
nd IE
X ty
peH
igh
ioni
c st
reng
th a
nd/o
r pH
cha
nged
HIC
+++
++++
+++
+++
Hig
h io
nic
stre
ngth
; add
ition
of
sal
t req
uire
dLo
w io
nic
stre
ngth
RPC
++++
(+)
++(+
)+
+++
Ion-
pair
reag
ents
and
org
anic
m
odifi
ers
may
be
requ
ired
Org
anic
sol
vent
s (ri
sk fo
r los
s
of b
iolo
gica
l act
ivity
)
Chr
omat
ofoc
usin
g++
+++
++
++Lo
w io
nic
stre
ngth
Poly
buff
er
Low
ioni
c st
reng
th

29-0548-08 AA 13
HIC can be an excellent capture step, especially after ammonium sulfate precipitation. The salt concentration and the total sample volume will be significantly reduced after elution from the HIC column. HIC can be used at any stage.
RPC is very rarely used as a capture step because the method will usually bind too many of the sample components in an extract. On the other hand, RPC is often used for purification of therapeutic peptides and other small biomolecules. If the target protein is sufficiently stable, RPC can be efficient for polishing.
Chromatofocusing is a high-resolution method with moderate binding capacity and is therefore rarely used as a capture step. The method can be used for the polishing stage. It has yet to find its place in bioprocess applications.
Multimodal chromatography can be used advantageously in CIPP at various stages. It offers new options, for example, high conductivity binding and new selectivity, when faced with challenging conditions or separations in a purification workflow. See Chapter 2 for a detailed description of multimodal chromatography.
General advice:
• Combine methods that apply different separation mechanisms.
• Minimize sample handling between purification steps by combining methods to avoid the need for sample conditioning before the next step. The product should ideally be eluted from the first column in a buffer suitable for the starting conditions required for the next method.
Workflow—screening, optimization, and scale-upModern chromatographic processes are increasingly driven by economic factors. The need to shorten time to market means that the process development must be fast and inexpensive without compromising quality. With this in mind, a good development workflow is important and will ensure a robust process where critical parameters have been identified and are under control.
Figure 1.3 shows an example of a typical workflow. It starts with screening of conditions in high-throughput formats such as 96-well filter plates or mini-columns, followed by optimization in small columns and finally scale-up to final column size. For further information on high-throughput 96-well filter plates refer to the handbook High throughput process development with PreDictor™ plates (28-9403-58) from GE Healthcare (see also “Related literature” at the end of this handbook). For more information on mini-columns, see “Formats” in Chapter 3.
HTPD screening Column optimization Large scale
Fig 1.3. A typical workflow. Initial screening is performed in a high-throughput format, followed by optimization using a small column and verification in large scale. A discussion of Design of Experiments (DoE) and Monte Carlo simulations is provided in the text below.

14 29-0548-08 AA
High-throughput process development (HTPD) shortens development time at the same time as it increases the amount of knowledge about the purification process and the influence of different process parameters (such as pH, conductivity, load, etc.). In multimodal chromatography, the availability of high-throughput process tools is especially valuable because of the complexity of interactions. Experimental conditions should be carefully screened in order to fully exploit the potential of the media and understand critical parameters.
When appropriate conditions have been found with the HTPD formats, further screening and optimization is performed in small columns. DoE (see Box, G. E. P. and Draper, N. R. [1987] and Metropolis, N. and Ulam, S. [1949] in “References”) is a statistical tool used during optimization to plan experiments to maximize the information extracted. It allows for detailed quantitation of the cause and effect relationship between process inputs and process outputs. It is very well complemented by Monte Carlo simulation, which allows for quantitation of how variation in the process inputs (including random process variation) is translated into variation in the process outputs. DoE together with Monte Carlo simulations greatly increases the likelihood that a good purification process will be established. The use of high-throughput screening (HTS) technology is becoming the generally accepted approach for improving process understanding and for finding and defining the experimental space for a DoE study. More on this subject can be found in Chapter 4.
This workflow is in line with Quality by Design (QbD) guidelines, which offer a systematic approach to process development that emphasizes product and process understanding, process control, and quality risk management (see Guidance for Industry; Q8[R2] Pharmaceutical Development {2009} in “References”).
Large-scale purificationAs previously discussed, key concerns in large-scale purification differ to some extent from those typical at laboratory scale. The emphasis in large-scale purification is on the development of robust and cost-effective protocols with a minimum number of unit operations in order to improve overall process economy, all without ever compromising the quality (purity) of the desired product. When going from laboratory scale to production scale, buffer consumption will be an issue, and choice of chromatography medium must be thoroughly considered based on economics, security of supply, and adherence to regulatory requirements.
If the purification process is going to be scaled up, the scale-up perspective must be considered already at the research stage during the development of a new biopharmaceutical so as to avoid problems at later stages, for example, scalability of separation methods, packability of chromatography media, and process economy.
Below we provide a brief introduction to large-scale purification. For further reading, refer to the Handbook of Process Chromatography: Development, Manufacturing, Validation and Economics by Lars Hagel, Günter Jagschies, and Gail Sofer, 2nd ed., 2008, Academic Press.
Practical considerations in scale-upIt is important to define the parameters during process development to obtain an efficient process with high productivity and to know how changes influence the process and the final product. Established conditions are used as the basis for scale-up. Scale factors between 10 and 100 per step are recommended. There are a number of chromatography parameters that have to be maintained to ensure conformity in performance between laboratory scale and final production scale:

29-0548-08 AA 15
• residence time
• maintenance of gradient slope (gradient volume/media volume)
• sample concentration and composition
• ratio of sample volume to media volume
Scale-up is obtained by increasing:
• column dimensions
• volumetric flow rate
• sample volume proportionally to column volume
• gradient volume proportionally to column volume
Increasing the bed volume by increasing the column diameter, and increasing volumetric flow, sample load volume, and gradient volume accordingly, will ensure the same performance and cycle time as in laboratory scale during method development. The bed volume can also be increased by increasing the bed height and keeping the residence time constant, but chromatographic behavior may in some rare cases differ, with possible impact on purity.
In IEX, HIC, and AC, adequate productivity is normally obtained with columns having a bed height of 10 to 20 cm. In some cases, if the ideal column diameter is not available, it might be an advantage to increase the bed height using a column with a diameter smaller than the diameter of the ideal column, but an increase in the pressure drop must be anticipated.
Numerous applications that involve scale-up are presented in Chapter 4.

16 29-0548-08 AA
29-0548-08 AA 17
Chapter 2 Overview of multimodal chromatography
In multimodal chromatography, ligands interact with the target molecule through two or more modes of action. These different modes of action can operate independently or in concert. Electrostatic interactions are commonly involved, but hydrogen bonding and hydrophobic interactions can be significant. The strength of these individual interactions depends on the target molecule and on the overall process conditions.
Multimodal chromatography media are characterized by selectivities that are different from those of “traditional” ligands (i.e., those seen in AC, IEX, HIC, etc.), thereby opening up new opportunities for solving challenging purification problems. At the same time, the higher complexity of multimodal media normally requires process optimization studies in order to take full advantage of the potential of this technology. Having efficient HTPD tools and methodology facilitates this optimization work.
Multimodal chromatography media can be prepared in different ways (Fig 2.1):
1) The stochastic approach, in which two or more different interactions are introduced independently on the matrix. Use of this approach provides a very efficient way to study the influence of a second interaction because in this construction the ratio of the different groups can be gradually modified. With this approach, the homogeneity of the medium and the three-dimensional interactions cannot be guaranteed.
2) The multimodal ligand approach, in which groups promoting different interactions are connected via a scaffold, resulting in a well-defined three-dimensional structure, and in which the stoichiometric ratio (e.g., 1:1) between the groups is fixed.
3) Use of a responsive material that will, according to the conditions, exhibit different primary interactions. In the example in Figure 2.1, the medium changes from a hydrophobic to a hydrophilic one through temperature change, where the hydrophobic group is less exposed (buried in the structure). Other types of physically and/or chemically induced changes could possibly also be employed.
Stochastic Multimodal ligand Responsive material
O
O
OO-
ScaffoldO
Induced change:temp, pH
OO
O-
O
Fig 2.1. Schematics showing examples of creating a multimodal medium or column based on the three types of preparation methods described above.

18 29-0548-08 AA
In a category by itself, Capto Core 700 (Fig 2.2) from GE Healthcare combines GF and multimodal anion exchange characteristics, as described in Chapter 3.
SpacerCore O
H
N+
H
ShellCore
Fig 2.2. (A) Schematic representation of the principle for Capto Core 700 showing a bead with the inactive porous shell and the ligand-activated core. Small proteins and contaminants (colored green, yellow, and purple) penetrate the core while target viruses (red) and larger proteins are excluded from the medium and are collected in the flowthrough. (B) The immobilized ligand in the core.
Multimodal ligand approachTo create multimodal chromatography media using the multimodal ligand approach, ligands that have multiple modes of interaction are immobilized on the chromatography matrix (Fig 2.3). These interactions are introduced via a chemical scaffold that links the new interaction with the primary one, resulting in a well-defined three-dimensional new multimodal ligand. The interactions introduced can be quite diverse, for example, electrostatic, hydrophobic, π-π, hydrogen bonding, and thiophilic interactions. Thus, an IEX medium might be modified to include another functionality providing the option of hydrophobic interactions, with the result being that in one step a purification based on both electrostatic and hydrophobic properties could occur.
The well-defined primary functionality ensures a degree of control over the chromatographic behavior of the multimodal medium, which at the same time allows for the modification of chromatographic performance in ways that can be advantageously used in specific cases. Typical positive effects associated with the multimodal approach include differences in binding capacities under specific conditions, changes in elution conditions, and enhanced selectivities.
The current multimodal product offering from GE Healthcare consists of Capto MMC, Capto MMC ImpRes, Capto adhere, Capto adhere ImpRes (all developed using the multimodal ligand approach), and Capto Core 700, with layered functionality. The stochastic approach has also been used for some of the media included in the multimodal libraries available from GE Healthcare (available via Custom Designed Media, CDM; see Chapter 3). Figure 2.3 compares traditional and multimodal media, using examples of GE Healthcare products.
(A)
(B)

29-0548-08 AA 19
(A) (B)Traditional media
CM Sepharose™ Fast Flow Capto™ MMC
Capto adhere
Capto Core 700
Q Sepharose Fast Flow
Phenyl Sepharose HP
Octyl Sepharose Fast Flow
Multimodal media
OO
O-O O
O O-
S
OHOH
NH
O O
OHOH
OHN+
O O N+OHOH
O
O
Scaffold
O
SpacerCore O
H
N+
H
Fig 2.3. Comparison of traditional and multimodal media. (A) Schematic of traditional media and examples (CM Sepharose Fast Flow, Q Sepharose Fast Flow, Phenyl Sepharose HP, and Octyl Sepharose Fast Flow). (B) Multimodal media. Capto MMC, Capto adhere, and Capto Core are shown as examples. Note that the Capto Core 700 ligand is found only in the core of the bead.
Chromatographic performance will be strongly dependent on the importance of the primary and secondary modes of interaction, respectively. For example, the traditional ion exchange behavior of a strong anion exchanger is affected by the gradual increase of hydrophobic groups or H-bond groups.
See Chapter 3 for a description of the functionalities of multimodal media and custom libraries developed by GE Healthcare.
Multimodal chromatography in a purification workflowMultimodal chromatography offers new solutions in purification workflows by widening the window of operation in circumstances where traditional media are not as effective as desired. Such circumstances may be encountered, for example, when the loading conductivity of the sample is too high for traditional ion exchange media, when there is a need to reduce the number of purification steps, or when the selectivity of traditional media is insufficient to provide the required purity of the target protein.
When working with process development of a purification process and exploring the introduction of multimodal chromatography into a purification workflow, early decision points include:
• determining which multimodal chromatography medium to select (discussed in Chapter 3)
• choosing the format that will best suit the user’s needs (bulk media, prepacked columns, or plates) (discussed in Chapter 3)

20 29-0548-08 AA
• deciding (for bulk media and prepacked columns) between flowthrough and bind/elute mode (discussed in Chapters 1 and 2)
• determining conditions that will optimize the purification (discussed in Chapters 2 and 4)
• planning for the eventual scale-up of the optimized purification protocols (discussed in Chapter 4)
Given the higher complexity of multimodal media compared with traditional media, somewhat more emphasis on process optimization is required in order to take full advantage of the potential of this technology. Having efficient HTPD tools and methodology and making use of DoE and Monte Carlo simulations facilitate this optimization work (see Chapter 1).
Determining optimal experimental conditionsIt is recommended to explore a wide range of chromatography conditions early, to increase process understanding and increase the likelihood of developing a robust purification process. This is the case for both traditional and multimodal chromatography.
Consider the differences between multimodal and traditional IEX and HIC media (Fig 2.4), and several questions may come to mind: What will happen on a medium that contains both interactions? Will the protein of interest bind in a high-conductivity environment? Under which conditions will it be possible to elute the target protein?
With multimodal media, it is a priori more difficult to predict the answers to these questions. The answers will be determined by the multimodal functionality of the media, by the operating conditions, and by the target molecule itself. Thus optimization is critical for success.
Traditional media
Low conductivityHigh conductivity
IEXLow Int
Low conductivityHigh conductivity
Hypothetical multimodal media
OSO3
-
Low IntHIC
Low conductivityHigh conductivity
IEX?HIC?
O
OOH
SO3-
O O
OH
Fig 2.4. Multimodal media and chromatographic use. A combination of interaction modes can be expected with multimodal media. The type of interaction(s) will depend on conditions and characteristics of the target molecule. Int = interactions.
Bind/elute vs flowthrough mode in multimodal chromatography In multimodal chromatography, the choice between bind/elute and flowthrough mode is more complex than when using a single method, such as IEX, because multiple types of interactions are occurring in multimodal chromatography, and the strength of these individual interactions often depends on the overall process conditions. For example, the pH range for binding is generally extended for multimodal media compared with traditional IEX media, which gives the multimodal media unique selectivities and generally a wider operational window (Fig 2.5).

29-0548-08 AA 21
+
-
Net
cha
rge
pH
pI
+
-
Net
cha
rge
pH
pI
Binding pH - Multimodal AIEXBinding pH - Traditional AIEX
Binding pH - Multimodal CIEXBinding pH - Traditional CIEX
Fig 2.5. Net charge of a protein vs pH. Schematic illustration of the extended pH binding range for multimodal AIEX/CIEX (light green) compared with traditional AIEX/CIEX media (light blue).
Because the pI is generally not a good indicator for choosing the correct pH for binding and elution with multimodal media, screening of conditions is paramount. This is preferably done with high-throughput formats, such as microtiter plates or mini-columns (see the data files for PreDictor and RoboColumn™ units listed in “Related literature”). Experimental setup for screening studies is preferably done by using DoE, and typically the factors screened are pH and conductivity. To help select the pH range to screen, a pH gradient elution experiment can be performed where an analytical amount of sample is loaded on a small column. The experiment will establish the elution pH of the sample. For a better understanding of the multimodal behavior, a salt gradient or a combined salt and pH gradient can also be run. An example is shown in Figure 2.6.
Column: Tricorn™ 5/100 packed with 2 mL Capto adhere; bed height 10.5 cmSample: Feed containing monoclonal IgG1, rProtein A elution pool, desaltedSample load: 1 mg IgG1/mL mediumBuffer A: 20 mM sodium citrate + 20 mM sodium phosphate, pH 7.8Buffer B: 20 mM sodium citrate + 20 mM sodium phosphate, pH 4.0Flow velocity: 200 cm/hSystem: ÄKTA™
0.0 10.0 20.0 30.0 40.0 mL
0
20
40
60
80
100
120
140
160
A 280
(mAU
)
5.0
6.0
7.0
8.0
9.0
pH
Was
h
Gra
dien
t sta
rt
Fig 2.6. Establishing suitable conditions for DoE on Capto adhere in binding mode.

22 29-0548-08 AA
Salt types and additivesDifferent salt types and additives can modulate the interactions of target molecule with multimodal chromatography media. Because hydrophobic interaction is one of the interaction modes that is often involved, the choice of salt may play an important role.
Different salt types will affect the strength of interaction according to the Hofmeister series (Fig 2.7). Typical ions used in HIC are found to the left in the series, while the chaotropic ions to the right in the series, for example, iodine, reduce the hydrophobic interaction through the salting-out effect.
Anion:SO4
2- > HPO42- > acetate > Cl- > NO3
- > Br- > ClO3- > I- > ClO4
- > SCN-
Cation:NH4
+ > K+ > Na+ > Li+ > Mg2+ > Ca2+ > guanidinium
Fig 2.7. Hofmeister series.
Organic solvents, for example, ethanol and isopropyl alcohol, decrease the strength of hydrophobic interactions and can, as such, affect the binding of biomolecules to multimodal chromatography media. Detergents and antifoaming agents such as Tween™ 80 and Triton™ X-100 can have a similar effect.
Hydrogen bond disruptors such as urea and guanidine hydrochloride also have the potential to impact the strength of interaction on multimodal chromatography media. Some compounds might influence several different interactions, for example, urea and guanidinium salt are chaotropic as well as hydrogen bond disruptors. Studies on several other modifiers, for example, amino acids or polyethylene glycol, have also been published. Examples of the influence of salt types and additives for Capto adhere and Capto MMC are found in Chapter 3.

29-0548-08 AA 23
Chapter 3 Multimodal chromatography media
GE Healthcare offers multimodal media in a wide range of formats to meet users’ needs at all stages of protein purification process development and manufacture. All of the multimodal chromatography media from GE Healthcare are BioProcess™ media. BioProcess media are developed and supported for production-scale chromatography. They are produced with validated methods and are tested to meet manufacturing requirements. Secure ordering and delivery routines give a reliable supply of media for production scale. Regulatory Support Files (RSF) are available to assist process validation and submissions to regulatory authorities. BioProcess media cover all purification steps from capture to polishing. The first multimodal medium introduced by GE Healthcare was Capto MMC, shortly followed by Capto adhere. As with all Capto media, the chosen ligands are coupled on a high-flow agarose base matrix, which gives improved pressure-flow properties compared with older media (Fig 3.1).
Velo
city
(cm
/h)
30 35 40 45 50
Bed height (cm)
2000
1800
1600
1400
1200
1000
800
600
400
200
0
0 5 10 15 20 25
4
8
1
2
Capto
Sepharose 6 Fast Flow
Capto ImpRes
Sepharose High Performance
Fig 3.1. Comparison of the window of operation (area below the curves) at large scale for different base matrices. Gray lines give the residence time in the column in minutes. The particle size of Capto MMC/adhere is 75 µm, and of Capto MMC/adhere ImpRes it is 40 µm. See Appendix 1 for characteristics of the various multimodal media from GE Healthcare.
The highly cross-linked agarose base matrix gives the media high chemical and physical stability. High flow velocities increase the productivity of large-scale bioprocessing operations and allow large volumes to be processed in one working shift. The multimodal ligands in Capto adhere and Capto MMC media were developed to offer novel selectivities compared with anion and cation exchangers, respectively. The multimodal ligands are now also available on the high-resolution base matrix Capto ImpRes (Fig 3.1), as Capto adhere ImpRes and Capto MMC ImpRes. GE Healthcare has also recently introduced Capto Core 700, a product that combines GF and multimodal anion exchange characteristics. Table 3.1 provides an overview of available multimodal chromatography products from GE Healthcare.

24 29-0548-08 AA
Table 3.1. Characteristics, benefits, and uses of multimodal chromatography media
Medium Structure Main functionalities Advantages Uses
Capto adhere Ligand: N-benzyl methyl ethanolamine (see Fig 3.2)
Base matrix: Capto
Electrostatic interaction, hydrogen bonding, and hydrophobic interaction
High capacity and productivity
Removal of impurities to formulation levels in post-protein A purification
Wide operational window of pH and conductivity
Savings in time and operating costs with a two-step chromatographic process (see also Appendix 3)
Intermediate purification and polishing of MAbs after capture on protein A. Traditionally used in flowthrough mode.
Purification of other target proteins from capture to polishing steps.
Capto adhere ImpRes
Ligand: N-benzyl methyl ethanolamine (see Fig 3.2)
Base matrix: Capto ImpRes
See Capto adhere Same as Capto adhere but with higher resolution and lower elution volumes
Efficient MAb polishing, removal of aggregates and HCP, and separations of charge variants. Polishing resulting in smaller elution volumes.
The properties of the small Capto ImpRes particle are best utilized in bind/elute mode.
Capto MMC Ligand: N-benzoyl-homocysteine (see Fig 3.6)
Base matrix: Capto
Thiophilic interaction, hydrophobic interaction, hydrogen bonding, and electrostatic interaction
Capto MMC gives high productivity and reduced cost with:
- High dynamic binding capacity (DBC) at high conductivity
- High volume throughput
- Different selectivity compared with traditional ion exchangers
Capture and intermediate purification of proteins from large feed volumes by packed bed chromatography. Purification can be performed at the conductivity of the feed material.
Capto MMC ImpRes
Ligand: N-benzoyl-homocysteine (see Fig 3.6)
Base matrix: Capto ImpRes
See Capto MMC Same as Capto MMC but with higher resolution, lower elution volumes, and increased possibility to elute with salt only.
Efficient MAb polishing, removal of aggregates and HCP, and separations of charge variants. Polishing resulting in smaller elution volumes.
The properties of the small Capto ImpRes particle are best utilized in bind/elute mode.
Capto Core 700 Ligand: octylamine (see Fig 3.12)
Base matrix: high-flow agarose
GF, AIEX, and HIC
Core bead technology with ligand-activated core and nonfunctionalized shell allows efficient capture of contaminants while target molecules are collected in flowthrough.
Significantly improved productivity compared with GF (100-fold)
Straightforward optimization and robust performance
Purification of viruses and other large target molecules.
Custom Designed Media1 (CDM)
Wide selection Wide selection Tailored to the user’s needs
Various
1 For challenging separation where standard multimodal media do not provide the desired results, CDM can provide libraries of additional multimodal anion or cation exchangers. The libraries are provided in 96-well microtiter plate format for rapid media screening. The multimodal cation and anion plates, respectively, contain 16 different multimodal media each.
29-0548-08 AA 25
Capto adhere Capto adhere is a multimodal strong anion exchanger for BioProcess applications. It was originally designed for post-protein A purification of MAbs at process scale in flowthrough mode. However, Capto adhere can also be used in bind/elute mode and for applications other than MAbs.
The strong multimodal ion exchange ligand (Fig 3.2) gives a different selectivity compared with traditional ion exchangers. Capto adhere can remove key impurities in a single step, allowing the design of a two-step process together with a protein A media (e.g., MabSelect™, MabSelect SuRe™, or MabSelect SuRe LX). Capto adhere can also be used in combination with AIEX or CIEX for polishing, as a second or third step in any MAb purification platform (see Fig A3.1 in Appendix 3).
Key performance benefits of Capto adhere include:
• high load and productivity
• impurity removal to formulation levels in post-protein A purification. Removal of:
- antibody dimers and aggregates- HCP- nucleic acids- viruses- leached protein A- endotoxin
• wide operational window of pH and conductivity
• savings in time and operating costs with a two-step chromatographic process
O O
OHOH
OHN+
(A)(B)
(C)
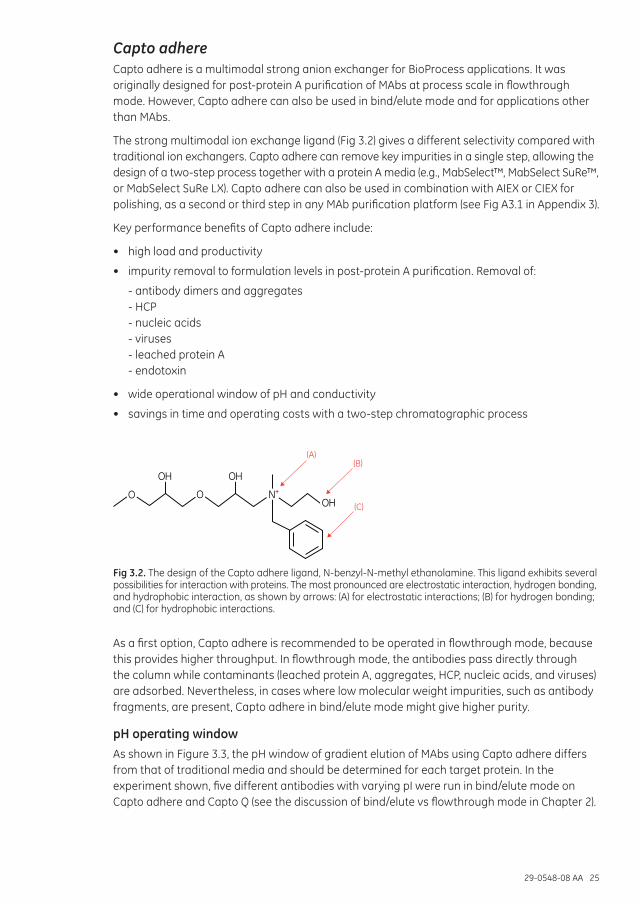
Fig 3.2. The design of the Capto adhere ligand, N-benzyl-N-methyl ethanolamine. This ligand exhibits several possibilities for interaction with proteins. The most pronounced are electrostatic interaction, hydrogen bonding, and hydrophobic interaction, as shown by arrows: (A) for electrostatic interactions; (B) for hydrogen bonding; and (C) for hydrophobic interactions.
As a first option, Capto adhere is recommended to be operated in flowthrough mode, because this provides higher throughput. In flowthrough mode, the antibodies pass directly through the column while contaminants (leached protein A, aggregates, HCP, nucleic acids, and viruses) are adsorbed. Nevertheless, in cases where low molecular weight impurities, such as antibody fragments, are present, Capto adhere in bind/elute mode might give higher purity.
pH operating windowAs shown in Figure 3.3, the pH window of gradient elution of MAbs using Capto adhere differs from that of traditional media and should be determined for each target protein. In the experiment shown, five different antibodies with varying pI were run in bind/elute mode on Capto adhere and Capto Q (see the discussion of bind/elute vs flowthrough mode in Chapter 2).

26 29-0548-08 AA
Analytical loads of the antibodies were used, and they were eluted from the chromatography media with a pH gradient. The antibodies elute in the same order on both media, but they elute much earlier—that is, at higher pH—on Capto Q. This result indicates that additional interactions are involved on Capto adhere. Antibodies eluted below the isoelectric point on Capto adhere.
With respect to pH, the operating window for Capto adhere is therefore at lower pH than for traditional anion exchangers. If deamidation of the antibody is an issue, being able to run at lower pH is of course beneficial.
(A) Capto adhere (B) Capto Q
10 20
Volume (mL)
30 40
8
7
6
5
4
pH
0 10 20
Volume (mL)
30 40 50 60
11
10
9
8
7
6
pH
Capto adhere Capto Q Mab 4 Mab 3 Mab 5 Mab 2 Mab 1 Elution pH 6.2 5.3 5.1 5.1 4.9 pI 9-10 8.8-9.1 8.3-8.9 7.4 5.0-8.5
Mab 4 Mab 3 Mab 5 Mab 2 Mab 1 Elution pH 9.9 9.6 9.4 8.4 6.2 pI 9-10 8.8-9.1 8.3-8.9 7.4 5.0-8.5
Fig 3.3. Different selectivity of Capto adhere compared with traditional ion exchangers. pH gradient elution of five MAbs on Capto adhere and Capto Q. For the pH gradient (A) A-buffer (equilibration buffer) was 20 mM Na-citrate + 20 mM Na-phosphate, pH 7.8, and B-buffer was buffer A at pH 4.0. (B) A-buffer was 20 mM Na-phosphate, 20 mM Tris, 20 mM glycine, pH 11, and B-buffer was buffer A at pH 6.2 Gradient: 0 to 100%B, 10 column volumes (CV).
Removal of aggregatesHigh antibody titers tend to increase the generation of aggregates and impurities in the feedstock. Capto adhere allows removal of aggregates to target values acceptable for formulation. To achieve the best performance with Capto adhere operated in flowthrough mode (i.e., to maximize the amount of impurities adsorbed to the medium while the monomeric MAbs pass through the column), screening for optimal loading conditions is needed. Optimization is preferably done with DoE. For details about how to set up a DoE, see Chapter 4, which includes an application example showing how Capto adhere effectively removes aggregates. In this work, the sample was a cell culture supernatant (CSS) containing IgG1 that was first purified on MabSelect SuRe. See also application notes 28-9078-89, “Optimization of loading conditions on Capto adhere using design of experiments” and 28-9509-60, “High-throughput screening and optimization of a multimodal polishing step in a monoclonal antibody purification process.”
Viral clearanceAn example of the use of Capto adhere for viral clearance is presented in Chapter 4. In this work, Capto adhere was tested with two representative model viruses, and it was found that even at high conductivity, where traditional ion exchangers do not work, the log reduction factor was significant.

29-0548-08 AA 27
Removal of other impurities and contaminantsRemoval of HCP and leached protein A is illustrated in Chapter 4. Negatively charged impurities/contaminants such as nucleic acids and endotoxins are also effectively removed.
Salt type and additivesAs previously discussed, separation of monoclonal monomer and aggregates is one of the main challenges in MAb processes. In Figure 3.4, an experiment is presented in which the effect of isopropyl alcohol and urea on monomer and aggregate static binding capacity (SBC) of Capto adhere was investigated. With 20% isopropyl alcohol, the monomer capacity decreased significantly with increased ionic strength, while the aggregate capacity remained essentially unchanged. In the case of urea, the effect of ionic strength was similar for both the monomer and the aggregates, leading to a decrease in binding capacity with increase in ionic strength. At low ionic strength, the effect of urea on capacity of aggregates was minimal, while the binding capacity for monomer decreased almost two-fold. These findings can be utilized to optimize a Capto adhere step in flowthrough mode where low monomer binding and high aggregate binding is desirable.
60
50
40
30
20
10
0
SBC
(g/L
)
0
10
20
30
40
50
60
0,11 0,21 0,31 0,410
5
10
15
20
0,11 0,21 0,31 0,41
0
10
20
30
40
50
0,06 0,16 0,26 0,360
5
10
15
20
0,06 0,16 0,26 0,36
Monomer capacity Aggregate capacity
Monomer capacity Aggregate capacity
Monomer capacity Aggregate capacity
Ionic strength (M) Ionic strength (M)
Phosphate, pH 7 and isopropyl alcohol
Phosphate, pH 6 and urea
SBC
(g/L
) SB
C (g
/L)
No IPA IPA 10% IPA 20%
No IPA IPA 10% IPA 20%
No urea Urea 2 M Urea 1 M
No urea Urea 2 M Urea 1 M
0.11 0.21 0.31 0.41
Ionic strength (M)
20
15
10
5
0
SBC
(g/L
)
0.11 0.21 0.31 0.41
Ionic strength (M)
50
40
30
20
10
0
SBC
(g/L
)
Ionic strength (M)
20
15
10
5
0
SBC
(g/L
)
Ionic strength (M)
No IPA IPA 10% IPA 20%
0.06 0.16 0.26 0.36 0.06 0.16 0.26 0.36
No urea Urea 1 M Urea 2 M
No urea Urea 1 M Urea 2 M
No IPA IPA 10% IPA 20%
(A) Phosphate, pH 7 and isopropyl alcohol
(B) Phosphate, pH 6 and urea
Fig. 3.4. The influence of (A) isopropyl alcohol (IPA) and (B) urea on the SBC for monomeric and aggregate forms of a MAb on Capto adhere. Phosphate was used as buffer, and ionic strength was adjusted using NaCl. At high ionic strength, isopropyl alcohol can significantly lower monomer capacity while maintaining most of the aggregate capacity (black circles). The effects are similar for urea at low ionic strength, although not identical. These results illustrate that some additives could have multiple effects, i.e., both reducing hydrophobic interactions and disrupting hydrogen bonds.
The type of salt chosen can also affect performance, as shown in Figure 3.5. In this experiment the effect of different salt species on SBC was compared. With NaI the aggregate capacity decreased significantly with increased ionic strength, while the monomer capacity was essentially unchanged. The NaI effect suggests that chaotropic salts can be used to optimize a bind/elute step, where high monomer capacity and low aggregate capacity is desirable.

28 29-0548-08 AA
70
60
50
40
30
20
10
0
SBC
(g/L
)Monomer capacity Aggregate capacity
0.11 0.21 0.31 0.41
Ionic strength (M)
20
15
10
5
0
SBC
(g/L
)
0.11 0.21 0.31 0.41
Ionic strength (M)
Na2SO4
No saltNaClNal
Na2SO4
No saltNaClNal
Fig 3.5. The influence of different salt types on the SBC for MAb monomers and aggregates on Capto adhere. Phosphate at pH 7.0 was used as buffer in all cases.
RegenerationDue to its multimodal properties, regeneration of Capto adhere generally requires an acidic strip prior to CIP (see Appendix 2).
Capto adhere ImpResCapto adhere ImpRes is a cost-effective and flexible chromatography medium designed for high-resolution polishing of MAbs. Capto adhere ImpRes is a multimodal anion exchange medium with the same ligand as used with Capto adhere (Fig 3.2). It displays high resolution due to its small bead size (40 µm compared with 75 µm for Capto adhere). The high resolution obtained with Capto adhere ImpRes enables reduced buffer consumption and improved product yield when compared with Capto adhere. Impurities/contaminants such as DNA, HCP, leached protein A, aggregates, endotoxin, and viruses are efficiently separated from the target MAb in bind/elute or flowthrough modes in either two- or three-step purification schemes. The influences of different salt types and additives are the same as for Capto adhere, as discussed above. The medium can also be used for purification of other recombinant proteins and biomolecules. For a MAb application example, see the Capto adhere ImpRes Example 1 in Chapter 4.
Fast mass transferThe small particle size of Capto adhere ImpRes generally results in a higher dynamic binding capacity (DBC) and also less sensitivity to changes in residence time than is the case with Capto adhere. These effects are exemplified in Figure 3.6.
60
50
40
30
20
10
0100 2 4
Residence time (min)6 8
DBC
10%
(mg/
mL)
Capto adhere ImpResCapto adhere
Fig 3.6. DBC of a MAb vs residence time. DBC at 10% breakthrough measured in 90 mM sodium phosphate, pH 7.75.

29-0548-08 AA 29
High resolution and small pool volumesAnother advantage of Capto adhere ImpRes, associated with the smaller particle size, is an improved resolution that gives a better clearance of impurities. An example of this is shown in Figure 3.7, where aggregate removal and yield of Capto adhere ImpRes and Capto adhere are compared in bind/elute mode. The result shows that while a good separation was achieved between monomer and aggregates using Capto adhere, separation was further improved using Capto adhere ImpRes.
100
80
60
40
20
02.00 0.5
Cum aggregates (%)
Capto ImpResCapto adhere
1.0 1.5
Cum
mon
omer
(%)
Fig 3.7. Cumulated aggregates vs cumulated MAb monomer yield after linear gradient elution using Capto adhere ImpRes and Capto adhere.
The high resolution of Capto adhere ImpRes is also maintained by using step elution instead of linear gradient elution, as shown in Table 3.2. The sample load was 70% of DBC 10%. Fractions were pooled and analyzed for yield, aggregate, HCP concentration, and pool volume. Despite a 20% higher load, step elution from Capto adhere ImpRes resulted in higher yield and better aggregate clearance compared with Capto adhere (Table 3.2). HCP levels were below the detection limit for ELISA for both media. Pool volume was also significantly smaller with Capto adhere ImpRes compared with Capto adhere.
Table 3.2. Results from step elution
Medium (mg/mL)
Sample load (mg/mL)
Yield (%)
Pool volume (column volume)
Aggregates (%)
HCP1 (ng/mL)
Capto adhere ImpRes 30 91 4.4 0.5 Below detection limit (< 20 ng/mL)
Capto adhere 25 79 6.1 0.8 Below detection limit (< 20 ng/mL)
1 Measured with general ELISA from Cygnus Technologies.
Capto adhere ImpRes and Capto adhere were compared in a MAb flowthrough step (Table 3.3). Using a residence time of 4 min, the aggregate and protein A clearance were equivalent for both media, while Capto adhere ImpRes gave higher yield and improved HCP clearance.
At 2 min residence time, Capto adhere ImpRes showed equivalent yield and protein A and HCP clearance, while a slight increase in aggregate level was observed.

30 29-0548-08 AA
Table 3.3. Results of flowthrough experiments with a MAb
Media and start material
Residence time (min)
Monomer yield (%)
Aggregates (%)
HCP reduction (pool/load)
Protein A (ppm)
Start material N/A N/A 3.4 N/A 3
Capto adhere 4 91 0.5 3 < 1
Capto adhere ImpRes 4 94 0.5 4.5 < 1
Capto adhere ImpRes 2* 94 0.7 4.5 < 1
* Refer to Figure 3.1 for bed height limitations at short residence times.
RegenerationDue to its multimodal properties, regeneration of Capto adhere ImpRes generally requires an acidic strip prior to CIP. For maintenance of the medium, including strip, CIP, and storage, see Appendix 2.
Capto MMCCapto MMC is a multimodal cation exchanger with the properties of a weak cation exchanger. In addition to electrostatic interactions, the ligand structure provides for additional interaction modes such as hydrophobic interaction, hydrogen bonding, and thiophilic interaction (Fig 3.8). The different possible interaction modes give the media novel selectivity and make it salt tolerant, which in turn allows sample to be loaded without dilution or a buffer exchange step, resulting in increased productivity.
O O
O O-
S
OHOH
NH
(B)
(C)
(D)
(A)
O
Fig 3.8. Capto MMC ligand. Interactions are shown by arrows: (A) for thiophilic; (B) for hydrophobic; (C) for hydrogen bonding; and (D) for electrostatic interactions.
Capto MMC is based on a highly rigid agarose base matrix that allows high flow rates and low back pressure at large scale, and is well-suited for fast, efficient and cost-effective protein purification. See also Figure 3.1 and its accompanying discussion of pressure-flow properties.
Capto MMC gives increased productivity and reduced cost with:
• high DBC even at high conductivity (binding of proteins can be performed at the conductivity of the feed material)
• high volume throughput
• new selectivity
• smaller unit operations (no dilution of feed material necessary, which leads to smaller tanks and faster operation)
High salt toleranceThe various interactions of Capto MMC medium described above provide characteristics different from traditional cation exchangers, including binding of proteins at high salt concentration (Fig 3.9). Capto MMC can therefore be used for direct load of feedstocks, without prior dilution or buffer exchange to reduce the conductivity of the starting material.

29-0548-08 AA 31
0
10
20
30
40
50
60
0 10 20 30 40 50Conductivity (mS/cm)
Conductivity (mS/cm)
DBC
(mg/
mL)
Lysozyme
β-Lactoglobulin
BSA
0
10
20
30
40
50
60
0 5 10 15
DBC
(mg/
mL)
Capto MMC
Traditional cation exchanger
(A)
(B)
Fig 3.9. (A) DBC of Capto MMC at 1 min residence time for three different proteins at different conductivities. (B) Capto MMC allows a much larger operating range in terms of conductivity of the starting material than traditional cation exchangers.
Unique selectivityThe unique selectivity can also be used to solve specific purification problems, at high or low conductivity. A comparison between a traditional cation exchanger (SP Sepharose Fast Flow) and Capto MMC shows that the selectivity of the two media differs significantly (Fig 3.10). The elution profile on SP Sepharose Fast Flow revealed one peak whereas the elution profile on Capto MMC showed two, possibly three peaks. Native gel electrophoresis also showed that the separation patterns differ between the media.

32 29-0548-08 AA
Column: Tricorn 5/100Medium: A) Capto MMC; B) SP Sepharose Fast FlowSample: human blood plasma diluted 5 times, 10 CVBuffer A: 100 mM acetic acid, 50 mM Na-phosphate, 20 mM Na-succinate, pH 5.0Buffer B: 100 mM acetic acid, 50 mM Na-phosphate, 20 mM Na-succinate, pH 8.0 with 1 M NH4Cl Flow: 150 cm/hGradient: linear gradient 0–100%B over 10 CVSystem: ÄKTA
66 kD
140 kD
232 kD
440 kD 669 kD
66 kD
140 kD
232 kD
440 kD
669 kD
HMW 3 2 1 FT Plasma
0 20 40 60 80
0
500
1000
1500
2000
2500
3000 SP Sepharose Fast Flow
0 20 40 60 80
Elution volume (mL)
Elution volume (mL)
0
1000
2000
3000
4000
A 294
(mAU
)A 2
94 (m
AU)
Capto MMC
1 2 3
12 3
HMW 3 2 1 FT
(A)
(B)
Fig 3.10. The selectivity of (A) Capto MMC and (B) SP Sepharose Fast Flow was investigated using human blood plasma, as described above. Fractions (indicated with arrows) and the flowthrough pool (FT) were analyzed on native PhastGel™ gradient 8%-25% and Coomassie™ stained. High molecular weight marker (HMW, GE Healthcare) and unfractionated plasma sample were also applied to the gels.
In contrast to traditional cation exchangers, Capto MMC may bind proteins above the pI of the target protein (see Fig 2.5 in Chapter 2). Therefore, if pH is used for elution, higher pH is required with Capto MMC than with traditional cation exchangers. This is illustrated in the elution screening study shown in Figure 3.11.
The figure compares the results obtained in PreDictor plates with results obtained in columns. The best recovery in the elution step is obtained with a simultaneous change in pH and salt concentration. Identical results are not obtained in the two formats, but the trends as well as the optimal conditions found are the same.

29-0548-08 AA 33
The best recovery is obtained at pH 6.75, which is approximately 2 pH units above the pI of BSA. For further details see application note 28-9277-90, “High-throughput screening for elution conditions on Capto MMC using PreDictor plates.”
NaC
l (M
)N
aCl (
M)
pH = 5.75 pH = 6.25 pH = 6.75
0.60.40.2
0.81.01.21.41.6
0.05 0.10 0.15 0.20 0.25 0.30
BIS (M)0.05 0.10 0.15 0.20 0.25 0.30
BIS (M)0.05 0.10 0.15 0.20 0.25 0.30
BIS (M)
0.05 0.10 0.15 0.20 0.25 0.300.05 0.10 0.15 0.20 0.25 0.30
0.60.40.2
0.81.01.21.41.6
0.05 0.10 0.15 0.20 0.25 0.30
20
4060
80
100
20
40
60 80
100
20
40
60
80
100
40
60
80
100
20
40
60
80
0 10
3050
70
90
NH
4Cl (
M)
NH
4Cl (
M)
pH = 5.75 pH = 6.25 pH = 6.75
0.60.40.2
0.81.01.21.41.6
7381
89
97
0.60.40.2
0.81.01.21.41.6
BIS (M) BIS (M) BIS (M)
81
89
97
105
97
105
97
105
112
105
66
66
89
7381
97
105
8981
112
105
9789
NaC
l (M
)N
aCl (
M)
pH = 5.75 pH = 6.25 pH = 6.75
0.60.40.2
0.81.01.21.41.6
0.05 0.10 0.15 0.20 0.25 0.30
BIS
0.60.40.2
0.81.01.21.41.6
0.05 0.10 0.15 0.20 0.25 0.30
BIS
0.60.40.2
0.81.01.21.41.6
0.05 0.10 0.15 0.20 0.25 0.30
BIS
0.60.40.2
0.81.01.21.41.6
0.05 0.10 0.15 0.20 0.25 0.30
BIS
0.60.40.2
0.81.01.21.41.6
0.05 0.10 0.15 0.20 0.25 0.30
BIS
0.60.40.2
0.81.01.21.41.6
0.05 0.10 0.15 0.20 0.25 0.30
BIS
20
4060
80
100
20
40
60 80
100
20
40
60
80
100
40
60
80
100
20
40
60
80
0 10
3050
70
90
NH
4Cl (
M)
NH
4Cl (
M)
NaC
l (M
)N
aCl (
M)
NH
4Cl (
M)
NH
4Cl (
M)
NaC
l (M
)N
aCl (
M)
NH
4Cl (
M)
NH
4Cl (
M)
pH = 5.75 pH = 6.25 pH = 6.75
0.60.40.2
0.81.01.21.41.6
50 100 150 200 250 300
BIS
7381
89
97
0.60.40.2
0.81.01.21.41.6
50 100 150 200 250 300
BIS
0.60.40.2
0.81.01.21.41.6
50 100 150 200 250 300
BIS
0.60.40.2
0.81.01.21.41.6
50 100 150 200 250 300
BIS
0.60.40.2
0.81.01.21.41.6
50 100 150 200 250 300
BIS
0.60.40.2
0.81.01.21.41.6
50 100 150 200 250 300
BIS
81
89
97
105
97
105
97
105
112
105
66
66
89
7381
97
105
8981
112
105
9789
(A) PreDictor plates
(B) Tricorn columns
Fig 3.11. Contour plots for the recovery in percent (see labels within each contour plot) of BSA in (A) PreDictor plates and (B) Tricorn column. Recovery is plotted as a function of salt concentration (y axis) and buffer ionic strength (BIS; x axis, running from 0.05 to 0.30 M) at three different pH values for the two salt types NH4Cl and NaCl. The load was 70% of DBC at 10% breakthrough, and the loading buffer was 50 mM sodium acetate, pH 4.75, 250 mM NaCl. Experimental data points are shown as black dots.
Salt type and additivesAs previously discussed (Chapter 2), the choice of salt type or the use of additives will impact the chromatographic behavior of multimodal media. For example, the recovery of the target molecule is affected by the salt type used, as exemplified in Figure 3.11.
The effect of different additives on DBC on Capto MMC is shown in Fig 3.12. In this example, detergents and antifoam agents did not have a significant impact on capacity, while organic solvents and hydrogen bond disruptors had a larger impact.
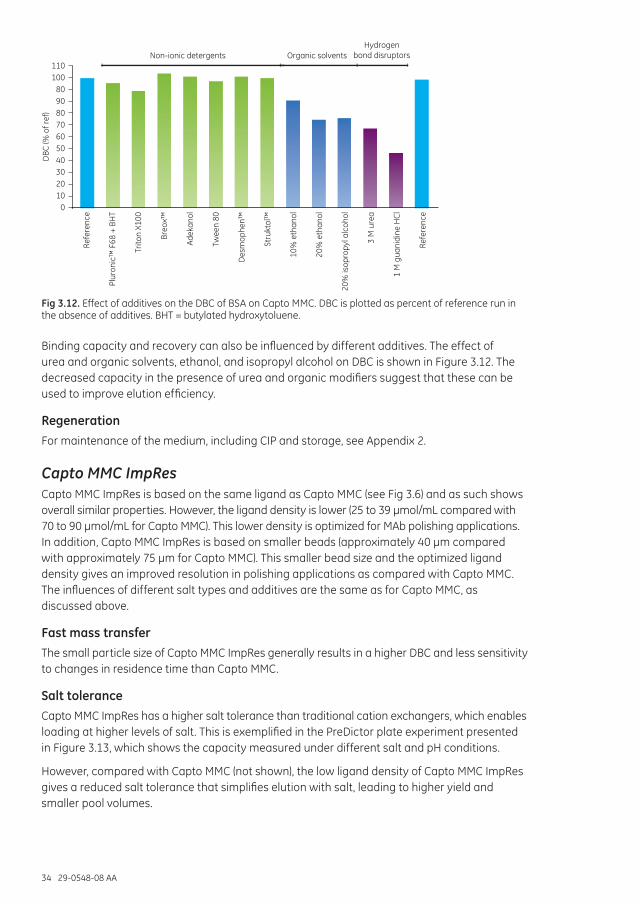
34 29-0548-08 AA
110100
80908070605040302010
0
Refe
renc
e
Plur
onic
™ F
68 +
BH
T
Trito
n X1
00
Breo
x™
Adek
anol
Twee
n 80
Des
mop
hen™
Stru
ktol
™
10%
eth
anol
20%
eth
anol
20%
isop
ropy
l alc
ohol
3 M
ure
a
1 M
gua
nidi
ne H
Cl
Refe
renc
e
DBC
(% o
f ref
)Non-ionic detergents Organic solvents
Hydrogen bond disruptors
Fig 3.12. Effect of additives on the DBC of BSA on Capto MMC. DBC is plotted as percent of reference run in the absence of additives. BHT = butylated hydroxytoluene.
Binding capacity and recovery can also be influenced by different additives. The effect of urea and organic solvents, ethanol, and isopropyl alcohol on DBC is shown in Figure 3.12. The decreased capacity in the presence of urea and organic modifiers suggest that these can be used to improve elution efficiency.
RegenerationFor maintenance of the medium, including CIP and storage, see Appendix 2.
Capto MMC ImpResCapto MMC ImpRes is based on the same ligand as Capto MMC (see Fig 3.6) and as such shows overall similar properties. However, the ligand density is lower (25 to 39 µmol/mL compared with 70 to 90 µmol/mL for Capto MMC). This lower density is optimized for MAb polishing applications. In addition, Capto MMC ImpRes is based on smaller beads (approximately 40 µm compared with approximately 75 µm for Capto MMC). This smaller bead size and the optimized ligand density gives an improved resolution in polishing applications as compared with Capto MMC. The influences of different salt types and additives are the same as for Capto MMC, as discussed above.
Fast mass transferThe small particle size of Capto MMC ImpRes generally results in a higher DBC and less sensitivity to changes in residence time than Capto MMC.
Salt toleranceCapto MMC ImpRes has a higher salt tolerance than traditional cation exchangers, which enables loading at higher levels of salt. This is exemplified in the PreDictor plate experiment presented in Figure 3.13, which shows the capacity measured under different salt and pH conditions.
However, compared with Capto MMC (not shown), the low ligand density of Capto MMC ImpRes gives a reduced salt tolerance that simplifies elution with salt, leading to higher yield and smaller pool volumes.

29-0548-08 AA 35
500
450
400
350
300
250
200
150
100
50
04.0 4.5 5.0 5.5 6.0 6.5 7.0 7.5 8.0
NaC
l (m
M)
pH
SBC (mg/mL)
Not studied
65
60
55
50
45
40
35
30
25
20
15
10
5
0
500
450
400
350
300
250
200
150
100
50
04.0 4.5 5.0 5.5 6.0 6.5 7.0 7.5 8.0
NaC
l (m
M)
pH
Fig 3.13. Comparison of the effect of salt and pH on the SBC on Capto MMC ImpRes (left) and Capto SP ImpRes (right).
High resolution and high capacityThe smaller particle size of Capto MMC ImpRes, compared with Capto MMC, provides increased resolution. Capto MMC ImpRes also has a high DBC and efficiently removes impurities. In Table 3.4, this is illustrated for MAb purification, and results are compared with those on Capto MMC. At the same load, Capto MMC ImpRes gives better aggregate removal and higher yield. Furthermore, this performance is also maintained at higher load.
Table 3.4. Comparison of the performance of Capto MMC ImpRes and Capto MMC in a MAb purification process using a NaCl gradient for elution
Prototype Load (mg)Cumulated aggregate
at 90% yield (%)Yield at 1%
aggregate (%)
Capto MMC 281 1.1 88.2
Capto MMC ImpRes 28 0.3 95.9
Capto MMC ImpRes 481 0.5 94.8
1 70% of DBC of the chromatographic media.
RegenerationFor maintenance of the medium, including CIP and storage, see Appendix 2.
Capto Core 700Capto Core 700 is designed for intermediate purification and polishing of viruses and other large biomolecules in flowthrough mode.
Designed for flowthrough chromatographyThe Capto Core concept is based on a bead with an nonfunctionalized outer layer (without ligand) and a functionalized core with an attached ligand (Fig 3.14). This design combines properties of GF and adsorption chromatography. The bead’s pores in the outer layer, with an approximate exclusion limit of 700 kD, have been specifically designed to exclude large molecular entities such as viruses, DNA, large protein, or protein complexes from entering the internal space and interacting with the ligand, thereby enabling an efficient flowthrough purification step.
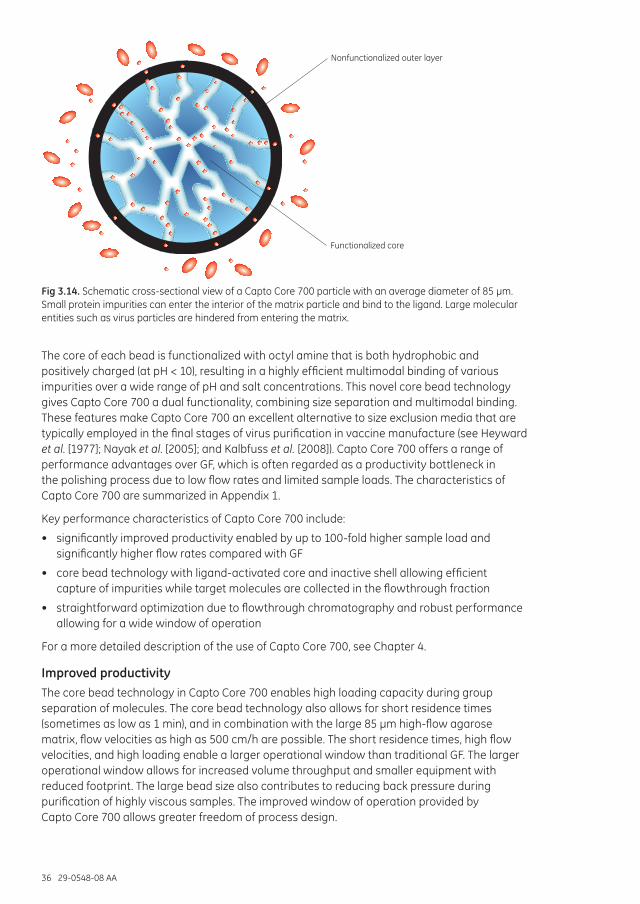
36 29-0548-08 AA
Nonfunctionalized outer layer
Functionalized core
Fig 3.14. Schematic cross-sectional view of a Capto Core 700 particle with an average diameter of 85 µm. Small protein impurities can enter the interior of the matrix particle and bind to the ligand. Large molecular entities such as virus particles are hindered from entering the matrix.
The core of each bead is functionalized with octyl amine that is both hydrophobic and positively charged (at pH < 10), resulting in a highly efficient multimodal binding of various impurities over a wide range of pH and salt concentrations. This novel core bead technology gives Capto Core 700 a dual functionality, combining size separation and multimodal binding. These features make Capto Core 700 an excellent alternative to size exclusion media that are typically employed in the final stages of virus purification in vaccine manufacture (see Heyward et al. [1977]; Nayak et al. [2005]; and Kalbfuss et al. [2008]). Capto Core 700 offers a range of performance advantages over GF, which is often regarded as a productivity bottleneck in the polishing process due to low flow rates and limited sample loads. The characteristics of Capto Core 700 are summarized in Appendix 1.
Key performance characteristics of Capto Core 700 include:
• significantly improved productivity enabled by up to 100-fold higher sample load and significantly higher flow rates compared with GF
• core bead technology with ligand-activated core and inactive shell allowing efficient capture of impurities while target molecules are collected in the flowthrough fraction
• straightforward optimization due to flowthrough chromatography and robust performance allowing for a wide window of operation
For a more detailed description of the use of Capto Core 700, see Chapter 4.
Improved productivityThe core bead technology in Capto Core 700 enables high loading capacity during group separation of molecules. The core bead technology also allows for short residence times (sometimes as low as 1 min), and in combination with the large 85 µm high-flow agarose matrix, flow velocities as high as 500 cm/h are possible. The short residence times, high flow velocities, and high loading enable a larger operational window than traditional GF. The larger operational window allows for increased volume throughput and smaller equipment with reduced footprint. The large bead size also contributes to reducing back pressure during purification of highly viscous samples. The improved window of operation provided by Capto Core 700 allows greater freedom of process design.

29-0548-08 AA 37
Figure 3.15 illustrates schematically the higher load capacity and flow velocities enabled with Capto Core 700 relative to that of Sepharose 4 Fast Flow, which is a GF medium typically used in large-scale polishing processes.
Loa
d (m
g/m
L m
ediu
m)
Maximum flow velocity (cm/h)
0.3
10
100 500
Gel filtration
Capto Core 700
Fig 3.15. Schematic illustration of the significantly greater sample load and flow velocity enabled with Capto Core 700 in comparison with conventional GF media. Note that the schematic is not to scale.
RegenerationBound impurities are removed from the beads by CIP procedures (see Appendix 2 for maintenance of the medium).
Multimodal librariesMultimodal libraries from Custom Designed Media (CDM)CDM is a collaborative service for industrial customers to develop tailor-made chromatography media. CDM media can be produced for specific industrial process separations when suitable media are not available. The CDM group at GE Healthcare and the customer work in close collaboration to design, manufacture, test, and deliver media for large-scale purification.
The same approach used to develop Capto adhere and Capto MMC was used to design diversified multimodal libraries, with the goal of producing a library as large and diverse as possible in order to increase the chances of identifying the key parameters and the type of media most appropriate for a given purification challenge. Use of such new libraries together with good screening technology will favorably impact downstream process development.
The starting point of library design is the chemical and structural diversity of the ligands, which should be chosen to encompass a large range of chromatographic behavior. With this in mind, researchers at GE Healthcare developed two diversity-based multimodal ion exchange libraries, one a multimodal anion exchanger and the other a multimodal cation exchanger, to be used in an explorative phase when traditional media performance is not sufficient. Both libraries are based on 16 unique multimodal constructions in an easy-to-screen 96-well-plate format, and are available via the CDM group. The different constructs are not available as standard products, but are supplied on request. For more information about these libraries, contact your local GE Healthcare bioprocess representative. Examples of structures from the libraries are shown in Figure 3.16.
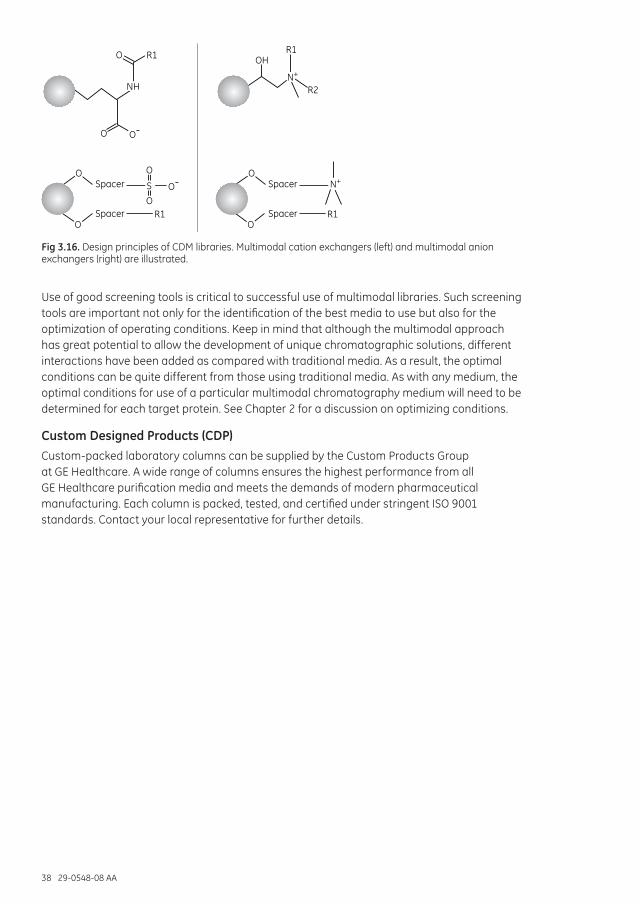
38 29-0548-08 AA
O
O
O
R1O
O-
O-
NH
SSpacer
Spacer R1
R2
R1
O
O
O
O
Spacer
Spacer R1
OH
N+
N+
Fig 3.16. Design principles of CDM libraries. Multimodal cation exchangers (left) and multimodal anion exchangers (right) are illustrated.
Use of good screening tools is critical to successful use of multimodal libraries. Such screening tools are important not only for the identification of the best media to use but also for the optimization of operating conditions. Keep in mind that although the multimodal approach has great potential to allow the development of unique chromatographic solutions, different interactions have been added as compared with traditional media. As a result, the optimal conditions can be quite different from those using traditional media. As with any medium, the optimal conditions for use of a particular multimodal chromatography medium will need to be determined for each target protein. See Chapter 2 for a discussion on optimizing conditions.
Custom Designed Products (CDP)Custom-packed laboratory columns can be supplied by the Custom Products Group at GE Healthcare. A wide range of columns ensures the highest performance from all GE Healthcare purification media and meets the demands of modern pharmaceutical manufacturing. Each column is packed, tested, and certified under stringent ISO 9001 standards. Contact your local representative for further details.

29-0548-08 AA 39
Formats of multimodal chromatography productsMultimodal media from GE Healthcare are available both in prepacked formats and as bulk media to be packed in columns.
Prepacked formats range from PreDictor plates to ReadyToProcess™ columns (Table 3.5).
Table 3.5. Prepacked formats available for multimodal media
Formats Features
PreDictor 96-well plates1 Supports HTPD by allowing parallel screening of chromatographic conditions using a 96-well plate format. Allows fast and efficient evaluation of parameters for binding/wash/elution conditions, and media selection. Can be used with an automated robotic or manual setup.
Assist software supports the PreDictor workflow from setup of experimental design to data evaluation.
PreDictor RoboColumn units Supports HTPD by allowing parallel screening of chromatographic conditions using a miniaturized column format and robotic workstation.
HiTrap™ columns (1 and 5 mL) For easy screening and convenient process development.
Note: Capto adhere ImpRes, Capto MMC ImpRes, and Capto Core 700 are available only in the 1 mL HiTrap column.
HiScreen™ columns (4.7 mL) Well-suited for parameter method optimization and parameter screening due to the 10 cm bed height.
ReadyToProcess columns (1, 2.5, 10, and 20 L)
All wetted parts of the ReadyToProcess columns are of USP class VI, with all components traceable to their production batches. Prequalified (by efficiency testing).
Prepacked in cleanroom (class ISO 8) environment. Presanitized and tested for endotoxin as well as microbiological growth and released according to specifications.
Custom packed columns A wide range of columns ensures high performance from all GE Healthcare purification media.
Meet the demands of modern pharmaceutical manufacturing.
Each column is packed, tested, and certified under stringent ISO 9001 standards.
1 Not available for Capto Core.
The multimodal media can be used together with most equipment available for chromatography from laboratory scale to production scale. At production scale, the preferred packing technique for Capto media is axial compression. The optimal approach is to use AxiChrom™ columns with Intelligent Packing and preset packing methods for all Capto media. Appropriate columns from GE Healthcare are shown in Table 3.6.
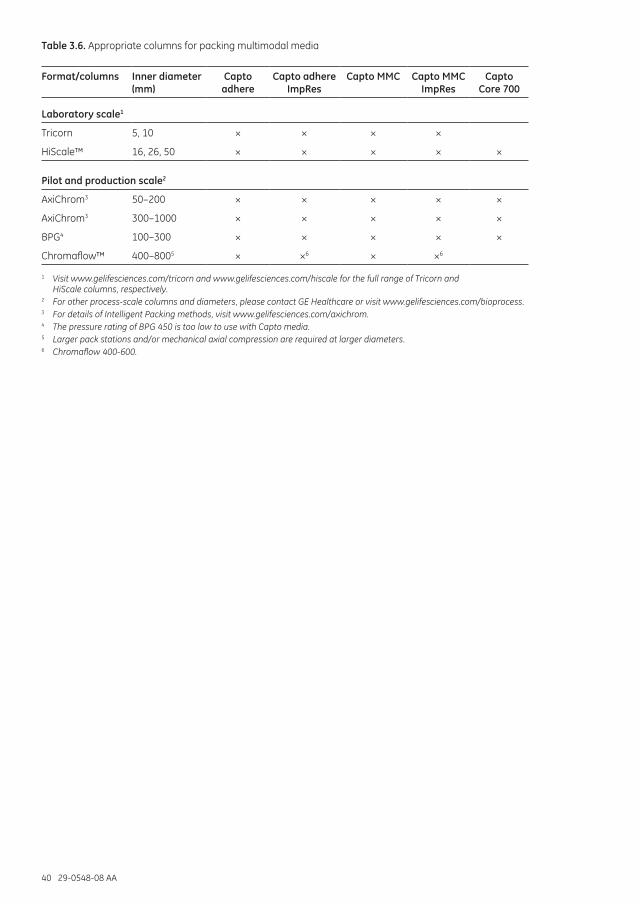
40 29-0548-08 AA
Table 3.6. Appropriate columns for packing multimodal media
Format/columns Inner diameter (mm)
Capto adhere
Capto adhere ImpRes
Capto MMC Capto MMC ImpRes
Capto Core 700
Laboratory scale1
Tricorn 5, 10 × × × ×
HiScale™ 16, 26, 50 × × × × ×
Pilot and production scale2
AxiChrom3 50–200 × × × × ×
AxiChrom3 300–1000 × × × × ×
BPG4 100–300 × × × × ×
Chromaflow™ 400–8005 × ×6 × ×6
1 Visit www.gelifesciences.com/tricorn and www.gelifesciences.com/hiscale for the full range of Tricorn and HiScale columns, respectively.
2 For other process-scale columns and diameters, please contact GE Healthcare or visit www.gelifesciences.com/bioprocess.3 For details of Intelligent Packing methods, visit www.gelifesciences.com/axichrom.4 The pressure rating of BPG 450 is too low to use with Capto media.5 Larger pack stations and/or mechanical axial compression are required at larger diameters.6 Chromaflow 400-600.
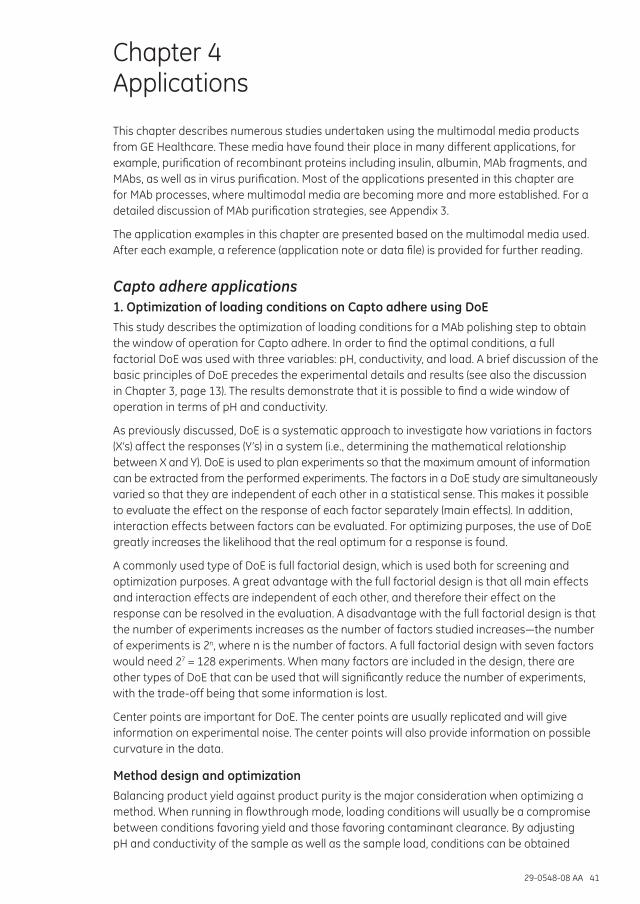
29-0548-08 AA 41
Chapter 4 Applications
This chapter describes numerous studies undertaken using the multimodal media products from GE Healthcare. These media have found their place in many different applications, for example, purification of recombinant proteins including insulin, albumin, MAb fragments, and MAbs, as well as in virus purification. Most of the applications presented in this chapter are for MAb processes, where multimodal media are becoming more and more established. For a detailed discussion of MAb purification strategies, see Appendix 3.
The application examples in this chapter are presented based on the multimodal media used. After each example, a reference (application note or data file) is provided for further reading.
Capto adhere applications1. Optimization of loading conditions on Capto adhere using DoEThis study describes the optimization of loading conditions for a MAb polishing step to obtain the window of operation for Capto adhere. In order to find the optimal conditions, a full factorial DoE was used with three variables: pH, conductivity, and load. A brief discussion of the basic principles of DoE precedes the experimental details and results (see also the discussion in Chapter 3, page 13). The results demonstrate that it is possible to find a wide window of operation in terms of pH and conductivity.
As previously discussed, DoE is a systematic approach to investigate how variations in factors (X’s) affect the responses (Y’s) in a system (i.e., determining the mathematical relationship between X and Y). DoE is used to plan experiments so that the maximum amount of information can be extracted from the performed experiments. The factors in a DoE study are simultaneously varied so that they are independent of each other in a statistical sense. This makes it possible to evaluate the effect on the response of each factor separately (main effects). In addition, interaction effects between factors can be evaluated. For optimizing purposes, the use of DoE greatly increases the likelihood that the real optimum for a response is found.
A commonly used type of DoE is full factorial design, which is used both for screening and optimization purposes. A great advantage with the full factorial design is that all main effects and interaction effects are independent of each other, and therefore their effect on the response can be resolved in the evaluation. A disadvantage with the full factorial design is that the number of experiments increases as the number of factors studied increases—the number of experiments is 2n, where n is the number of factors. A full factorial design with seven factors would need 27 = 128 experiments. When many factors are included in the design, there are other types of DoE that can be used that will significantly reduce the number of experiments, with the trade-off being that some information is lost.
Center points are important for DoE. The center points are usually replicated and will give information on experimental noise. The center points will also provide information on possible curvature in the data.
Method design and optimizationBalancing product yield against product purity is the major consideration when optimizing a method. When running in flowthrough mode, loading conditions will usually be a compromise between conditions favoring yield and those favoring contaminant clearance. By adjusting pH and conductivity of the sample as well as the sample load, conditions can be obtained

42 29-0548-08 AA
where most contaminants are adsorbed while the monomeric antibodies pass through the column. Optimization of loading conditions is preferably performed by using DoE. A common approach in DoE is to define a reference experiment (center point) and perform representative experiments around that point. To be able to define the center point and the variable ranges, some initial experiments are required.
Establish nonbinding conditions
To find conditions suitable for the DoE, initial experiments can be performed in binding mode, using a pH gradient for elution (Fig 4.1). The elution position (i.e., pH at peak maximum) defines the lower pH in the design. The upper pH in the design should normally be about two pH units higher. Experiments can also be performed in flowthrough mode, keeping the conductivity constant at a moderate level. A comparison of chromatograms is shown in Figure 4.2. At high pH (i.e., close to pI for the antibodies) the breakthrough during sample load is delayed, the breakthrough and wash curves are shallow, and significant amounts of MAb binds to the adsorbent. A decrease in pH (i.e., further from the pI) results in weaker electrostatic interaction between the antibodies and the adsorbent, steeper breakthrough and wash curves, and increased yield.
An alternative approach to determine experimental conditions for the DoE is to screen conditions using high-throughput formats (see following example, 2a to 2c). As large experimental spaces can be explored with high-throughput formats, the use of these formats will greatly enhance process understanding.
Column: Tricorn 5/100 packed with 2 mL Capto adhere; bed height 10.5 cmSample: Feed containing monoclonal IgG1, rProtein A elution pool, desaltedSample load: 1 mg IgG1/mL mediumLoading buffer: 20 mM sodium citrate + 20 mM sodium phosphate, pH 7.8Elution buffer: 20 mM sodium citrate + 20 mM sodium phosphate, pH 4.0Flow velocity: 200 cm/hSystem: ÄKTA
0.0 10.0 20.0 30.0 40.0 mL
0
20
40
60
80
100
120
140
160
A 280
(mAU
)
5.0
6.0
7.0
8.0
9.0
pH
Was
h
Gra
dien
t sta
rt
Fig 4.1. Establishing suitable conditions for DoE on Capto adhere in binding mode.

29-0548-08 AA 43
Column: Tricorn 5/20 packed with 0.5 mL Capto adhere; bed height 2.5 cmSample: Feed containing monoclonal IgG1, rProtein A elution pool, desaltedSample load: 75 mg IgG1/mL mediumLoading buffer: 25 mM Bis-Tris, pH 6.0 or 35 mM Tris, pH 8.0Elution buffer: 100 mM acetic acid, pH 4.0Flow rate: 0.25 mL/min (2 min residence time)System: ÄKTA
0.0 5.0 10.0 15.0 20.0 25.0 mL
0
500
1000
1500
2000
2500
3000
3500
4000
mAU
Fig 4.2. Establishing suitable conditions for DoE on Capto adhere in flowthrough mode. Comparison of chromatograms obtained at different pH: pH 8.0 (blue curve) and pH 6.0 (green curve).
In the DoE, pH, conductivity, and load must be included. It is important to include conditions at the higher pH range resulting in lower yield and higher purity, as well as conditions at lower pH range resulting in higher yield and lower purity.
Setup of a full factorial DoE with three parameters
Below is a stepwise description of how to set up a full factorial design.
1. Work prior to actual setup of the design
Perform initial loading experiments at varying pH, as described above. Choose parameters to include and define parameter ranges and responses.
2. Choose design for screening or optimization
Full factorial design is commonly used in both screening and optimization. A full factorial DoE in three parameters will give 23 = 8 experiments + center points. A graphical view of how the experiments are organized is shown in Figure 4.3.
3. Choose center points for the design
Center points are important in DoE because they give an indication if there is curvature in the data. Replicated center points are recommended. For example, a full factorial design in three parameters with three center points gives a total of 11 experiments.
4. Systematic variation of the parameters
Limiting values, high and low, should be used for each parameter. The high and low values should be combined in a way that makes the parameters independent (to be able to separate effects).
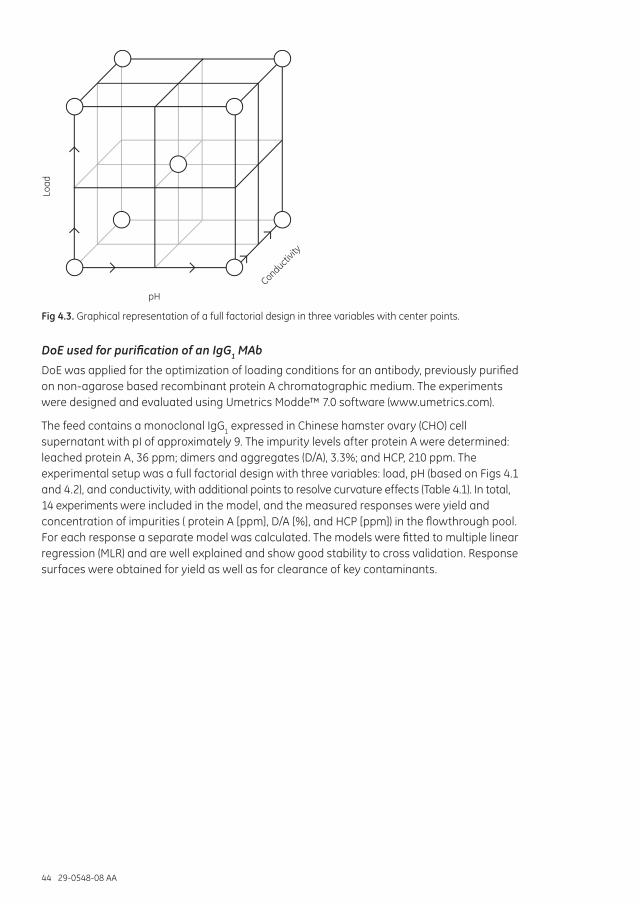
44 29-0548-08 AA
pH
Conductivit
y
Load
Fig 4.3. Graphical representation of a full factorial design in three variables with center points.
DoE used for purification of an IgG1 MAb
DoE was applied for the optimization of loading conditions for an antibody, previously purified on non-agarose based recombinant protein A chromatographic medium. The experiments were designed and evaluated using Umetrics Modde™ 7.0 software (www.umetrics.com).
The feed contains a monoclonal IgG1 expressed in Chinese hamster ovary (CHO) cell supernatant with pI of approximately 9. The impurity levels after protein A were determined: leached protein A, 36 ppm; dimers and aggregates (D/A), 3.3%; and HCP, 210 ppm. The experimental setup was a full factorial design with three variables: load, pH (based on Figs 4.1 and 4.2), and conductivity, with additional points to resolve curvature effects (Table 4.1). In total, 14 experiments were included in the model, and the measured responses were yield and concentration of impurities ( protein A [ppm], D/A [%], and HCP [ppm]) in the flowthrough pool. For each response a separate model was calculated. The models were fitted to multiple linear regression (MLR) and are well explained and show good stability to cross validation. Response surfaces were obtained for yield as well as for clearance of key contaminants.

29-0548-08 AA 45
Table 4.1. Design setup includes two center points (bold) and four additional points at pH 7 to resolve curvature effects
Load (mg MAb/mL) pH Conductivity (mS/cm)
75 6 2
300 6 2
75 8 2
300 8 2
75 6 15
300 6 15
75 8 15
300 8 15
187.5 7 8.5
187.5 7 8.5
75 7 15
300 7 15
187.5 7 2
187.5 7 15
ResultsParameters affecting the yield
The parameters that affect the yield are shown in the coefficient plot1 (Fig 4.4). The plot shows that high sample load, low pH, and high conductivity result in high yield. The interaction effects (load × pH, load × conductivity) are also significant for the yield response. The response surfaces (Fig 4.5) show that higher loads will give a larger pH window with yield > 90%.
1 The coefficient plot describes the impact of investigated parameters on the yield. In this experiment, load is positively correlated to the yield, implying that a higher load will give a higher yield; pH is negatively correlated to the yield, meaning that a lower pH will give a higher yield; and conductivity is positively correlated to yield, but to a smaller extent, meaning that a higher conductivity will give higher yield. The interaction effects that are present in the coefficient plot (load × pH, load × conductivity) mean that if pH is changed, the yield will not only change with the effect of pH but also with the effect of load at that specific pH. The same discussion can be applied to the load × conductivity interaction effect.
-4
-6
-8
-2
0
2
4
6
%
Load pH Cond Load × pH
Load ×Cond
Fig 4.4. Coefficient plot for the yield model.

46 29-0548-08 AA
77.3 100
150
200
6.0 6.5 7.0 7.5 pH
250
300 300
100
150
200
6.0 6.5 7.0 7.5 pH
250
95.6
90.4
85.2
80.0
74.8
91.1
86.5
81.9
100
150
200
6.0 6.5 7.0 7.5 pH
250 94.7
Cond = 15 mS/cm Cond = 8.5 mS/cm Cond = 2 mS/cm
90.5
86.3
82.1
Load
(mg/
mL)
Load
(mg/
mL)
Load
(mg/
mL)
300 95.7
Fig 4.5. Response surfaces for the yield model. Load versus pH at different conductivities, with yield expressed in percent (labels).
Parameters affecting the protein A clearance
The coefficient plot shows that a high pH will give good protein A clearance (Fig 4.6). The conductivity alone does not affect the response, but there is a significant interaction effect for pH × conductivity. If this term is high, the protein A clearance will be low. Load was not a significant factor for this response.
The response surfaces (Fig 4.7) show that high pH and low conductivity will give high protein A clearance.
-4
-5
-6
-2
-1
0
2
3
4
1
pH ×Cond
CondpH
-3
ppm
Fig 4.6. Coefficient plot for the Protein A clearance model.
4
2
8
6
10
6.0 6.5 7.0 7.5 8.0
pH
12
14
Con
d (m
S/cm
)
0
6
4 2
Fig 4.7. Response surfaces for the Protein A clearance model, conductivity versus pH. Protein A concentration expressed in ppm.

29-0548-08 AA 47
Parameters affecting D/A clearance
The coefficient plot shows that pH is the most important parameter and that high pH will give a high D/A clearance in the flowthrough pool (Fig 4.8). The load parameter is also significant, but very small. The load should be low to give high D/A clearance. There is a significant curvature effect assigned to pH. If pH is too high or too low, the clearance will be less efficient. The conductivity did not significantly affect D/A clearance.
The response curve (Fig 4.9) shows that the load has only a small effect on D/A clearance, so only pH needs to be considered.
-0.8-1.0-1.2-1.4
-0.4-0.20.00.2
pH × pHpHLoad
-0.6
0.40.60.81.0
%
Fig 4.8. Coefficient plot for the D/A clearance model.
100
150
200
250
300
Load
(mg/
mL)
3
2
0
1
6.0 6.5 7.0 7.5 8.0
pH
Fig 4.9. Response curve for the D/A clearance model, load versus pH. D/A concentration expressed in percent.
Parameters affecting HCP clearance
The coefficient plot (Fig 4.10) and response curves (Fig 4.11) show that low sample load, low conductivity, and high pH will give the best HCP clearance.

48 29-0548-08 AA
-3-4-5-6
-1012
Con
d
pH
Load
-2
3
45
ppm
Fig 4.10. Coefficient plot for the HCP clearance model.
2
6
10
6.0 6.5 7.0 7.5 pH
12
14
8
4
Load = 75 mg/mL
14.1
11.1
8.1
5.1
2
6
10
6.0 6.5 7.0 7.5 pH
12
14 14
8
4
Load = 187.5 mg/mL
16.1
13.1
10.1
7.1
2
6
10
6.0 6.5 7.0 7.5 pH
12
8
4
Load = 300 mg/mL
18.2
15.2
12.2
9.2
Con
d (m
S/cm
)
Con
d (m
S/cm
)
Con
d (m
S/cm
)
Fig 4.11. Response surfaces for the HCP clearance model, conductivity versus pH at different loads. HCP concentration is expressed in ppm.
Conclusions—optimal loading conditions and general trendsEach MAb is unique, and the level of contaminants varies between different cell lines and differences in previous purification steps. This implies that it may be difficult to predict optimal loading conditions. However, based on DoE performed with several different antibodies, some general trends have been identified (Fig 4.12):
• For best yield, load should be high, the pH low, and conductivity high.
• For the best D/A clearance, the pH should be high, while load and conductivity should be low. D/A clearance is typically less affected by conductivity than protein A and HCP clearance.
• For the best protein A and HCP clearance, the pH should be high and conductivity low.
Loading conditions will therefore be a compromise between conditions favoring yield and conditions favoring contaminant clearance. Optimal loading conditions will be a balance between load, pH, and conductivity. Consequently, for optimization of the loading step, all three parameters should be varied in the same experimental series.
Yield D/A
Con
duct
ivity
pH
Con
duct
ivity
pH
PrA HCP
Con
duct
ivity
pH
Con
duct
ivity
pH
Fig 4.12. General trends with respect to loading conditions for yield, D/A, and Protein A and HCP clearance.
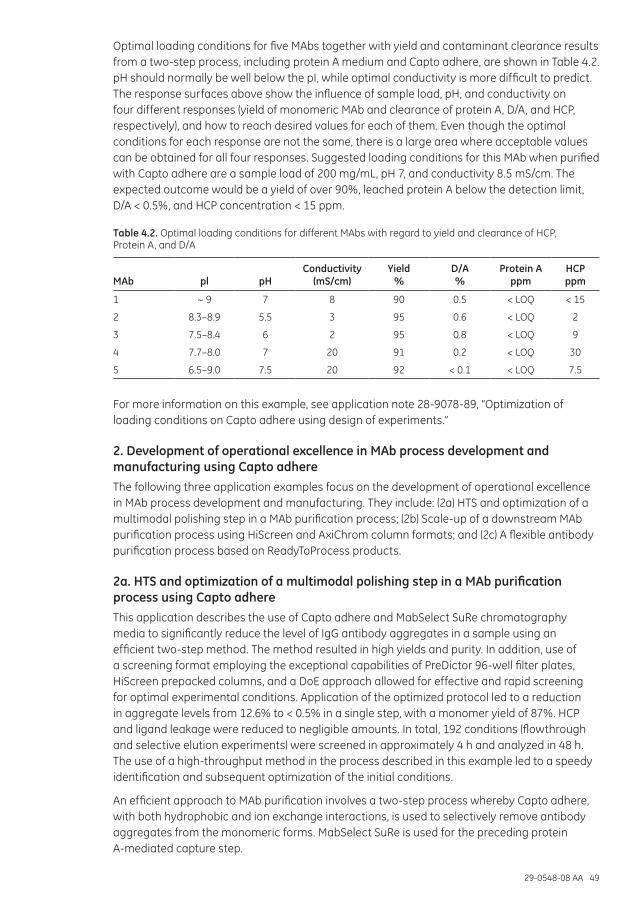
29-0548-08 AA 49
Optimal loading conditions for five MAbs together with yield and contaminant clearance results from a two-step process, including protein A medium and Capto adhere, are shown in Table 4.2. pH should normally be well below the pI, while optimal conductivity is more difficult to predict. The response surfaces above show the influence of sample load, pH, and conductivity on four different responses (yield of monomeric MAb and clearance of protein A, D/A, and HCP, respectively), and how to reach desired values for each of them. Even though the optimal conditions for each response are not the same, there is a large area where acceptable values can be obtained for all four responses. Suggested loading conditions for this MAb when purified with Capto adhere are a sample load of 200 mg/mL, pH 7, and conductivity 8.5 mS/cm. The expected outcome would be a yield of over 90%, leached protein A below the detection limit, D/A < 0.5%, and HCP concentration < 15 ppm.
Table 4.2. Optimal loading conditions for different MAbs with regard to yield and clearance of HCP, Protein A, and D/A
MAb pl pHConductivity
(mS/cm)Yield
%D/A %
Protein A ppm
HCP ppm
1 ~ 9 7 8 90 0.5 < LOQ < 15
2 8.3–8.9 5.5 3 95 0.6 < LOQ 2
3 7.5–8.4 6 2 95 0.8 < LOQ 9
4 7.7–8.0 7 20 91 0.2 < LOQ 30
5 6.5–9.0 7.5 20 92 < 0.1 < LOQ 7.5
For more information on this example, see application note 28-9078-89, “Optimization of loading conditions on Capto adhere using design of experiments.”
2. Development of operational excellence in MAb process development and manufacturing using Capto adhereThe following three application examples focus on the development of operational excellence in MAb process development and manufacturing. They include: (2a) HTS and optimization of a multimodal polishing step in a MAb purification process; (2b) Scale-up of a downstream MAb purification process using HiScreen and AxiChrom column formats; and (2c) A flexible antibody purification process based on ReadyToProcess products.
2a. HTS and optimization of a multimodal polishing step in a MAb purification process using Capto adhereThis application describes the use of Capto adhere and MabSelect SuRe chromatography media to significantly reduce the level of IgG antibody aggregates in a sample using an efficient two-step method. The method resulted in high yields and purity. In addition, use of a screening format employing the exceptional capabilities of PreDictor 96-well filter plates, HiScreen prepacked columns, and a DoE approach allowed for effective and rapid screening for optimal experimental conditions. Application of the optimized protocol led to a reduction in aggregate levels from 12.6% to < 0.5% in a single step, with a monomer yield of 87%. HCP and ligand leakage were reduced to negligible amounts. In total, 192 conditions (flowthrough and selective elution experiments) were screened in approximately 4 h and analyzed in 48 h. The use of a high-throughput method in the process described in this example led to a speedy identification and subsequent optimization of the initial conditions.
An efficient approach to MAb purification involves a two-step process whereby Capto adhere, with both hydrophobic and ion exchange interactions, is used to selectively remove antibody aggregates from the monomeric forms. MabSelect SuRe is used for the preceding protein A-mediated capture step.

50 29-0548-08 AA
Because the complexity of multimodal media requires a more thorough process optimization study in order to take full advantage of the outstanding potential of this technology, the development of efficient and rapid screening methods for optimal process conditions is critical. In the initial part of this study, PreDictor 96-well filter plates prefilled with Capto adhere were used to screen a large experimental space quickly. Promising results from the plate study were further optimized with HiScreen columns and a DoE approach to establish the final process conditions.
Materials and methodsLiquid handlingAll the experiments were performed with PreDictor plates containing 6 µL of Capto adhere in each well. The buffers were prepared in an automated Tecan™ Freedom EVO™-2 200 Robotic System, but procedures such as sample addition were performed manually. Liquid removal during equilibration of the media was performed in a vacuum manifold, and sample collection was performed by centrifugation (300 × g for 60 s).
Screening for initial conditionsThe MabSelect SuRe elution pool was used as the sample after buffer exchange on a HiPrep™ Desalting column. The final IgG concentrations used were 0.53, 2.65, or 5.3 mg/mL depending on the experiment. The antibody solution contained approximately 14% aggregates.
A 2× buffer stock solution was prepared for each experimental condition. The same volume of sample and buffer stock solution was then mixed and dispensed into each well of the PreDictor plate. The following parameters were tested in the initial screening phase: 50 mM sodium citrate pH 5.5 or 6.5; 50 or 450 mM NaCl; three different IgG concentrations (0.53, 2.65, and 5.3 mg/mL); and four different incubation times (2.5, 10, 30, and 60 min).
The final plate layout is shown in Figure 4.13. The following protocol was used:
1. The medium was equilibrated with 3 × 200 µL of buffer, and excess liquid was removed by vacuum.
2. The sample (200 µL) was added and incubated at four different incubation times (2.5, 10, 30, and 60 min) at room temperature on an orbital shaker at 1100 rpm.
3. After incubation, the flowthrough fraction was collected by centrifugation (300 × g for 60 s at room temperature) into PreDictor plates.
5.3 mg/mL 2.65 mg/mL 0.53 mg/mL
A
B
C
D
E
F
G
H
2.55.5450
2.55.550
2.56.5450
2.56.550
2.55.5450
2.55.550
2.56.5450
2.56.550
2.55.5450
2.55.550
2.56.5450
2.56.550
2.55.5450
2.55.550
2.56.5450
2.56.550
2.55.5450
2.55.550
2.56.5450
2.56.550
2.55.5450
2.55.550
2.56.5450
2.56.550
105.5450
105.550
106.5450
106.550
105.5450
105.550
106.5450
106.550
105.5450
105.550
106.5450
106.550
105.5450
105.550
106.5450
106.550
105.5450
105.550
106.5450
106.550
105.5450
105.550
106.5450
106.550
305.5450
305.550
306.5450
306.550
305.5450
305.550
306.5450
306.550
305.5450
305.550
306.5450
306.550
305.5450
305.550
306.5450
306.550
305.5450
305.550
306.5450
306.550
305.5450
305.550
306.5450
306.550
605.5450
605.550
606.5450
606.550
605.5450
605.550
606.5450
606.550
605.5450
605.550
606.5450
606.550
605.5450
605.550
606.5450
606.550
605.5450
605.550
606.5450
606.550
605.5450
605.550
606.5450
606.550
Time (min)pHNaCl (mM)
Time (min)pHNaCl (mM)
Time (min)pHNaCl (mM)
Time (min)pHNaCl (mM)
Time (min)pHNaCl (mM)
Time (min)pHNaCl (mM)
Time (min)pHNaCl (mM)
Time (min)pHNaCl (mM)
Fig 4.13. Plate layout of the initial screening experiments.
The starting material and flowthrough fractions were analyzed by GF with two Superdex™ 200 5/150 GL columns connected in series. Each sample was analyzed in 15 min.

29-0548-08 AA 51
Flowthrough experiments
Analysis of the initial screening conditions allowed selection of appropriate conditions for the flowthrough experiments (Fig 4.14). The final IgG concentration was 5.3 mg/mL, and the sample was incubated for 60 min. Sample and buffer handling were performed as described (see “Screening for initial conditions”). In these experiments, 96 different conditions were studied in one single plate as follows:
• 8 different pH levels with 50 mM sodium citrate (pH 4.0 to 6.0) or 50 mM sodium phosphate (pH 6.5 to 7.5)
• 12 different concentrations of NaCl (0 to 550 mM)
4.0
4.5
5.0
5.5
6.0
6.5
7.0
7.5
4.0
4.5
5.0
5.5
6.0
6.5
7.0
7.5
0NaCl (mM) 50 100 150 200 250 300 350 0400 450 500 550
4.0
4.5
5.0
5.5
6.0
6.5
7.0
7.5
4.0
4.5
5.0
5.5
6.0
6.5
7.0
7.5
4.0
4.5
5.0
5.5
6.0
6.5
7.0
7.5
4.0
4.5
5.0
5.5
6.0
6.5
7.0
7.5
4.0
4.5
5.0
5.5
6.0
6.5
7.0
7.5
4.0
4.5
5.0
5.5
6.0
6.5
7.0
7.5
4.0
4.5
5.0
5.5
6.0
6.5
7.0
7.5
4.0
4.5
5.0
5.5
6.0
6.5
7.0
7.5
4.0
4.5
5.0
5.5
6.0
6.5
7.0
7.5
4.0
4.5
5.0
5.5
6.0
6.5
7.0
7.5
CIT
RATE
PHO
SPH
ATE
Fig 4.14. Plate layout of the flowthrough experiments.
Apart from an incubation time of 60 min, the protocol for the flowthrough experiments was the same as described (see “Screening for initial conditions”).
Selective elution study
An elution study (Fig 4.15) was performed to improve the proportion of monomer yield. Two different binding conditions were investigated (500 mM NaCl, 50 mM sodium citrate, pH 4.5; and 50 mM NaCl, 50 mM sodium phosphate, pH 7), for both the sample solution and the wash buffer. Each elution step was performed with the same buffer species that was used in the binding step. The elution conditions were:
• pH 4.0 to 6.0 with 50 mM sodium citrate
• pH 6.0 to 7.0 with 50 mM sodium phosphate
• 0 to 550 mM NaCl

52 29-0548-08 AA
4.0
4.5
5.0
5.5
6.0
6.0
6.5
7.0
6.0
6.5
7.0
4.0
4.5
5.0
5.5
6.0
0NaCl (mM) 50 100 150 200 250 300 350 0400 450 500 550
4.0
4.5
5.0
5.5
6.0
4.0
4.5
5.0
5.5
6.0
4.0
4.5
5.0
5.5
6.0
4.0
4.5
5.0
5.5
6.0
4.0
4.5
5.0
5.5
6.0
4.0
4.5
5.0
5.5
6.0
4.0
4.5
5.0
5.5
6.0
4.0
4.5
5.0
5.5
6.0
4.0
4.5
5.0
5.5
6.0
4.0
4.5
5.0
5.5
6.0
CIT
RATE
PHO
SPH
ATE
6.0
6.5
7.0
6.0
6.5
7.0
6.0
6.5
7.0
6.0
6.5
7.0
6.0
6.5
7.0
6.0
6.5
7.0
6.0
6.5
7.0
6.0
6.5
7.0
6.0
6.5
7.0
6.0
6.5
7.0
Fig 4.15. Plate layout of the selective elution study.
Briefly, the following protocol was used:
1. The medium was equilibrated with 3 × 200 µL of buffer, and excess liquid was removed by vacuum filtration.
2. The sample (200 µL) was added to each well. The plate was incubated at room temperature on an orbital shaker at 1100 rpm for 60 min followed by centrifugation (300 × g for 60 s at room temperature) into an empty 96-well plate.
3. Each well was washed with 2 × 200 µL of equilibration buffer.
4. Elution was performed with 3 × 200 µL of elution buffer.
Column optimization with a factorial design
The MODDE software v8 (Umetrics) was used to set up a Central Composite Face (CCF) design with a response surface modeling (RSM) objective. This resulted in 26 design runs plus replicated center points. The factors investigated are summarized in Table 4.3.
Table 4.3. Factors investigated in the optimization study
Aggregates 9% to 14%
Concentration 5 to 15 mg/mL
Load 60 to 100 mg/mL
Elution pH 6.1 to 6.5
NaCl for elution 150 to 450 mM
Loading was carried out according to the optimal conditions discovered in the screening phase. The pH and NaCl concentrations in Table 4.3 refer to the elution conditions from the column. The residence time was 5 min throughout the entire study. The starting IgG sample for this study consisted of two MabSelect SuRe elution pools containing 9% and 14% aggregates, respectively. The center points were created by mixing equal amounts of the two samples to produce a final sample containing 11.5% aggregates. A HiScreen Capto adhere column (4.7 mL) was used for this run. A freshly produced IgG sample containing 12.6% aggregates was used for the column verification experiment on a 1 mL HiTrap Capto adhere column.
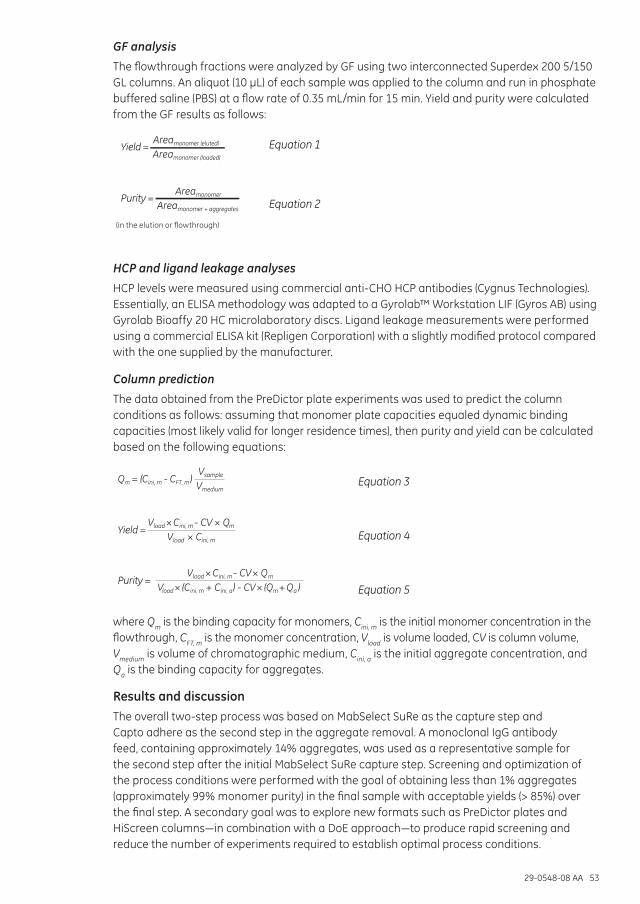
29-0548-08 AA 53
GF analysis
The flowthrough fractions were analyzed by GF using two interconnected Superdex 200 5/150 GL columns. An aliquot (10 µL) of each sample was applied to the column and run in phosphate buffered saline (PBS) at a flow rate of 0.35 mL/min for 15 min. Yield and purity were calculated from the GF results as follows:
Yield = Areamonomer (eluted)
Areamonomer (loaded)
Purity = Areamonomer
Areamonomer + aggregates
(in the elution or fl owthrough)
Equation 1Yield = Areamonomer (eluted)
Areamonomer (loaded)
Purity = Areamonomer
Areamonomer + aggregates
(in the elution or fl owthrough)
Equation 2
HCP and ligand leakage analyses
HCP levels were measured using commercial anti-CHO HCP antibodies (Cygnus Technologies). Essentially, an ELISA methodology was adapted to a Gyrolab™ Workstation LIF (Gyros AB) using Gyrolab Bioaffy 20 HC microlaboratory discs. Ligand leakage measurements were performed using a commercial ELISA kit (Repligen Corporation) with a slightly modified protocol compared with the one supplied by the manufacturer.
Column prediction
The data obtained from the PreDictor plate experiments was used to predict the column conditions as follows: assuming that monomer plate capacities equaled dynamic binding capacities (most likely valid for longer residence times), then purity and yield can be calculated based on the following equations:
Equation 3
Equation 4
Equation 5
Qm = (Cini, m - CFT, m)Vsample
Vmedium
Yield =Vload × Cini, m - CV × Qm
Vload × Cini, m
Purity =Vload × Cini, m - CV × Qm
Vload × (Cini, m + Cini, a ) - CV × (Qm + Qa )
where Qm is the binding capacity for monomers, Cini, m is the initial monomer concentration in the flowthrough, CFT, m is the monomer concentration, Vload is volume loaded, CV is column volume, Vmedium is volume of chromatographic medium, Cini, a is the initial aggregate concentration, and Qa is the binding capacity for aggregates.
Results and discussionThe overall two-step process was based on MabSelect SuRe as the capture step and Capto adhere as the second step in the aggregate removal. A monoclonal IgG antibody feed, containing approximately 14% aggregates, was used as a representative sample for the second step after the initial MabSelect SuRe capture step. Screening and optimization of the process conditions were performed with the goal of obtaining less than 1% aggregates (approximately 99% monomer purity) in the final sample with acceptable yields (> 85%) over the final step. A secondary goal was to explore new formats such as PreDictor plates and HiScreen columns—in combination with a DoE approach—to produce rapid screening and reduce the number of experiments required to establish optimal process conditions.

54 29-0548-08 AA
Screening for initial conditions with PreDictor plates
One of the goals of the initial screening phase was to determine the incubation time required for all the components to reach a state of equilibrium so that the binding properties of both monomers and aggregates can be estimated (Fig 4.16). Adsorption was completed after approximately 10 min and 30 min for the monomer and aggregate species, respectively. The aggregates produced slower kinetics, so in order to ascertain complete binding, an incubation time of 60 min was chosen for the remaining experiments.
50
60
40
30
90
100
80
70
20
10
Rem
aini
ng d
imer
in s
olut
ion
(%)
00 10 3020 40 50 60 70
Incubation time (min)
50
60
40
30
90
100
80
70
20
10
Rem
aini
ng m
onom
er in
sol
utio
n (%
)
00 10 3020 40 50 60 70
Incubation time (min)
(B)
(A)
Fig 4.16. Adsorption curves of (A) monomer and (B) aggregates. This shows the remaining monomer and aggregate concentrations in the flowthrough fractions under the investigated conditions of antibody amounts, NaCl concentrations, and pH. Legends correspond to protein concentration (mg/mL), pH, and NaCl concentration (mM).

29-0548-08 AA 55
Flowthrough experiments with PreDictor plates
An IgG sample containing 14% aggregates was used. After applying the sample, the flowthrough fractions were subjected to GF analysis. The capacities for monomer and aggregate IgG (Fig 4.17) were calculated (Equation 3). The capacity for IgG monomers exceeded that of aggregates under all the conditions tested, which implied that the removal of aggregates would result in the inevitable loss of some monomer IgG.
(B)
(A)
0 50 100 150 200 250 300 350 400 450 500 5504.0
5.0
6.0
7.00
5
10
15
20
25
30
35
40
45
pH
Mon
omer
cap
acity
(mg/
mL)
NaCl concentration (mM)
0 50 100 150 200 250 300 350 400 450 500 5504.0
5.0
6.0
7.00
2
4
6
8
10
12
14
16
pH
Aggr
egat
es c
apac
ity (m
g/m
L)
NaCl concentration (mM)
40–45
35–40
30–35
25–30
20–25
15–20
10–15
5–10
0–5
14–16
12–14
10–12
8–10
6–8
4–6
2–4
0–2
Fig 4.17. (A) Monomer and (B) aggregate capacities determined from the PreDictor plate experiments.
Column prediction
Data from the flowthrough experiments and the application of Equations 3, 4, and 5 were used to predict column performance. In the example shown in Figure 4.18, a prediction based on a CV of 10 mL and a sample load of 130 mg/mL produced > 98% monomer and a yield of 60% to 65%. A yield as low as that is not feasible for a large-scale process, so a selective elution study was used instead.

56 29-0548-08 AA
9593
92
91
9496
9798
> 60%> 65%> 70%> 75%> 80%> 85%
Yield
6.0
5.5
5.0
7.5
7.0
6.5
4.5
4.00 400350 500 55045050 100 150 200 250 300
pH
NaCl concentration (mM)
Highest purityLoad = 130 mg/mL
Fig 4.18. Column prediction of purity (iso-lines) and yield (color map) at a sample load of 130 mg/mL.
Selective elution experiments with PreDictor plates
An elution profile (Fig 4.19) was created from the difference in adjacent peak areas (e.g., the area for a peak at 450 mM was subtracted from that at 500 mM NaCl). The greatest IgG monomer peak area occurred at the lowest pH of 6.0 and a NaCl concentration of 250 to 300 mM. This elution pool contained negligible amounts of IgG aggregates.
50 100 150 200 250 300 350 400 450 500 550
6.06.5
7.0
20
40
60
0
80
100
120
pH
Area
(mAU
× m
L)
NaCl concentration (mM)
50 100 150 200 250 300 350 400 450 500 550
6.06.5
7.0
20
40
60
0
80
100
120
pH
Area
(mAU
× m
L)
NaCl concentration (mM)
(A)
(B)
Fig 4.19. (A) Monomer and (B) aggregate elution profiles based on the data from PreDictor plates.
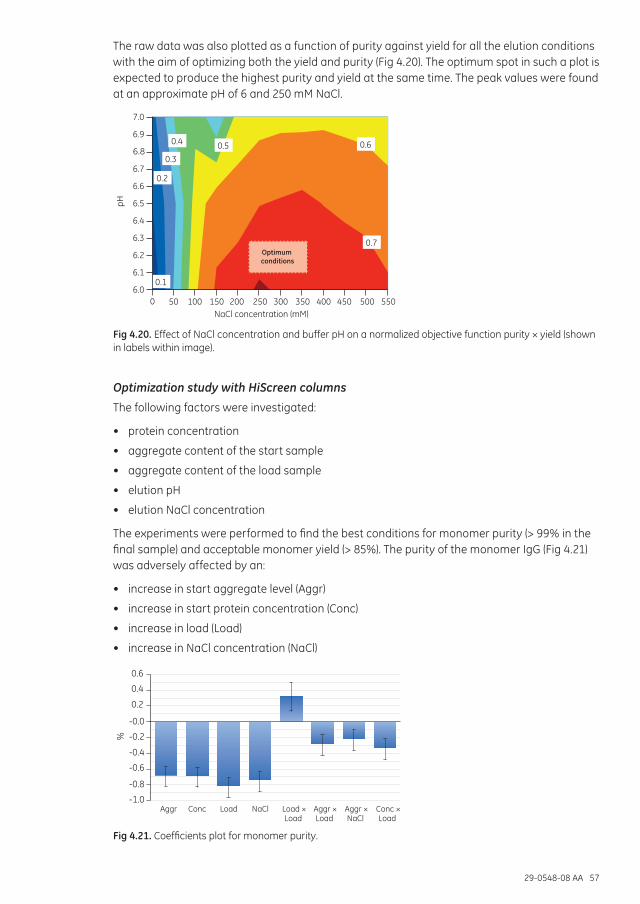
29-0548-08 AA 57
The raw data was also plotted as a function of purity against yield for all the elution conditions with the aim of optimizing both the yield and purity (Fig 4.20). The optimum spot in such a plot is expected to produce the highest purity and yield at the same time. The peak values were found at an approximate pH of 6 and 250 mM NaCl.
0.7
0.60.50.4
0.3
0.2
0.1
6.4
6.3
6.2
6.7
6.6
6.5
7.0
6.9
6.8
6.1
6.00 400350 500 55045050 100 150 200 250 300
pH
Optimum conditions
NaCl concentration (mM)
Fig 4.20. Effect of NaCl concentration and buffer pH on a normalized objective function purity × yield (shown in labels within image).
Optimization study with HiScreen columns
The following factors were investigated:
• protein concentration
• aggregate content of the start sample
• aggregate content of the load sample
• elution pH
• elution NaCl concentration
The experiments were performed to find the best conditions for monomer purity (> 99% in the final sample) and acceptable monomer yield (> 85%). The purity of the monomer IgG (Fig 4.21) was adversely affected by an:
• increase in start aggregate level (Aggr)
• increase in start protein concentration (Conc)
• increase in load (Load)
• increase in NaCl concentration (NaCl)
%
-0.8
-1.0
-0.4
-0.6
-0.0
-0.2
0.2
0.6
0.4
Aggr Conc Load NaCl Load ×Load
Aggr ×Load
Aggr ×NaCl
Conc ×Load
Fig 4.21. Coefficients plot for monomer purity.
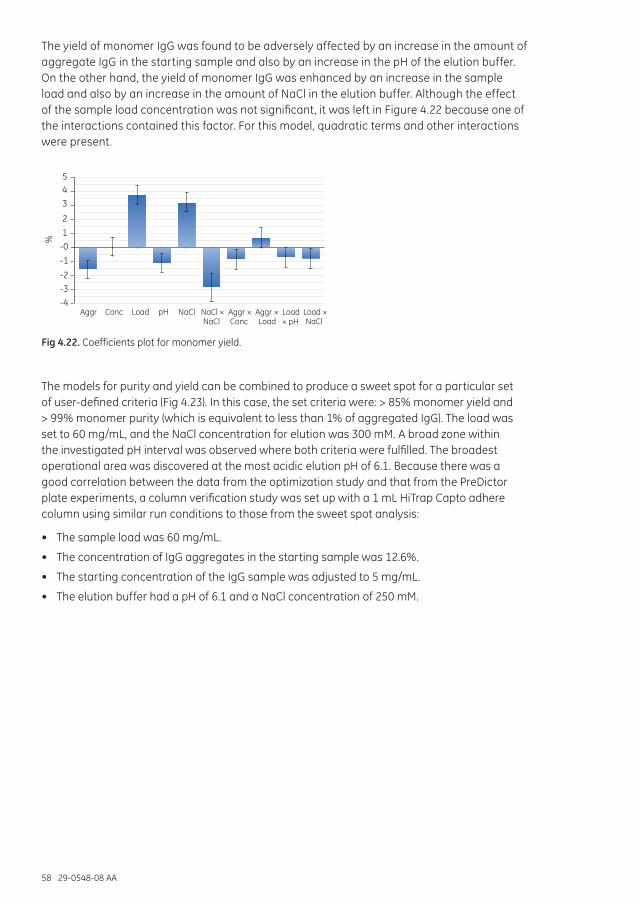
58 29-0548-08 AA
The yield of monomer IgG was found to be adversely affected by an increase in the amount of aggregate IgG in the starting sample and also by an increase in the pH of the elution buffer. On the other hand, the yield of monomer IgG was enhanced by an increase in the sample load and also by an increase in the amount of NaCl in the elution buffer. Although the effect of the sample load concentration was not significant, it was left in Figure 4.22 because one of the interactions contained this factor. For this model, quadratic terms and other interactions were present.
%
-3-4
-1
-2
1-0
2
45
3
Aggr Conc Load NaCl NaCl ×NaCl
Aggr ×Conc
Aggr ×Load
Load ×NaCl
Load × pH
pH
Fig 4.22. Coefficients plot for monomer yield.
The models for purity and yield can be combined to produce a sweet spot for a particular set of user-defined criteria (Fig 4.23). In this case, the set criteria were: > 85% monomer yield and > 99% monomer purity (which is equivalent to less than 1% of aggregated IgG). The load was set to 60 mg/mL, and the NaCl concentration for elution was 300 mM. A broad zone within the investigated pH interval was observed where both criteria were fulfilled. The broadest operational area was discovered at the most acidic elution pH of 6.1. Because there was a good correlation between the data from the optimization study and that from the PreDictor plate experiments, a column verification study was set up with a 1 mL HiTrap Capto adhere column using similar run conditions to those from the sweet spot analysis:
• The sample load was 60 mg/mL.
• The concentration of IgG aggregates in the starting sample was 12.6%.
• The starting concentration of the IgG sample was adjusted to 5 mg/mL.
• The elution buffer had a pH of 6.1 and a NaCl concentration of 250 mM.

29-0548-08 AA 59
12
13
987
1415
11
10
65
9 141310 11 12
Con
cent
ratio
n (m
g/m
L)
Aggregates (%)
Aggregates (%)
12
13
987
1415
11
10
65
9 141310 11 12
Con
cent
ratio
n (m
g/m
L)
Aggregates (%)
12
13
987
1415
11
10
65
9 141310 11 12
Con
cent
ratio
n (m
g/m
L)
2 of 2 criteria met (sweet spot)1 of 2 criteria met (sweet spot)
2 of 2 criteria met (sweet spot)1 of 2 criteria met (sweet spot)
2 of 2 criteria met (sweet spot)1 of 2 criteria met (sweet spot)
(A)
(B)
(C)
Fig 4.23. A sweet spot plot for IgG monomer yield and purity. The conditions for these plots were a sample load of 60 mg/mL media and elution with 300 mM of NaCl at the three different pH levels of: (A) 6.1; (B) 6.3; and (C) 6.5.
The column verification study (Fig 4.24) produced an eluted IgG monomer yield of 87%, which was a significant improvement on the 60% to 65% yield obtained from the PreDictor plate experiments in which only the flowthrough was included in the process step. The purity level (99.5%) of the eluted IgG monomer met the sweet spot analysis criteria of > 99.0% (Fig 4.25). In addition, the HCP content of the eluted IgG monomer was reduced from 131 ng/mL (26 ppm) to a negligible amount of < 4.6 ng/mL. MabSelect SuRe ligand leakage was also reduced from 10 ng/mL (2 ppm) to a negligible amount of < 3 ng/mL.
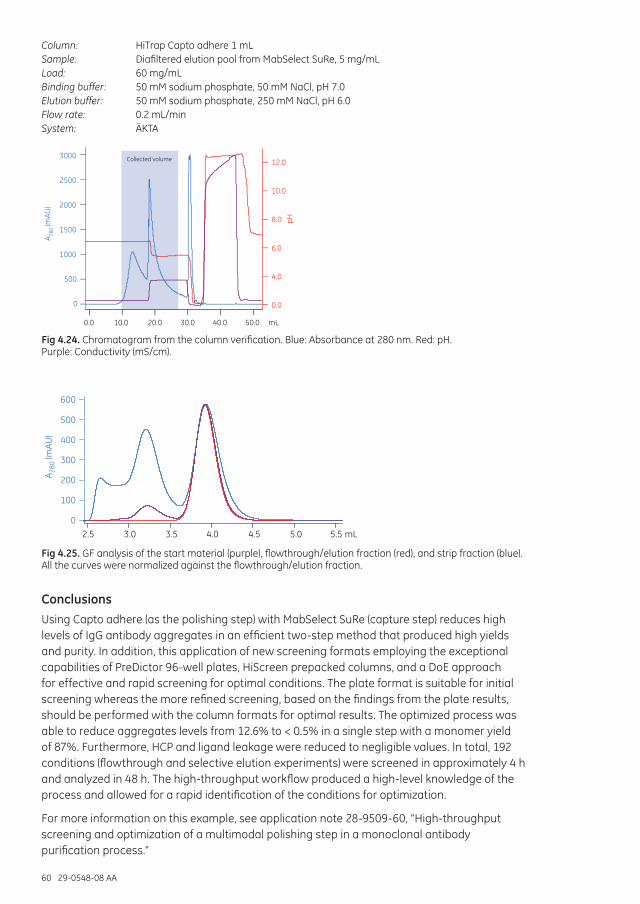
60 29-0548-08 AA
Column: HiTrap Capto adhere 1 mLSample: Diafiltered elution pool from MabSelect SuRe, 5 mg/mLLoad: 60 mg/mLBinding buffer: 50 mM sodium phosphate, 50 mM NaCl, pH 7.0Elution buffer: 50 mM sodium phosphate, 250 mM NaCl, pH 6.0Flow rate: 0.2 mL/minSystem: ÄKTA
3000
2500
2000
1500
1000
500
0
A 280
(mAU
)
12.0
10.0
8.0
6.0
4.0
0.0
0.0 10.0 20.0 30.0 40.0 50.0 mL
pH
Collected volume
Fig 4.24. Chromatogram from the column verification. Blue: Absorbance at 280 nm. Red: pH. Purple: Conductivity (mS/cm).
500
600
400
300
200
100
0
2.5 3.0 3.5 4.0 4.5 5.0 5.5 mL
A 280
(mAU
)
Fig 4.25. GF analysis of the start material (purple), flowthrough/elution fraction (red), and strip fraction (blue). All the curves were normalized against the flowthrough/elution fraction.
ConclusionsUsing Capto adhere (as the polishing step) with MabSelect SuRe (capture step) reduces high levels of IgG antibody aggregates in an efficient two-step method that produced high yields and purity. In addition, this application of new screening formats employing the exceptional capabilities of PreDictor 96-well plates, HiScreen prepacked columns, and a DoE approach for effective and rapid screening for optimal conditions. The plate format is suitable for initial screening whereas the more refined screening, based on the findings from the plate results, should be performed with the column formats for optimal results. The optimized process was able to reduce aggregates levels from 12.6% to < 0.5% in a single step with a monomer yield of 87%. Furthermore, HCP and ligand leakage were reduced to negligible values. In total, 192 conditions (flowthrough and selective elution experiments) were screened in approximately 4 h and analyzed in 48 h. The high-throughput workflow produced a high-level knowledge of the process and allowed for a rapid identification of the conditions for optimization.
For more information on this example, see application note 28-9509-60, “High-throughput screening and optimization of a multimodal polishing step in a monoclonal antibody purification process.”
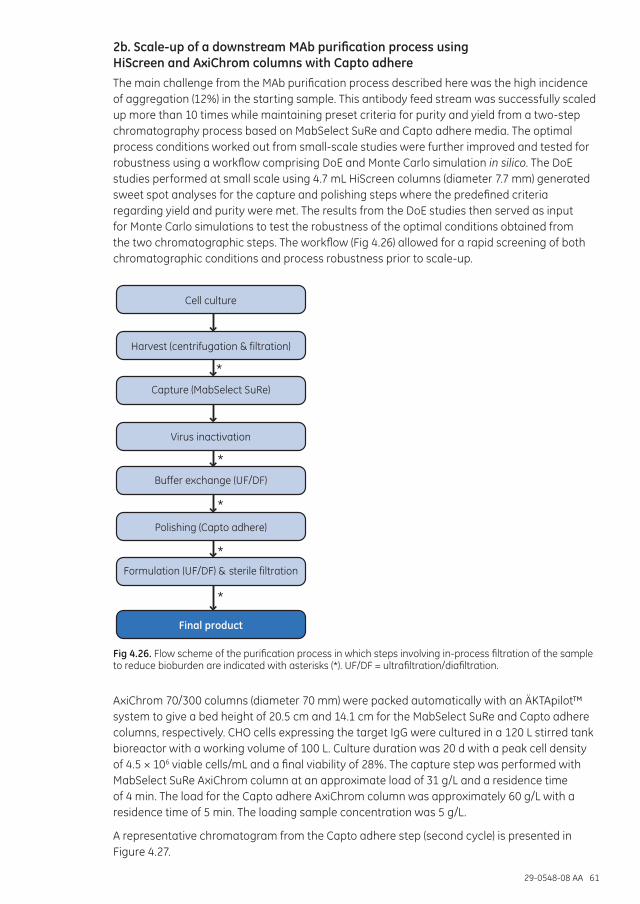
29-0548-08 AA 61
2b. Scale-up of a downstream MAb purification process using HiScreen and AxiChrom columns with Capto adhereThe main challenge from the MAb purification process described here was the high incidence of aggregation (12%) in the starting sample. This antibody feed stream was successfully scaled up more than 10 times while maintaining preset criteria for purity and yield from a two-step chromatography process based on MabSelect SuRe and Capto adhere media. The optimal process conditions worked out from small-scale studies were further improved and tested for robustness using a workflow comprising DoE and Monte Carlo simulation in silico. The DoE studies performed at small scale using 4.7 mL HiScreen columns (diameter 7.7 mm) generated sweet spot analyses for the capture and polishing steps where the predefined criteria regarding yield and purity were met. The results from the DoE studies then served as input for Monte Carlo simulations to test the robustness of the optimal conditions obtained from the two chromatographic steps. The workflow (Fig 4.26) allowed for a rapid screening of both chromatographic conditions and process robustness prior to scale-up.
Final product
Formulation (UF/DF) & sterile filtration
Polishing (Capto adhere)
Buffer exchange (UF/DF)
Virus inactivation
Capture (MabSelect SuRe)
Harvest (centrifugation & filtration)
Cell culture
Fig 4.26. Flow scheme of the purification process in which steps involving in-process filtration of the sample to reduce bioburden are indicated with asterisks (*). UF/DF = ultrafiltration/diafiltration.
AxiChrom 70/300 columns (diameter 70 mm) were packed automatically with an ÄKTApilot™ system to give a bed height of 20.5 cm and 14.1 cm for the MabSelect SuRe and Capto adhere columns, respectively. CHO cells expressing the target IgG were cultured in a 120 L stirred tank bioreactor with a working volume of 100 L. Culture duration was 20 d with a peak cell density of 4.5 × 10⁶ viable cells/mL and a final viability of 28%. The capture step was performed with MabSelect SuRe AxiChrom column at an approximate load of 31 g/L and a residence time of 4 min. The load for the Capto adhere AxiChrom column was approximately 60 g/L with a residence time of 5 min. The loading sample concentration was 5 g/L.
A representative chromatogram from the Capto adhere step (second cycle) is presented in Figure 4.27.

62 29-0548-08 AA
Column: AxiChrom 70/300 (14.1 cm bed height)Sample: 60 g/L of diafiltrated elution pool from the MabSelect SuRe stepBinding buffer: 50 mM sodium phosphate, 50 mM NaCl, pH 7.0Elution buffer: 50 mM sodium phosphate, 250 mM NaCl, pH 6.1Flow rate: 109 mL/minSystem: ÄKTApilot
3500
3000
2500
2000
1500
1000
500
015 00010 0005000
Volume (mL)
Collected fraction
Wash
Elution Strip Cl
A(m
AU)
280
Fig 4.27. Chromatogram from the Capto adhere step. A280 trace is shown in blue, pH in green, and conductivity in purple.
In the scaled-up process, the starting aggregate concentration of 12% was reduced to 0.6% in a single step (data not shown). The monomer yield of 86% was relatively high for a sample containing such a high level of aggregates.
The results for the overall scaled-up purification are shown in Table 4.3.
Table 4.3. Summary of monomer yield, aggregate content, HCP reduction, and ligand leakage in the scale-up process
Process step HCP (ppm) Ligand (ppm) Aggregate content (%)
Yield (%)
Fermentation 37 000 N/A3 12
Harvest 37 000 N/A 12 100
MabSelect SuRe (4 cycles) 241 1.9 121 96.21
Buffer exchange 25 1.9 12 97.8
Capto adhere < LOQ2 < LOQ2 0.64 86.03
Formulation and sterile filtration 1.0 < LOQ2 0.6 102
Total yield: 80.8
1 Average of 4 cycles.2 LOQ = level of quantitiation (4.6 ng/mL for HCP, 3 ng/mL for ligand).3 Not applicable.4 Average of 2 cycles.
For more information on this example, see application note 28-9403-49, “Scale-up of a downstream monoclonal antibody purification process using HiScreen and AxiChrom columns.”
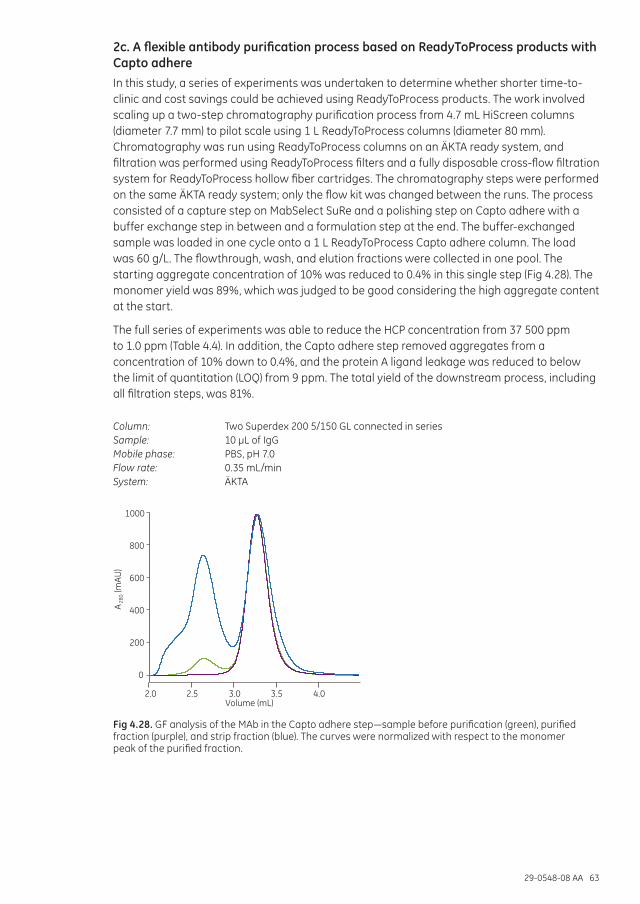
29-0548-08 AA 63
2c. A flexible antibody purification process based on ReadyToProcess products with Capto adhereIn this study, a series of experiments was undertaken to determine whether shorter time-to-clinic and cost savings could be achieved using ReadyToProcess products. The work involved scaling up a two-step chromatography purification process from 4.7 mL HiScreen columns (diameter 7.7 mm) to pilot scale using 1 L ReadyToProcess columns (diameter 80 mm). Chromatography was run using ReadyToProcess columns on an ÄKTA ready system, and filtration was performed using ReadyToProcess filters and a fully disposable cross-flow filtration system for ReadyToProcess hollow fiber cartridges. The chromatography steps were performed on the same ÄKTA ready system; only the flow kit was changed between the runs. The process consisted of a capture step on MabSelect SuRe and a polishing step on Capto adhere with a buffer exchange step in between and a formulation step at the end. The buffer-exchanged sample was loaded in one cycle onto a 1 L ReadyToProcess Capto adhere column. The load was 60 g/L. The flowthrough, wash, and elution fractions were collected in one pool. The starting aggregate concentration of 10% was reduced to 0.4% in this single step (Fig 4.28). The monomer yield was 89%, which was judged to be good considering the high aggregate content at the start.
The full series of experiments was able to reduce the HCP concentration from 37 500 ppm to 1.0 ppm (Table 4.4). In addition, the Capto adhere step removed aggregates from a concentration of 10% down to 0.4%, and the protein A ligand leakage was reduced to below the limit of quantitation (LOQ) from 9 ppm. The total yield of the downstream process, including all filtration steps, was 81%.
Column: Two Superdex 200 5/150 GL connected in seriesSample: 10 µL of IgGMobile phase: PBS, pH 7.0Flow rate: 0.35 mL/minSystem: ÄKTA
1000
800
600
400
200
0
2.0 2.5 3.0 3.5Volume (mL)
4.0
A(m
AU)
280
Fig 4.28. GF analysis of the MAb in the Capto adhere step—sample before purification (green), purified fraction (purple), and strip fraction (blue). The curves were normalized with respect to the monomer peak of the purified fraction.
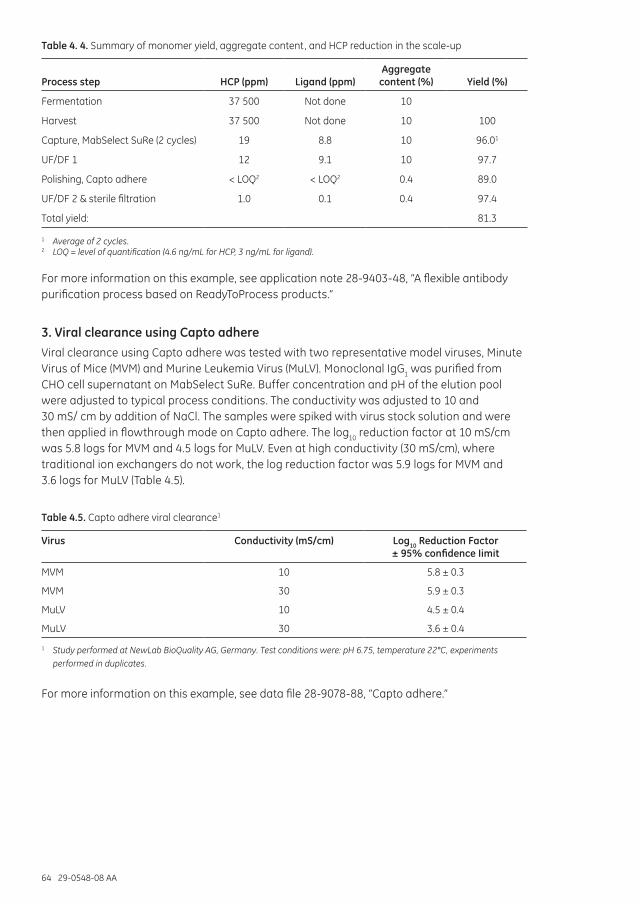
64 29-0548-08 AA
Table 4. 4. Summary of monomer yield, aggregate content, and HCP reduction in the scale-up
Process step HCP (ppm) Ligand (ppm)Aggregate
content (%) Yield (%)
Fermentation 37 500 Not done 10
Harvest 37 500 Not done 10 100
Capture, MabSelect SuRe (2 cycles) 19 8.8 10 96.01
UF/DF 1 12 9.1 10 97.7
Polishing, Capto adhere < LOQ2 < LOQ2 0.4 89.0
UF/DF 2 & sterile filtration 1.0 0.1 0.4 97.4
Total yield: 81.3
1 Average of 2 cycles.2 LOQ = level of quantification (4.6 ng/mL for HCP, 3 ng/mL for ligand).
For more information on this example, see application note 28-9403-48, “A flexible antibody purification process based on ReadyToProcess products.”
3. Viral clearance using Capto adhereViral clearance using Capto adhere was tested with two representative model viruses, Minute Virus of Mice (MVM) and Murine Leukemia Virus (MuLV). Monoclonal IgG1 was purified from CHO cell supernatant on MabSelect SuRe. Buffer concentration and pH of the elution pool were adjusted to typical process conditions. The conductivity was adjusted to 10 and 30 mS/ cm by addition of NaCl. The samples were spiked with virus stock solution and were then applied in flowthrough mode on Capto adhere. The log10 reduction factor at 10 mS/cm was 5.8 logs for MVM and 4.5 logs for MuLV. Even at high conductivity (30 mS/cm), where traditional ion exchangers do not work, the log reduction factor was 5.9 logs for MVM and 3.6 logs for MuLV (Table 4.5).
Table 4.5. Capto adhere viral clearance1
Virus Conductivity (mS/cm) Log10 Reduction Factor ± 95% confidence Iimit
MVM 10 5.8 ± 0.3
MVM 30 5.9 ± 0.3
MuLV 10 4.5 ± 0.4
MuLV 30 3.6 ± 0.4
1 Study performed at NewLab BioQuality AG, Germany. Test conditions were: pH 6.75, temperature 22°C, experiments performed in duplicates.
For more information on this example, see data file 28-9078-88, “Capto adhere.”
29-0548-08 AA 65
Capto adhere ImpRes applications1. Polishing of MAbs using Capto adhere ImpRes in bind/elute modeIn these studies, the binding capacity for MAbs and the efficiency in the clearance of impurities using Capto adhere ImpRes in bind/elute mode was evaluated. The studies present results from optimization of the loading conditions using the DoE approach. The effects of buffer, pH, conductivity, and sample load were investigated. The studies include measurement of static and dynamic binding capacities (SBC and DBC, respectively) at various binding conditions, as well as screening and optimization of gradient- and step-elution conditions.
Two different MAbs were studied. The results showed high yields of monomeric MAb, as well as good clearance of aggregates, HCP, and leached protein A.
Materials and methodsStart material
The two MAbs used in this study were initially purified from CHO cell supernatant by protein A affinity chromatography. Some characteristics of the MAbs are shown in Table 4.6.
Table 4.6. Characteristics of the two antibodies used in the study
Antibody pI Aggregate content (%)
DBC 10% (mg/mL)1
Capto adhere ImpRes Capto adhere
MAb A 7.3 2.5 71 56
MAb B > 7.0 2.4 44 36
1 DBC at 10% breakthrough (DBC 10%) for various antibodies measured at 4 min residence time.
Determination of SBC
SBC was determined in 6 µL PreDictor 96-well filter plates. Equilibration of wells in the filter plates was performed by addition of 200 µL of loading buffer per well followed by agitation at 1100 rpm for 1 min, after which the buffer was removed by vacuum extraction. The equilibration step was performed three times. MAb solution (200 µL volume, 4 mg/mL sample load, corresponding to 133 mg MAb/mL chromatography medium) was added to each well followed by agitation for 90 min. Unbound material (flowthrough fraction) was removed by centrifugation for 3 min, and MAb concentration was determined by measurement of absorbance at 280 nm. SBC was calculated according to:
Equation 6SBC = (Cini - CFT)
)
Vload
Vmedium
DBC =X%
Vload × Cini
Yield (%) = (C + C× 100eluate1 eluate2 + Celuate3 Veluate
- VO)X% CO (V
VC
where Vload = load volume, Vmedium = medium volume in each well, Cini = MAb concentration in the sample, and CFT = MAb concentration in the flowthrough fraction.
Determination of DBC
DBC was determined by frontal analysis using an ÄKTA chromatography system. The UV absorbance at 280 nm was used for determination of breakthrough. Before frontal analysis, the MAb solution was injected bypassing the column to obtain a maximum absorbance value. DBC was then calculated according to:
Equation 7
SBC = (Cini - CFT)
)
Vload
Vmedium
DBC =X%
Vload × Cini
Yield (%) = (C + C× 100eluate1 eluate2 + Celuate3 Veluate
- VO)X% CO (V
VC
where C0 = MAb concentration in the sample (mg/mL), VX% = load volume (mL) at x% breakthrough, V0 = void volume (mL), and Vc = volumetric bed volume (mL).

66 29-0548-08 AA
Screening of elution conditions
Measurement of yield at different elution conditions was performed in PreDictor 96-well filter plates. Equilibration of wells in the filter plates was performed by addition of 200 µL of loading buffer per well followed by agitation at 1100 rpm for 1 min, after which the buffer was removed by centrifugation. The equilibration step was performed three times. MAb solution (200 µL, 2.8 mg/mL, corresponding to 93 mg MAb/mL medium) was added to each well followed by agitation for 60 min. Unbound material was removed by centrifugation. Elution of bound material was then performed by addition of 200 µL of elution buffer/well; the elution step was performed three times. MAb concentration was determined by measurement of absorbance at 280 nm.
Yield was calculated according to:
Equation 8
SBC = (Cini - CFT)
)
Vload
Vmedium
DBC =X%
Vload × Cini
Yield (%) = (C + C× 100eluate1 eluate2 + Celuate3 Veluate
- VO)X% CO (V
VC
where Veluate = eluate volume, Celuate 1, 2, 3 = MAb concentration in eluates 1 to 3, Vload = load volume, and Cini = MAb concentration in MAb solution.
Optimization of step elution conditions
Conditions for step elution were investigated in a packed column using ÄKTA pure chromatography system, DoE, and scouting functionalities included in UNICORN™ 6.3.
Determination of aggregates and aggregate clearance
Fractions from the chromatographic runs were collected and analyzed by analytical GF on a Superdex 200 5/150 GL column. The peaks were integrated, and the D/A concentrations (in percent) were estimated. Cumulated yield of monomers was plotted against cumulated aggregates (Fig 4.29).
2000
1500
1000
500
0
0 5 10 15 20 25 30 35 40
A 280
nm (m
AU)
Volume (ml)
100
80
60
40
20
00 2 4 6 8
Cum
ulat
ed m
onom
er y
ield
(%)
Cumulated aggregates (%)
Sec
Fig 4.29. Evaluation of gradient elution was performed by GF. The figure shows an example of the resulting plot of cumulated yield of monomers vs cumulated aggregates derived from the GF analysis.
Protein A and HCP ELISA
The protein A concentration in the start materials and flowthrough fractions was determined by Protein A ELISA kit (Repligen). HCP concentration was determined by HCP ELISA (Cygnus Technologies).

29-0548-08 AA 67
Results and discussionCase study, MAb A
The case study with MAb A shows a suggested workflow for method development including screening of conditions for SBC and DBC, screening of elution conditions, and optimization of conditions for step elution.
SBC
To find optimal binding capacity for MAb A, SBC was determined in 6 µL PreDictor 96-well filter plates. Binding pH was varied between pH 4.0 and 8.02,3 and the salt concentration from 0 to 500 mM NaCl. All samples and buffers were prepared automatically using a Tecan robot. The results show that the highest SBC was obtained at high pH and low salt concentration (Fig 4.30, orange region). Based on these results, a narrower range of pH and NaCl concentration was used for further investigation of conditions for DBC.
2 Binding buffers were citrate, pH 4; acetate, pH 4.6 and 5.7; phosphate, pH 5.7, 6.3, and 6.9; and Tris, pH 7.4 and 8.0. The ionic strength from the buffer salts was kept constant at 40 mM.
3 To avoid deamidation of the MAb, pH should normally be maintained below pH 8.0.
500
450
400
350
300
250
200
150
100
50
04.0 4.5 5.0 5.5 6.0 6.5 7.0 7.5 8.0
NaC
l (m
M)
pH
SBC (mg/mL)
75
70
65
60
55
50
45
40
Fig 4.30. Contour map showing screening of SBC for Capto adhere ImpRes.
DBC
The influence of pH and salt concentration on DBC was measured by DoE using Capto adhere ImpRes packed in a Tricorn 5/50 column. Based on the results for SBC, binding pH was varied between pH 6.0 and 7.84 and salt concentration from 0 to 200 mM NaCl. In addition, the residence time was varied from 2 to 8 min.
The results from the DoE are shown in Figure 4.31. Modeling of data was performed using MODDE v9.0 software, resulting in a good model fit and predictive power (data not shown). In accordance with the trend for SBC, an increase in pH and decrease in salt concentration resulted in higher DBC, while lower capacity was obtained at short residence time. Further experiments described below were performed using binding with 40 mM sodium phosphate, pH 7.8.
4 Binding buffers: Sodium phosphate, 0 to 200 mM NaCl, pH 6 to 7.8. The ionic strength from the buffer salts was kept constant at 110 mM.

68 29-0548-08 AA
180
160
140
120
100
80
60
40
20
06.6 6.8 7.0 7.2 7.4 7.6
NaC
l (m
M)
pH
Residence time = 2 min Residence time = 5 min Residence time = 8 min
54
58
62
66
180
160
140
120
100
80
60
40
20
06.6 6.8 7.0 7.2 7.4 7.6
NaC
l (m
M)
pH
58
62
66
70
180
160
140
120
100
80
60
40
20
06.6 6.8 7.0 7.2 7.4 7.6
NaC
l (m
M)
pH
58
62
66
70
Fig 4.31. Contour maps for DBC at 10% breakthrough and different residence times on Capto adhere ImpRes.
Screening of elution conditions
Measurement of yield at different elution conditions was performed in 96-well filter plates as described in “Materials and methods.” Binding was performed in 40 mM sodium phosphate, pH 7.8. Elution pH was varied between 4.5 and 8.0 and salt concentration between 0 and 1 M NaCl. The result, Figure 4.32, shows that the highest yield was obtained at low pH and low salt concentration. Based on this result, further studies of elution conditions were performed by gradient elution in packed columns.
1000
900
800
700
600
500
400
300
200
04.5 5.0 5.5 6.0 6.5 7.0 7.5 8.0
NaC
l (m
M)
pH
Yield (%)100
90
80
70
60
50
40
30
20
10
0
Fig 4.32. Screening of elution conditions in PreDictor plate. Yield obtained by varying elution pH between 4.5 and 8.0 and NaCl concentration between 0 and 1 M. Evaluation performed by Assist software for PreDictor plates.
Gradient elution
Gradient elution was performed from 40 mM sodium phosphate, pH 7.8 to 20 mM sodium phosphate, 20 mM citrate, pH 4.0 with or without addition of 100 mM NaCl5. Chromatograms are shown in Figure 4.33. Fractions were collected and analyzed by GF. Cumulated concentration of aggregates (%) vs cumulated yield of monomeric MAb (%) was calculated according to “Materials and methods.” The results showed that addition of 100 mM NaCl in the elution buffer resulted in slightly lower elution pH, lower aggregate content, and a broader elution peak than elution buffer without NaCl (Table 4.7).
5 A mixed buffer with ionic strength that is too high might result in elution of MAb during the wash step or early in the gradient.

29-0548-08 AA 69
Column: Tricorn 5/50, CV ~ 1 mLMedium: Capto adhere ImpResSample: MAb A, partially purified by protein A chromatographySample load: 43.4 mg MAb/mL chromatography mediumStart buffer: 40 mM sodium phosphate, pH 7.8 Elution buffer: 20 mM sodium phosphate, 20 mM citrate, pH 4.0 (blue curve); 20 mM sodium phosphate, 20 mM citrate, 100 mM NaCl, pH 4.0 (green curve) Gradient: 0% to 100% elution buffer in 20 CV Residence time: 4 minSystem: ÄKTA
pH
2000
1500
1000
500
0
8.0
7.0
6.0
5.0
4.0
3.0
0 20 25 30 3515Volume (mL)
105
A 280
(mAU
)
Fig 4.33. Gradient elution on Capto adhere ImpRes using elution buffer with NaCl (green curve) and without NaCl (blue curve) of MAb A, which was partially purified by protein A affinity chromatography.
Table 4.7. Results from gradient elution on Capto adhere ImpRes using elution buffer with and without NaCl
NaCl (mM) Elution pH (peak maximum) Aggregate at 90% yield (%) Elution volume (CV)
0 4.87 0.5 8.9
100 4.77 0.4 9.8
Step elution
Based on results from screening in 96-well filter plates and gradient elution, conditions for step elution were further investigated in a packed column using DoE, varying sample load between approximately 50% and 70% of DBC (37.2 to 49.6 mg MAb/mL chromatography medium). Elution pH was varied between 3.5 and 4.5, and salt concentration between 0 and 100 mM NaCl. The responses from the design were yield, aggregate concentration, pool volume, HCP, and protein A concentration. The results from the design are shown in Table 4.8.
Modeling of the experimental data was performed with MODDE v9.0 software. Good models were obtained for all responses except for protein A6. The model showed that the only significant factor was elution pH. Thus, a higher elution pH resulted in lower yield, lower aggregate concentration, higher pool volume, and lower HCP concentration (Fig 4.34).
6 As the values and the variation of protein A concentration in the elution pools were very low, no model could be obtained for this response.

70 29-0548-08 AA
Table 4.8. Results from DoE evaluation of step elution on Capto adhere ImpRes
pH NaCl (mM)
Sample load (mg/mL)
Yield (%)
Aggregates (%)
Pool (CV)
HCP (ppm)
Protein A (ppm)
3.5 0 37.2 95.2 3.33 1.88 1233 1
4.5 0 37.2 83.6 0.61 5.24 319 Below LOQ2
3.5 100 37.2 92.9 4.11 1.90 973 2
4.5 100 37.2 85.4 0.74 5.59 405 Below LOQ
3.5 0 49.6 94.9 3.35 1.96 713 2
4.5 0 49.6 85.4 0.80 5.48 306 Below LOQ
3.5 100 49.6 93.4 4.01 2.50 1103 3
4.5 100 49.6 87.1 0.55 5.86 661 Below LOQ
4.0 50 43.4 93.6 2.26 3. 45 684 1
4.0 50 43.4 92.5 1.83 3.54 577 1
4.0 50 43.4 93.5 1.99 3.52 666 1
3.3 50 43.4 92.6 4.94 1.66 ND1 ND
4.7 50 43.4 83.4 0.29 6.89 ND ND
4.0 50 43.4 92.6 2.11 3.53 ND ND
1 ND = Not determined. 2 LOQ = Limit of quantitation.
959085
3.3 3.5 3.7 3.9 4.1 4.3 4.5 4.7
Yiel
d
pH
Yield predicted for pH
753
3.3 3.5 3.7 3.9 4.1 4.3 4.5 4.7
Pool
pH
Pool predicted for pH
420
3.3 3.5 3.7 3.9 4.1 4.3 4.5 4.7
Aggr
egat
e
pH
Aggregate predicted for pH
1000
500
03.3 3.5 3.7 3.9 4.1 4.3 4.5 4.7
HC
P
pH
HCP predicted for pH
Fig 4.34. Response plots for yield, pool volume, aggregate, and HCP concentrations.
Verification of the design
The model suggested an elution pH of 4.5 (0 M NaCl) and a sample load of 70% of DBC (≈ 50 mg/mL). Column verification of the method was performed on a Tricorn 5/50 column. The obtained result was in good agreement with the expected result for yield, pool volume, and aggregate and HCP clearance (Table 4.9). The relatively high initial HCP level in the sample used accounts for the high HCP level after polishing. HCP levels could be further reduced, either by including a wash step before elution of the MAb or by addition of a third purification step.
Table 4.9. Verification of the suggested design
Result Yield of monomer (%) Pool volume (CV) Aggregates (%) HCP (ppm)
Expected result 86 5.6 0.7 400
Experimental result 85 5.5 0.8 400
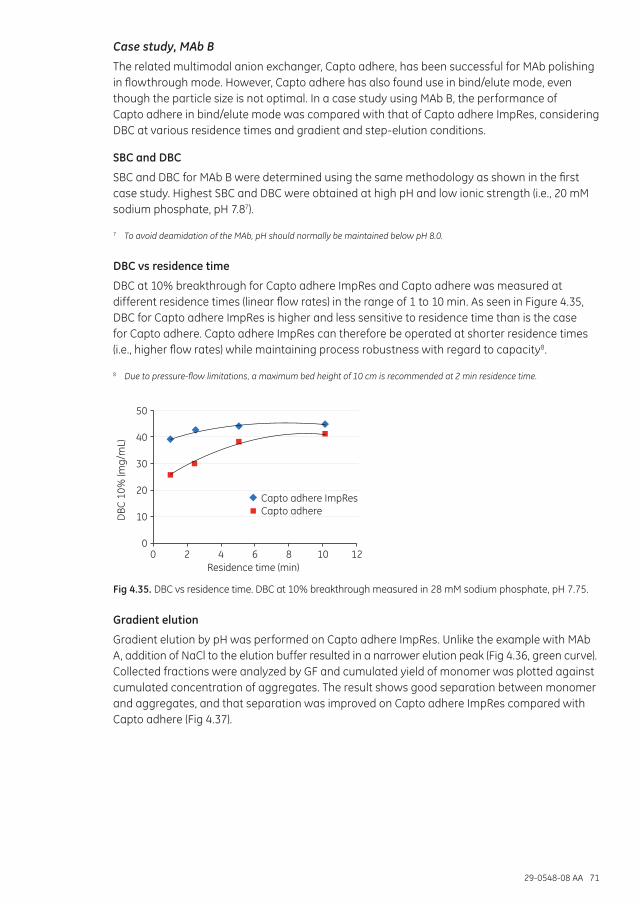
29-0548-08 AA 71
Case study, MAb B
The related multimodal anion exchanger, Capto adhere, has been successful for MAb polishing in flowthrough mode. However, Capto adhere has also found use in bind/elute mode, even though the particle size is not optimal. In a case study using MAb B, the performance of Capto adhere in bind/elute mode was compared with that of Capto adhere ImpRes, considering DBC at various residence times and gradient and step-elution conditions.
SBC and DBC
SBC and DBC for MAb B were determined using the same methodology as shown in the first case study. Highest SBC and DBC were obtained at high pH and low ionic strength (i.e., 20 mM sodium phosphate, pH 7.87).
7 To avoid deamidation of the MAb, pH should normally be maintained below pH 8.0.
DBC vs residence time
DBC at 10% breakthrough for Capto adhere ImpRes and Capto adhere was measured at different residence times (linear flow rates) in the range of 1 to 10 min. As seen in Figure 4.35, DBC for Capto adhere ImpRes is higher and less sensitive to residence time than is the case for Capto adhere. Capto adhere ImpRes can therefore be operated at shorter residence times (i.e., higher flow rates) while maintaining process robustness with regard to capacity8.
8 Due to pressure-flow limitations, a maximum bed height of 10 cm is recommended at 2 min residence time.
50
40
30
20
10
00 2 4 6 8 10 12
DBC
10%
(mg/
mL)
Residence time (min)
Capto adhere ImpResCapto adhere
Fig 4.35. DBC vs residence time. DBC at 10% breakthrough measured in 28 mM sodium phosphate, pH 7.75.
Gradient elution
Gradient elution by pH was performed on Capto adhere ImpRes. Unlike the example with MAb A, addition of NaCl to the elution buffer resulted in a narrower elution peak (Fig 4.36, green curve). Collected fractions were analyzed by GF and cumulated yield of monomer was plotted against cumulated concentration of aggregates. The result shows good separation between monomer and aggregates, and that separation was improved on Capto adhere ImpRes compared with Capto adhere (Fig 4.37).

72 29-0548-08 AA
Column: Tricorn 5/50, CV ~ 1 mLMedium: Capto adhere ImpResSample: MAb B, partially purified by protein A affinity chromatographySample load: 30 mg/mLStart buffer: 28 mM sodium phosphate, pH 7.75Elution buffer: 30 mM sodium phosphate, 25 mM citrate, pH 4.1 (blue curve) 30 mM sodium phosphate, 25 mM citrate, pH 4.1 + 250 mM NaCl (green curve)Gradient: 0% to 100% elution buffer in 20 CVResidence time: 4 minSystem: ÄKTA
pH
700
600
500
400
300
200
0
8.0
7.5
7.0
6.5
6.0
5.5
5.0
4.5
4.00 353020 2515
Volume (ml)105
A 254
(mAU
)
2000
1500
1000
500
00 3020 2515
Volume (mL)105
A 280
(mAU
)
Elut
ion
buff
er (%
)
100
80
60
40
20
0
Fig 4.36. Gradient elution of MAb B from Capto adhere ImpRes with (green curve) and without (blue curve) NaCl in elution buffer.
100
80
60
40
20
00 0.5 1.0 1.5 2.0
Cum
ulat
ed m
onom
er y
ield
(%)
Cumulated aggregates (%)
Capto adhere ImpResCapto adhere
Fig 4.37. Cumulated aggregates vs cumulated MAb monomer yield after gradient elution using Capto adhere ImpRes and Capto adhere.
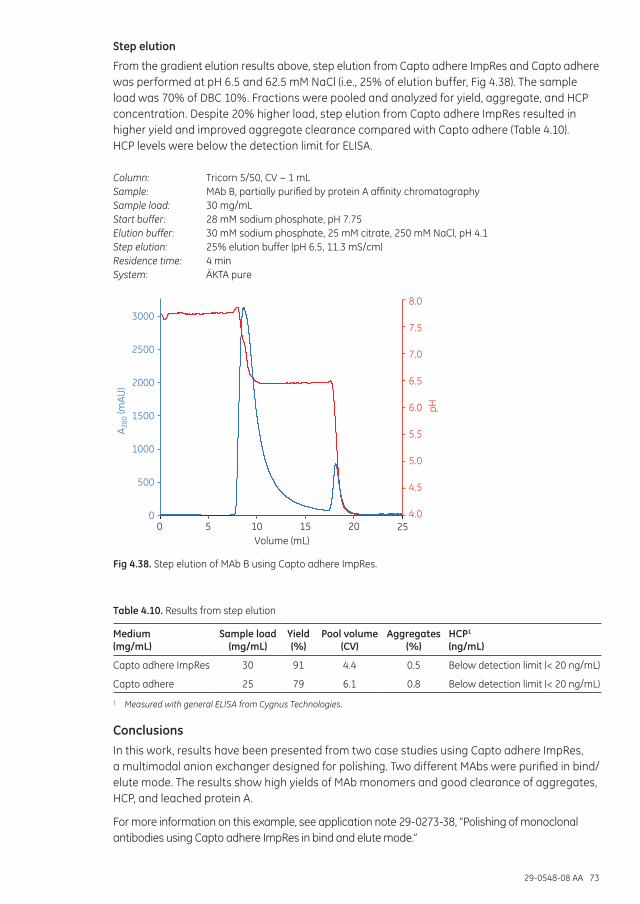
29-0548-08 AA 73
Step elution
From the gradient elution results above, step elution from Capto adhere ImpRes and Capto adhere was performed at pH 6.5 and 62.5 mM NaCl (i.e., 25% of elution buffer, Fig 4.38). The sample load was 70% of DBC 10%. Fractions were pooled and analyzed for yield, aggregate, and HCP concentration. Despite 20% higher load, step elution from Capto adhere ImpRes resulted in higher yield and improved aggregate clearance compared with Capto adhere (Table 4.10). HCP levels were below the detection limit for ELISA.
Column: Tricorn 5/50, CV ~ 1 mLSample: MAb B, partially purified by protein A affinity chromatographySample load: 30 mg/mLStart buffer: 28 mM sodium phosphate, pH 7.75Elution buffer: 30 mM sodium phosphate, 25 mM citrate, 250 mM NaCl, pH 4.1Step elution: 25% elution buffer (pH 6.5, 11.3 mS/cm)Residence time: 4 minSystem: ÄKTA pure
pH
3000
2500
2000
1500
1000
500
0
8.0
7.5
7.0
6.5
6.0
5.5
5.0
4.5
4.00 20 2515
Volume (mL)105
A 280
(mAU
)
Fig 4.38. Step elution of MAb B using Capto adhere ImpRes.
Table 4.10. Results from step elution
Medium (mg/mL)
Sample load (mg/mL)
Yield (%)
Pool volume (CV)
Aggregates (%)
HCP1 (ng/mL)
Capto adhere ImpRes 30 91 4.4 0.5 Below detection limit (< 20 ng/mL)
Capto adhere 25 79 6.1 0.8 Below detection limit (< 20 ng/mL)
1 Measured with general ELISA from Cygnus Technologies.
ConclusionsIn this work, results have been presented from two case studies using Capto adhere ImpRes, a multimodal anion exchanger designed for polishing. Two different MAbs were purified in bind/elute mode. The results show high yields of MAb monomers and good clearance of aggregates, HCP, and leached protein A.
For more information on this example, see application note 29-0273-38, “Polishing of monoclonal antibodies using Capto adhere ImpRes in bind and elute mode.”

74 29-0548-08 AA
2. Viral clearance using Capto adhere ImpResThe capability of Capto adhere ImpRes for viral clearance from MAb was tested with two model viruses: the enveloped RNA retrovirus, MuLV, and non-enveloped DNA parvovirus, MVM. MAb samples partially purified by protein A affinity chromatography were spiked with virus stock solution and were then applied to Capto adhere ImpRes in bind/elute and flowthrough mode. Eluted fractions were analyzed for virus titer by endpoint titration and large-volume plating. Capto adhere ImpRes showed efficient viral clearance in both bind/elute and flowthrough mode (Table 4.11). The log10 virus reduction factor was approximately 5.0 in bind/elute mode for both MuLV and MVM. In flowthrough mode, log10 virus reduction factor was > 4.0 for both MuLV and MVM.
Table 4.11. Viral reduction factor (log10) of MuLV and MVM purified using Capto adhere ImpRes in bind/elute and flowthrough mode
Minimal log10 viral reduction factor
Process purification mode MuLV MVM
Bind/elute1 4.98 4.95
Flowthrough2 > 5.0 4.0
1 Bind/elute conditions: phosphate/citrate, pH 7.9 (binding); phosphate/citrate + 45 mM NaCl, pH 5.4 (elution).2 Flowthrough conditions: pH 5.5, 19 mS/cm conductivity.
Capto MMC applications1. HTS and process development for capture of recombinant pro-insulin from E. coli using Capto MMCThis study describes the development of a robust capture method for recombinant pro-insulin. PreDictor plates and Assist software were used to determine a chromatographic medium for capture and identify promising binding and elution conditions. Based on the screening results, Capto MMC was selected as the most promising medium due to its ability to bind sample without prior dilution. With the binding and elution conditions found in the screening experiments as the starting point, the capture step was optimized on a Tricorn 5/50 column packed with 1 mL of medium. Once a robust capture protocol had been established, the process was successfully scaled up from Tricorn to HiScreen prepacked columns, HiScale 16/40 column (20 cm bed height) packed with Capto MMC, and finally to an AxiChrom 50/300 column (19.5 cm bed height, 400 mL packed bed volume).
Materials and methodsScreening with PreDictor platesWhenever possible, experiments with PreDictor plates were performed with fully automated protocols on a Tecan Freedom EVO-2 200 Robotic System. More complex protocols such as sample handling were carried out manually. Liquid removal was performed by vacuum or centrifugation throughout the study.
The pro-insulin used in all experiments originated from E. coli. It was supplied by BIOMM S.A., Belo Horizonte, Brazil. The pro-insulin solution was subjected to sulfitolysis to hinder the formation of disulfide bridges. The suspension that contained 8 M urea was approximately 10 mg/mL in recombinant pro-insulin and 18 mg/mL in total protein. The conductivity of the sample was approximately 14 mS/cm. PreDictor experiments followed the illustration shown in Figure 4.39. Conditions studied are presented in “Results and discussion.”

29-0548-08 AA 75
Mediumin well
Wash/equilibration
Sample addition
Wash1–3 times
Analysis
Elution1–3 times
Incubation
Mixing Mixing Mixing
Vacuum filtration or centrifugation Vacuum filtration or centrifugation
Waste
Fig 4.39. Schematic illustration of the workflow of a batch experiment in the wells of a PreDictor plate. The same steps would be employed in a column experiment, that is, equilibration, sample addition, wash, and elution. The gray color in the wells represents the chromatography medium; red shades (red and pink) represent different concentrations of protein solution. Brown represents the medium with bound sample.
Analysis
In the PreDictor binding studies, capacities were measured from analyses of the flowthrough fraction. In the elution studies, the first elution fraction was evaluated. Start samples were analyzed in all studies. All analyses were performed by AIEX on a Mono Q™ 5/50 GL column .
The pro-insulin sample concentration was determined by integrating the area of the peak eluting at a retention time of 9 to 10 min and relating its surface area to that in the crude sample:
Equation 9Concentrationsample = Peak areacrude sample
Concentrationcrude sample × Peak areasample
The resulting pro-insulin concentration in the flowthrough or first elution fraction for each condition was used as in-data in Assist software where the response surfaces for experimental evaluation were generated.
Column experiments
Column experiments comprising optimization, DBC experiments, a robustness study, and scale-up, were performed with the Capto MMC multimodal medium on chromatography systems suitable for the column dimensions. Table 4.12 summarizes the columns, systems, samples, and purification conditions for these experiments.
All eluent buffers were prepared in 8 M urea and all experiments were concluded with 1 M NaOH CIP followed by storage in 20% ethanol. Detection was performed at 280, 405, and 260 nm. In the preliminary elution experiments, salt/pH gradients were used while optimization, robustness, and scale-up experiments were performed as step elutions. As in the PreDictor experiments, sample analyses were performed by the previously described Mono Q method.

76 29-0548-08 AA
Table 4.12. Summary of the Capto MMC column experiments in process development
Study ColumnVc
(mL)Sample load
(mL) SystemFlow rate (mL/min)
DBC Tricorn 5/50 1 10 ÄKTAmicro™ 0.2
Elution optimization Tricorn 5/50 1 2.5 ÄKTA avant 25 0.2
Robustness study Tricorn 5/50 1 2.5 ÄKTA avant 25 0.2
Scale-up 2 × HiScreen 4.7/10 9.4 24 ÄKTA avant 25 1.9
HiScale 16/40 40 100 ÄKTA avant 150 8
AxiChrom 50/300 400 960 ÄKTA avant 150 80
Results and discussionScreening experiments for binding
Binding experiments were performed on a selection of ion exchange and multimodal media; the PreDictor plates contained 2 µL or 6 µL of SP Sepharose Fast Flow, Capto S, or Capto MMC. The small media volumes (2 and 6 µL) enabled binding experiments by overloading the media with the buffered sample (200 µL solution 2.5 mg/mL in respect to pro-insulin per well) in 8 M urea without consuming more than 15 mL of crude sample for the binding study. The binding with respect to both the initial salt concentration and the pH value of the binding buffer was examined. Table 4.13 summarizes the test conditions for each medium.
Table 4.13. Summary of media and parameters in the binding experiments conducted on PreDictor plates
Experiment pH NaCl (mM)
Binding study—CIEX screening plate 3.4–5.0 0–300
Capto S, 2 µL
Capto MMC, 6 µL
SP Sepharose Fast Flow, 6 µL
Binding study—Capto MMC, 6 µL 3.0–7.0 0–300
In all binding experiments, the flowthrough fraction was collected and analyzed with respect to nonbound pro-insulin as compared with the start sample, which gives an indication of the binding capacity at each condition. The resulting response surfaces for all media, generated using Assist software, are shown in Figure 4.40.
Capto S and SP Sepharose Fast Flow indicate high binding capacities at the lowest pH tested (i.e., 3.4) and no salt. Capto MMC binds at 150 mM salt and higher pH compared with these two media. Because the starting sample of the fusion protein has an ionic strength close to 150 mM NaCl, high binding capacity at this concentration is an advantage.
A second binding study was thus performed with Capto MMC and a broader parameter interval intended to reveal the optimum binding for this medium. As Figure 4.41 shows, the highest binding capacities (red/orange zone) for pro-insulin binding to Capto MMC are obtained at pH 5 (or just above) and 0 to 160 mM NaCl. It was decided to continue with Capto MMC and to study conditions for elution.
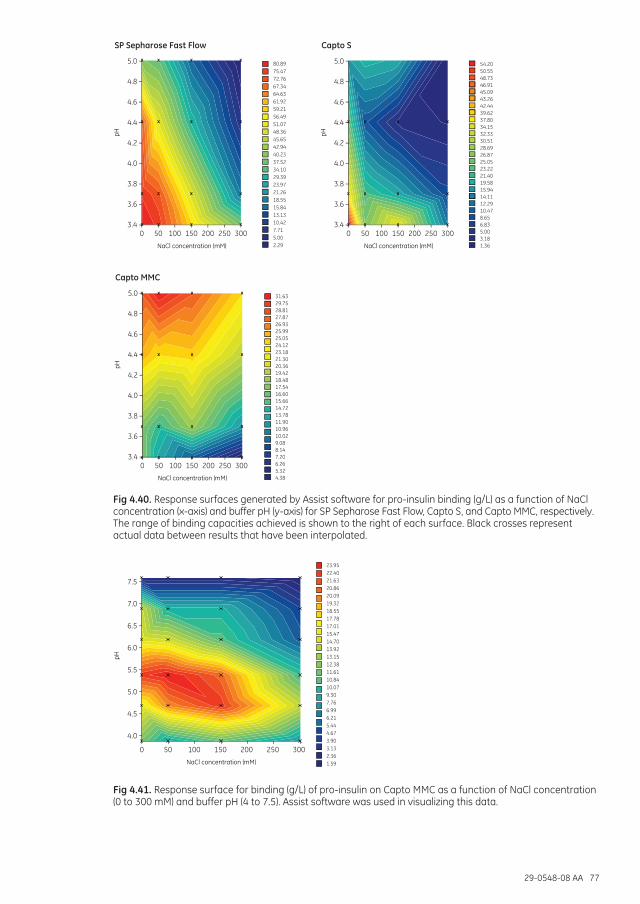
29-0548-08 AA 77
NaCl concentration (mM)
pH
5.0
4.8
4.6
4.4
4.2
4.0
3.8
3.6
3.40 50 100 150 200 300250
SP Sepharose Fast Flow Capto MMCCapto S
NaCl concentration (mM)
pH
5.0
4.8
4.6
4.4
4.2
4.0
3.8
3.6
3.40 50 100 150 200 300250
NaCl concentration (mM)
pH
5.0
4.8
4.6
4.4
4.2
4.0
3.8
3.6
3.40 50 100 150 200 300250
80.8975.4772.7667.3464.6361.9259.2156.4951.0748.3645.6542.9440.2337.5234.1029.3923.9721.2618.5515.8413.1310.427.715.002.29
54.2050.5548.7346.9145.0943.2642.4439.6237.8034.1532.3330.5128.6926.8725.0523.2221.4019.5815.9414.1112.2910.478.656.835.003.181.36
31.6329.7528.8127.8726.9325.9925.0524.1223.1821.3020.3619.4218.4817.5416.6015.6614.7213.7811.9010.9610.029.088.147.206.265.324.38
NaCl concentration (mM)
pH
5.0
4.8
4.6
4.4
4.2
4.0
3.8
3.6
3.40 50 100 150 200 300250
SP Sepharose Fast Flow Capto MMCCapto S
NaCl concentration (mM)
pH
5.0
4.8
4.6
4.4
4.2
4.0
3.8
3.6
3.40 50 100 150 200 300250
NaCl concentration (mM)
pH
5.0
4.8
4.6
4.4
4.2
4.0
3.8
3.6
3.40 50 100 150 200 300250
80.8975.4772.7667.3464.6361.9259.2156.4951.0748.3645.6542.9440.2337.5234.1029.3923.9721.2618.5515.8413.1310.427.715.002.29
54.2050.5548.7346.9145.0943.2642.4439.6237.8034.1532.3330.5128.6926.8725.0523.2221.4019.5815.9414.1112.2910.478.656.835.003.181.36
31.6329.7528.8127.8726.9325.9925.0524.1223.1821.3020.3619.4218.4817.5416.6015.6614.7213.7811.9010.9610.029.088.147.206.265.324.38
Fig 4.40. Response surfaces generated by Assist software for pro-insulin binding (g/L) as a function of NaCl concentration (x-axis) and buffer pH (y-axis) for SP Sepharose Fast Flow, Capto S, and Capto MMC, respectively. The range of binding capacities achieved is shown to the right of each surface. Black crosses represent actual data between results that have been interpolated.
NaCl concentration (mM)
pH
7.5
7.0
6.5
6.0
5.5
5.0
4.5
4.0
0 50 100 150 200 300250
23.9522.4021.6320.8620.0919.3218.5517.7817.0115.4714.7013.9213.1512.3811.6110.8410.079.307.766.996.215.444.673.903.132.361.59
Fig 4.41. Response surface for binding (g/L) of pro-insulin on Capto MMC as a function of NaCl concentration (0 to 300 mM) and buffer pH (4 to 7.5). Assist software was used in visualizing this data.

78 29-0548-08 AA
Screening experiments for elution
PreDictor plates with 50 µL of Capto MMC media volume were used for elution studies. This ensured sufficient loading to detect the target molecule without overloading the medium. The amount of protein applied in the loading step corresponded to 70% of the binding capacity that was estimated in the binding study, that is, 180 µL of sample, 5 mg/mL in respect to pro-insulin. The elution study was performed using a range of eluent compositions: pH 3.7 to 7.6 and 150 to 1000 mM NaCl. The evaluation procedure was the same as for the binding study, but now the first elution fraction was analyzed. This showed the conditions required to obtain elution in the column verification work that followed.
As only the first elution fraction was analyzed, one may not expect full yield in this step. The highest yield achieved was 70% and was found at pH 7.5 and a NaCl concentration above 600 mM (Fig 4.42).
NaCl concentration (mM)
pH
7.5
7.0
6.5
6.0
5.5
5.0
4.5
4.0
200 400 600 800 1000
70.01 65.27 62.90 60.53 58.16 53.42 51.05 48.68 46.31 43.94 39.20 36.83 34.46 32.09 29.72 24.98 22.61 20.24 17.87 15.50 10.76
8.39
6.02
3.65
1.28
Fig 4.42. Pro-insulin yield (%) (first elution fraction) on Capto MMC as a function of NaCl concentration (150 to 1000 mM) and buffer pH (4 to 7.5). Assist software was used in obtaining these data.
Optimization in Tricorn columns on ÄKTA avant 25
The HTS experiments on PreDictor plates suggested that the best conditions for pro-insulin capture would be binding at around pH 5 and a NaCl concentration of 50 to 150 mM on Capto MMC followed by eluting at a pH greater than 7 and a NaCl concentration above 600 mM.
With these parameters added as factors in a DoE protocol, the capture step was optimized on Capto MMC packed in a 1 mL Tricorn column (diameter 5 mm). As 150 mM NaCl corresponds to the isotonic salt concentration found in the start sample, this salt concentration was an obvious starting point for binding because it eliminated the need to dilute sample prior to loading. Binding buffer pH was set at 5.2, and the pH of the start sample was set accordingly. In the first column experiment, elution with a salt gradient was tested by loading 20 mg of pro-insulin (2 mL sample) in 50 mM sodium acetate buffer, pH 5.2 in 8 M urea on the 1 mL column and eluting with a linear salt gradient of 150 to 1000 mM NaCl for 7 CV.
Figure 4.43 shows the results. The fraction collected at the maximum height of the elution peak was analyzed on Mono Q and the resulting chromatogram compared with that of the crude sample and one flowthrough fraction.
Analysis of the flowthrough fraction (Fig 4.43B) showed good binding of the target molecule with no pro-insulin detected in the flowthrough. The nonprotein impurity seemed to be low binding as it appeared in the flowthrough fraction while the corresponding peak in the elution fraction was significantly smaller. This indicated good capture and purification of pro-insulin.
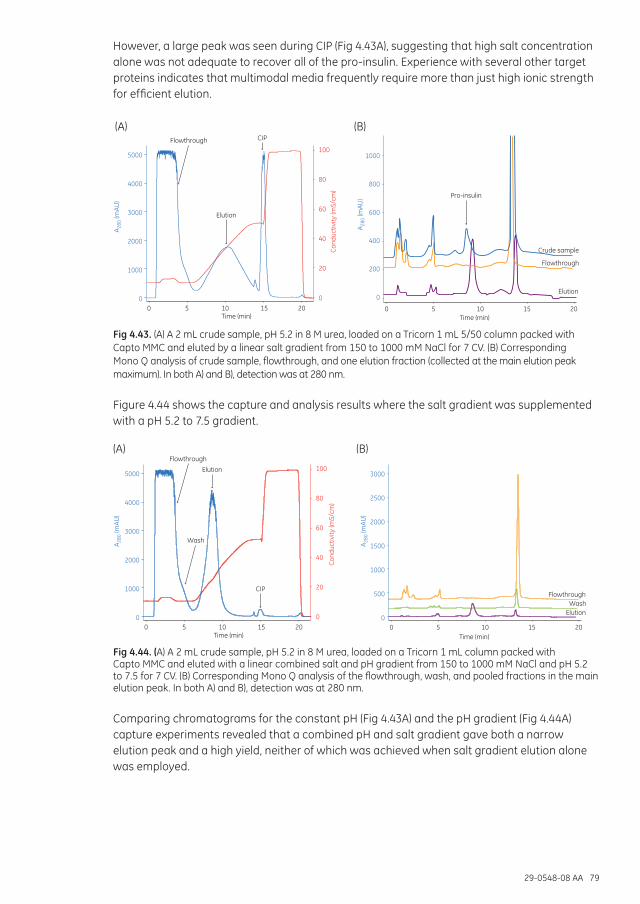
29-0548-08 AA 79
However, a large peak was seen during CIP (Fig 4.43A), suggesting that high salt concentration alone was not adequate to recover all of the pro-insulin. Experience with several other target proteins indicates that multimodal media frequently require more than just high ionic strength for efficient elution.
(A) (B)
0 5 10 15 20
100
80
60
40
20
0
5000
4000
3000
2000
1000
0
Con
duct
ivity
(mS/
cm)
A 280
(mAU
)
A 280
(mAU
)
Elution
Pro-insulin
CIPFlowthrough
0 5 10 15 20Time (min)Time (min)
1000
800
600
400
200
0
Flowthrough
Crude sample
Elution
Fig 4.43. (A) A 2 mL crude sample, pH 5.2 in 8 M urea, loaded on a Tricorn 1 mL 5/50 column packed with Capto MMC and eluted by a linear salt gradient from 150 to 1000 mM NaCl for 7 CV. (B) Corresponding Mono Q analysis of crude sample, flowthrough, and one elution fraction (collected at the main elution peak maximum). In both A) and B), detection was at 280 nm.
Figure 4.44 shows the capture and analysis results where the salt gradient was supplemented with a pH 5.2 to 7.5 gradient.
(A) (B)
0 5 10 15 20
100
80
60
40
20
0
5000
4000
3000
2000
1000
0
Con
duct
ivity
(mS/
cm)
A 280
(mAU
)
A 280
(mAU
)
Elution
CIP
Flowthrough
Wash
0 5 10 15 20Time (min)Time (min)
3000
2500
2000
1500
1000
500
0
FlowthroughWash
Elution
Fig 4.44. (A) A 2 mL crude sample, pH 5.2 in 8 M urea, loaded on a Tricorn 1 mL column packed with Capto MMC and eluted with a linear combined salt and pH gradient from 150 to 1000 mM NaCl and pH 5.2 to 7.5 for 7 CV. (B) Corresponding Mono Q analysis of the flowthrough, wash, and pooled fractions in the main elution peak. In both A) and B), detection was at 280 nm.
Comparing chromatograms for the constant pH (Fig 4.43A) and the pH gradient (Fig 4.44A) capture experiments revealed that a combined pH and salt gradient gave both a narrow elution peak and a high yield, neither of which was achieved when salt gradient elution alone was employed.

80 29-0548-08 AA
DBC experiments
Once promising conditions for binding and eluting pro-insulin had been established, attention was turned to DBC. This was determined by overloading the column with crude sample and collecting and analyzing fractions to determine the point at which pro-insulin breakthrough occurred.
Based on DBC experiments, the loading in the experimental work was set to 25 mg pro-insulin (2.5 mL crude sample, approx. 80% of DBC) to secure complete binding.
Elution optimization
Aiming at a step elution mode, elution conditions were optimized using the buffer prep and DoE tools of ÄKTA avant 25. A full factorial design with three center points based on two variables (pH and NaCl concentration) each at three levels was set up to determine the salt concentration and the pH needed to obtain sufficient purity and yield (above 80% and 95%, respectively). The area of the pro-insulin peak as well as the area percent of pro-insulin in the analysis chromatogram (purity) were set as responses. See Table 4.14 for details.
Table 4.14. Design variables, values for the elution optimization, and purity data of pro-insulin in the eluted peak
Run NaCl (mM) Elution pH read2 Area (mAU × mL) Purity (%)11 450 7.1 196 76
2 150 7.1 181 79
31 450 7.1 196 81
4 150 8 246 83
51 450 7.1 187 82
6 750 8 251 84
7 750 7.1 241 82
8 450 6.2 69 71
9 450 8 250 84
10 150 6.2 37 53
11 750 6.2 116 781 Center points.2 8 M urea influences the pH reading; settings in ÄKTA avant were approximately 1 pH unit lower.
Figure 4.45 shows the pro-insulin peak area in the collected elution peak as a function of pH and NaCl concentration. This clearly demonstrates that the optimal elution for pro-insulin is found at high pH, whereas an increase in the concentration of NaCl above 150 mM has only a minor effect. The purities achieved were also highest at high pH. It was decided to perform the elution at pH 8 and 150 mM NaCl.
NaCl concentration (mM)
pH
200 300 400 500 600
Peak area
800
230
210
190
170
150
130
110
90
70
50
7.8
7.6
7.4
7.2
7.0
6.8
6.6
6.4
6.2
Fig 4.45. Response surface for the elution peak area of pro-insulin as a function of pH and NaCl concentration in mM. R2 (explained variation) = 0.989, Q2 (predicted variation) = 0.736. ÄKTA avant was used in obtaining these data.

29-0548-08 AA 81
Robustness study
To conclude process development, a robustness study was performed on 1 mL Tricorn 5/50 columns packed with Capto MMC using the optimized elution conditions of pH 8 and 150 mM NaCl. The robustness study was designed using a Plackett–Burman DoE based on four variables (two chromatography media batches, two crude sample batches, elution pH 7.8 to 8.2 and load volume 2.3 to 2.7 mL) with 150 mM NaCl in all eluent buffers. Figure 4.46 shows the scaled and centered coefficients for the purity data (all above 80% purity) from the eluted peaks as a function of the variable parameters. It is clear that no significant model terms can be detected. The yield was approximately 95% for all conditions in this study.
%
Capto MMC (lot 10007124)
Capto MMC (lot 10034224)
Sample 1
Sample 2
pH Load volume
2
1
0
-1
-2
Scaled and centered coefficients for purity (extended)
Fig 4.46. Scaled and centered coefficients for purity as a function of four variable parameters: chromatographic medium lot (×2), sample (×2), pH, and load volume.
Scale-up experiments
Columns with 20 cm bed heights were used for 9-, 40-, and 400-fold scale-up by increasing column diameter while keeping other parameters such as residence time and sample load/mL chromatographic medium constant. Other conditions were similar to those found in the optimization study on the Tricorn 5/50 column packed with Capto MMC (loading at pH 5.2 and elution at pH 8, both in the presence of 150 mM NaCl).
Two HiScreen Capto MMC columns were connected in series to give 20 cm bed height. In addition, a HiScale 16/40 column (diameter 16 mm) and an AxiChrom 50/300 column (diameter 50 mm) were packed with Capto MMC to bed heights of 20 and 19.5 cm, respectively. The capture experiment was performed at 240 cm/h at all three extended scales (5 min residence time). Fractions from the flowthrough and the eluted peaks were analyzed on the Mono Q column. Results and purity data (Table 4.15 and Fig 4.47) show that the capture step of the pro-insulin purification was successfully transferred from the 1 mL Tricorn 5/50 column to the 400 mL AxiChrom 50 column. The resulting pro-insulin purity was 82%, and the yield was 96% measured at the 400 mL scale.
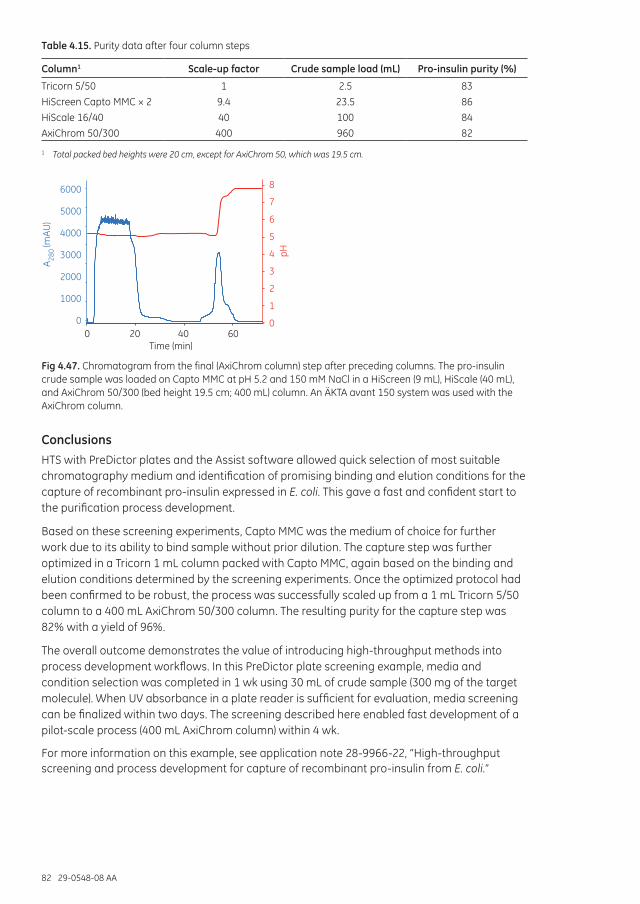
82 29-0548-08 AA
Table 4.15. Purity data after four column steps
Column1 Scale-up factor Crude sample load (mL) Pro-insulin purity (%)
Tricorn 5/50 1 2.5 83
HiScreen Capto MMC × 2 9.4 23.5 86
HiScale 16/40 40 100 84
AxiChrom 50/300 400 960 82
1 Total packed bed heights were 20 cm, except for AxiChrom 50, which was 19.5 cm.
0 20 40 60Time (min)
6000
5000
4000
3000
2000
1000
0
A 280
(mAU
)
8
7
6
5
4
3
2
1
0
pH
Fig 4.47. Chromatogram from the final (AxiChrom column) step after preceding columns. The pro-insulin crude sample was loaded on Capto MMC at pH 5.2 and 150 mM NaCl in a HiScreen (9 mL), HiScale (40 mL), and AxiChrom 50/300 (bed height 19.5 cm; 400 mL) column. An ÄKTA avant 150 system was used with the AxiChrom column.
ConclusionsHTS with PreDictor plates and the Assist software allowed quick selection of most suitable chromatography medium and identification of promising binding and elution conditions for the capture of recombinant pro-insulin expressed in E. coli. This gave a fast and confident start to the purification process development.
Based on these screening experiments, Capto MMC was the medium of choice for further work due to its ability to bind sample without prior dilution. The capture step was further optimized in a Tricorn 1 mL column packed with Capto MMC, again based on the binding and elution conditions determined by the screening experiments. Once the optimized protocol had been confirmed to be robust, the process was successfully scaled up from a 1 mL Tricorn 5/50 column to a 400 mL AxiChrom 50/300 column. The resulting purity for the capture step was 82% with a yield of 96%.
The overall outcome demonstrates the value of introducing high-throughput methods into process development workflows. In this PreDictor plate screening example, media and condition selection was completed in 1 wk using 30 mL of crude sample (300 mg of the target molecule). When UV absorbance in a plate reader is sufficient for evaluation, media screening can be finalized within two days. The screening described here enabled fast development of a pilot-scale process (400 mL AxiChrom column) within 4 wk.
For more information on this example, see application note 28-9966-22, “High-throughput screening and process development for capture of recombinant pro-insulin from E. coli.”
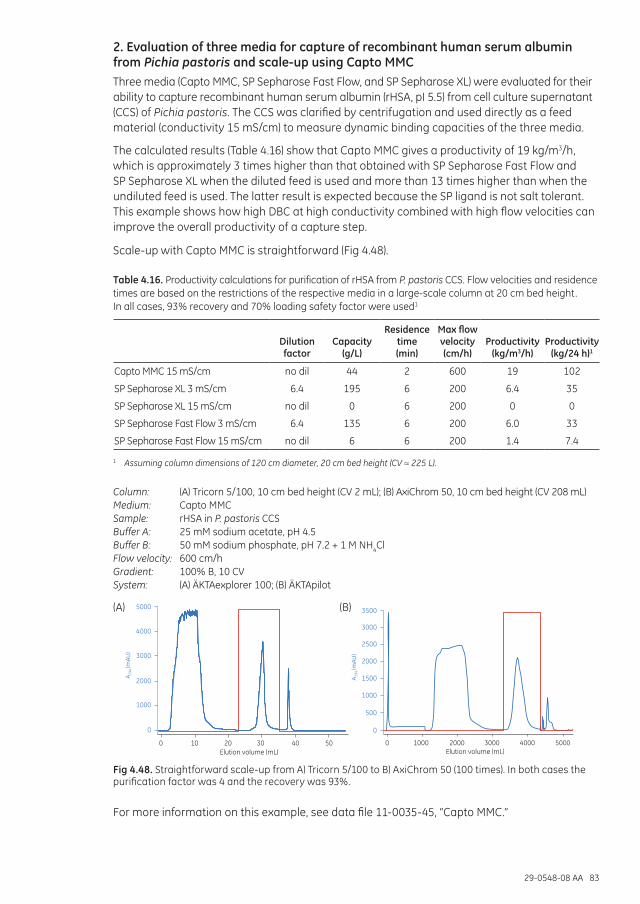
29-0548-08 AA 83
2. Evaluation of three media for capture of recombinant human serum albumin from Pichia pastoris and scale-up using Capto MMCThree media (Capto MMC, SP Sepharose Fast Flow, and SP Sepharose XL) were evaluated for their ability to capture recombinant human serum albumin (rHSA, pI 5.5) from cell culture supernatant (CCS) of Pichia pastoris. The CCS was clarified by centrifugation and used directly as a feed material (conductivity 15 mS/cm) to measure dynamic binding capacities of the three media.
The calculated results (Table 4.16) show that Capto MMC gives a productivity of 19 kg/m3/h, which is approximately 3 times higher than that obtained with SP Sepharose Fast Flow and SP Sepharose XL when the diluted feed is used and more than 13 times higher than when the undiluted feed is used. The latter result is expected because the SP ligand is not salt tolerant. This example shows how high DBC at high conductivity combined with high flow velocities can improve the overall productivity of a capture step.
Scale-up with Capto MMC is straightforward (Fig 4.48).
Table 4.16. Productivity calculations for purification of rHSA from P. pastoris CCS. Flow velocities and residence times are based on the restrictions of the respective media in a large-scale column at 20 cm bed height. In all cases, 93% recovery and 70% loading safety factor were used1
Dilution factor
Capacity (g/L)
Residence time (min)
Max flow velocity (cm/h)
Productivity (kg/m3/h)
Productivity (kg/24 h)1
Capto MMC 15 mS/cm no dil 44 2 600 19 102
SP Sepharose XL 3 mS/cm 6.4 195 6 200 6.4 35
SP Sepharose XL 15 mS/cm no dil 0 6 200 0 0
SP Sepharose Fast Flow 3 mS/cm 6.4 135 6 200 6.0 33
SP Sepharose Fast Flow 15 mS/cm no dil 6 6 200 1.4 7.4
1 Assuming column dimensions of 120 cm diameter, 20 cm bed height (CV ≈ 225 L).
Column: (A) Tricorn 5/100, 10 cm bed height (CV 2 mL); (B) AxiChrom 50, 10 cm bed height (CV 208 mL)Medium: Capto MMCSample: rHSA in P. pastoris CCSBuffer A: 25 mM sodium acetate, pH 4.5Buffer B: 50 mM sodium phosphate, pH 7.2 + 1 M NH4ClFlow velocity: 600 cm/hGradient: 100% B, 10 CV System: (A) ÄKTAexplorer 100; (B) ÄKTApilot
0
1000
2000
3000
4000
5000
0 10 20 30 40 50Elution volume (mL) Elution volume (mL)
0
500
1500
2000
2500
3000
3500
1000
0 1000 2000 3000 4000 5000
A 294
(mAU
)
A 294
(mAU
)
(A) (B)
Fig 4.48. Straightforward scale-up from A) Tricorn 5/100 to B) AxiChrom 50 (100 times). In both cases the purification factor was 4 and the recovery was 93%.
For more information on this example, see data file 11-0035-45, “Capto MMC.”

84 29-0548-08 AA
Capto MMC ImpRes applications1. Polishing of MAbs using Capto MMC ImpRes in bind/elute modeThis study describes a fast and efficient method to separate monomeric MAb from aggregates, HCP, and protein A remnants. The method described includes screening for optimal binding conditions in 96-well plate format followed by verification in packed column format, and optimization of elution conditions using DoE. The running conditions were then validated in larger scale with satisfactory correspondence to the DoE model prediction. All preparative chromatography experiments were performed in bind/elute mode.
A summary of the steps in the study is shown in Figure 4.49.
Find optimal binding conditions in plates
Confirm binding conditions in columns
Investigation of elution conditions
DoE model for fine- tuning of elution
Monte Carlo simulation based on DoE model to investigate protocol robustness
Validation of running conditions in columns
Fig 4.49. The steps used in this performance evaluation of Capto MMC ImpRes in removing contaminants from monomeric MAb.
Materials and methodsStart material
The MAb used in this study was initially purified from CHO cell supernatant by protein A affinity chromatography. Some characteristics of the antibody are shown in Table 4.17.
Table 4.17. Characteristics of the antibody used in the study
Antibody pI Aggregate content (%) DBC 10% (mg/mL)1 Capto MMC ImpRes
MAb A 7.3 2.5 71
1 DBC at 10% breakthrough (DBC 10%) measured at 4 min residence time.
Determination of SBC
SBC was determined in 6 µL PreDictor Capto MMC ImpRes 96-well plates. Equilibration of wells in the plates was performed by addition of 200 µL of loading buffer per well followed by agitation at 1100 rpm for 1 min, after which the buffer was removed by vacuum suction. The equilibration step was performed three times. MAb, partially purified by protein A affinity chromatography (200 µL volume, 4 mg/mL sample load, corresponding to 133 mg MAb/mL chromatography medium) was added to each well followed by agitation for 90 min. Unbound material (flowthrough fraction) was removed by centrifugation for 1 min, and MAb concentration was determined by measurement of absorbance at 280 nm.
29-0548-08 AA 85
SBC was calculated according to:
Equation 10SBC = (Cini – CFT)Vmedium
Vload
DBCX% = VC
CO(VX% – VO)where Vload = load volume, Vmedium = medium volume in each well, Cini = MAb concentration in the sample, and CFT = MAb concentration in the flowthrough fraction.
Determination of DBC
DBC was determined by frontal analysis using an ÄKTA chromatography system. The UV absorbance at 280 nm was used for determination of breakthrough. DBC was then calculated according to:
Equation 11
SBC = (Cini – CFT)Vmedium
Vload
DBCX% = VC
CO(VX% – VO)
where C0 = MAb concentration in the sample (mg/mL), VX% = load volume (mL) at x% breakthrough, V0 = void volume (mL), and Vc = volumetric bed volume (mL).
Screening of elution conditions
Conditions for optimizing elution were investigated in a Tricorn 5/50 packed column with Capto MMC ImpRes at a bed height of 4.7 cm. Optimization was performed using ÄKTA avant 25 chromatography system, DoE, and scouting functionalities included in UNICORN 6.0 software. The factors considered in the design were load volume, gradient length, and flow velocity. The responses were resolution of monomer/aggregates and pool volume. The method used for the DoE runs was the following:
Column: Tricorn 5/50, bed height 4.7 cmMedium: Capto MMC ImpResSample: MAb (8 mg/mL) equilibrated in start bufferStart buffer: 25 mM sodium phosphate, 25 mM sodium citrate, 100 mM NaCl, pH 6.0Elution buffer: Start buffer + 1 M NaClWash: Start buffer (5 CV)CIP: 1 M NaOH
Determination of MAb aggregates and aggregate clearance
Fractions from the chromatographic runs were collected and analyzed by analytical GF on a Superdex 200 5/150 GL column. The peaks were integrated and the D/A content (in percent) were estimated. Cumulated yield of monomers was plotted against cumulated aggregates as exemplified in Figure 4.29.
Protein A and HCP ELISA
The protein A concentration in the start materials and flowthrough fractions was determined by Protein A ELISA kit (Repligen). HCP concentration was determined by HCP ELISA (Cygnus Technologies).
Results and discussionThis case study with MAb shows a suggested workflow for method development including screening of binding conditions in 96-well format, verification of dynamic binding capacities in column format, screening, optimization of elution conditions, and validation of the DoE model prediction in a HiScreen column. It also includes a Monte Carlo simulation that addresses the protocol robustness.
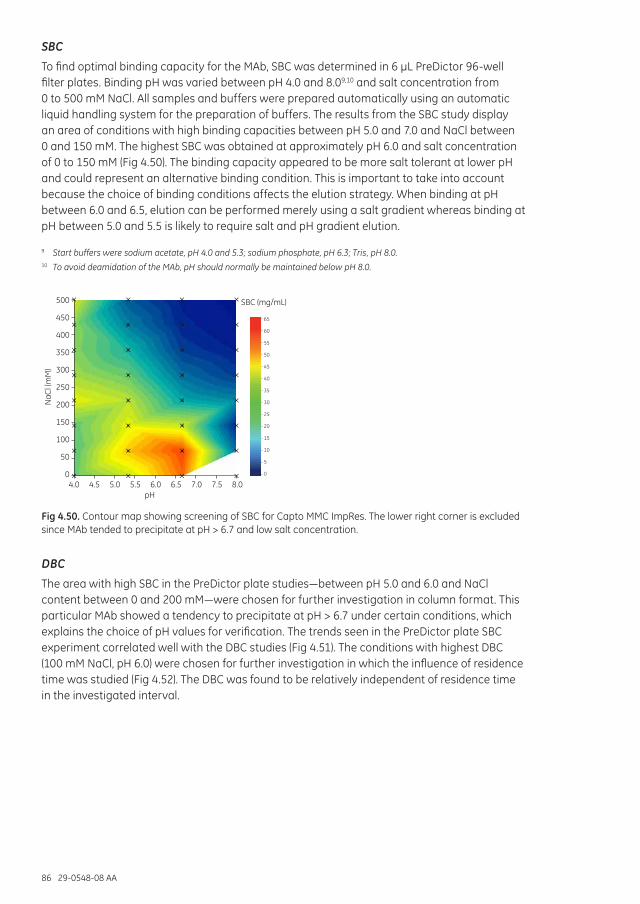
86 29-0548-08 AA
SBC
To find optimal binding capacity for the MAb, SBC was determined in 6 µL PreDictor 96-well filter plates. Binding pH was varied between pH 4.0 and 8.09,10 and salt concentration from 0 to 500 mM NaCl. All samples and buffers were prepared automatically using an automatic liquid handling system for the preparation of buffers. The results from the SBC study display an area of conditions with high binding capacities between pH 5.0 and 7.0 and NaCl between 0 and 150 mM. The highest SBC was obtained at approximately pH 6.0 and salt concentration of 0 to 150 mM (Fig 4.50). The binding capacity appeared to be more salt tolerant at lower pH and could represent an alternative binding condition. This is important to take into account because the choice of binding conditions affects the elution strategy. When binding at pH between 6.0 and 6.5, elution can be performed merely using a salt gradient whereas binding at pH between 5.0 and 5.5 is likely to require salt and pH gradient elution.
9 Start buffers were sodium acetate, pH 4.0 and 5.3; sodium phosphate, pH 6.3; Tris, pH 8.0.10 To avoid deamidation of the MAb, pH should normally be maintained below pH 8.0.
500
450
400
350
300
250
200
150
100
50
04.0 4.5 5.0 5.5 6.0 6.5 7.0 7.5 8.0
NaC
l (m
M)
pH
SBC (mg/mL)
65
60
55
50
45
40
35
30
25
20
15
10
5
0
Fig 4.50. Contour map showing screening of SBC for Capto MMC ImpRes. The lower right corner is excluded since MAb tended to precipitate at pH > 6.7 and low salt concentration.
DBC
The area with high SBC in the PreDictor plate studies—between pH 5.0 and 6.0 and NaCl content between 0 and 200 mM—were chosen for further investigation in column format. This particular MAb showed a tendency to precipitate at pH > 6.7 under certain conditions, which explains the choice of pH values for verification. The trends seen in the PreDictor plate SBC experiment correlated well with the DBC studies (Fig 4.51). The conditions with highest DBC (100 mM NaCl, pH 6.0) were chosen for further investigation in which the influence of residence time was studied (Fig 4.52). The DBC was found to be relatively independent of residence time in the investigated interval.

29-0548-08 AA 87
70
60
50
40
30
20
10
00
pH 5.0pH 6.0
200100
DBC
10%
(mg/
mL)
NaCl concentration (mM)
Fig 4.51. DBC of Capto MMC ImpRes at 4 min residence time in different salt concentrations and two different buffer pH.
60
40
20
00 2 4 6 8 10
DBC
10%
(mg/
mL)
Residence time (min)
pH 6.0 and 100 mM NaCl
Fig 4.52. Influence of residence time on DBC measured at 10% breakthrough.

88 29-0548-08 AA
Investigating elution conditions for selectivity
As high binding capacities were found at pH 5.0 to 7.0, aggregate removal and yield were investigated by linear NaCl gradient elution at pH 5.0, 6.0, and 7.0 (Fig 4.53).
Column: Tricorn 5/50, bed height 4.7 cmMedium: Capto MMC ImpResSample: 4 mL of MAb (6.3 mg/mL)Start buffer stock solution:
BufferPro CIEX 2–7 (sodium phosphate, sodium formate, sodium acetate buffer, various pH)
Start buffer A: pH 5.0Start buffer B: pH 6.0Start buffer C: pH 7.0Elution buffer: Start buffer + 1 M NaClWash: Start buffer, 5 CVGradient: 0% to 100% elution buffer in 20 CVResidence time: 4 minCIP: 1 M NaOHSystem: ÄKTA avant 25
(A) (B)
(C)
1200
1000
800
600
400
200
00 70 8060
Volume (mL)
pH
5040302010
A 280
(mAU
)
Elut
ion
buff
er (%
)
2000
1500
1000
500
00 40 5030
Volume (mL)2010
A 280
(mAU
)
Elut
ion
buff
er (%
)
100
80
60
40
20
0
100
80
60
40
20
0
Elut
ion
buff
er (%
)
100
80
60
40
20
0
2000
1500
1000
500
00 40 5030
Volume (mL)2010
A 280
(mAU
)
pH
pH
Fig 4.53. Elution of the MAb in a salt gradient at three different pH: (A) pH 5.0, (B) pH 6.0, and (C) pH 7.0.
Fractions were collected and analyzed by GF, and fractions containing 90% of the MAb were pooled and analyzed for HCP and protein A content. A summary of the results is found in Table 4.18. As can be seen, efficient aggregate removal at 90% yield was obtained for all three binding pH values. However, at pH 5.0, larger pool volumes were observed, and precipitation tendencies were seen for pH 7.0. Therefore, the conditions chosen were binding at pH 6.0 and elution with an NaCl gradient. If higher purity levels or higher yield at maintained purity had been required than the performance observed, a pH closer to 5.0 for binding and NaCl gradient elution would be a suitable alternative.

29-0548-08 AA 89
Table 4.18. Summary of the results of the chromatography at different pH; start concentrations for HCP and protein A are shown in brackets
pHAggregate at 90% yield (%) Pool volume (CV) HCP (ng/mL) Protein A (ng/mL)
5.0 0.04 14.1 16 (245) Below LOQ1 (16)
6.0 0.2 5.4 56 (245) Below LOQ (16)
7.0 0.2 6.5 44 (245) Below LOQ (16)
1 LOQ = Limit of quantitation.
Optimization of the purification performance
The binding study showed that binding at pH 6.0 with an addition of 100 mM NaCl resulted in high binding capacities. Also, high purity and yields were obtained at pH 6.0 using a linear salt gradient for elution. It would be possible at this point to stop further evaluation, but in order to build understanding and to optimize the purification performance, a DoE model was set up for the influence of three factors on aggregate content and pool volume. The factors that were varied and responses are displayed in Table 4.19. The reduction of HCP and protein A was not included as a response in the design but was measured. The start concentration of HCP was 164 ng/mL and the start concentration of protein A was 26 ng/mL. Other factors that affect the purification performance and could be of interest to study from a robustness perspective using this methodology are, for example, aggregate content or HCP levels.
The rationale behind the high and low levels of the parameters in the DoE model was as follows: flow velocity was chosen to ensure that high and low flow velocities corresponded to a residence time of 2 and 8 min, respectively. For many processes, it is not possible to have shorter residence time than 2 min due to limitations in the pumps and other equipment. The low flow velocity gives a longer residence time but is still acceptable.
Gradient length was between 5 and 15 CV. The short gradient length of 5 CV challenged the performance of Capto MMC ImpRes because this gradient is shorter than most gradients used in purification processes today. A gradient length of 15 CV is closer to that typically used by process developers and represents an average, normal gradient length.
In this study, loads of 42 and 30 mg sample/mL were used. These represent loading of 70% and 50%, respectively of the DBC 10%. A loading of 70% of DBC 10% is usually regarded as the upper limit for loading without risking any leakage of target molecules. A loading of 50% of DBC 10% is substantially lower, but represents a plausible loading for a process.
Table 4.19. Factors and levels studied in by DoE
Factors Low High
Load (mg/mL MAb) 30 42
Gradient length (CV) 5 15
Flow velocity (cm/h) 37 140
Aggregate removal
Flow velocity and gradient length were found to significantly affect aggregate removal while the influence of load was insignificant. Lower flow velocities and longer gradients resulted in lower aggregate amounts. The significant factors in the model are shown in the coefficient plot (Fig 4.54A).
The summary plot in Figure 4.54B shows different model characteristics such as model fit (R2), an estimate of the precision of future predictions, model validity, and information on the reproducibility. The summary plot indicates that the model is valid.

90 29-0548-08 AA
Table 4.20. Summary of the factors and responses used in the three-factor screening design
Factors Responses
Flow velocity (cm/h)
Gradient length (CV)
Sample load (mg/mL)
Pool volume (CV)
Aggregate at 90% yield (%)
HCP (ng/mL)
Protein A (ng/mL)
37 5 30 2.7 0.4 93 Below LOQ
37 15 30 4.9 0.23 39 Below LOQ
37 15 42 6.0 0.26 71 Below LOQ
89 10 36 4.3 0.39 41 Below LOQ
89 10 36 4.3 0.39 60 Below LOQ
89 10 36 3.8 0.37 27 Below LOQ
140 5 30 3.3 0.48 58 Below LOQ
140 15 30 5.4 0.37 74 Below LOQ
140 5 42 3.3 0.42 62 Below LOQ
140 15 42 6.0 0.37 79 Below LOQ
0.06
0.04
0.02
0
-0.02
-0.04
-0.06
-0.08
Aggr
egat
es (%
)
1.0
0.8
0.6
0.4
0.2
0Model fit (R2) Model validity
Precision of future predictions
Flow velocity
Gradient length
Sample load Reproducibility
(A) (B)
Fig 4.54. (A) Coefficient plot showing factors affecting the aggregate removal. (B) Summary plot showing different model characteristics for the aggregate removal response.
Pool volume
Gradient length and sample load were significant factors affecting pool volume (Fig 4.55). The summary plot in Figure 4.55B describes the characteristics and validity of the model.
1.4
1.2
1.0
0.8
0.6
0.4
0.2
0
Pool
vol
ume
(CV)
1.0
0.8
0.6
0.4
0.2
0Model fit (R2 Model validity
Precision of future predictions
Gradient length
Sample load
Reproducibility
)
(A) (B)
Fig 4.55. (A) Coefficient plot showing factors affecting pool volume. (B) Summary plot showing different model characteristics for the response pool volume.

29-0548-08 AA 91
Prediction of aggregate removal and pool volumes using DoE and Monte Carlo simulation
To find optimal parameters for a purification protocol and investigate the robustness of that protocol, a Monte Carlo simulation based on the DoE model was used. The investigated design space for the DoE model and the target purification performance are shown in Table 4.21. The suggested chromatographic protocol and the allowed variation in each factor (triangular distribution) are shown in Table 4.22.
A Monte Carlo simulation was used in order to assess the design space with probabilities of failing to meet the target purification performance. The resulting design space defined by the Monte Carlo simulation is shown in Figure 4.56.
Table 4.21. Factors, responses, and target values for optimization in the DoE model
Factors Low High
Flow velocity (cm/h) 37 140
Gradient length (CV) 5 15
Load (mg/mL) 30 42
Response Criterion Target Max.
Aggregate content (%) Minimize 0.2 0.4
Pool volume (CV) Minimize 2.0 4.5
Table 4.22. Factors, variation, and distribution of the factors of the final purification protocol used in the Monte Carlo simulation
Factors Low Optimum High Distribution
Flow velocity (cm/h) 46 49 52 Triangular
Gradient length (CV) 10 10.5 11 Triangular
Load (mg/mL) 31 34 36 Triangular
4.6
4.4
4.2
4.0
3.8
3.6
3.47 8 9 10 11 12 13
Load
vol
ume
(mL)
Gradient length (CV)
Load
vol
ume
(mL)
Gradient length (CV)
Load
vol
ume
(mL)
Gradient length (CV)
4.6
4.4
4.2
4.0
3.8
3.6
3.47 8 9 10 11 12 13
4.6
4.4
4.2
4.0
3.8
3.6
3.47 8 9 10 11 12 13
1 1 1
5
50
0.10.1
50
10
105
0.050.05
0.1
50
50.05
10
(B) (C) (A)
Fig 4.56. Contour plots from the Monte Carlo analysis showing risk of failing to meet the set criteria for aggregate level and pool volume in percentage, at flow velocities of (A) 46, (B) 49, and (C) 52 cm/h.

92 29-0548-08 AA
Validation of the DoE model
To validate the model, running conditions that would fulfill the desired purification performance (Fig 4.56, green area) were chosen and applied to a 4.7 mL HiScreen Capto MMC ImpRes column on ÄKTA avant 25 chromatography system. Flow velocity and load volume were recalculated according to the size of the HiScreen column (see “Materials and methods”). The chosen running conditions are summarized below, and the purification performance was predicted using UNICORN 6.0 software. The factor settings selected for validation of the model are shown in Table 4.23.
Column: HiScreen Capto MMC ImpRes, 4.7 mLSample: 20.25 mL MAb A (34 mg/mL) in 25 mM sodium citrate +100 mM NaCl, pH 6.0Start buffer: 25 mM sodium citrate + 100 mM NaCl, pH 6.0Elution buffer: Start buffer + 1 M NaClFlow velocity: 49 cm/hGradient: 0% to 100% in 10.5 CVSystem: ÄKTA avant 25
Table 4.23. Factors selected for validation of the model
Flow velocity (cm/h) Gradient length (CV) Sample load (mg/mL)
49 cm/h 10.5 34
Table 4.24. Comparison of the responses between the predicted value from the model and the validation run using a HiScreen Capto MMC ImpRes column with the predicted settings
IdentityAggregate at 90% yield (%)
Yield at 1% aggregate (%)
Pool volume (CV)
Predicted value 0.34 NA 4.1
HiScreen Capto MMC ImpRes 0.39 > 95 4.0
ConclusionsThis work describes a rapid procedure to establish a robust second step in bind/elute mode for the purification of a MAb using Capto MMC ImpRes. The medium provides high yield of monomeric MAb, as well as good clearance of aggregate, HCP, and leached protein A. A model approach to the choice of running parameters defined by the desired purification performance was also shown.
For more information on this example, see application note 29-0273-49, “Polishing of monoclonal antibodies using Capto MMC ImpRes in bind and elute mode.”
2. Effective polishing of domain antibodies (DAbs) using Capto MMC ImpResAntibody fragments (e.g., Fab, scFv, and DAbs, Fig 4.57) are becoming an important class of protein-based products. The structure and smaller size give antibody fragments properties to suit a range of applications (e.g., easier tissue penetration), and their effective purification is therefore of great interest for manufacturers of biopharmaceuticals.
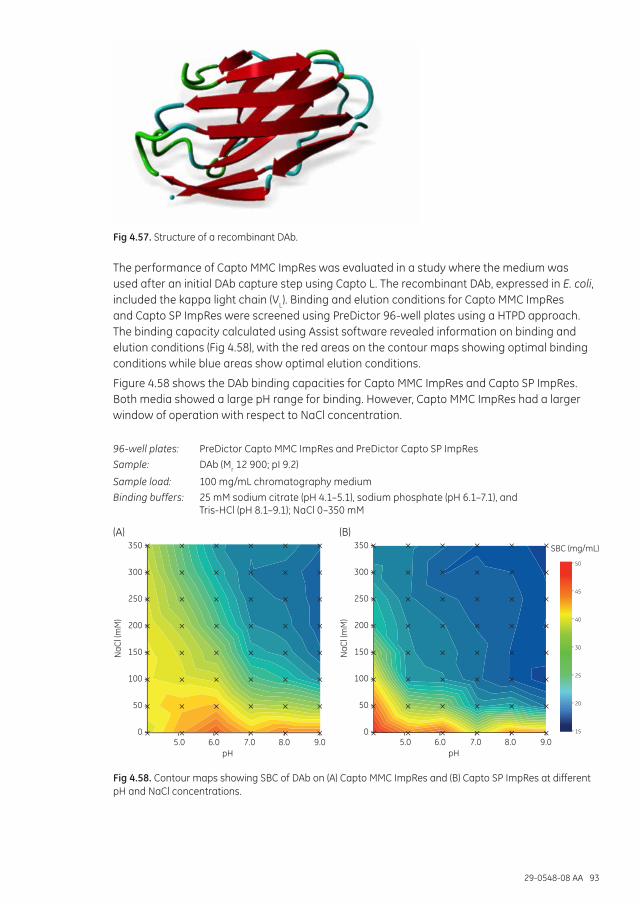
29-0548-08 AA 93
Fig 4.57. Structure of a recombinant DAb.
The performance of Capto MMC ImpRes was evaluated in a study where the medium was used after an initial DAb capture step using Capto L. The recombinant DAb, expressed in E. coli, included the kappa light chain (VL). Binding and elution conditions for Capto MMC ImpRes and Capto SP ImpRes were screened using PreDictor 96-well plates using a HTPD approach. The binding capacity calculated using Assist software revealed information on binding and elution conditions (Fig 4.58), with the red areas on the contour maps showing optimal binding conditions while blue areas show optimal elution conditions.
Figure 4.58 shows the DAb binding capacities for Capto MMC ImpRes and Capto SP ImpRes. Both media showed a large pH range for binding. However, Capto MMC ImpRes had a larger window of operation with respect to NaCl concentration.
96-well plates: PreDictor Capto MMC ImpRes and PreDictor Capto SP ImpRes
Sample: DAb (Mr 12 900; pI 9.2)
Sample load: 100 mg/mL chromatography medium
Binding buffers: 25 mM sodium citrate (pH 4.1–5.1), sodium phosphate (pH 6.1–7.1), and Tris-HCl (pH 8.1–9.1); NaCl 0–350 mM
350
300
250
200
150
100
50
05.0 6.0 7.0 9.08.0
NaC
l (m
M)
pH
350
300
250
200
150
100
50
05.0 6.0 7.0 9.08.0
NaC
l (m
M)
pH
SBC (mg/mL)
50
45
40
30
25
20
15
(A) (B)
Fig 4.58. Contour maps showing SBC of DAb on (A) Capto MMC ImpRes and (B) Capto SP ImpRes at different pH and NaCl concentrations.

94 29-0548-08 AA
Capto MMC ImpRes is effective in removing E. coli protein (ECP) contaminants in the polishing step of DAb purification processes. To study ECP removal using Capto MMC ImpRes, DAb sample was applied to Capto MMC ImpRes at a load of 20 mg/mL, pH 5.0. As shown in Figure 4.58, the salt tolerance at pH 5.0 is high. Three different wash conditions were investigated—0, 100, and 125 mM NaCl. DAb was eluted with 500 mM NaCl and the ECP content in the elution pool and DAb yield are shown in Figure 4.59. The results showed improved ECP clearance at 125 mM NaCl without major impact on yield.
Column: Tricorn 5/50, 1 mLMedium: Capto MMC ImpRes Sample: Capto L purified DAbSample loads: 20 mg/mL chromatography medium Start buffers: 20 mM sodium citrate, pH 5.0Wash buffers: Start buffer including 0, 100, and 125 mM NaCl Elution buffer: Start buffer + 500 mM NaClResidence time: 4 minSystem: ÄKTA
250
200
150
100
50
00
232
185
47
125100
ECP
cont
ent (
ppm
)
NaCl in wash (mM)
100
80
60
40
20
00
97.491.8 90.2
125100
Yiel
d (%
)
NaCl in wash (mM)
(A) (B)
Fig 4.59. Purification of a recombinant DAb using Capto MMC ImpRes. (A) ECP contaminants in the elution pool and (B) DAb yield using different NaCl concentrations in the binding and wash buffers.
For more information on this example, see data file 29-0356-74, “Capto MMC ImpRes.”
Capto Core 700 applicationPurification of influenza A/H1N1 using Capto Core 700This example shows results from a process stream with the following steps: clarification using ULTA™ Prime GF microfiltration (MF), capture, and polishing using Capto Core 700.
Madin-Darby canine kidney (MDCK) cells (inoculation concentration of 500 000 cells/mL) were grown on Cytodex™ 3 microcarriers for 48 h in an Applikon™ Bioreactor (Applikon Biotechnology). The final cell density was approximately 2 500 000 cells/mL at which point cells were infected with influenza A/Solomon Islands/3/2006 (H1N1) and harvested at 72 h post infection.
After sample clarification by MF, the virus was captured, and eluted fractions from this step were applied to an XK column packed with Capto Core 700 for final purification (Fig 4.60). Because of the robust binding performance of Capto Core 700, equilibration of the medium was achieved using the buffer used for elution in the capture step. The need for buffer exchange or dilution between steps was thereby eliminated, contributing to speeding up the chromatography process. This demonstrates the advantages of the large window of operation that is enabled by Capto Core 700.

29-0548-08 AA 95
Table 4.25 shows the results in terms of hemagglutinin (HA, e.g., total virus titer) recovery, infectious virus titer (Tissue Culture Infectious Dose (TCID50), DNA and protein removal at each step of the process. In this case, good yield of virus HA as well as significant removal of HCP and DNA were observed. In the capture step, DNA was reduced 2.8 log and proteins 5- to 7-fold. Capto Core 700 further reduced protein levels by 3- to 5-fold. The infectivity of the virus was retained throughout the process, as indicated by the titer measured with TCID50 (data not shown).
Column: XK 16/20 packed with 25 mL of Capto Core 700Sample: Eluted fractions from capture stepSample load: 8 CV of eluate, 250 cm/h (3 min residence time)Equilibration/wash: 20 mM sodium phosphate, 500 mM NaCl, pH 7.2Flow velocity during loading: 250 cm/hCIP: 1 M NaOH, 27% 1-propanol (total contact time 60 min)System: ÄKTA
Volume (mL)
A 280
(mAU
)
Conductivity (m
S/cm)
0
500
1000
1500
2000
0
20
40
60
80
100
120
140
0 100 200 300 400 500 600 700
pHFlowthrough (virus) CIP
Fig 4.61. Two-step purification of influenza A/H1N1 virus after MF. After capture of the virus, final purification was achieved using Capto Core 700.
Table 4.25. Virus HA yield, TCID50, DNA, total protein, and HCP/HA quotient in a purification scheme incorporating MF, DNA reduction step using Benzonase™ endonuclease, and final chromatography step using Capto Core 700
StepHA yield
(%)Titer
(TCID50/mL)DNA/HA (ng/μg)
Total protein/HA (μg/μg)
HCP/HA (μg/μg)
Microfiltration 64 9.7 2672 22.0 32.3
Chromatography—capture 94 4.0 3.1 6.1
Chromatography—polishing (Capto Core 700) 94 9.3 5.0 1.1 1.1
For more information on this example, see application note 29-0003-34, “Purification of influenza A/H1N1 using Capto Core 700.”

96 29-0548-08 AA

29-0548-08 AA 97
References
Application note: Optimizing elution conditions on Capto MMC using Design of Experiments, GE Healthcare, 11-0035-48, Edition AB (2008).
Belew, M. et al. Purification of recombinant human serum albumin (rHSA) produced by genetically modified Pichia pastoris. Sep Sci Technol. 43, 3134–3153 (2008).
Box, G. E. P. and Draper, N. R. Empirical model-building and response surfaces, Wiley Series in Probability and Statistics, John Wiley and Sons, Inc., New York (1987).
Carrier, T. et al. High-throughput technologies in bioprocess development, in Encyclopedia of Industrial Biotechnology: Bioprocess, Bioseparation, and Cell Technology (Flickinger, M. C., ed.), John Wiley and Sons, Inc., New York, pp. 1–75 (2010).
Chen, J. et al. The distinctive separation attributes of mixed-mode resins and their application in monoclonal antibody downstream purification process. J Chromatogr A 1217, 216–224 (2010).
Chung, W. K. et al. Evaluation of protein adsorption and preferred binding regions in multimodal chromatography using NMR. Proc Natl Acad Sci USA 107, 16811-16816 (2010).
Chung, W. K. et al. Investigation of protein binding affinity in multimodal chromatographic systems using a homologous protein library. J Chromatogr A 1217, 191–198 (2010).
David, R. H. et al. Concentration of proteins and removal of solutes, in Methods in Enzymology Vol 463 (Burgess, R. R. and Deutscher M. P., eds.), Academic Press, Massachusetts, pp. 97–120 (2009).
Gao, D. et al. Evaluating antibody monomer separation from associated aggregates using mixed- mode chromatography. J Chromatogr A 1294, 70–75 (2013).
Engstrand, C. et al. Rapid and scalable microplate development of a two-step purification process. BioProcess Int. 8, 58–66 (2010).
Eriksson, K. et al. MAb contaminant removal with a multimodal anion exchanger. BioProcess Int. 7, 52–56 (2009).
Forss, A. et al. Optimization, robustness, and scale-up of MAb purification. BioProcess Int. 9, 64–69 (2011).
Gagnon P. IgG aggregate removal by charged-hydrophobic mixed mode chromatography. Curr Pharm Biotechnol. 10, 434–439 (2009). Review.
Gagnon, P. et al. Minibodies and multimodal chromatography methods: a convergence of challenge and opportunity. Bioprocess Int. 8, 26–35 (2010).
Ghose, S. et al. Integrated polishing steps for monoclonal antibody purification, in Process Scale Purification of Antibodies, Ch 7 (Gottschalk, U., ed.), John Wiley and Sons, Inc., New York (2009).
Guidance for Industry: Q8[R2] Pharmaceutical Development, U.S. Department of Health and Human Services Food and Drug Administration Center for Drug Evaluation and Research [CDER] Center for Biologics Evaluation and Research [CBER] (2009).
Hammarberg, B. and Forsberg, B. Affordable MAb by ensuring low cog, in Animal Cell Technology: Basic and Applied Aspects 16 (Kamihira, M., ed.), Springer Science+Business Media B. V., Dordrecht, Netherlands, pp. 33–39 (2010).
He, Y, et al. Large scale production of functional human serum albumin from transgenic rice seeds. Proc. Natl Acad. Sci USA 108, 19078–19083 (2011).

98 29-0548-08 AA
Heyward, J. T. et al. The rapid concentration and purification of influenza virus from allantoic fluid. Arch Virol. 55, 107–119 (1977).
Holstein, M. A. et al. Improving selectivity in multimodal chromatography using controlled pH gradient elution. J Chromatogr A 1233, 152–155 (2012).
Holstein, M. A. et al. Mobile phase modifier effects in multimodal cation exchange chromatography. Biotechnol Bioeng. 109, 176–186 (2012).
Holstein, M. A. et al. Probing multimodal ligand binding regions on ubiquitin using nuclear magnetic resonance, chromatography, and molecular dynamics simulations. J Chromatogr A 1229, 113–120 (2012).
Horak, J. et al. Quantification of immunoglobulin G and characterization of process related impurities using coupled Protein A and size exclusion high performance liquid chromatography. J Chromatogr A 1217, 5092–5102 (2010).
Hou, Y. and Steven M. Cramer, S. M. Evaluation of selectivity in multimodal anion exchange systems: a priori prediction of protein retention and examination of mobile phase modifier effects. J Chromatogr A 1218, 7813–7820 (2011).
Johansson, B-L. et al. Preparation and characterization of prototypes for multi-modal separation media aimed for capture of negatively charged biomolecules at high salt conditions. J Chromatogr A 1016, 21–33 (2003).
Kalbfuss, B. D. et al. Size-exclusion chromatography as a linear transfer system: purification of human influenza virus as an example. J Chromatogr B Analyt Technol Biomed Life Sci. 873, 102–112 (2008).
Kaleas, K. A. et al. Industrial case study: evaluation of a mixed-mode resin for selective capture of a human growth factor recombinantly expressed in E. coli. J Chromatogr A 1217, 235–242 (2010).
Kallberg, K. et al. Application of a pH responsive multimodal hydrophobic interaction chromatography medium for the analysis of glycosylated proteins. J Chromatogr A 1218, 678–683 (2011).
Liderfelt, J. et al. The manufacture of MAbs—a comparison of performance and process time between traditional and ready-to-use disposable systems, in Single-Use Technology in Biopharmaceutical Manufacture (Eibl, R. and Eibl, D., eds.), John Wiley and Sons, Inc., New York (2010).
Liu, H. F. et al. Recovery and purification process development for monoclonal antibody production. MAbs 2, 480–499 (2010).
Lu, H. et al. Expression, purification and characterization of recombinant human serine proteinase inhibitor Kazal-type 6 (SPINK6) in Pichia pastoris. Protein Expr Purif 82, 144–149 (2012).
Ma, J. et al. Using precipitation by polyamines as an alternative to chromatographic separation in antibody purification processes. J Chromatogr B Analyt Technol Biomed Life Sci 878, 798–806 (2010).
Melander, W. and Horvát, C. Salt effects on hydrophobic interactions in precipitation and chromatography of proteins: An interpretation of the lyotropic series. Arch Biochem Biophys 183, 200–215 (1977).
Metropolis, N. and Ulam, S. The Monte Carlo method. J Am Stat Assoc. 44, 335–341 (1949).
Müller-Späth, T. et al. Two step capture and purification of IgG2 using multicolumn countercurrent solvent gradient purification (MCSGP). Biotechnol Bioeng. 15, 974–984 (2010).

29-0548-08 AA 99
Naumann, T. A. et al. Identification of a chitinase-modifying protein from Fusarium verticillioides: truncation of a host resistance protein by a fungalysin metalloprotease. J Biol Chem. 286, 35358–35366 (2011).
Nayak, D. P. et al. Downstream processing of MDCK cell-derived equine influenza virus. J Chromatogr B Analyt Technol Biomed Life Sci 823, 75–81 (2005).
Nfor, B. K. et al. High-throughput isotherm determination and thermodynamic modeling of protein adsorption on mixed mode adsorbents. J Chromatogr A 1217, 6829–6850 (2010).
Nfor, B. K. et al. Model-based rational strategy for chromatographic resin selection. Biotechnol Prog. 27, 1629–1643 (2011).
Oehme, F. and Peters, J. mixed-mode chromatography in downstream process development. BioPharm Int. Mar Supplement, 12 (2010).
Pezzini, J. et al. Antibody capture by mixed-mode chromatography: a comprehensive study from determination of optimal purification conditions to identification of contaminating host cell proteins. J Chromatogr A 1218, 8197–8208 (2011).
Rodrigo, G. and Nilsson-Välimaa, K. Developing a MAb aggregate removal step by high throughput process development. BioPharm Int. 23 (2010).
Sheth, R. D. et al. Selective displacement chromatography in multimodal cation exchange systems. J Chromatogr A 1218, 9250–9259 (2011).
Staby, A. et al. Advances in Resins for Ion-Exchange Chromatography, in Advances in Chromatography 47 (Grinberg, N. and Grushka, E., eds.), CRC Press, Boca Raton, pp. 193–240 (2009).
Thim, L. et al. Purification and characterization of a new recombinant factor VIII (N8). Haemophilia 16, 349–359 (2010).
Voitl, A. et al. Application of mixed mode resins for the purification of antibodies. J Chromatogr A 1217, 5753–5760 (2010).
Yang, T. et al. Evaluation of multi-modal high salt binding ion exchange materials. J Chromatogr A 1157, 171–177 (2007).
Yang, Y. and Geng, X. Mixed-mode chromatography and its applications to biopolymers. J Chromatogr A 1218, 8813–8825 (2011).
Zhao, G. et al. Ligands for mixed-mode protein chromatography: principles, characteristics and design. J Biotechnol. 144, 3–11 (2009).

100 29-0548-08 AA
Appendix 1 Characteristics of multimodal chromatography mediaTable A1.1. Characteristics of Capto adhere
Matrix highly cross-linked agarose
Functional group multimodal strong anion exchanger
Particle size (d50v)1 75 µm
Total ionic capacity 0.09 to 0.12 mmol Cl-/mL medium
Flow velocity2 at least 600 cm/h in a 1 m diameter column with 20 cm bed height at 20°C using process buffers with the same viscosity as water at < 3 bar (0.3 MPa)
pH stability3
working range 3 to 12
cleaning-in-place (CIP) 2 to 14
Working temperature4 4°C to 30°C
Chemical stability5 all commonly used aqueous buffers, 1 M acetic acid, 1 M sodium hydroxide
Avoid oxidizing agents, anionic detergents
1 d50v is the median particle size of the cumulative volume distribution.2 The capacity for selective removal of some key contaminants may decrease at high flow velocity3 Working range: pH interval where the medium can be operated without significant change in function.
CIP: pH stability where the medium can be subjected to cleaning- or sanitization-in-place without significant change in function.
4 Capto adhere can be used under cold-room conditions, but the capacity for some key contaminants may decrease.5 No significant change in ionic binding capacity and carbon content after 1 wk storage in 1M NaOH at 40°C.
Table A1.2. Characteristics of Capto adhere ImpRes
Matrix highly cross-linked agarose
Functional group multimodal strong anion exchanger
Particle size (d50v)1 36 to 44 µm
Total ionic capacity 0.08 to 0.11 mmol Cl-/mL medium
Maximum flow velocity2 at least 220 cm/h in a 1 m diameter column with 20 cm bed height at 20°C using process buffers with the same viscosity as water at < 3 bar (0.3 MPa)
pH stability3
working range 3 to 12
CIP 2 to 14
Working temperature4 4°C to 30°C
Chemical stability5 all commonly used aqueous buffers, 1 M acetic acid, 1 M sodium hydroxide
Storage 4°C to 30°C in 20% ethanol
Regulatory support Regulatory support file is available
1 d50v is the average particle size of the cumulative volume distribution.2 The capacity for selective removal of some key contaminants may decrease at high flow velocity.3 Working range: pH interval where the medium can be operated without significant change in function.
CIP: pH stability where the medium can be subjected to CIP without significant change in function.4 Capto adhere ImpRes can be used under cold-room conditions, but the capacity for some key contaminants may decrease.5 No significant change in nitrogen and carbon content after 1 wk storage in 1 M NaOH at 40°C.

29-0548-08 AA 101
Table A1.3. Characteristics of Capto MMC
Matrix highly cross-linked agarose
Functional group multimodal weak cation exchanger
Particle size (d50v)1 75 µm
Total ionic capacity 0.07 to 0.09 mmol H+/mL medium
Flow velocity at least 600 cm/h in a 1 m diameter column with 20 cm bed height at 20°C using process buffers with the same viscosity as water at < 3 bar (0.3 MPa).
DBC2 > 45 mg BSA/mL medium at 30 mS/cm
pH stability3
short term 2 to 14
long term 2 to 12
Working temperature4 4°C to 30°C
Chemical stability all commonly used aqueous buffers, 1 M acetic acid, 1 M sodium hydroxide5, 8 M urea, 6 M guanidine hydrochloride, and 70% ethanol
Avoid oxidizing agents, cationic detergents
1 d50v is the median particle size of the cumulative volume distribution.2 DBC at 10% breakthrough as measured at a residence time of 2 min, 300 cm/h in a Tricorn 5/100 column with 10 cm bed
height in 50 mM Na-acetate, pH 4.75, 250 mM NaCl.3 Short term pH: pH interval that the medium can be subjected to, for cleaning- or sanitization-in-place (accumulated 90 to
300 h at room temperature) without significant change in function. Long term pH: pH interval where the medium can be operated without significant change in function.
4 Capto MMC can be used under cold-room conditions, but for some proteins the capacity may decrease.5 No significant change in ionic binding capacity and carbon content after 1 wk storage in 1 M NaOH at 40°C.
Table A1.4. Characteristics of Capto MMC ImpRes
Matrix highly cross-linked agarose
Functional group multimodal weak cation exchanger
Particle size (d50v)1 36 to 44 µm
Ligand density 25 to 39 µmol ligand/mL medium
Maximum flow velocity2 at least 220 cm/h in a 1 m diameter column with 20 cm bed height at 20°C using process buffers with the same viscosity as water at < 3 bar (0.3 MPa)
pH stability3
working range 3 to 12
CIP 2 to 14
Working temperature4 4°C to 30°C
Chemical stability5 all commonly used aqueous buffers, 1 M acetic acid, 1 M sodium hydroxide
Storage 4°C to 30°C in 20% ethanol, 0.2 M sodium acetate
Regulatory support Regulatory support file is available.
1 d50v is the average particle size of the cumulative volume distribution.2 The capacity for selective removal of some key contaminants may decrease at high flow velocity.3 Working range: pH interval where the medium can be operated without significant change in function.
CIP: pH stability where the medium can be subjected to CIP without significant change in function.4 Capto MMC ImpRes can be used under cold-room conditions, but the capacity for some key contaminants may decrease.5 No significant change in nitrogen, sulfur, and carbon content after 1 wk storage in 1 M NaOH at 40°C.

102 29-0548-08 AA
Table A1.5. Characteristics of Capto Core 700
Matrix High flow agarose
Size cut-off of outer layer Mr ≈ 700 000
pKa of protonated octylamine1 10.65
Functional group in the core CH3CH2CH2CH2CH2CH2CH2CH2NH-
Ionic capacity/mL 40 to 85 µmol Cl-/mL medium
Particle size (d50v)2 85 µm
Maximum operational flow velocity3 500 cm/h in columns with 20 cm bed height at < 2 bar (0.2 MPa)
Binding capacity4/mL 13 mg ovalbumin/mL medium
pH stability
CIP 2 to 14
working range 3 to 13
Working temperature 4ºC to 30ºC
Chemical stability all commonly used aqueous buffers, 1 M sodium hydroxide5, 6 M guanidine hydrochloride, 30% isopropyl alcohol, and 70% ethanol
Avoid oxidizing agents, anionic detergents
Storage 20% ethanol
1 pKa of protonated octylamine before attachment to the medium. After attachment the pKa may be slightly different.2 d50v is the average particle size of the cumulative volume distribution.3 Maximum flow velocity that has been verified for long-term use.4 DBC was measured at 10% breakthrough with a residence time of 3 min (1.6 mL/min = 200 cm/h) in HiScreen columns. The
mobile phase was 20 mM Tris/HCl with 0.15 M NaCl at pH 7.5.5 No significant change in ionic capacity and carbon content after 1 wk storage in 1 M NaOH at 40°C.

29-0548-08 AA 103
Appendix 2 Maintenance of media and storage conditionsFor best performance of multimodal chromatography media over a long working lifetime, follow the procedures described below.
EquilibrationAfter packing, and before a chromatographic run, equilibrate with loading buffer by washing with at least 5 bed volumes or until the column effluent shows stable conductivity and pH values.
Regeneration/stripAfter each step, elute any reversibly bound material with
• Capto adhere/Capto adhere ImpRes: low pH (e.g., 0.1 to 0.5 M acetic acid)
• Capto MMC/Capto MMC ImpRes: high ionic strength solution (e.g., 2 M NaCl in buffer) and at the same time increase pH to > 9 (e.g., Tris buffer with 2 M NaCl)
Regenerate the medium by washing until the column effluent shows stable conductivity and pH values.
Cleaning-in-place (CIP)CIP is a procedure for removal of contaminants such as lipids, endotoxins, nucleic acids, and precipitated or denatured proteins that remain in the packed column after regeneration. Regular CIP prevents the build-up of contaminants in the medium and helps to maintain capacity, flow properties, and general performance. The frequency of CIP depends on the nature and the condition of the feedstock.
However, for capture steps CIP is normally recommended after each cycle. A specific CIP protocol should be designed for each process according to the type of contaminants present. CIP protocols should always be applied in reverse flow because contaminants are usually found in the first part of the column.
Typically, it is recommended to perform a CIP:
• when an increase in back pressure is seen
• if reduced column performance is observed
• before first-time use or after long-term storage
• between runs when the same column is used for purification of different batches of protein to prevent possible cross-contamination
• after every run if media is used for capture
CIP protocol—Capto adhere/Capto adhere ImpRes and Capto MMC/Capto MMC ImpRes
The nature of the sample will ultimately determine the final CIP protocol so the CIP procedure below may require optimization. NaOH concentration, contact time, and frequency are typically the main parameters to vary during the optimization of the CIP.
The CIP procedure that follows removes common contaminants.

104 29-0548-08 AA
For increased contact time and due to the viscosity of the CIP solutions it is recommended to use a lower flow rate than during the purification.
1. Wash with at least 2 CV of 2 M NaCl at a pH > 9 (Capto MMC/Capto MMC ImpRes) or 0.5 M acetic acid (Capto adhere/Capto adhere ImpRes).
2. Wash with at least 4 CV of 1 M NaOH.
3. Wash with 5 CV of start buffer or until eluent pH and conductivity have reached the required values.
CIP protocol—Capto Core 700
Regular CIP is necessary to remove captured contaminants and allow re-use of Capto Core 700 with maintained capacity. Use of 1 M NaOH in 27% 1-propanol is recommended for effective CIP and sanitization of the medium after every cycle. Due to the strong binding of a wide range of contaminants to the ligand, an organic solvent will be needed for CIP with most samples. However, this will be sample dependent, and it may be possible to use CIP solutions without organic solvents. CIP protocols are dependent on the feed material and running conditions, and optimization is therefore recommended for the chosen application.
SanitizationTo reduce microbial contamination in the packed column, sanitization using 0.5 to 1 M NaOH with a contact time of at least 1 h is recommended (Table A2.1). For spore-forming bacteria (e.g., Bacillus spp.), including 20% ethanol will improve the efficiency of the sanitization significantly (Table A2.2). Including propanol instead of ethanol will also improve the sanitization efficiency (Table A2.3).
Table A2.1. Inactivation of microorganisms by NaOH
Organism NaOH (M) Time1 Temp. (ºC)
E. coli 0.01 2 h 4 or 22
S. aureus 0.1 1 h 4 or 22
C. albicans 0.5 1 h 4 or 22
A. niger 0.5 1 h 4 or 22
B. subtilis spores 1.0 48 h2 22
B. subtilis spores 1.0 8 d3 4
P. aeruginosa 0.5 1 h 22
1 for reduction to below detection limit of < 3 organisms/mL2 for reduction to below detection limit of 10 organisms/mL3 for reduction to below detection limit of 100 organisms/mL
Table A2.2. Antimicrobial effect (log10 reduction) of NaOH with the addition of 20% ethanol on Bacillus subtilis spores
Time 0.5 M NaOH0.5 M NaOH with
20% ethanol 0.1 M NaOH0.1 M NaOH with
20% ethanol
24 h 3 log 7 log – –
300 h – – 2 log 4 log

29-0548-08 AA 105
Table A2.3. Sanitization effect of solutions containing 1-propanol or 2-propanol on Bacillus subtilis spores
Solutions
Remaining B. subtilis (ATCC 6633) spores after treatment with propanol, Log10 values
Initial 0 h 1 h 2 h 5 h 10 h
0.5 M NaOH, 20% 1-Propanol 5.8 5.1 4.4 3.6 1 0
0.5 M NaOH, 40% 1-Propanol 5.8 4.9 3.2 1.2 0 0
0.5 M NaOH, 20% 2-Propanol 5.8 5.1 4.2 3.4 1 0
0.6 M NaOH, 20% 2-Propanol 5.8 5.2 4 2.4 0.6 0
0.7 M NaOH, 20% 2-Propanol 5.8 5.2 3.7 2.6 0 0
0.8 M NaOH, 20% 2-Propanol 5.8 5.1 3.1 1.3 0 0
StorageStore used medium in the container at a temperature of 4°C to 30°C. Recommended storage solutions is:
• 20% ethanol in 0.2 M sodium acetate for Capto MMC ImpRes
• 20% ethanol in water for Capto MMC, Capto adhere, Capto adhere ImpRes, and Capto Core 700
• Do not freeze.

106 29-0548-08 AA
Appendix 3 Use of multimodal media for MAb purificationCapture stepTypical MAb purification processes consist of capture by protein A followed by one or two polishing steps (Fig A3.1). MabSelect SuRe is based on a protein A derivative with higher alkali stability compared with recombinant protein A. MabSelect SuRe LX, which is based on the same alkali-tolerant ligand as MabSelect SuRe, is also optimized for high capacity. MabSelect SuRe is recommended to be used for feed titers up to 3 g/L whereas MabSelect SuRe LX is most cost effective for high-titer (> 3 g/L) feedstocks. The polishing steps can include, for example, ion exchange and multimodal chromatography.
MabSelect SuRe/SuRe LX
Capto adhere/ImpRes (FT or BE)
MabSelect SuRe/SuRe LX
Capto MMC ImpRes
Capto adhere ImpRes (FT or BE)
Fig A3.1. Strategy for use of multimodal media in two- and three-step processes for MAb purification. FT = flowthrough; BE = bind/elute.
Two-step processesIn a two-step process, the multimodal AIEX medium Capto adhere or Capto adhere ImpRes removes the vast majority of impurities (aggregates, HCP, protein A, DNA, and viruses) remaining after the protein A capture step. In the most cost-effective process, Capto adhere or Capto adhere ImpRes is used in flowthrough mode where the load can be as high as 250 mg MAb/mL medium. For some MAbs, the load on Capto adhere ImpRes is higher compared with Capto adhere at the required purity. The selection between the two media can then be based on process economy calculations. Capto adhere can, compared with Capto adhere ImpRes, be operated at higher flow rates. For example, at a column bed height of 20 cm, Capto adhere can be operated at a flow rate corresponding to a residence time of 2 min, whereas for Capto adhere ImpRes at the same bed height, the flow rate needs to be decreased, corresponding to a residence time of > 4 min. However, if the column dimensions can be modified to a shorter, wider column, Capto adhere ImpRes can advantageously be used at higher flow rates and lower residence times utilizing the fast mass transfer in the small bead.
To remove MAb fragments and/or charge isoforms, Capto adhere ImpRes operated in bind/elute mode is recommended. The smaller particle size of Capto adhere ImpRes will result in improved resolution between target protein and impurities compared with Capto adhere. Typically, an elution from Capto adhere ImpRes is performed by a decrease of pH, sometimes combined with change in conductivity.
Three-step processesA common three-step process begins with a protein A capture step, followed by polishing steps that employ traditional IEX techniques (e.g., Capto SP ImpRes followed by Capto Q in flowthrough mode). The CIEX purification step reduces HCP, protein A, fragments, aggregates, and other MAb isoforms. The AIEX step efficiently reduces the amount of remaining impurities such as DNA, viruses, HCP, and leached protein A.

29-0548-08 AA 107
An alternative three-step process could contain multimodal media: Capto MMC ImpRes and Capto adhere or Capto adhere ImpRes. The multimodal functionality of Capto MMC ImpRes results in different selectivity as well as a larger window of operation in terms of pH and conductivity compared with traditional ion exchangers. This allows the use of Capto MMC ImpRes in a variety of process conditions to solve challenging purification problems. The possibility to bind at higher pH is beneficial for MAbs that are sensitive to low pH. The last polishing step could include Capto adhere (flowthrough) or Capto adhere ImpRes (flowthrough or bind/elute) to achieve the final reduction of impurities. The aggregate reduction and viral clearance have been shown to be efficient and robust under a wide variety of conditions. Other negatively charged impurities like DNA and endotoxins are also efficiently removed.

108 29-0548-08 AA
Capto adhere
Capto adhere 19, 21, 23, 24, 25-28, 29-30, 39, 40, 41-49, 49-64, 65, 71-72, 73, 100, 103-105, 106-107
PreDictor Capto adhere 39, 49, 50, 53, 54, 55, 56, 60
PreDictor RoboColumn Capto adhere 39
HiTrap Capto adhere 39, 52, 58, 60
HiScreen Capto adhere 39, 49-50, 52, 57, 60
ReadyToProcess Capto adhere 39, 63
Capto adhere ImpRes
Capto adhere ImpRes 23, 24, 28-30, 39, 40, 65-74, 100, 103-105, 106-107
Predictor Capto adhere ImpRes 39
PreDictor RoboColumn Capto adhere ImpRes 39
HiTrap Capto adhere ImpRes 39
HiScreen Capto adhere ImpRes 39
Capto MMC
Capto MMC 19, 23, 24, 30-34, 34-35, 39, 40, 74-83, 101, 103-105, 106-107
PreDictor Capto MMC 33, 39, 74-82
PreDictor RoboColumn Capto MMC 39
HiTrap Capto MMC 39
HiScreen Capto MMC 39, 74-82
ReadyToProcess Capto MMC 39
Capto MMC ImpRes
Capto MMC ImpRes 23, 24, 34-35, 39, 40, 84-94, 101, 103-105, 106-107
PreDictor Capto MMC ImpRes 39, 84, 93
PreDictor RoboColumn Capto MMC ImpRes 39
HiTrap Capto MMC ImpRes 39
HiScreen Capto MMC ImpRes 39
Capto Core 700
Capto Core 700 18, 19, 24, 35-37, 39, 40, 94-95, 102, 104-105
HiTrap Capto Core 700 39
HiScreen Capto Core 700 39
1 Bold page numbers indicate main entry for product.
Product index1

29-0548-08 AA 109
Related literature
Code number
Data files
Capto adhere 28-9078-88
Capto adhere ImpRes 29-0344-97
Capto MMC 11-0035-45
Capto MMC ImpRes 29-0356-74
Capto Core 700 28-9983-07
PreDictor 96-well filter plates and Assist software 28-9258-39
PreDictor RoboColumn 28-9886-34
MabSelect SuRe 11-0011-65
MabSelect SuRe LX 28-9870-62
HiScale columns 28-9755-23
HiScreen prepacked columns 28-9305-81
ReadyToProcess columns 28-9159-87
Tricorn empty high performance columns 18-1147-36
AxiChrom columns 28-9290-41
BPG columns 18-1115-23
Application notes
A flexible antibody purification process based on ReadyToProcess products 28-9403-48
High-throughput screening and process development for capture of recombinant pro-insulin from E. coli
28-9966-22
High-throughput screening and optimization of a multimodal polishing step in a monoclonal antibody purification process
28-9509-60
High-throughput screening for elution conditions on Capto MMC using PreDictor plates 28-9277-90
Methods for packing Capto MMC in production scale columns 28-9259-33
Optimization of loading conditions on Capto adhere using design of experiments 28-9078-89
Optimizing elution conditions on Capto MMC using design of experiments 11-0035-48
Polishing of monoclonal antibodies using Capto adhere ImpRes in bind and elute mode 29-0273-38
Polishing of monoclonal antibodies using Capto MMC ImpRes in bind and elute mode 29-0373-49
Purification of influenza A/H1N1 using Capto Core 700 29-0003-34
Purification of a monoclonal antibody using ReadyToProcess columns 28-9198-56
Rapid process development for purification of a MAb using ÄKTA avant 25 28-9573-47
Scale-up of a downstream monoclonal antibody purification process using HiScreen and AxiChrom columns
28-9403-49
Selective removal of aggregates with Capto adhere 28-9078-93
Two-step purification of monoclonal IgG1 from CHO cell culture supernatant 28-9078-92
Selection guides
Comparison guide for process development tools 28-9951-64
Prepacked chromatography columns for ÄKTA systems 28-9317-78

110 29-0548-08 AA
Ordering information
Product Quantity Code number
Capto adhere1 25 mL 17-5444-10
100 mL 17-5444-01
1 L 17-5444-03
5 L 17-5444-04
10 L 17-5444-05
60 L 17-5444-60
PreDictor Capto adhere, 6 µL 4 × 96-well filter plates 28-9258-17
PreDictor Capto adhere, 20 µL 4 × 96-well filter plates 28-9258-18
PreDictor Capto adhere, 50 µL 4 × 96-well filter plates 28-9258-19
PreDictor Capto adhere Isotherm 4 × 96-well filter plates 28-9432-82
PreDictor RoboColumn Capto adhere, 200 µL one row of eight columns 28-9860-85
PreDictor RoboColumn Capto adhere, 600 µL one row of eight columns 28-9861-79
HiTrap Capto adhere 5 × 1 mL 28-4058-44
5 × 5 mL 28-4058-46
HiScreen Capto adhere 1 × 4.7 mL 28-9269-81
ReadyToProcess Capto adhere 1 L 28-9511-09
2.5 L 28-9017-14
10 L 28-9017-15
20 L 28-9017-16
Capto adhere ImpRes1 25 mL 17-3715-01
100 mL 17-3715-02
1 L 17-3715-03
5 L 17-3715-04
10 L 17-3715-05
Predictor Capto adhere ImpRes, 6 µL 4 × 96-well filter plates 17-3715-30
PreDictor Capto adhere ImpRes, 20 µL 4 × 96-well filter plates 17-3715-31
PreDictor RoboColumn Capto adhere ImpRes, 200 µL one row of eight columns 17-3715-40
PreDictor RoboColumn Capto adhere ImpRes, 600 µL one row of eight columns 17-3715-41
HiTrap Capto adhere ImpRes 5 × 1 mL 17-3715-10
HiScreen Capto adhere ImpRes 1 × 4.7 mL 17-3715-20
Capto MMC1 25 mL 17-5317-10
100 mL 17-5317-02
1 L 17-5317-03
5 L 17-5317-04
10 L 17-5317-05
60 L 17-5317-60
PreDictor Capto MMC, 6 µL 4 × 96-well filter plates 28-9258-14
PreDictor Capto MMC, 20 µL 4 × 96-well filter plates 28-9258-15
PreDictor Capto MMC, 50 µL 4 × 96-well filter plates 28-9258-16
PreDictor Capto MMC Isotherm 4 × 96-well filter plates 28-9432-81
PreDictor RoboColumn Capto MMC, 200 µL one row of eight columns 28-9860-84
PreDictor RoboColumn Capto MMC, 600 µL one row of eight columns 28-9861-78
1 All bulk media products are supplied in suspension in 20% ethanol. For additional information, including data file, please contact your local GE Healthcare representative.
29-0548-08 AA 111
Product Quantity Code number
HiTrap Capto MMC 5 × 1 mL 11-0032-73
5 × 5 mL 11-0032-75
HiScreen Capto MMC 1 × 4.7 mL 28-9269-80
ReadyToProcess Capto MMC 1 L 28-9511-18
2.5 L 28-9291-20
10 L 28-9291-21
20 L 28-9291-22
Capto MMC ImpRes1 25 mL 17-3716-01
100 mL 17-3716-02
1 L 17-3716-03
5 L 17-3716-04
10 L 17-3716-05
PreDictor Capto MMC ImpRes, 6 µL 4 × 96-well filter plates 17-3716-30
PreDictor Capto MMC ImpRes, 20 µL 4 × 96-well filter plates 17-3716-31
PreDictor RoboColumn Capto MMC ImpRes, 200 µL one row of 8 columns 17-3716-40
PreDictor RoboColumn Capto MMC ImpRes, 600 µL one row of 8 columns 17-3716-41
HiTrap Capto MMC ImpRes 5 × 1 mL 17-3716-10
HiScreen Capto MMC ImpRes 1 × 4.7 mL 17-3716-20
Capto Core 7001 25 mL 17-5481-01
100 mL 17-5481-02
1 L 17-5481-03
5 L 17-5481-04
HiTrap Capto Core 700 5 × 1 mL 17-5481-51
HiScreen Capto Core 700 1 × 4.7 mL 17-5481-15
Related products—columns/plates, software
PreDictor MabSelect SuRe, 20 µL 4 × 96-well filter plates 28-9258-24
PreDictor MabSelect SuRe, 6 µL 4 × 96-well filter plates 28-9258-23
HiTrap MabSelect SuRe 5 × 1 mL 11-0034-93
5 × 5 mL 11-0034-95
HiScreen MabSelect SuRe 1 × 4.7 mL 28-9269-77
ReadyToProcess MabSelect SuRe 1 L 28-9511-10
2.5 L 28-9017-17
10 L 28-9017-18
20 L 28-9017-19
PreDictor MabSelect SuRe LX, 6 µl 4 × 96-well plates 17-5474-30
PreDictor MabSelect SuRe LX, 20 µl 4 × 96-well plates 17-5474-31
PreDictor MabSelect SuRe LX, 50 µl 4 × 96-well plates 17-5474-32
HiScreen MabSelect SuRe LX 1 × 4.7 ml 17-5474-15
ReadyToProcess MabSelect SuRe LX 1 L 29-0269-27
HiPrep 26/10 Desalting 1 × 53 mL 17-5087-01
4 × 53 mL 17-5087-02
1 All bulk media products are supplied in suspension in 20% ethanol. For additional information, including data file, please contact your local GE Healthcare representative.

112 29-0548-08 AA
Product Quantity Code number
Tricorn 5/100 column 1 28-4064-10
Tricorn 10/100 column 1 28-4064-15
Tricorn 5/20 column 1 28-4064-08
Tricorn 5/50 column 1 28-4064-09
Tricorn 10/600 column 1 28-4064-19
HiScale 16/20 1 28-9644-41
HiScale 16/40 1 28-9644-24
HiScale 26/20 1 28-9645-14
HiScale 26/40 1 28-9645-13
HiScale 50/20 1 28-9644-45
HiScale 50/40 1 28-9644-44
Assist 1.2 Software package 1 28-9969-17
Multim
odal Chrom
atography – Handbook
imagination at work29-0548-08 AA 11/2013
GE, imagination at work, and GE monogram are trademarks of General Electric Company.
ÄKTA, ÄKTAmicro, ÄKTApilot, AxiChrom, BioProcess, Capto, Chromaflow, Cytodex, HiTrap, HiPrep, HiScale, HiScreen, HiTrap, MabSelect, MabSelect SuRe, Mono Q, PhastGel, PreDictor, ReadyToProcess, Sepharose, Superdex, Tricorn, ULTA, UNICORN, and Drop design are trademarks of GE Healthcare companies.
UNICORN software: Any use of UNICORN software is subject to GE Healthcare Standard Software End-User License Agreement for Life Sciences Software Products. A copy of this Standard Software End-User License Agreement is available on request.
Capto Q chromatography media: Separating viral particles with Capto Q chromatography media may require a license under United States Patent 6,537,793 B2 and foreign equivalents owned by Centelion SAS.
Applikon is a trademark of Applikon Biotechnology BV. Benzonase is a trademark of Merck KGaA. Breox and Pluronic are trademarks of BASF Corp. Coomassie and Tween are trademarks of Imperial Chemical Industries, PLC. Desmophen is a trademark of the Bayer Group. Freedom EVO and Tecan are trademarks of Tecan Group Ltd. MODDE is a trademark of Umetrics AB. RoboColumn is a trademark of Atoll GmbH. Struktol is a trademark of Schill + Seilacher “Struktol” GmbH. Triton is a trademark of Dow Chemical Co.
© 2013 General Electric Company – All rights reserved. First published Nov. 2013.
All goods and services are sold subject to the terms and conditions of sale of the company within GE Healthcare which supplies them. A copy of these terms and conditions is available on request. Contact your local GE Healthcare representative for the most current information.
GE Healthcare UK Limited Amersham Place Little Chalfont Buckinghamshire, HP7 9NA UK
GE Healthcare Europe, GmbH Munzinger Strasse 5 D-79111 Freiburg Germany
GE Healthcare Bio-Sciences Corp. 800 Centennial Avenue, P.O. Box 1327 Piscataway, NJ 08855-1327 USA
GE Healthcare Japan Corp. Sanken Bldg., 3-25-1, Hyakunincho Shinjuku-ku, Tokyo 169-0073 Japan
For local office contact information,please visit www.gelifesciences.com/contact
www.gelifesciences.com/bioprocess
GE Healthcare Bio-Sciences AB Björkgatan 30 751 84 Uppsala Sweden
imagination at work
GE Healthcare Life Sciences
imagination at work
Multimodal Chromatography Handbook


![Multimodal chromatography: debottlenecking the downstream ... · Multimodal chromatography: debottlenecking the downstream processing of monoclonal antibodies Review step [17] in](https://static.fdocuments.in/doc/165x107/5b92e15f09d3f232708cb3b1/multimodal-chromatography-debottlenecking-the-downstream-multimodal-chromatography.jpg)