Supportive Housing Multifamily Housing Program 2014 Funding Round
People Places and Policies: MakingPeople, Places and Policies: Making Multifamily Housing Healthy
Gary Adamkiewicz, PhD MPHHarvard School of Public HealthHarvard School of Public Health
Delaware Healthy Homes Summit3.12.2014

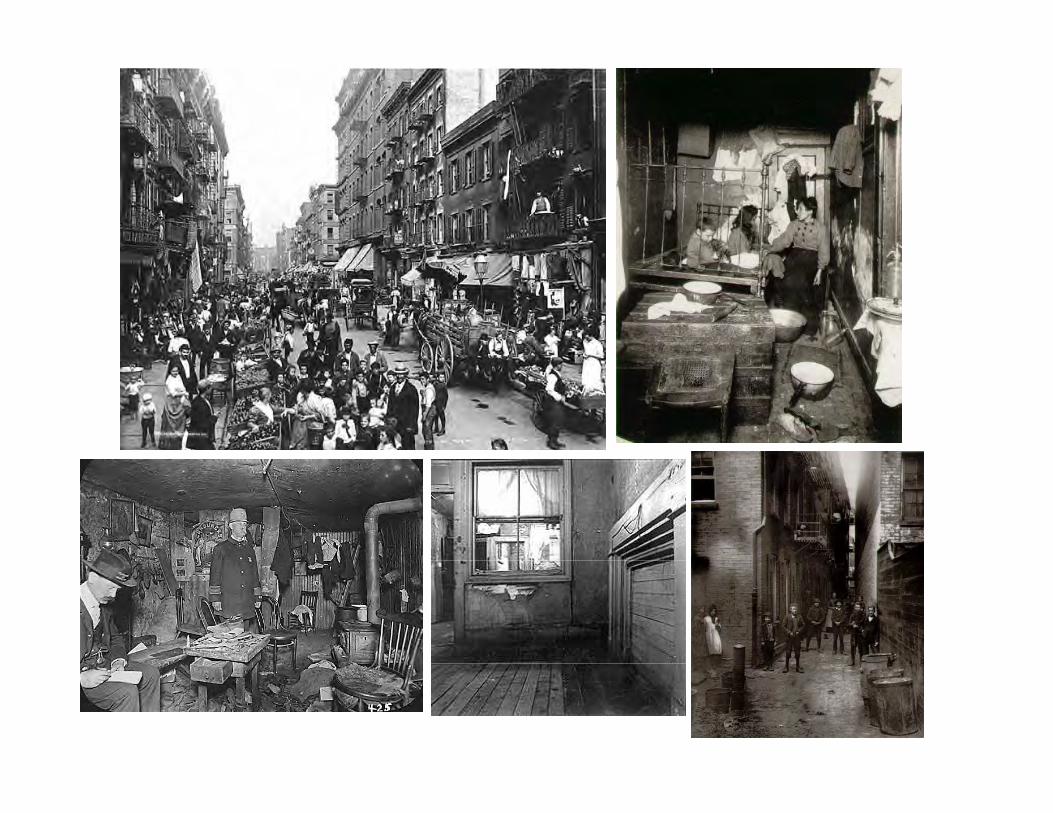
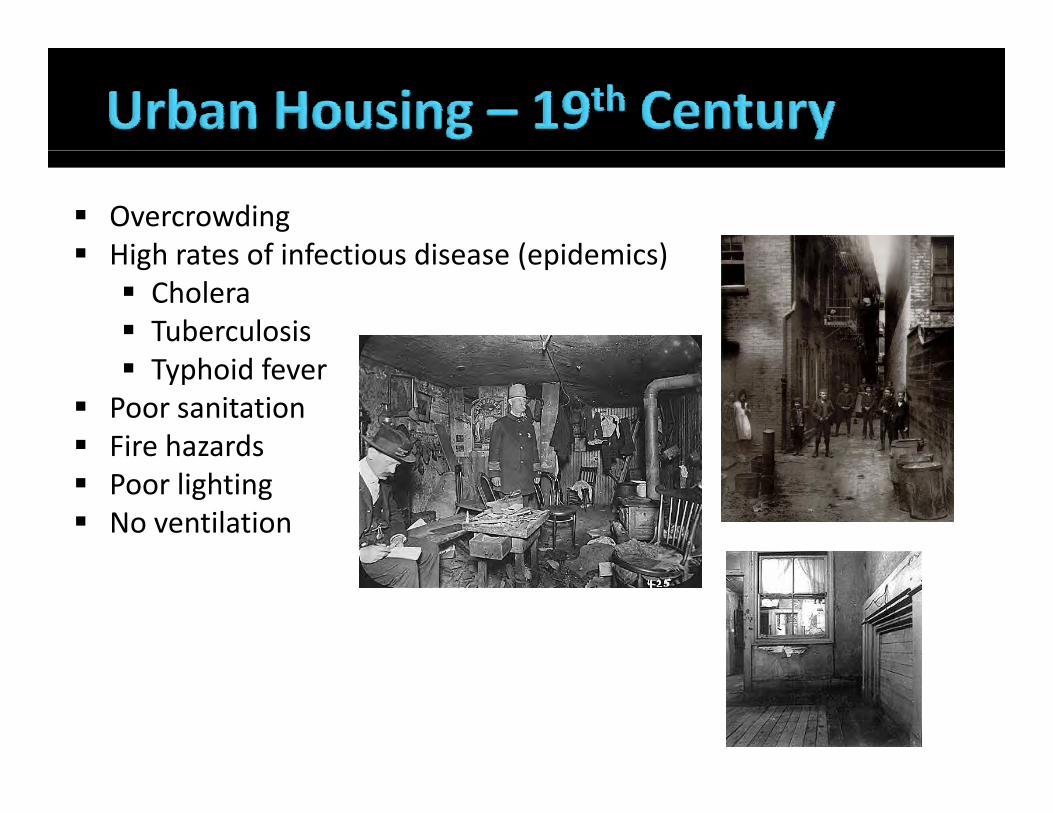
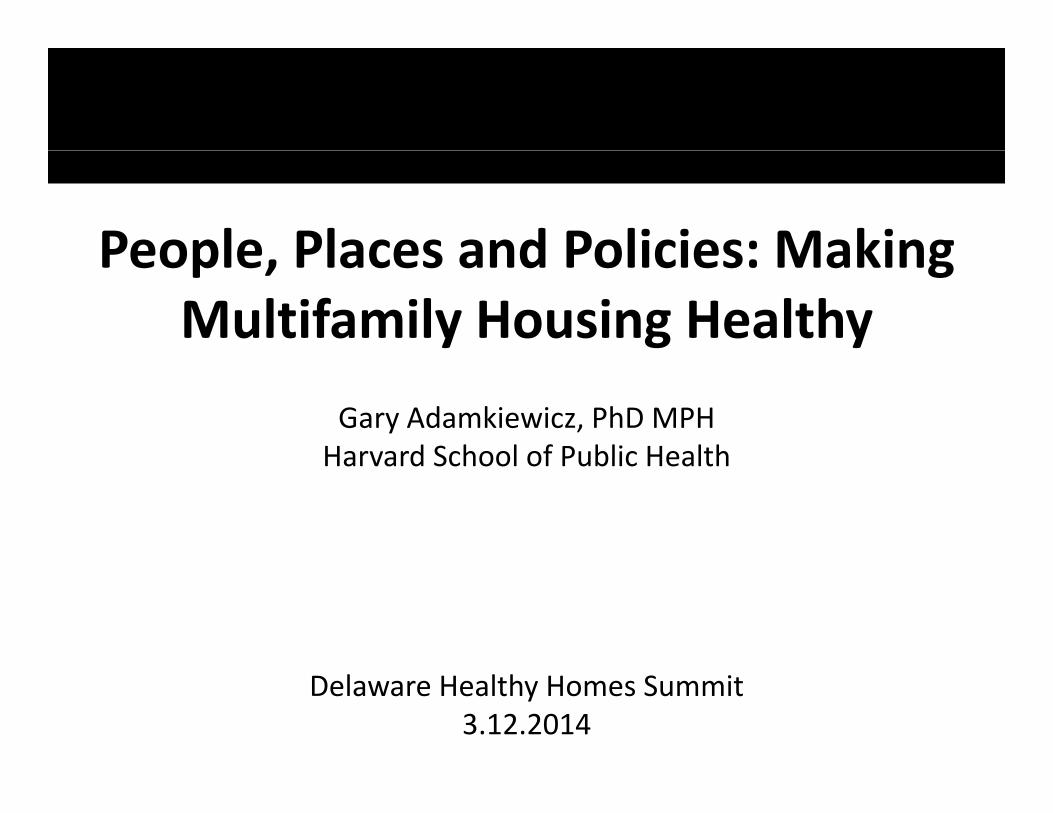
Overcrowding High rates of infectious disease (epidemics) High rates of infectious disease (epidemics) Cholera Tuberculosis Typhoid fever
Poor sanitation Fire hazards Poor lighting No ventilation

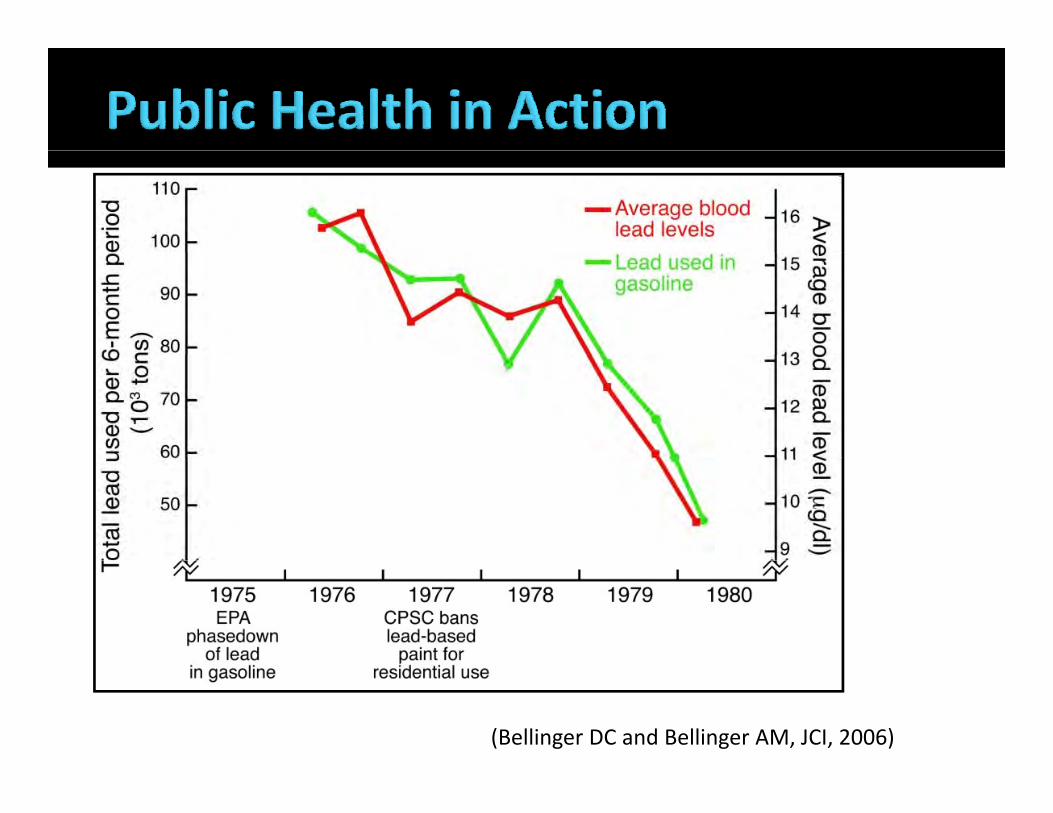
(Bellinger DC and Bellinger AM, JCI, 2006)
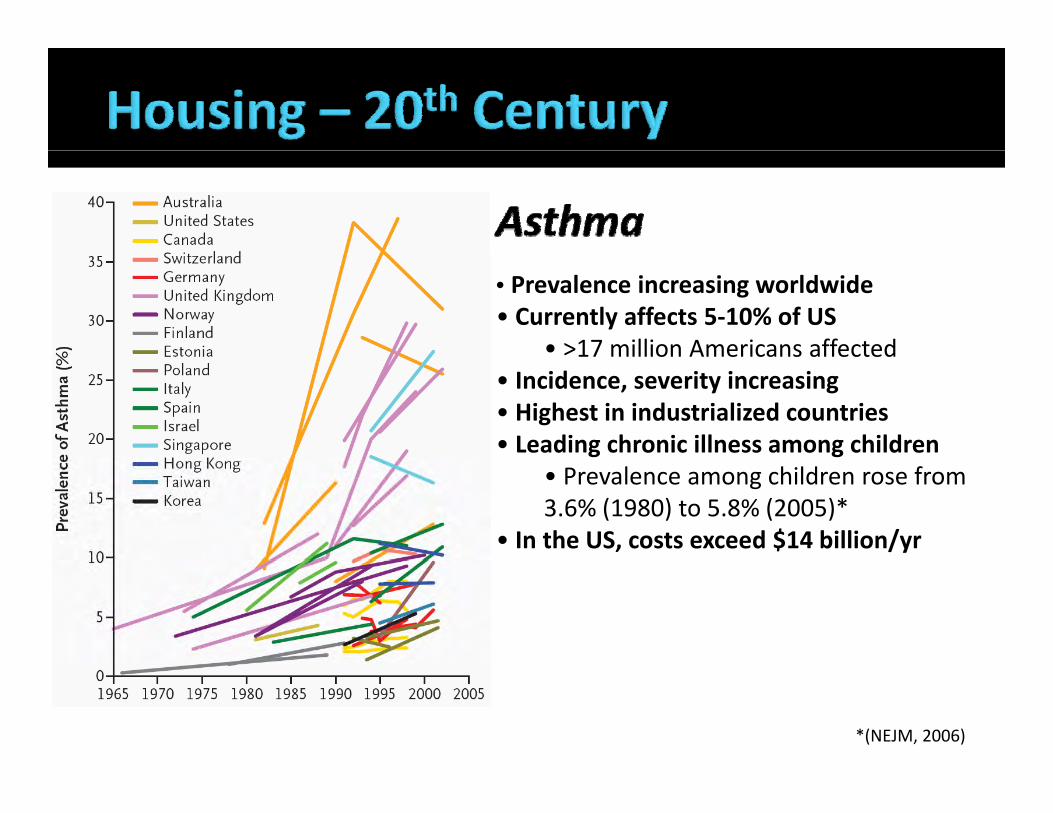
• Prevalence increasing worldwide• Currently affects 5‐10% of US
• >17 million Americans affected17 million Americans affected• Incidence, severity increasing• Highest in industrialized countries• Leading chronic illness among children
• Prevalence among children rose from 3.6% (1980) to 5.8% (2005)*
• In the US, costs exceed $14 billion/yr
*(NEJM, 2006)
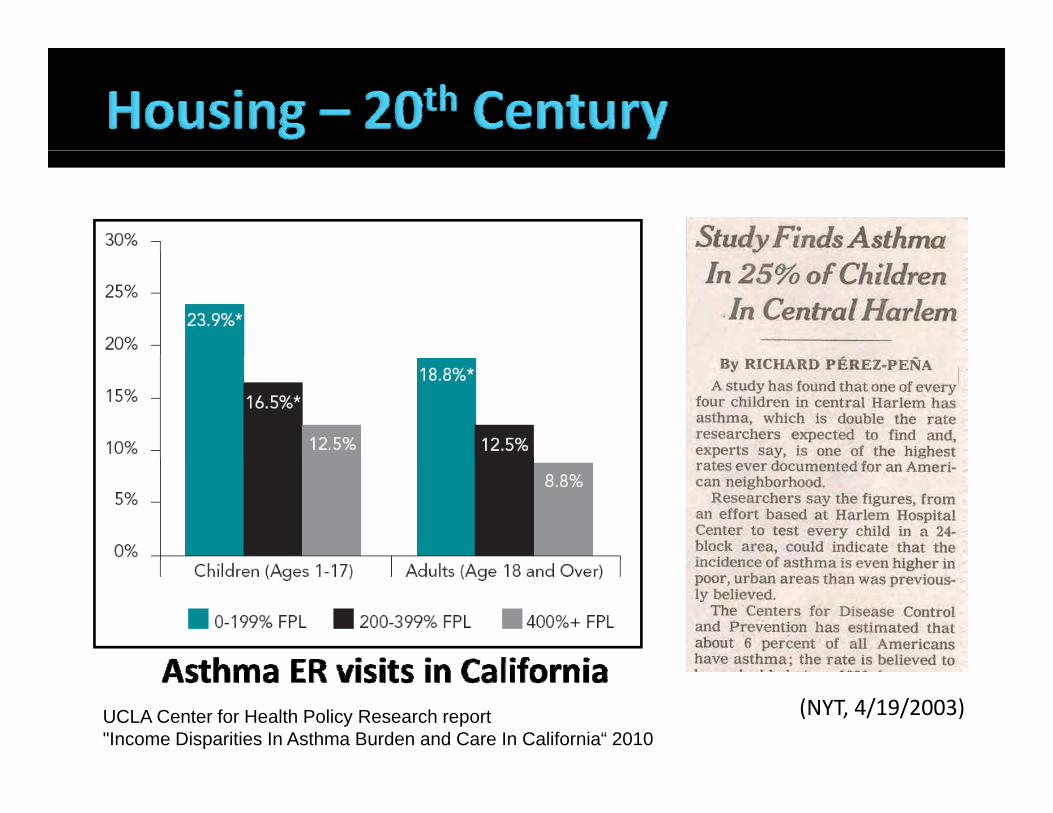
(NYT, 4/19/2003)UCLA Center for Health Policy Research report"Income Disparities In Asthma Burden and Care In California“ 2010
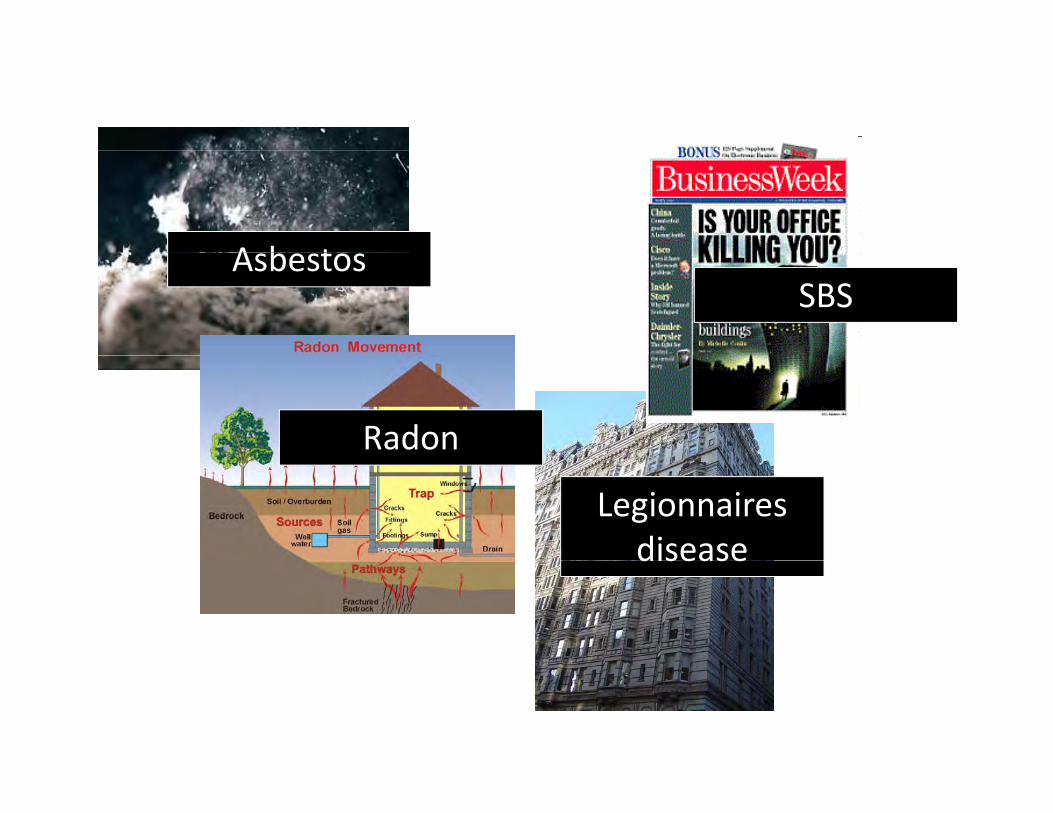
A b tAsbestosSBS
Radon
Legionnairesdiseasedisease

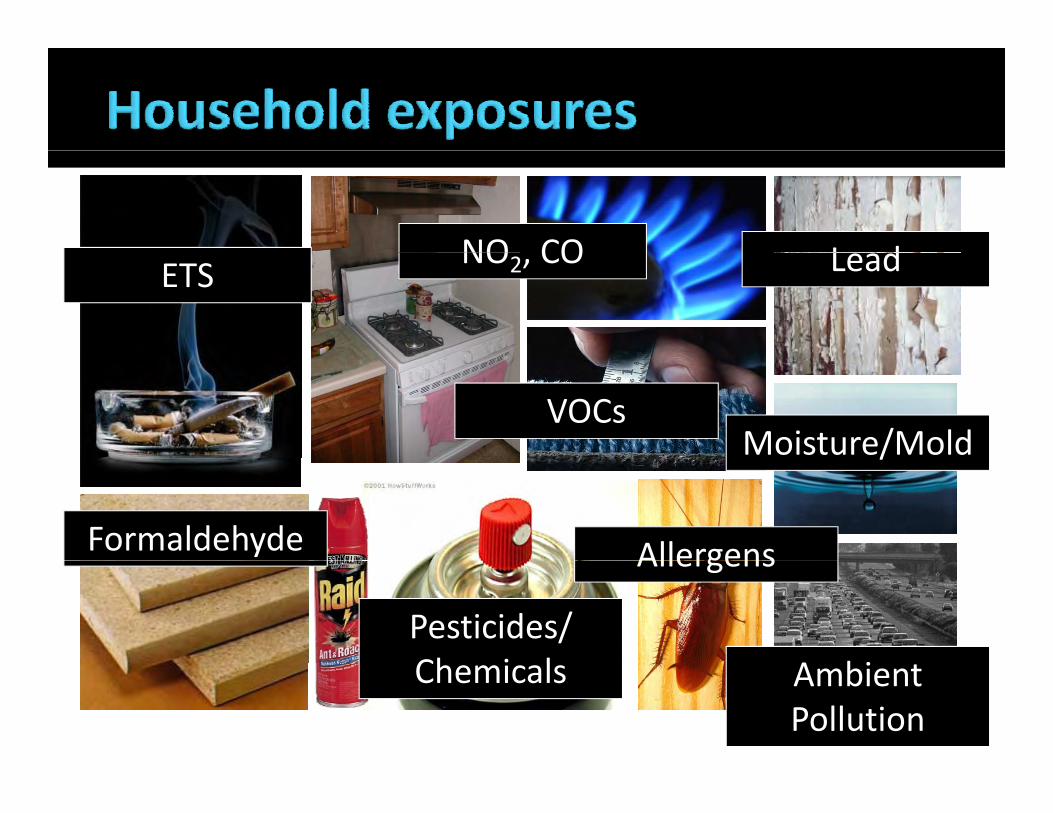
NO CO L dETSNO2, CO Lead
Moisture/MoldVOCs
/
Formaldehyde Allergens
Pesticides/Ch i l
Allergens
A biChemicals AmbientPollution
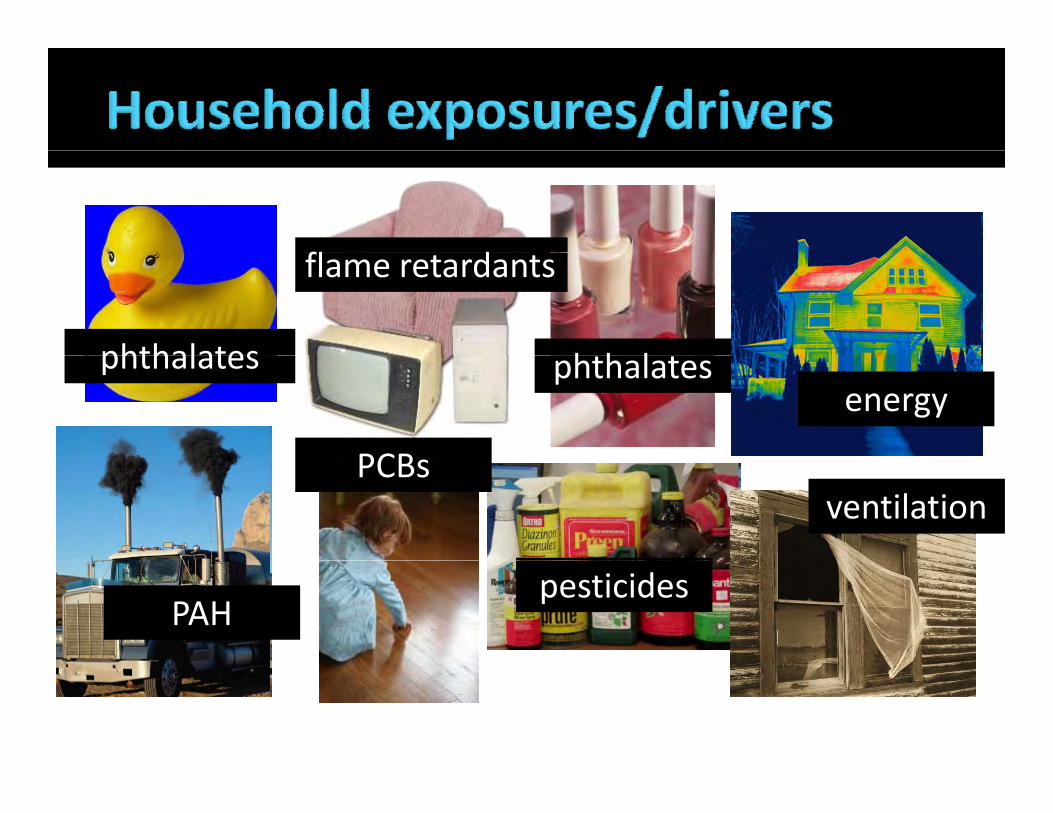
fl dflame retardants
h h lphthalates phthalatesphthalates
PCB
energy
PCBsventilation
pesticidesPAH
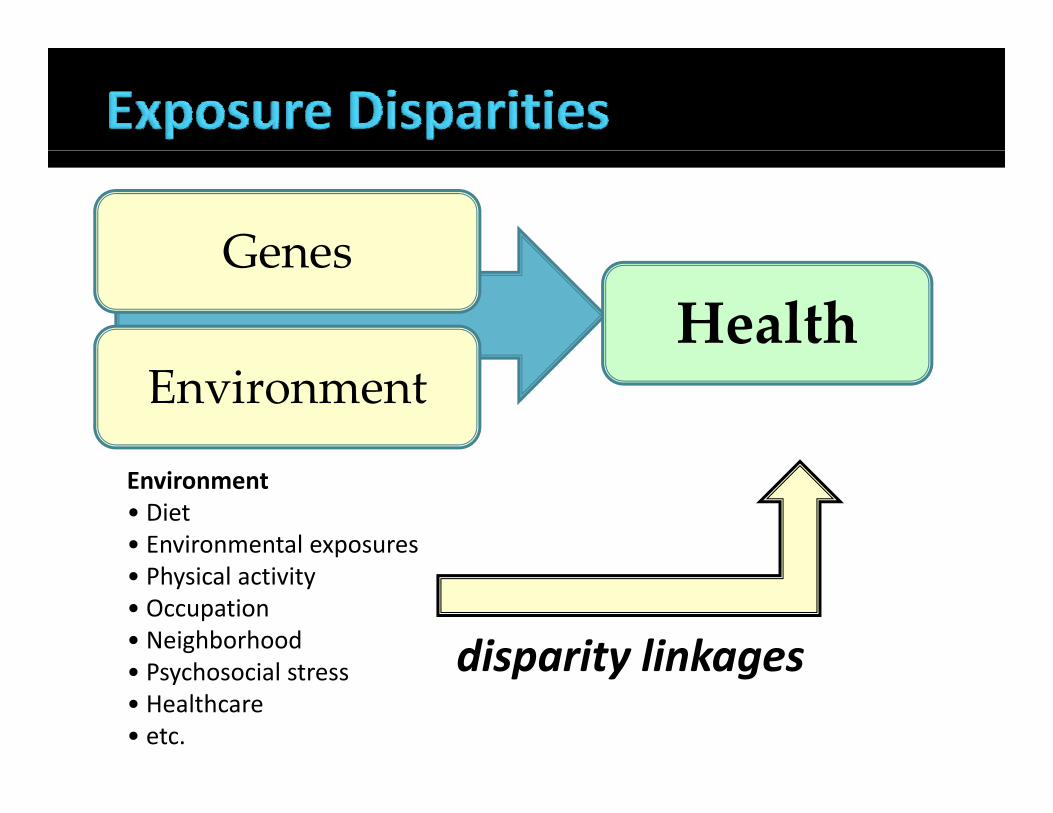
GenesHealth
Genes
Environment
Environment• Diet• Environmental exposures• Physical activity• Occupation• Neighborhood
h i l disparity linkages• Psychosocial stress• Healthcare • etc.
disparity linkages

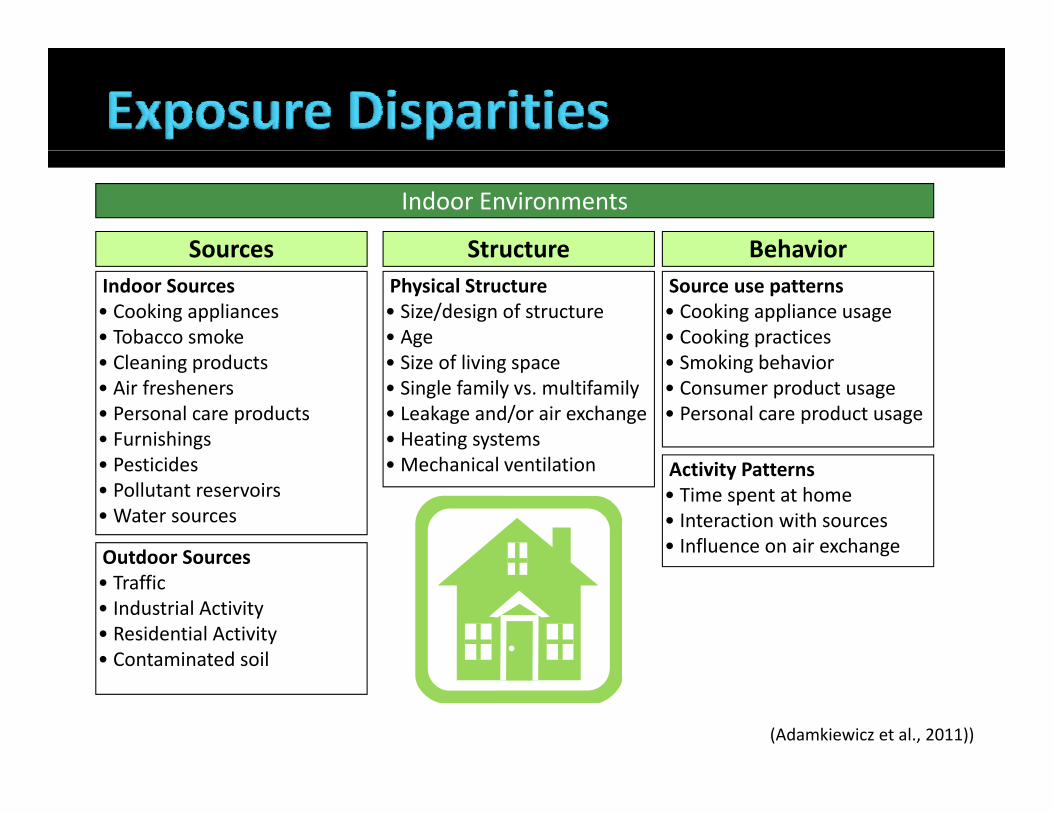
Sources Structure Behavior
Indoor Environments
Physical Structure • Size/design of structure• AgeSi f li i
Indoor Sources• Cooking appliances• Tobacco smokeCl i d
Source use patterns• Cooking appliance usage• Cooking practicesS ki b h i
Sources Structure Behavior
• Size of living space• Single family vs. multifamily• Leakage and/or air exchange • Heating systemsM h i l il i
• Cleaning products• Air fresheners• Personal care products• FurnishingsP i id
• Smoking behavior• Consumer product usage• Personal care product usage
• Mechanical ventilation• Pesticides• Pollutant reservoirs• Water sources
Activity Patterns• Time spent at home• Interaction with sources• Influence on air exchangeOutdoor SourcesOutdoor Sources
• Traffic• Industrial Activity• Residential Activity• Contaminated soilContaminated soil
(Adamkiewicz et al., 2011))
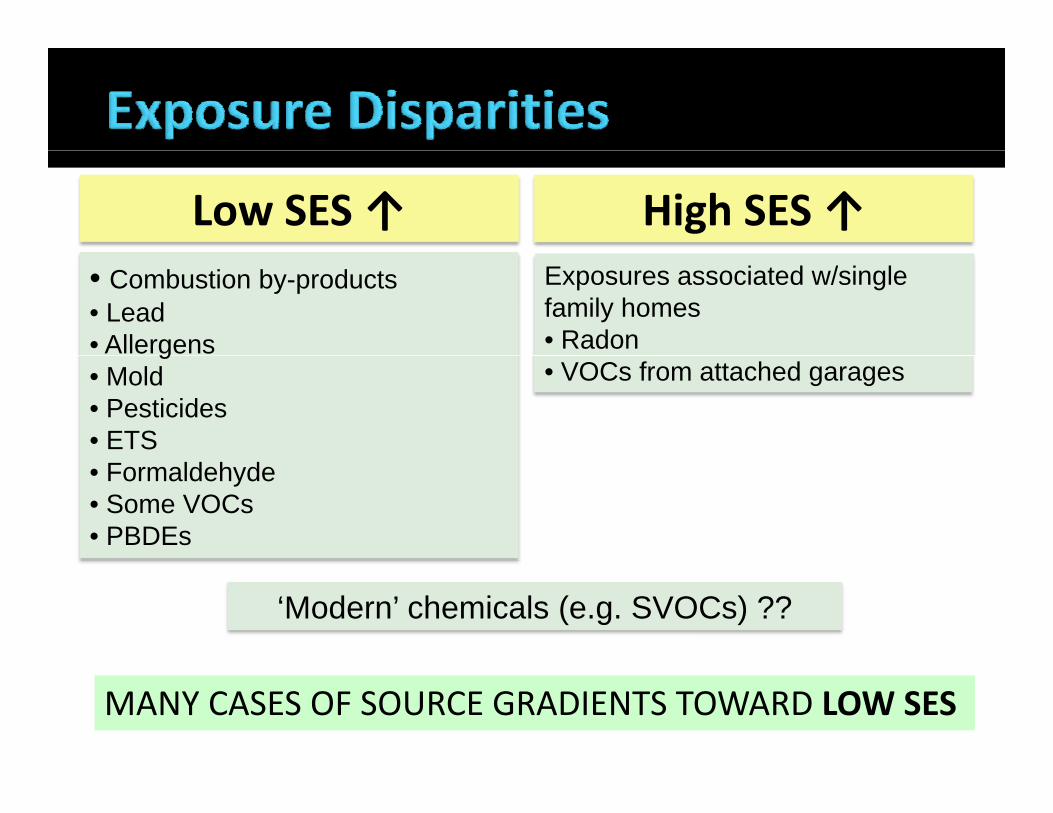
Low SES ↑ High SES ↑• Combustion by-products• Lead• Allergens
Exposures associated w/single family homes• Radong
• Mold• Pesticides• ETS
• VOCs from attached garages
• Formaldehyde• Some VOCs• PBDEs
‘Modern’ chemicals (e.g. SVOCs) ??
MANY CASES OF SOURCE GRADIENTS TOWARD LOW SES
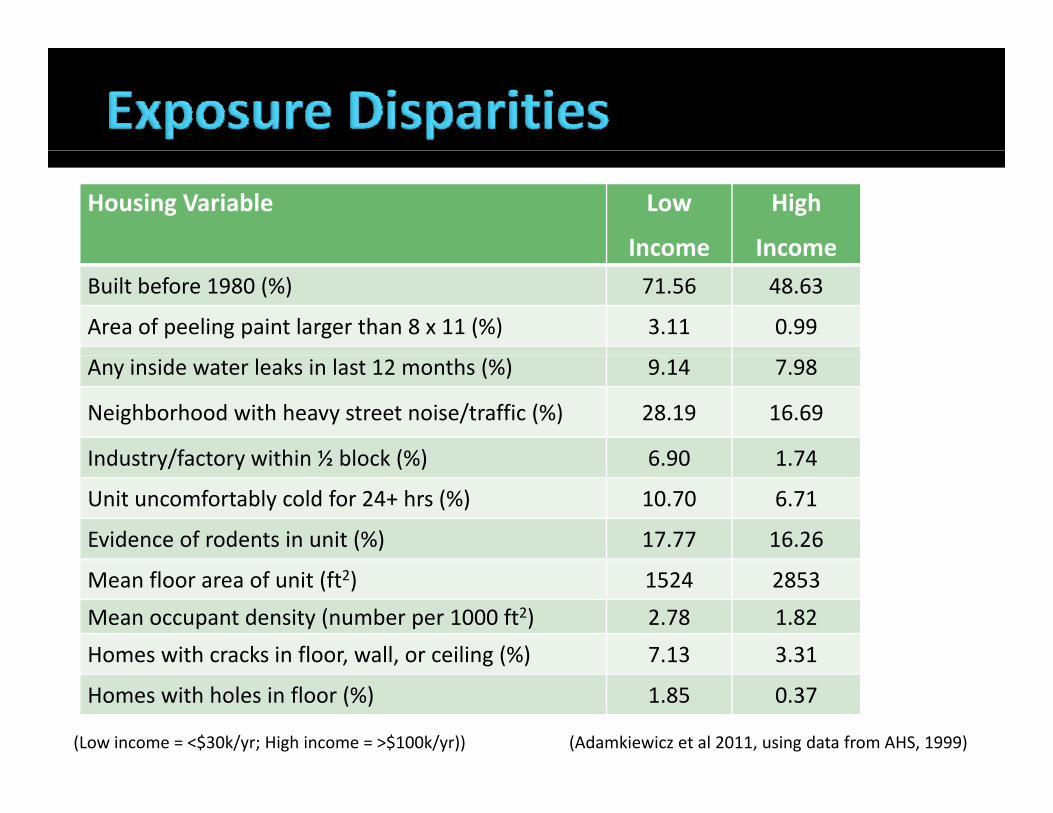
Housing Variable Low
Income
High
IncomeIncome IncomeBuilt before 1980 (%) 71.56 48.63
Area of peeling paint larger than 8 x 11 (%) 3.11 0.99
Any inside water leaks in last 12 months (%) 9.14 7.98
Neighborhood with heavy street noise/traffic (%) 28.19 16.69
Industry/factory within ½ block (%) 6 90 1 74Industry/factory within ½ block (%) 6.90 1.74
Unit uncomfortably cold for 24+ hrs (%) 10.70 6.71
Evidence of rodents in unit (%) 17.77 16.26
Mean floor area of unit (ft2) 1524 2853
Mean occupant density (number per 1000 ft2) 2.78 1.82
Homes with cracks in floor, wall, or ceiling (%) 7.13 3.31, , g ( )
Homes with holes in floor (%) 1.85 0.37
(Adamkiewicz et al 2011, using data from AHS, 1999)(Low income = <$30k/yr; High income = >$100k/yr))
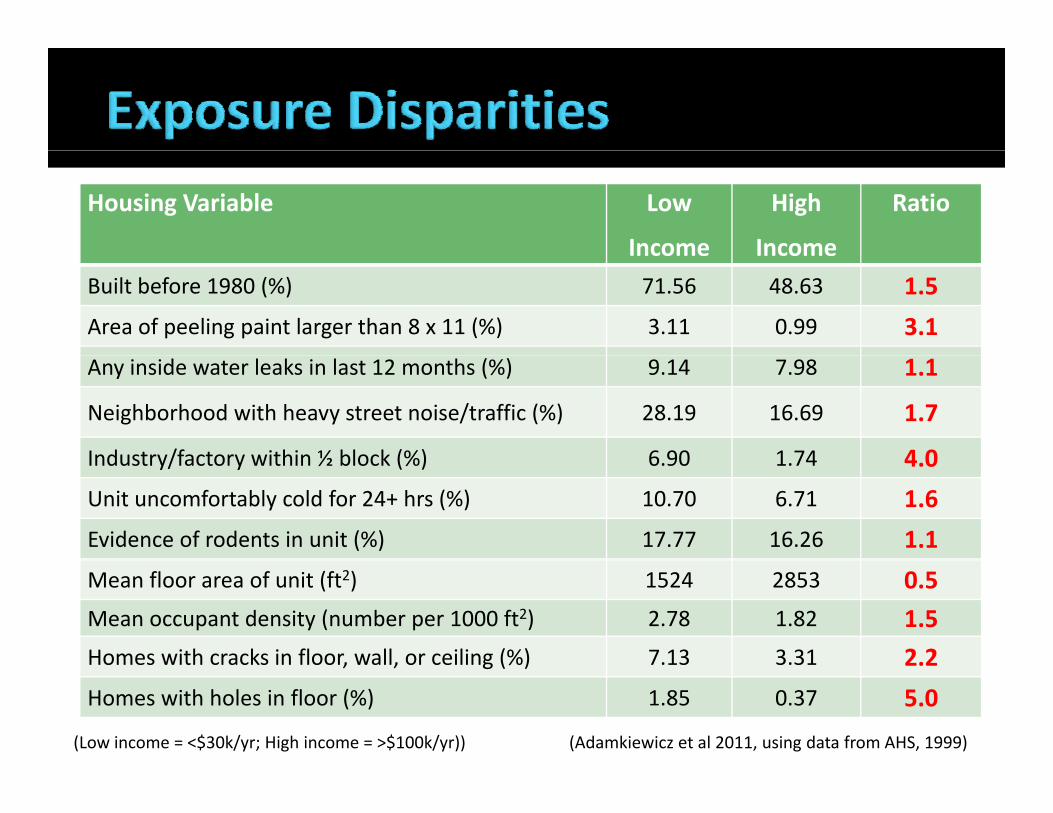
Housing Variable Low
Income
High
Income
Ratio
Income IncomeBuilt before 1980 (%) 71.56 48.63 1.5
Area of peeling paint larger than 8 x 11 (%) 3.11 0.99 3.1
Any inside water leaks in last 12 months (%) 9.14 7.98 1.1
Neighborhood with heavy street noise/traffic (%) 28.19 16.69 1.7
Industry/factory within ½ block (%) 6 90 1 74 4 0Industry/factory within ½ block (%) 6.90 1.74 4.0
Unit uncomfortably cold for 24+ hrs (%) 10.70 6.71 1.6
Evidence of rodents in unit (%) 17.77 16.26 1.1
Mean floor area of unit (ft2) 1524 2853 0.5Mean occupant density (number per 1000 ft2) 2.78 1.82 1.5Homes with cracks in floor, wall, or ceiling (%) 7.13 3.31 2.2Homes with cracks in floor, wall, or ceiling (%) 7.13 3.31 2.2
Homes with holes in floor (%) 1.85 0.37 5.0
(Adamkiewicz et al 2011, using data from AHS, 1999)(Low income = <$30k/yr; High income = >$100k/yr))

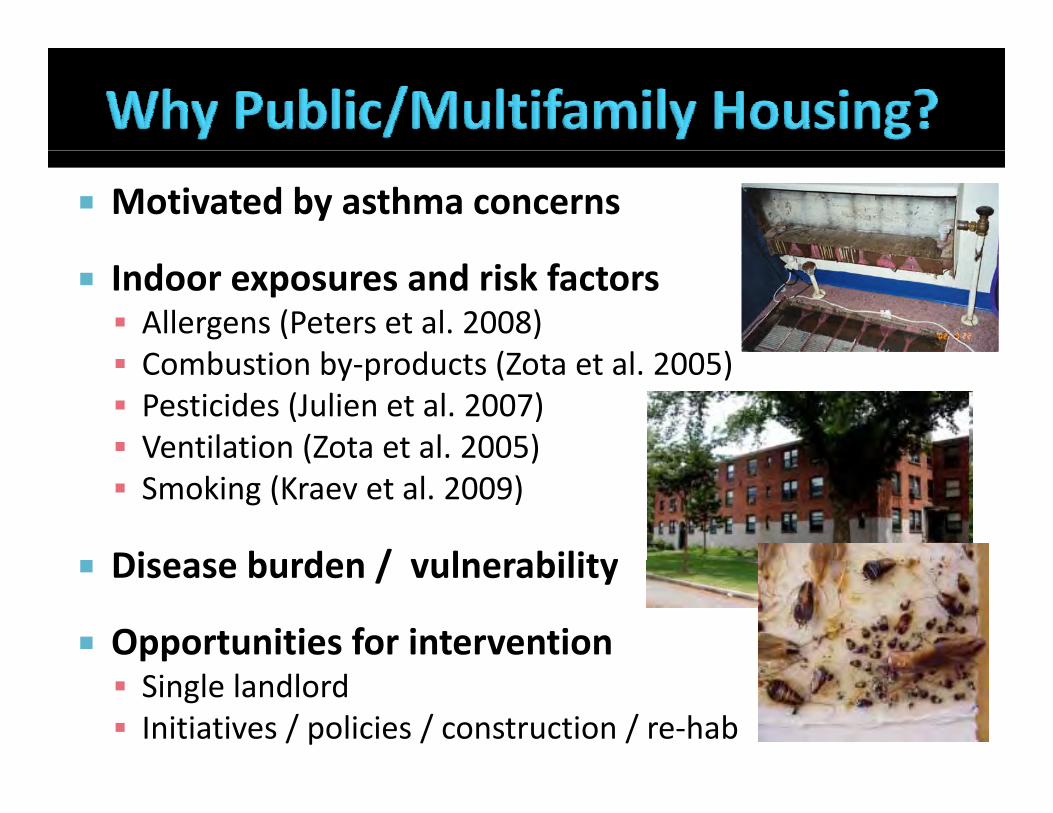
Motivated by asthma concerns
Indoor exposures and risk factors Allergens (Peters et al. 2008)C b ti b d t (Z t t l 2005) Combustion by‐products (Zota et al. 2005)
Pesticides (Julien et al. 2007) Ventilation (Zota et al. 2005)e a o ( o a e a 005) Smoking (Kraev et al. 2009)
Disease burden / vulnerability Disease burden / vulnerability
Opportunities for intervention Single landlord Initiatives / policies / construction / re‐hab
4‐yr National Cancer Institute study (PI: G. Sorensen)
OVERALL GOALS OF STUDYOVERALL GOALS OF STUDY To study social and physical determinants of cancer risk‐related behavior among residents of low‐income housing
THIS ANALYSIS To understand the prevalence of key environmental hazards
ithi l i h i i th B twithin low‐income housing in the Boston area To understand the extent of clustering of these hazards To examine associations with self‐reported health among residents of these housing units
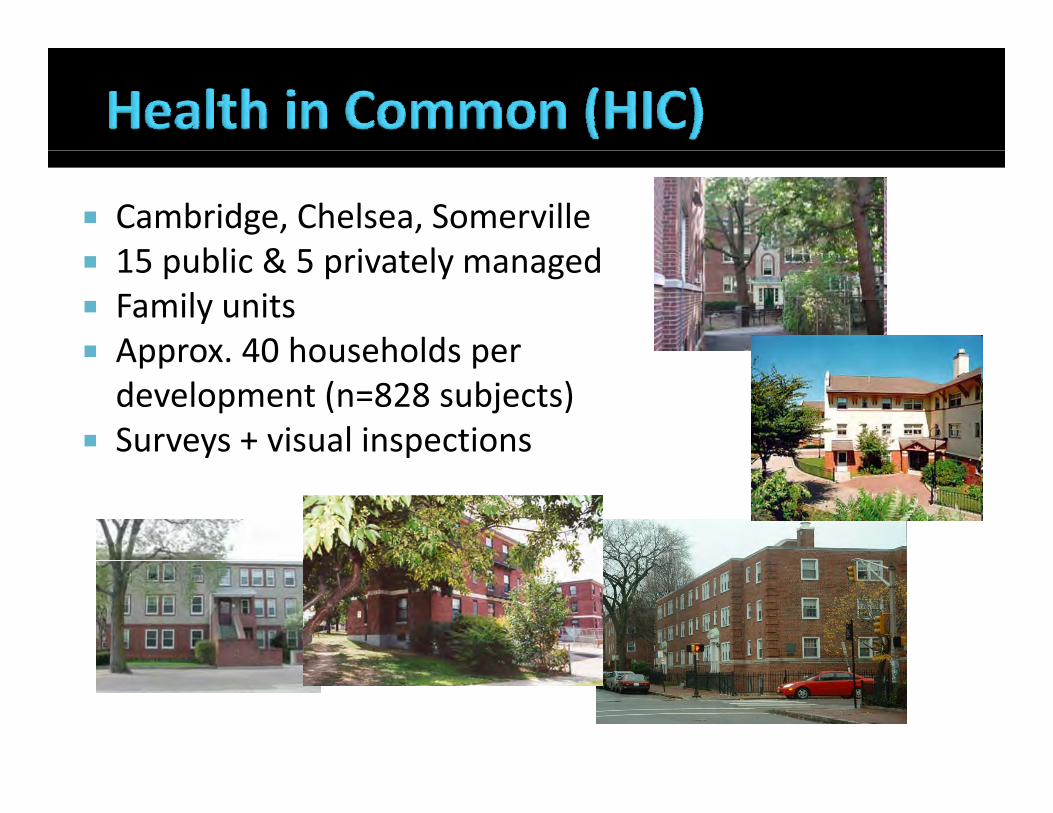
Cambridge, Chelsea, Somerville15 bli & 5 i t l d 15 public & 5 privately managed
Family units Approx 40 households per Approx. 40 households per development (n=828 subjects)
Surveys + visual inspectionsy p
Characteristic n (%) Characteristic n (%)
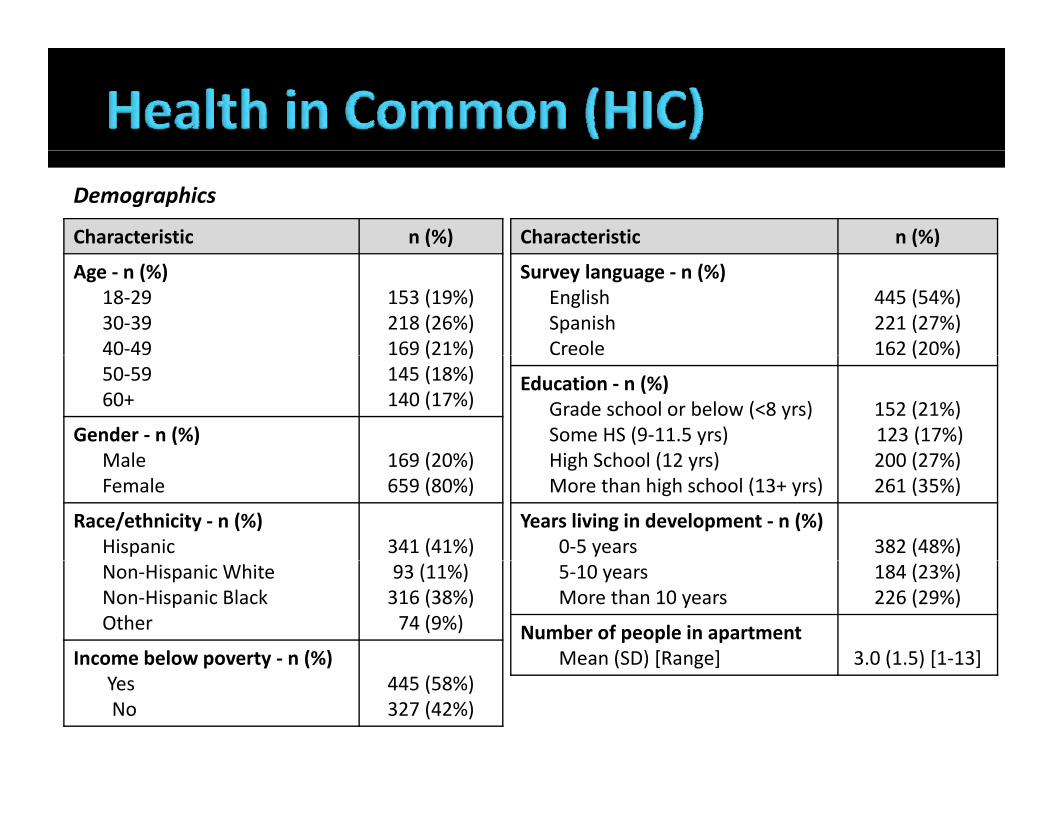
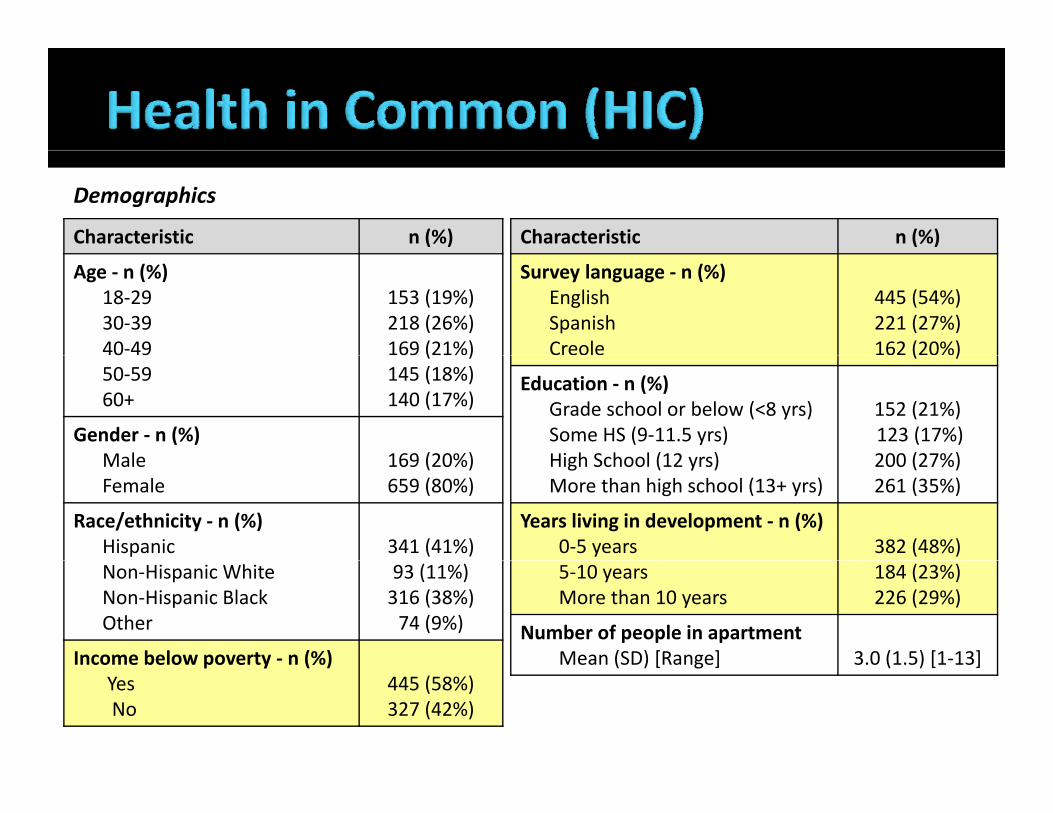
Demographics
Age ‐ n (%)18‐29 30‐3940‐49
153 (19%)218 (26%)169 (21%)
Survey language ‐ n (%)EnglishSpanishCreole
445 (54%)221 (27%)162 (20%)
50‐5960+
( )145 (18%)140 (17%)
Gender ‐ n (%)Male 169 (20%)
( )
Education ‐ n (%)Grade school or below (<8 yrs) Some HS (9‐11.5 yrs) High School (12 yrs)
152 (21%)123 (17%)200 (27%)Male
Female 169 (20%)659 (80%)
Race/ethnicity ‐ n (%)Hispanic 341 (41%)
High School (12 yrs) More than high school (13+ yrs)
200 (27%)261 (35%)
Years living in development ‐ n (%)0‐5 years 382 (48%)
Non‐Hispanic White Non‐Hispanic Black Other
93 (11%)316 (38%)74 (9%)
Income below poverty ‐ n (%)
5‐10 yearsMore than 10 years
184 (23%)226 (29%)
Number of people in apartmentMean (SD) [Range] 3.0 (1.5) [1‐13]Income below poverty n (%)
YesNo
445 (58%)327 (42%)
Mean (SD) [Range] 3.0 (1.5) [1 13]
Characteristic n (%) Characteristic n (%)
Demographics
Age ‐ n (%)18‐29 30‐3940‐49
153 (19%)218 (26%)169 (21%)
Survey language ‐ n (%)EnglishSpanishCreole
445 (54%)221 (27%)162 (20%)
50‐5960+
( )145 (18%)140 (17%)
Gender ‐ n (%)Male 169 (20%)
( )
Education ‐ n (%)Grade school or below (<8 yrs) Some HS (9‐11.5 yrs) High School (12 yrs)
152 (21%)123 (17%)200 (27%)Male
Female 169 (20%)659 (80%)
Race/ethnicity ‐ n (%)Hispanic 341 (41%)
High School (12 yrs) More than high school (13+ yrs)
200 (27%)261 (35%)
Years living in development ‐ n (%)0‐5 years 382 (48%)
Non‐Hispanic White Non‐Hispanic Black Other
93 (11%)316 (38%)74 (9%)
Income below poverty ‐ n (%)
5‐10 yearsMore than 10 years
184 (23%)226 (29%)
Number of people in apartmentMean (SD) [Range] 3.0 (1.5) [1‐13]Income below poverty n (%)
YesNo
445 (58%)327 (42%)
Mean (SD) [Range] 3.0 (1.5) [1 13]
Characteristic n (%)
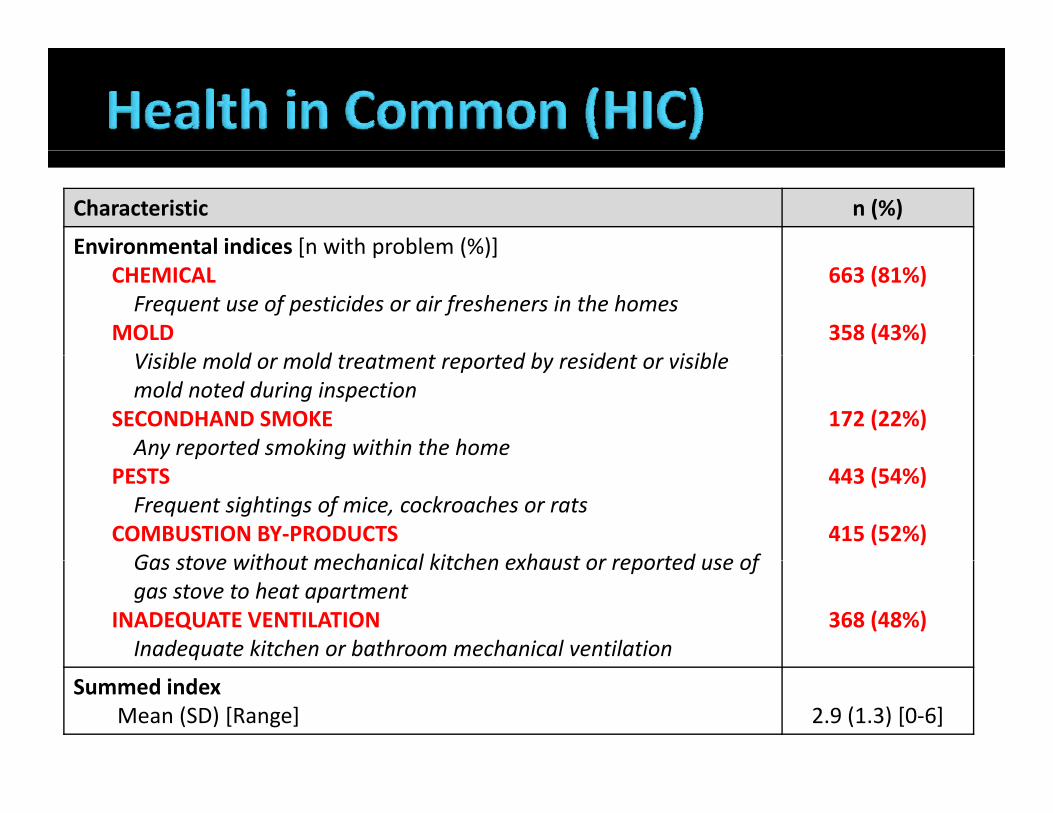
Environmental indices [n with problem (%)]Environmental indices [n with problem (%)]CHEMICALFrequent use of pesticides or air fresheners in the homes
MOLDVi ibl ld ld t t t t d b id t i ibl
663 (81%)
358 (43%)Visible mold or mold treatment reported by resident or visiblemold noted during inspection
SECONDHAND SMOKEAny reported smoking within the home
172 (22%)y p g
PESTSFrequent sightings of mice, cockroaches or rats
COMBUSTION BY‐PRODUCTSGas stove without mechanical kitchen exhaust or reported use of
443 (54%)
415 (52%)Gas stove without mechanical kitchen exhaust or reported use of gas stove to heat apartment
INADEQUATE VENTILATIONInadequate kitchen or bathroom mechanical ventilation
368 (48%)
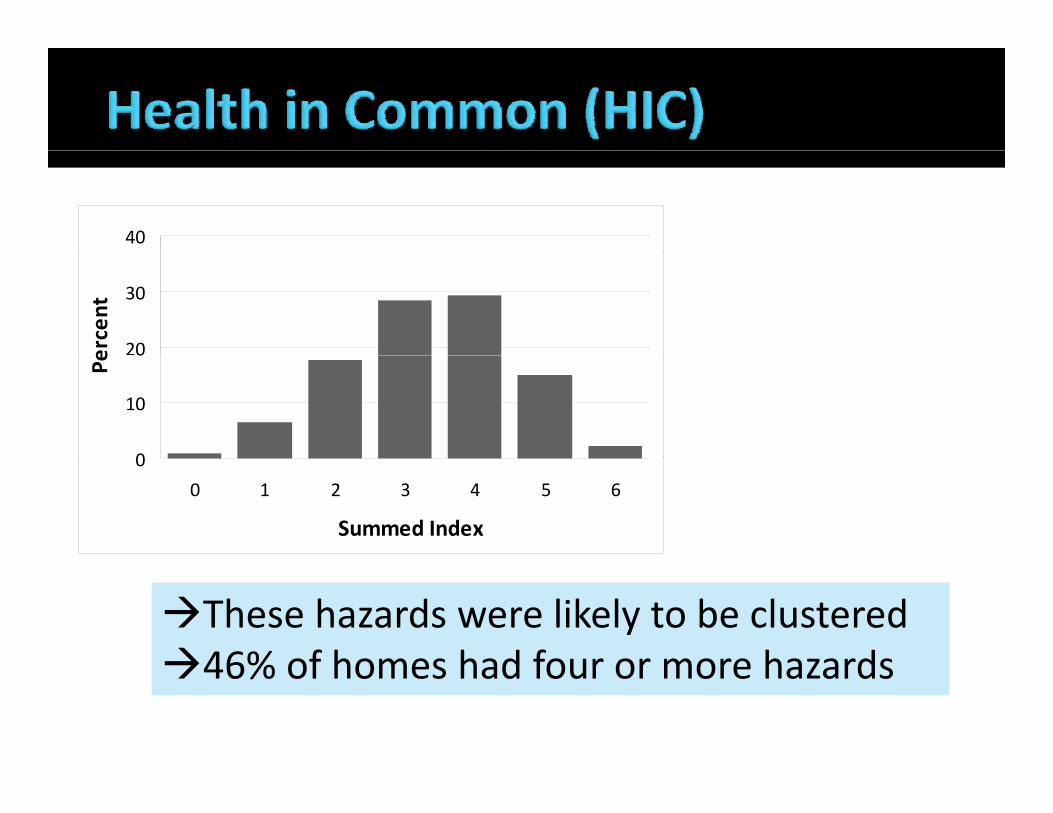
Summed indexMean (SD) [Range] 2.9 (1.3) [0‐6]
40
20
30
ercent
0
10
0
Pe
0
0 1 2 3 4 5 6
Summed Index
These hazards were likely to be clustered46% of homes had four or more hazards46% of homes had four or more hazards

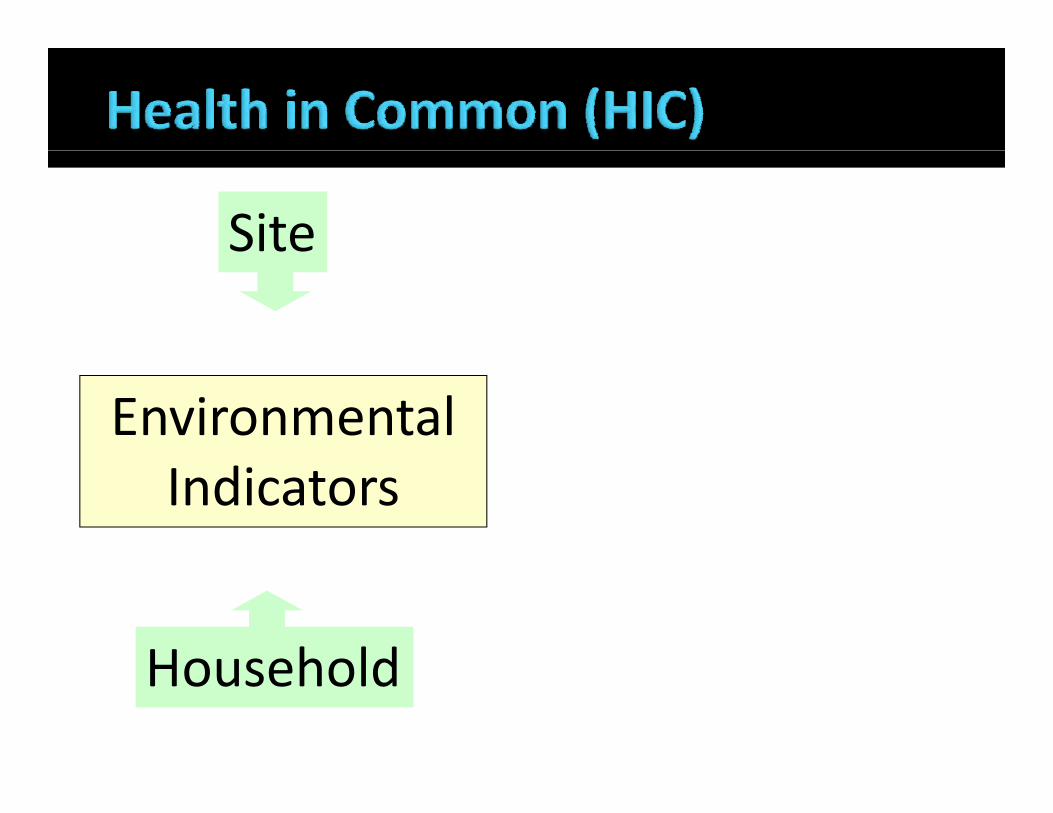
Site
Environmental Indicators
HouseholdHousehold
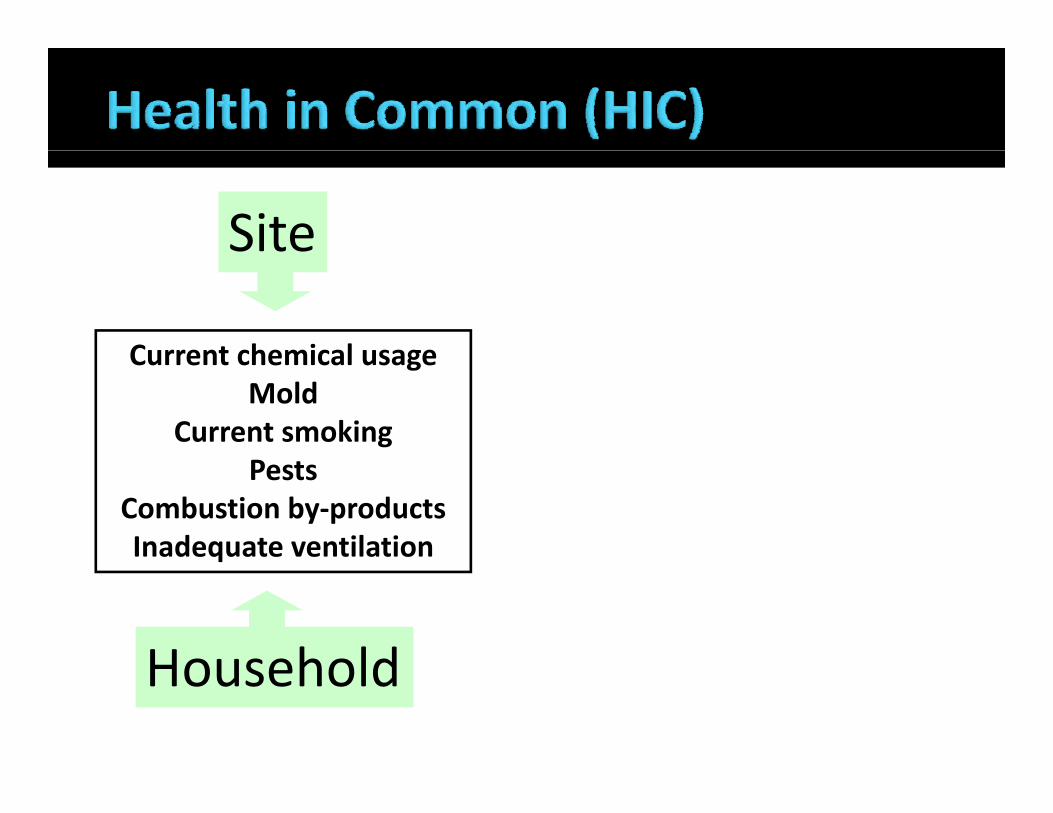
Site
Current chemical usageCurrent chemical usageMold
Current smokingPests
Combustion by‐productsInadequate ventilation
Household
q
Household
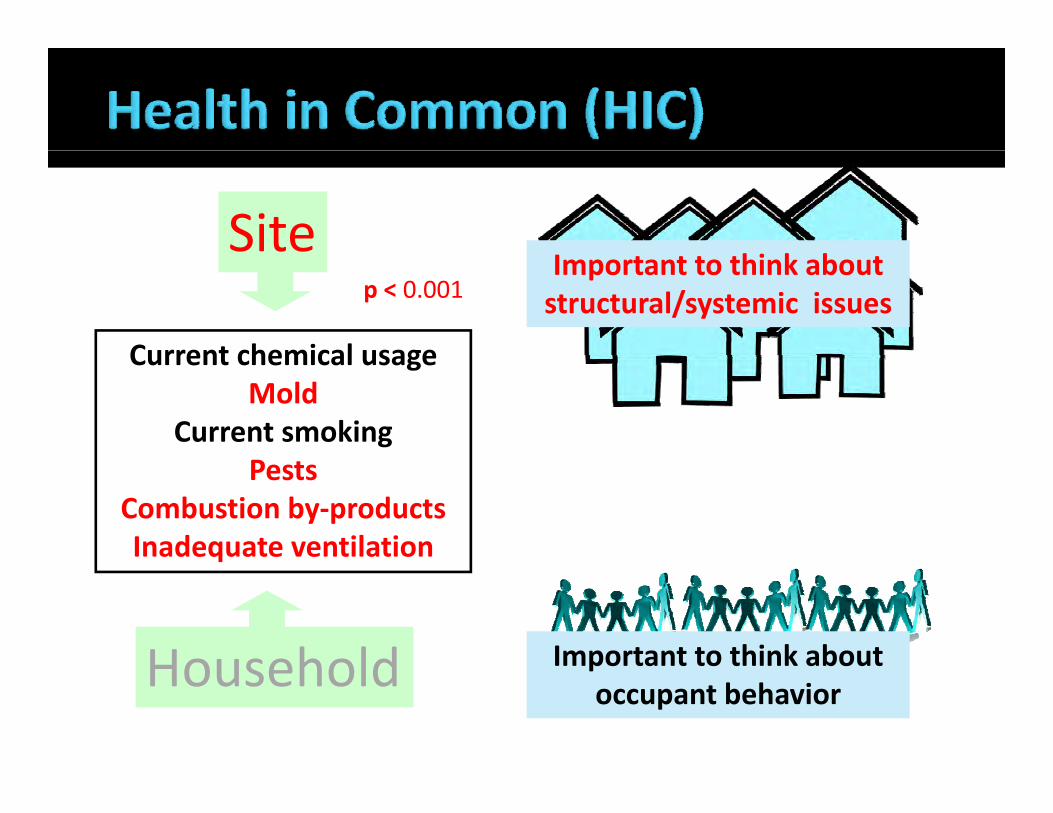
Site
Current chemical usage
p < 0.001Important to think about structural/systemic issues
Current chemical usageMold
Current smokingPests
Combustion by‐productsInadequate ventilation
Household
q
Important to think aboutHousehold Important to think about occupant behavior
Site
Environmental Indicators
HouseholdHousehold
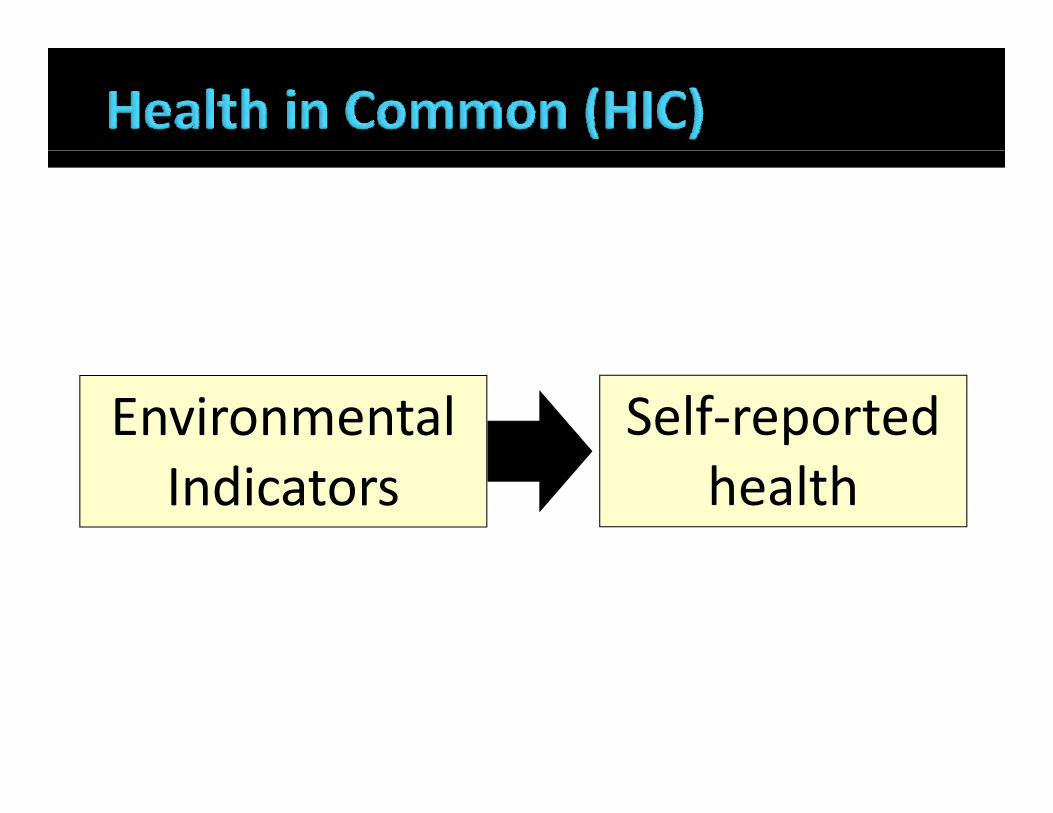
Environmental Self‐reported 0
Indicators health
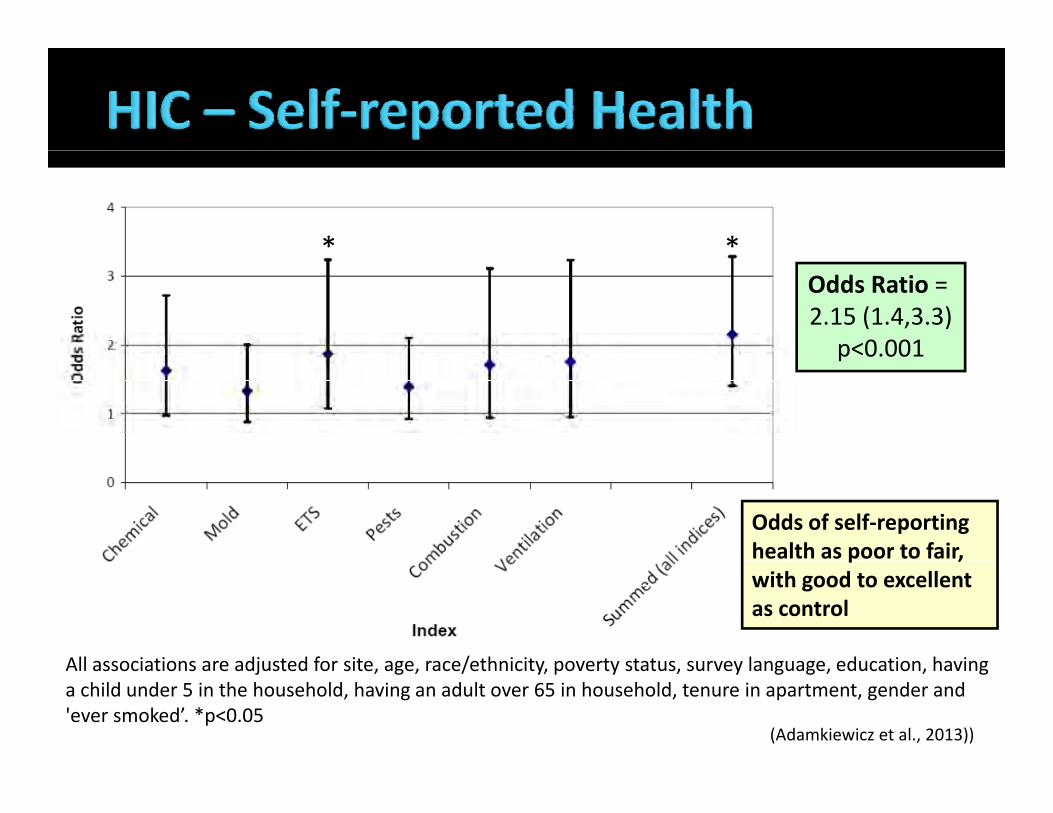
* *Odds Ratio = 2.15 (1.4,3.3)
p<0.001p 0.001
Odds of self‐reporting health as poor to fair,
All associations are adjusted for site age race/ethnicity poverty status survey language education having
p ,with good to excellent as control
All associations are adjusted for site, age, race/ethnicity, poverty status, survey language, education, having a child under 5 in the household, having an adult over 65 in household, tenure in apartment, gender and 'ever smoked’. *p<0.05
(Adamkiewicz et al., 2013))
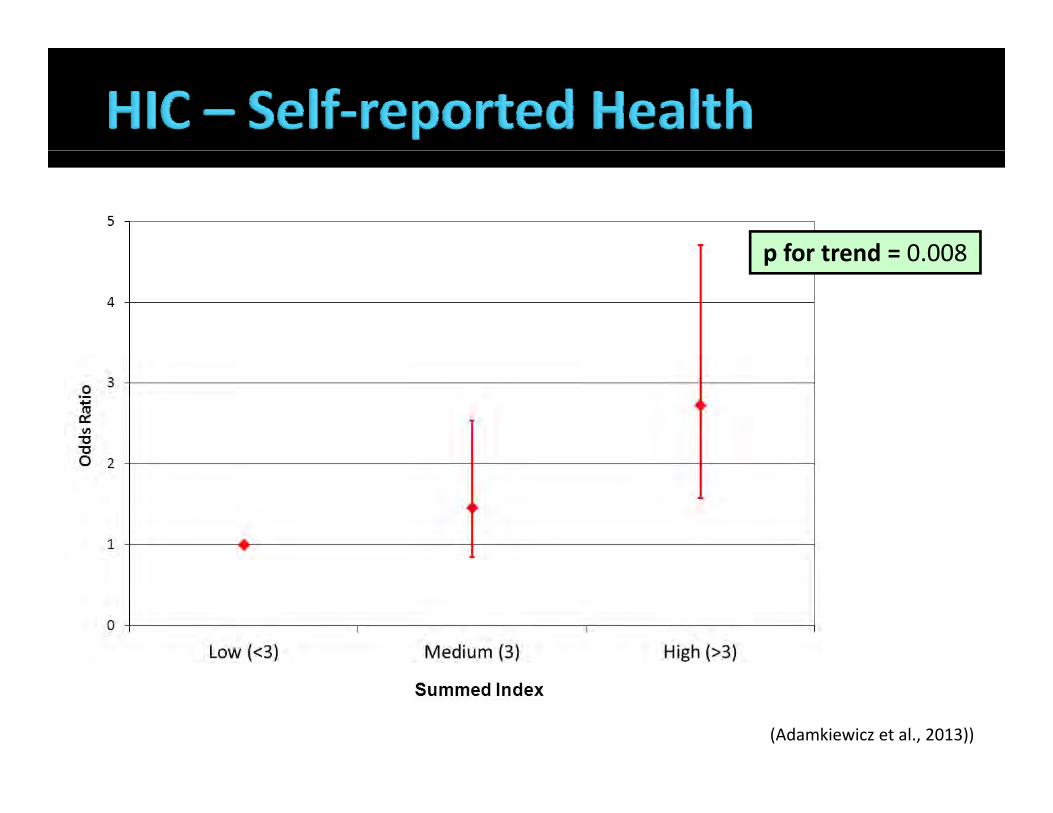
p for trend = 0 008p for trend = 0.008
(Adamkiewicz et al., 2013))

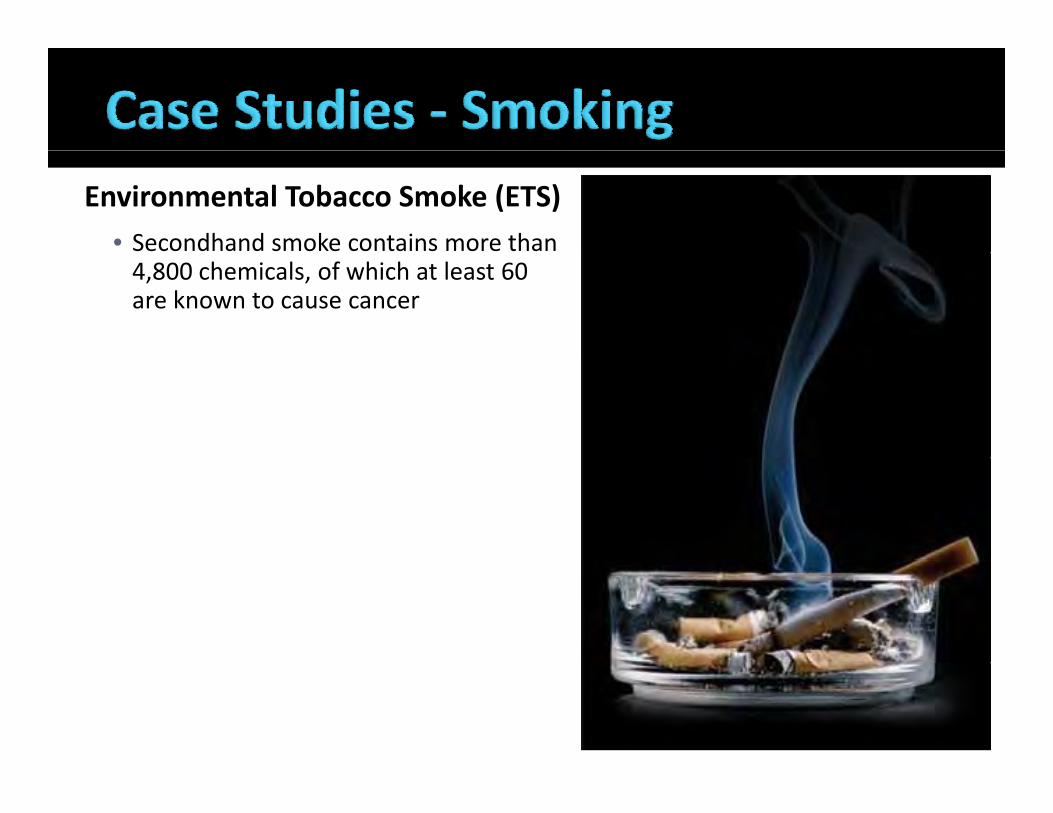
Environmental Tobacco Smoke (ETS)• Secondhand smoke contains more than 4,800 chemicals, of which at least 60 are known to cause cancer
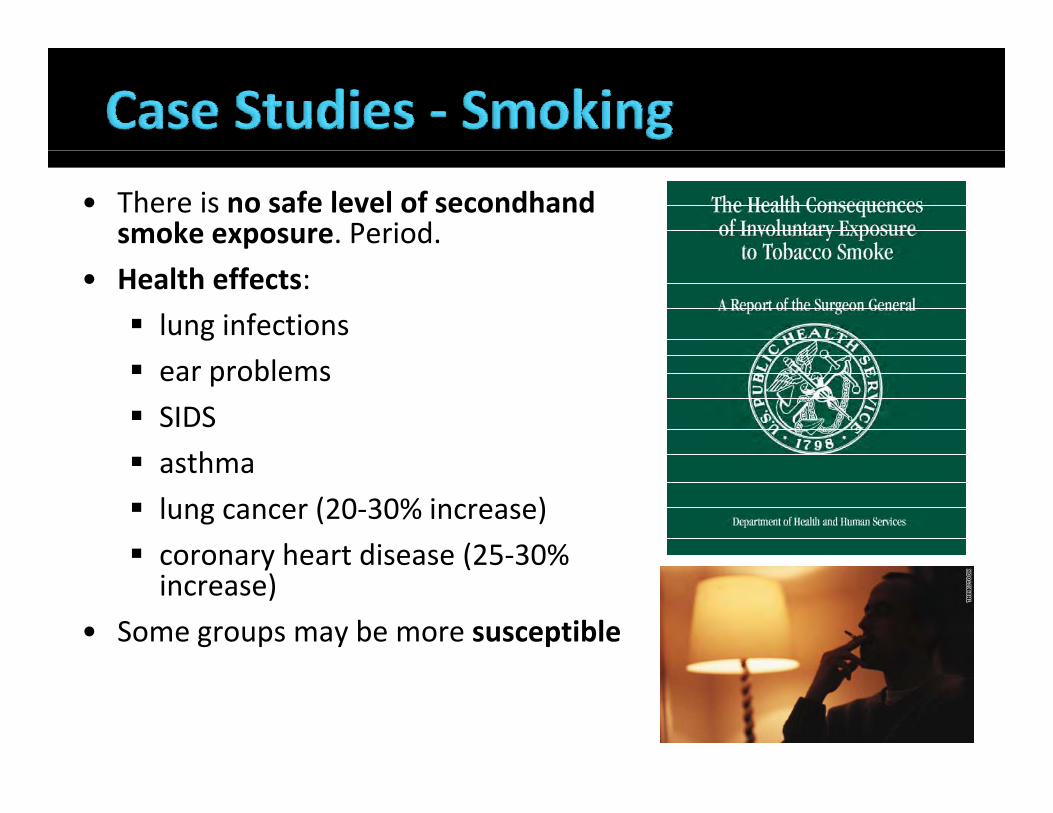
• There is no safe level of secondhand smoke exposure. Period.
• Health effects:
lung infections
ear problems
SIDS
asthma asthma
lung cancer (20‐30% increase)
coronary heart disease (25‐30%coronary heart disease (25 30% increase)
• Some groups may be more susceptible
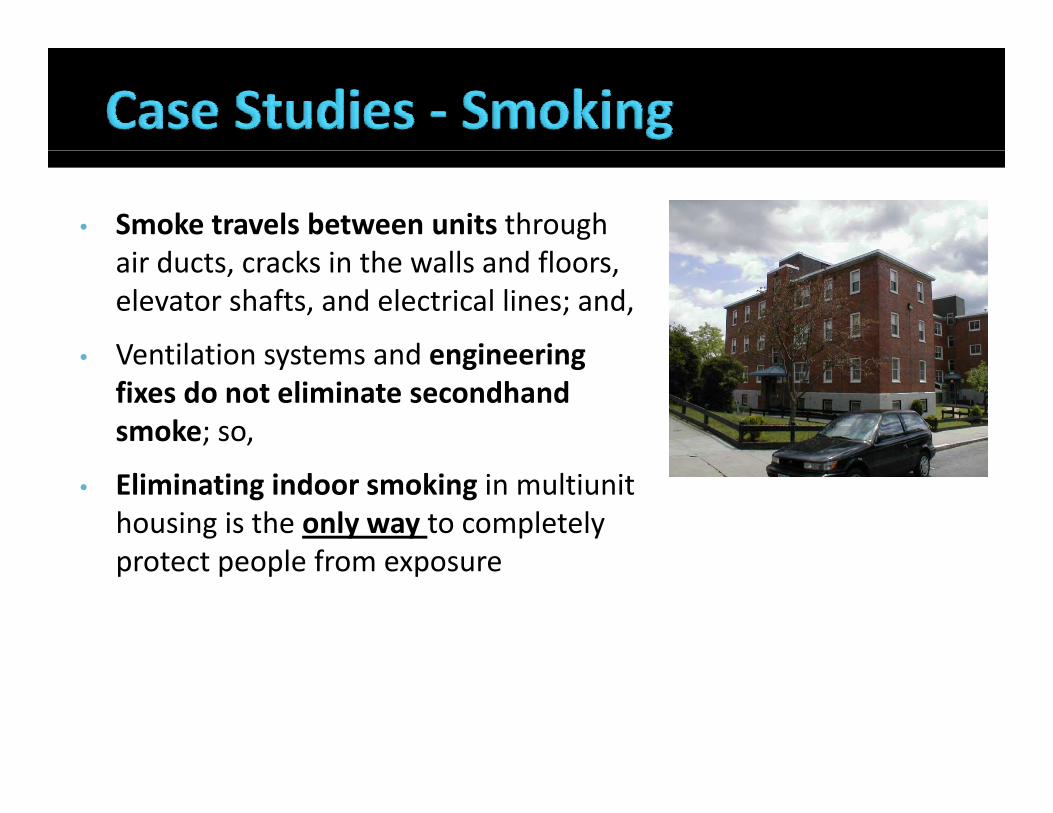
• Smoke travels between units through i d k i h ll d flair ducts, cracks in the walls and floors, elevator shafts, and electrical lines; and,
• Ventilation systems and engineering• Ventilation systems and engineering fixes do not eliminate secondhand smoke; so,
• Eliminating indoor smoking in multiunit housing is the only way to completely protect people from exposureprotect people from exposure
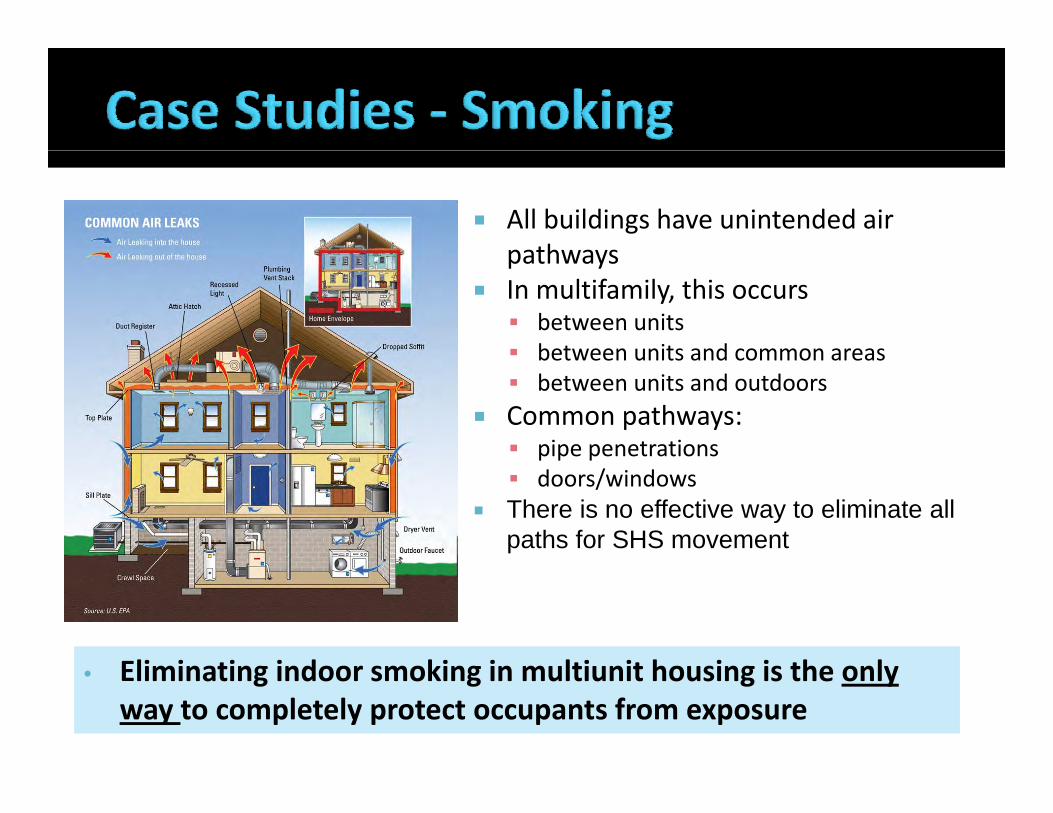
All buildings have unintended air pathwayspathways
In multifamily, this occurs between units between units and common areasbetween units and common areas between units and outdoors
Common pathways: pipe penetrationsp p p doors/windows
There is no effective way to eliminate all paths for SHS movement
Eli i ti i d ki i lti it h i i th l• Eliminating indoor smoking in multiunit housing is the only way to completely protect occupants from exposure
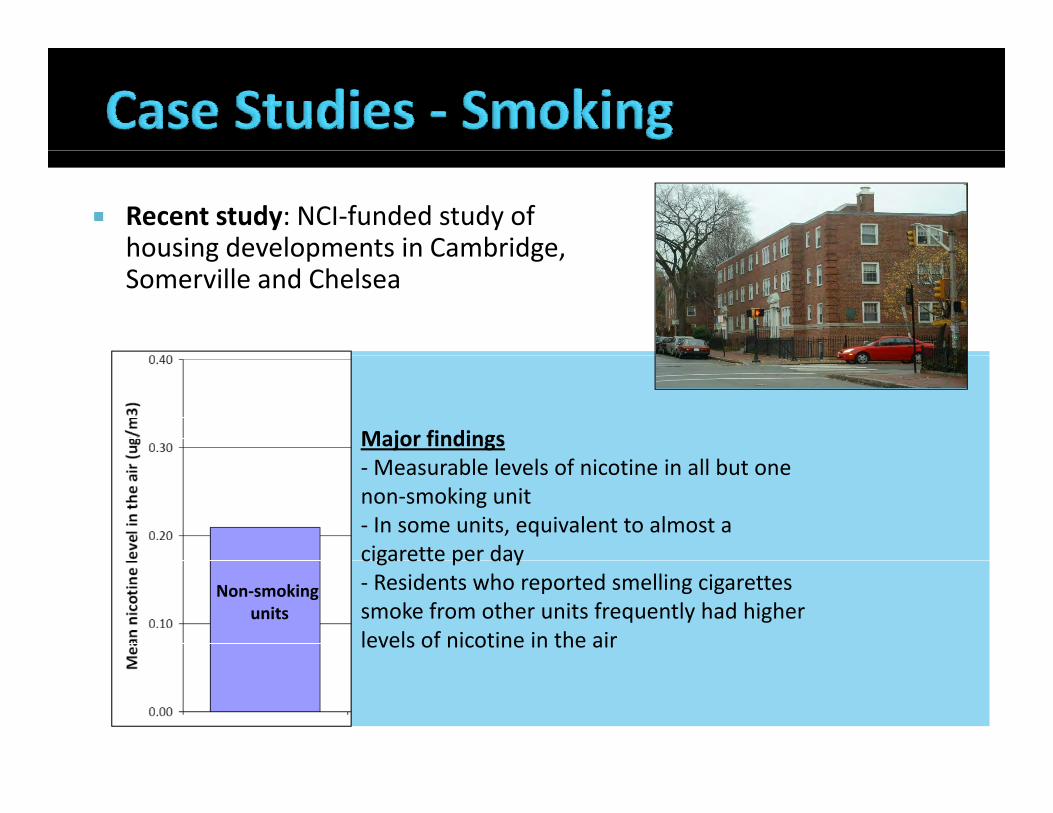
Recent study: NCI‐funded study of housing developments in Cambridgehousing developments in Cambridge, Somerville and Chelsea
Major findings‐Measurable levels of nicotine in all but one non‐smoking unit‐ In some units, equivalent to almost a cigarette per daycigarette per day‐ Residents who reported smelling cigarettes smoke from other units frequently had higherlevels of nicotine in the air
Non‐smoking units
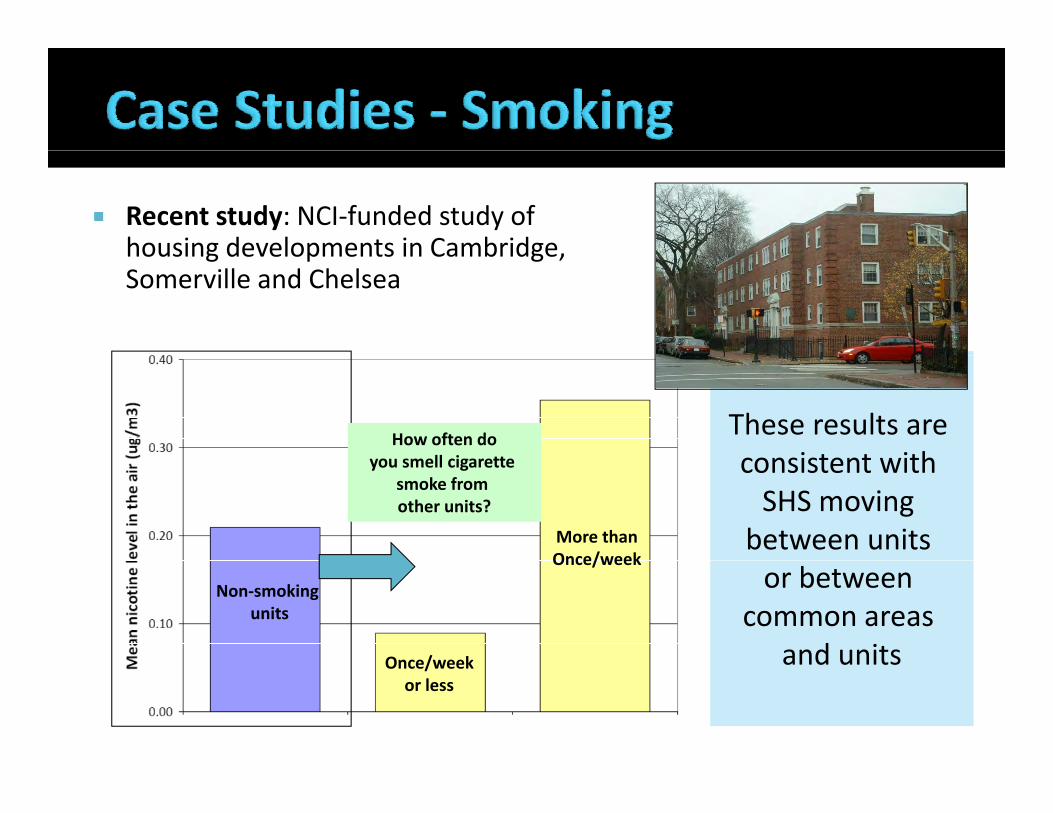
Recent study: NCI‐funded study of housing developments in Cambridgehousing developments in Cambridge, Somerville and Chelsea
How often doll i tt
These results are consistent with
More thanOnce/week
you smell cigarette smoke from other units?
consistent with SHS moving
between units
Non‐smoking units
Once/week
Once/week
or between common areas
and unitsOnce/week or less
and units
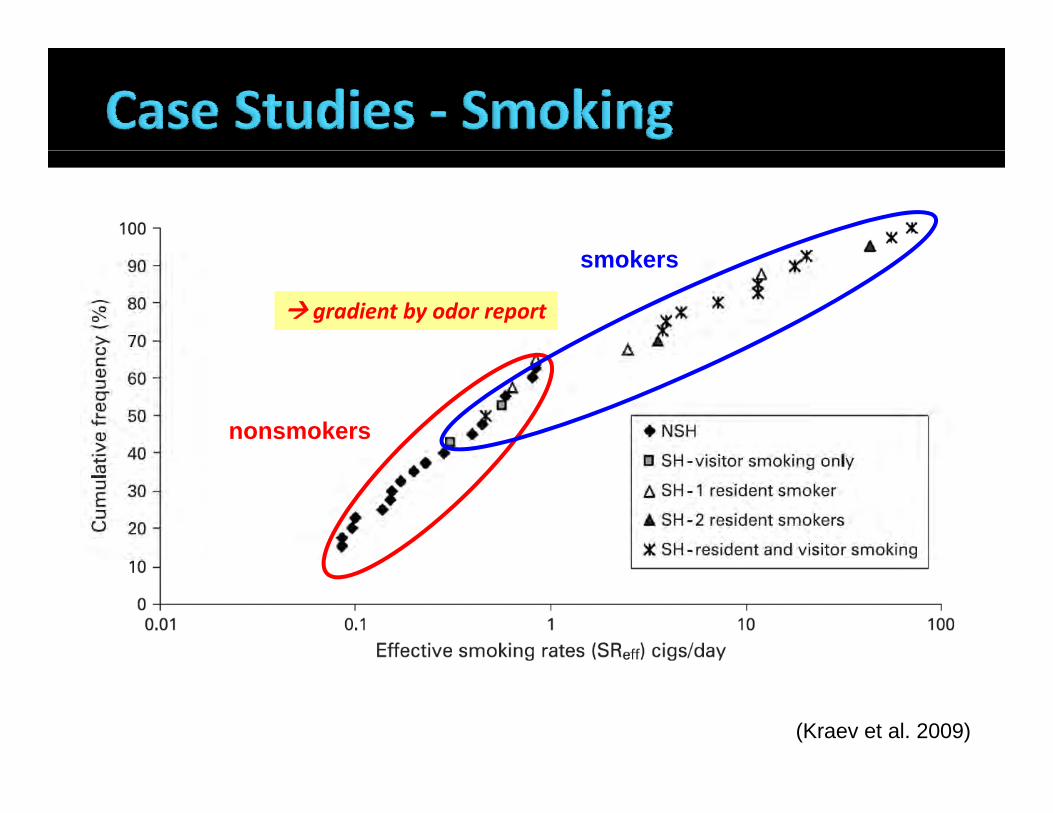
ksmokers
gradient by odor report
nonsmokers
(Kraev et al. 2009)
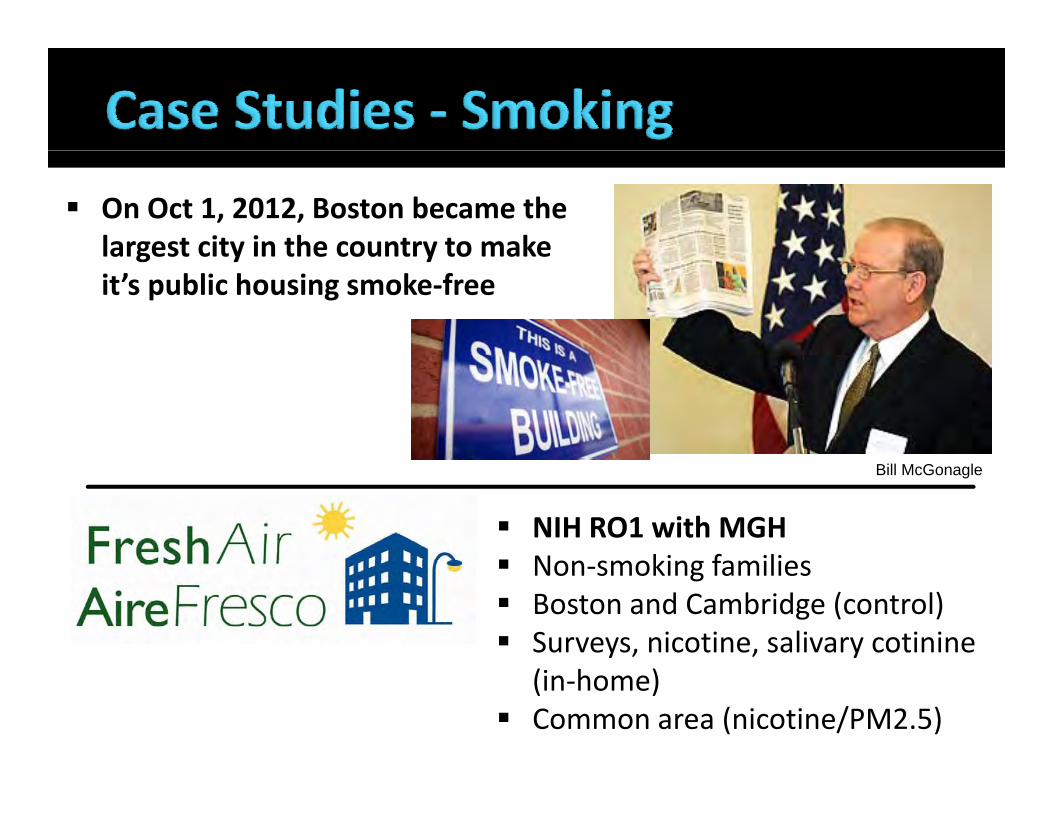
On Oct 1, 2012, Boston became the largest city in the country to makelargest city in the country to make it’s public housing smoke‐free
NIH RO1 with MGH Non smoking families
Bill McGonagle
Non‐smoking families Boston and Cambridge (control) Surveys, nicotine, salivary cotinine
(in‐home) Common area (nicotine/PM2.5)
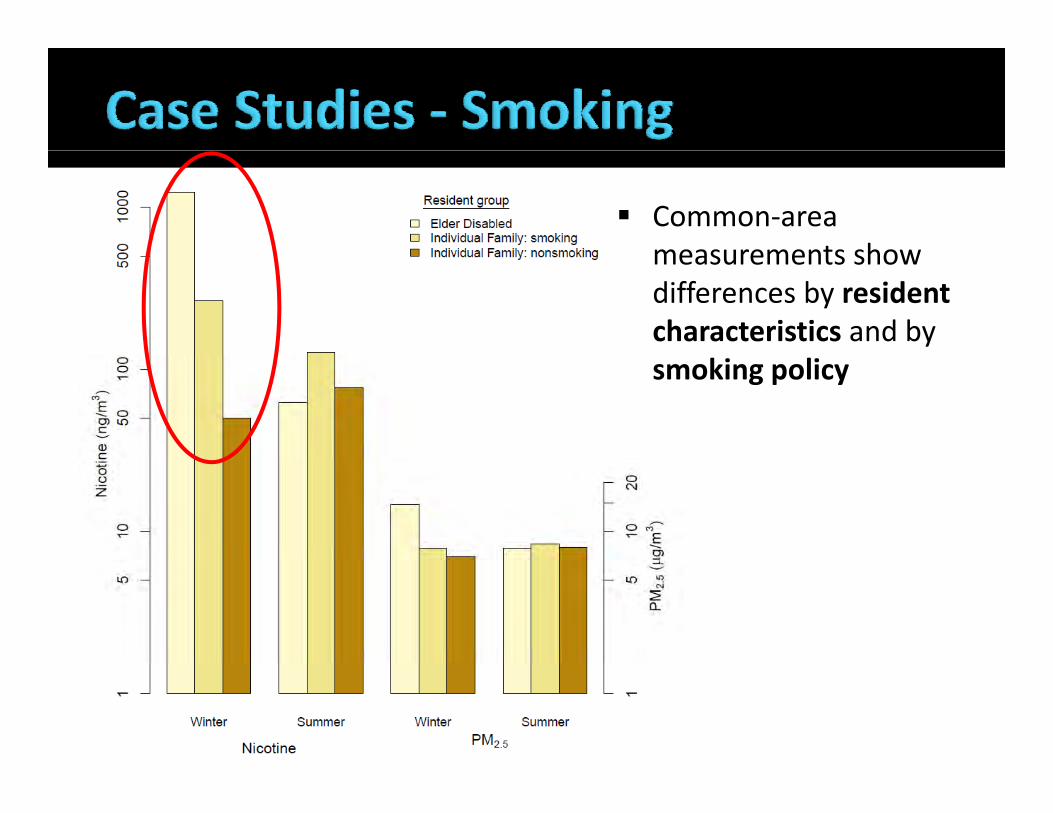
Common‐area measurements showmeasurements show differences by resident characteristics and by smoking policy

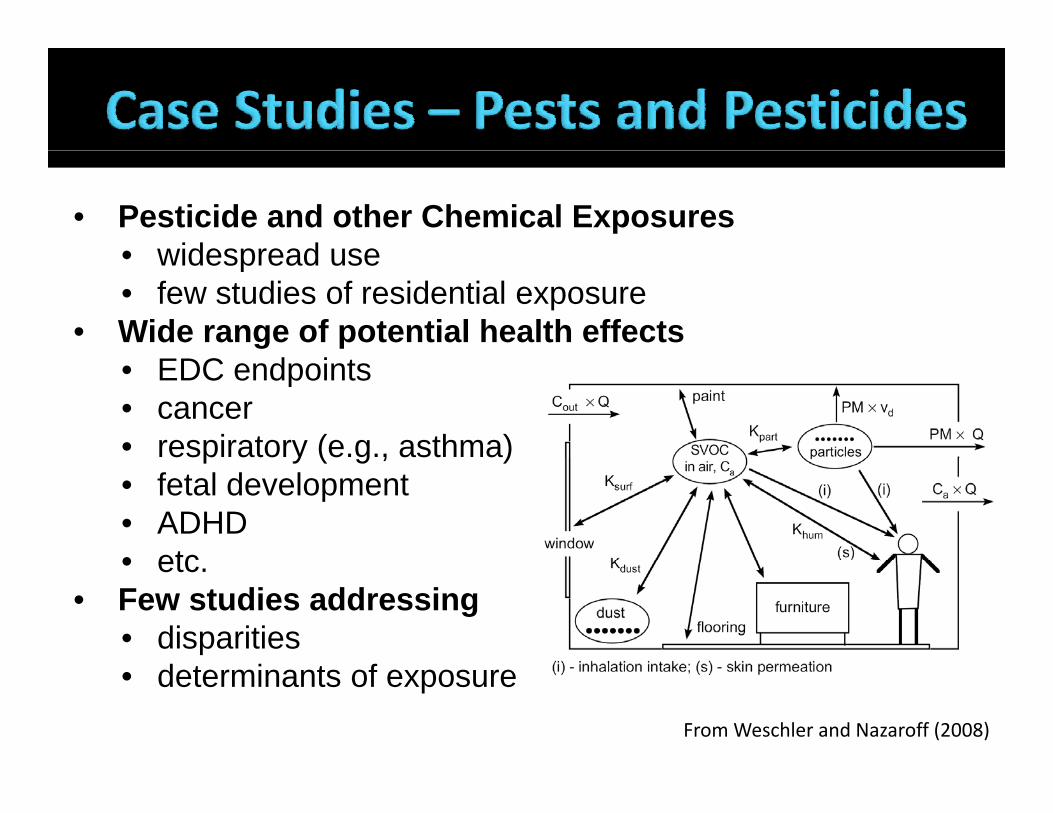
• Pesticide and other Chemical Exposures• widespread use• widespread use• few studies of residential exposure
• Wide range of potential health effects• EDC endpoints • cancer• respiratory (e.g., asthma)p y ( g , )• fetal development• ADHD• etc• etc.
• Few studies addressing• disparities• determinants of exposure
From Weschler and Nazaroff (2008)
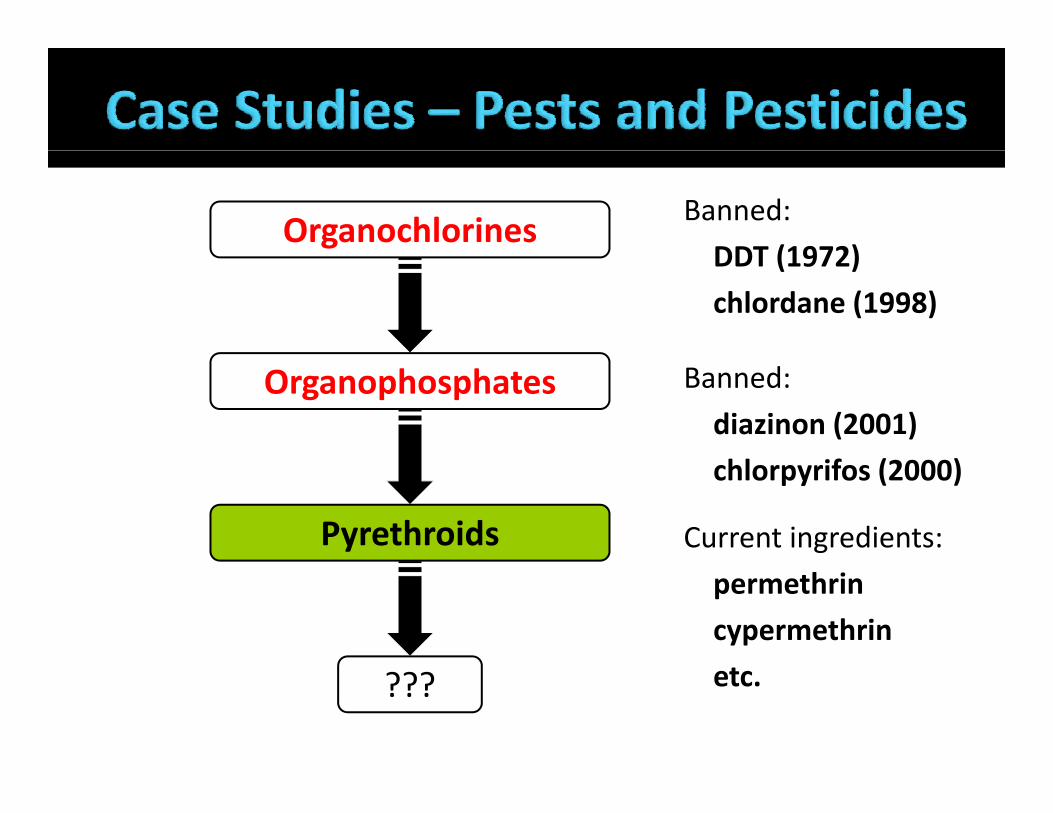
Banned:
DDT (1972)Organochlorines
DDT (1972)
chlordane (1998)
Banned:
diazinon (2001)Organophosphates
Current ingredients:
chlorpyrifos (2000)
Pyrethroidspermethrin
cypermethrin
etc.???
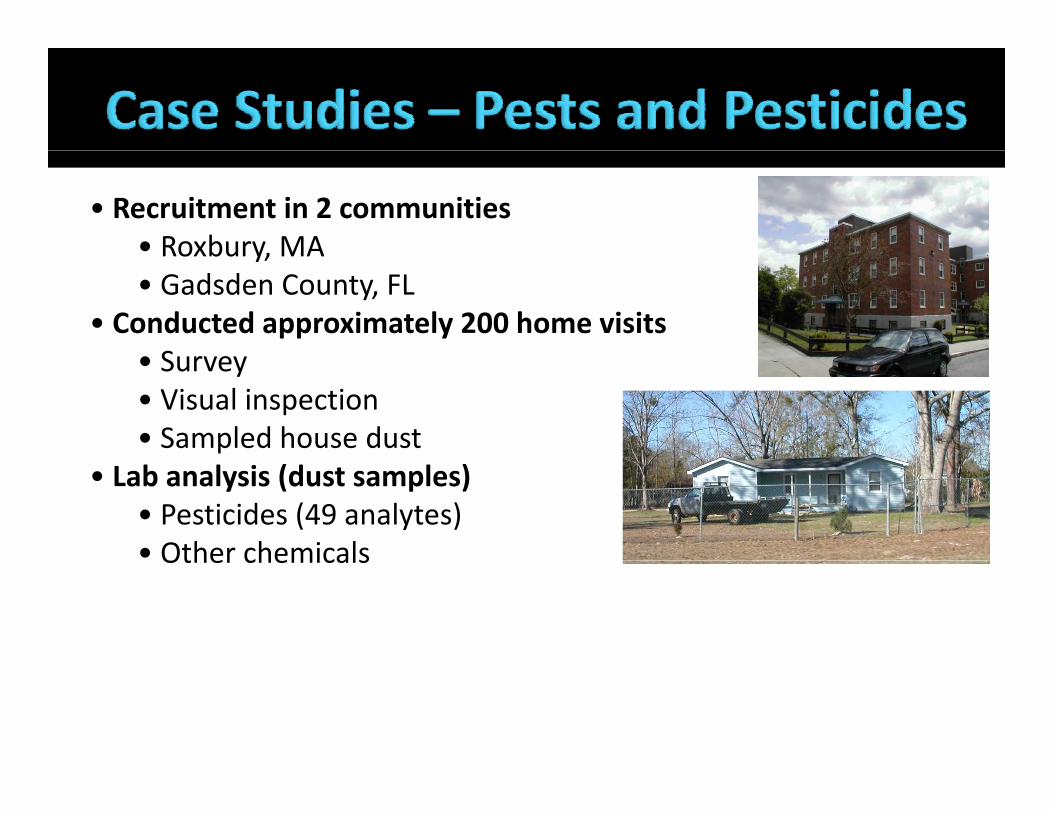
• Recruitment in 2 communities• Roxbury, MARoxbury, MA• Gadsden County, FL
• Conducted approximately 200 home visitsS• Survey
• Visual inspection• Sampled house dust
• Lab analysis (dust samples)• Pesticides (49 analytes)• Other chemicalsOther chemicals
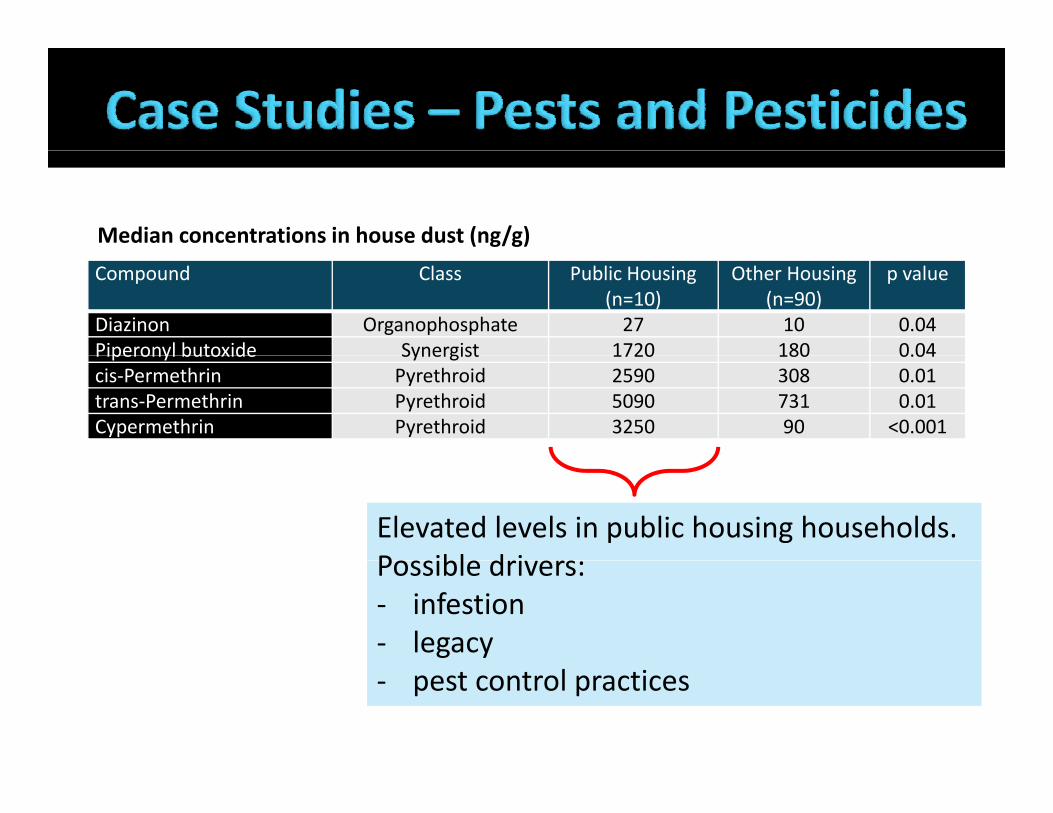
Median concentrations in house dust (ng/g)
Compound Class Public Housing (n=10)
Other Housing (n=90)
p value
Diazinon Organophosphate 27 10 0.04Piperonyl butoxide Synergist 1720 180 0.04Piperonyl butoxide Synergist 1720 180 0.04cis‐Permethrin Pyrethroid 2590 308 0.01trans‐Permethrin Pyrethroid 5090 731 0.01Cypermethrin Pyrethroid 3250 90 <0.001
Elevated levels in public housing households.Possible dri ersPossible drivers:‐ infestion‐ legacy‐ pest control practices
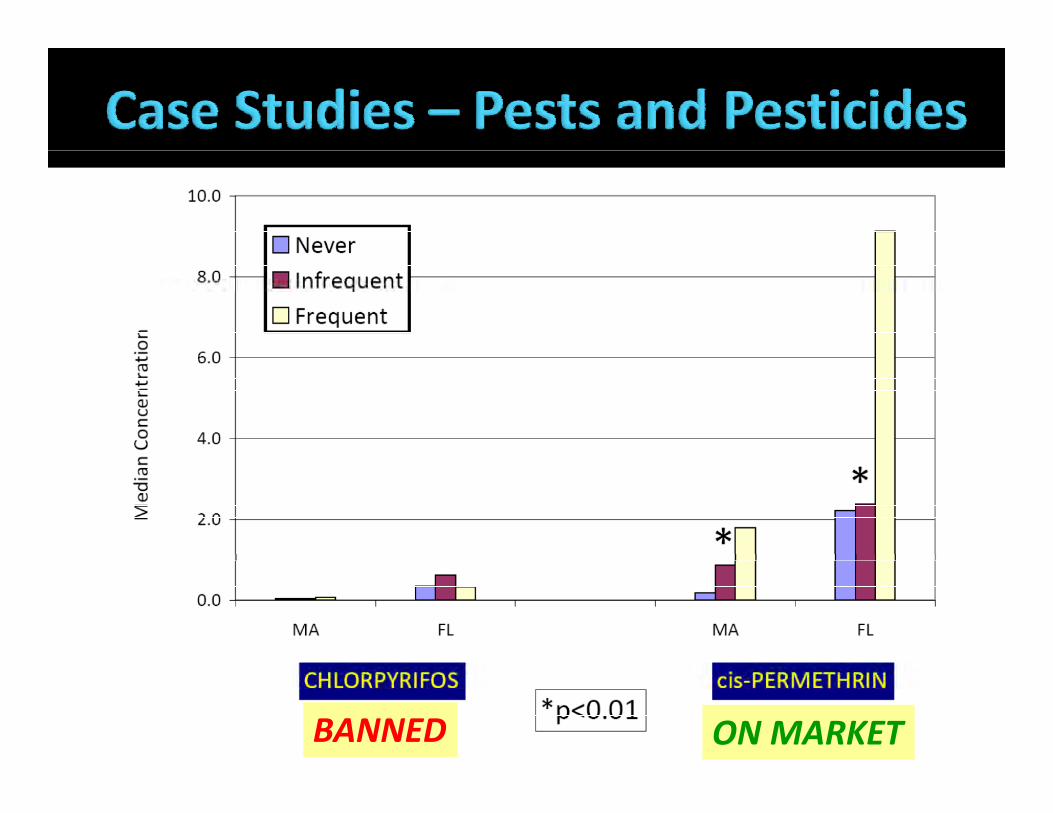
BANNED ON MARKET
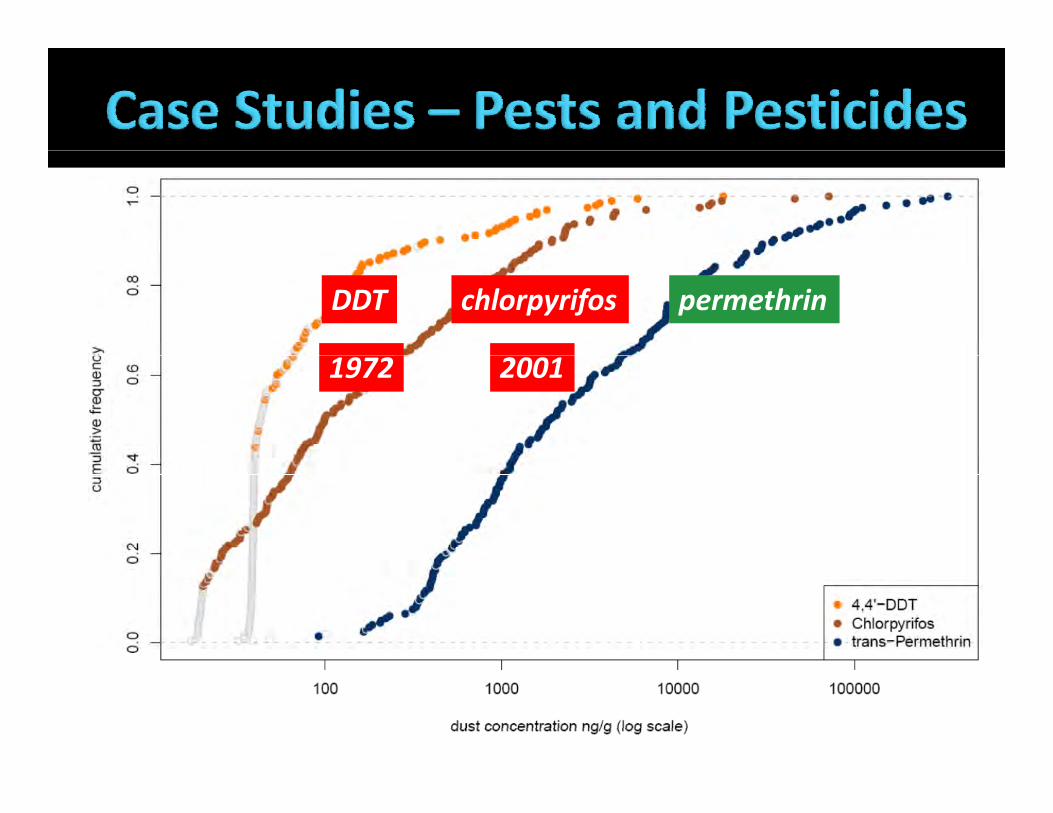
DDT chlorpyrifos permethrin
1972 2001
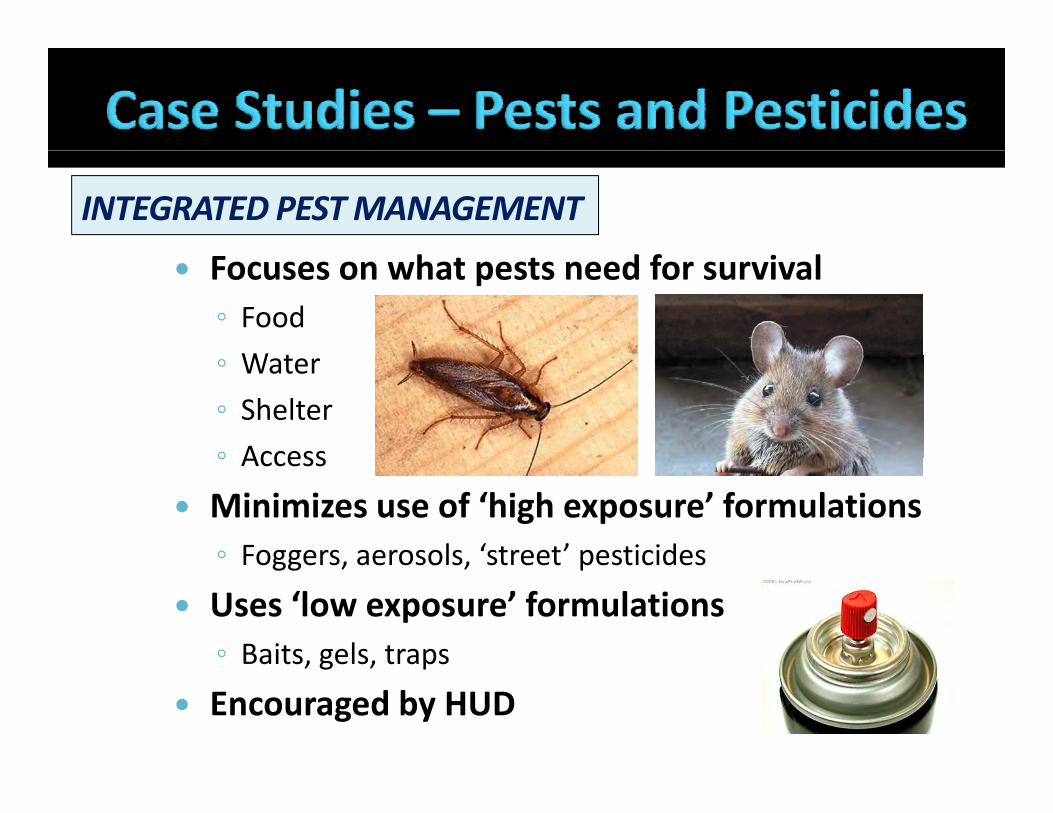
INTEGRATED PEST MANAGEMENT
Focuses on what pests need for survival◦ FoodW t◦ Water
◦ Shelter◦ Access◦ Access
Minimizes use of ‘high exposure’ formulations◦ Foggers aerosols ‘street’ pesticidesFoggers, aerosols, street pesticides
Uses ‘low exposure’ formulations◦ Baits, gels, trapsBaits, gels, traps
Encouraged by HUD
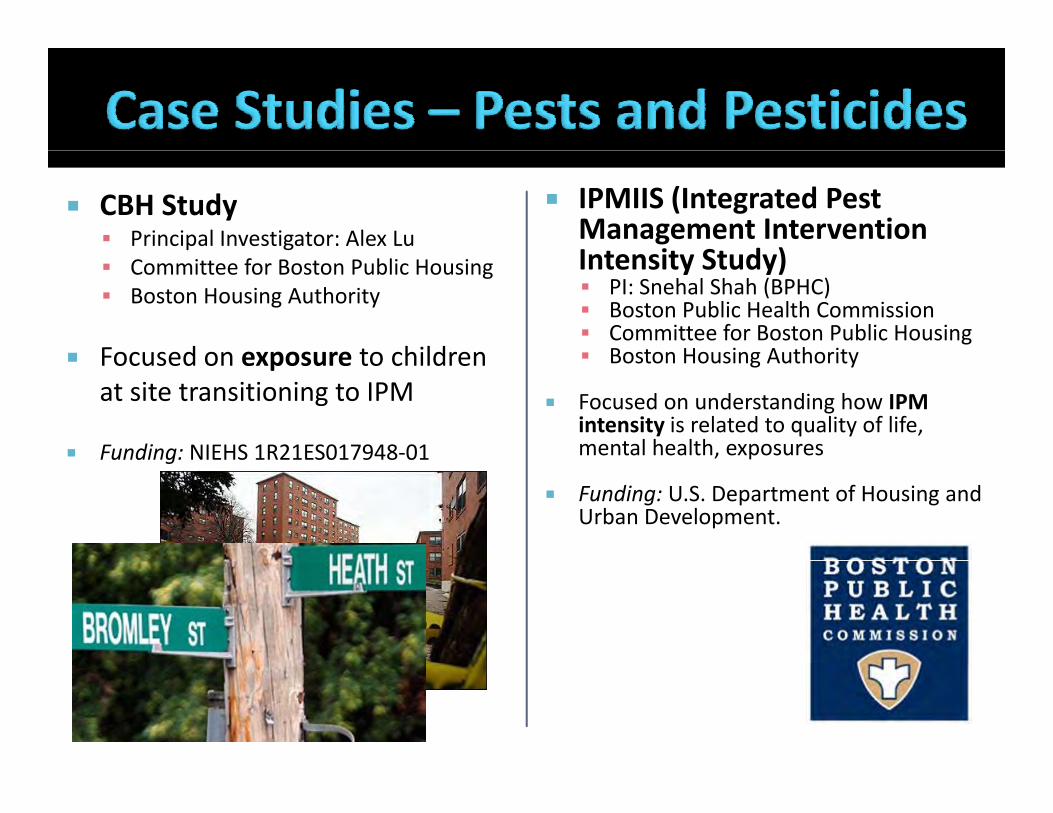
CBH Study Principal Investigator: Alex Lu
IPMIIS (Integrated Pest Management Intervention I t it St d ) Committee for Boston Public Housing
Boston Housing Authority
Focused on exposure to children
Intensity Study) PI: Snehal Shah (BPHC) Boston Public Health Commission Committee for Boston Public Housing Boston Housing Authority Focused on exposure to children
at site transitioning to IPM
Funding: NIEHS 1R21ES017948‐01
Boston Housing Authority
Focused on understanding how IPM intensity is related to quality of life, mental health, exposuresFunding: NIEHS 1R21ES017948 01 , p
Funding: U.S. Department of Housing and Urban Development.

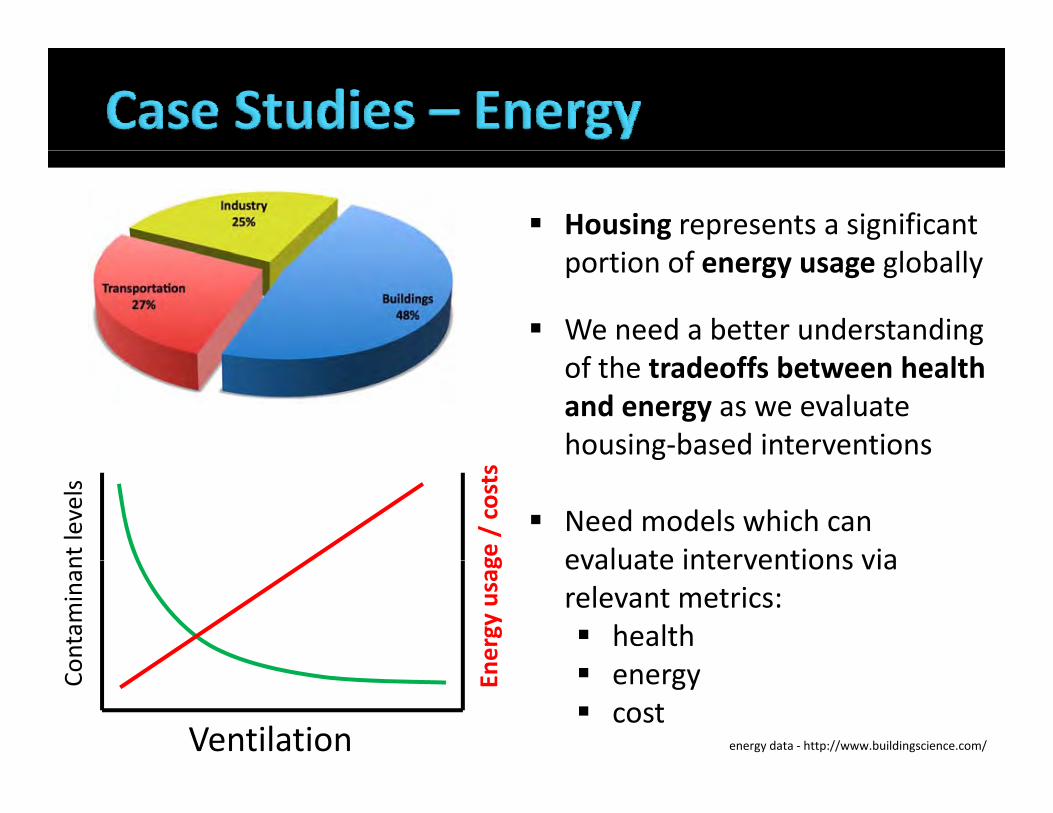
Housing represents a significant i f l b llportion of energy usage globally
We need a better understanding of the tradeoffs between health and energy as we evaluate housing‐based interventionsg
Need models which can evaluate interventions viant
levels
ge / costs
evaluate interventions via relevant metrics: health
ontaminan
nergy usag
energy cost
Ventilation
Co En
energy data ‐ http://www.buildingscience.com/
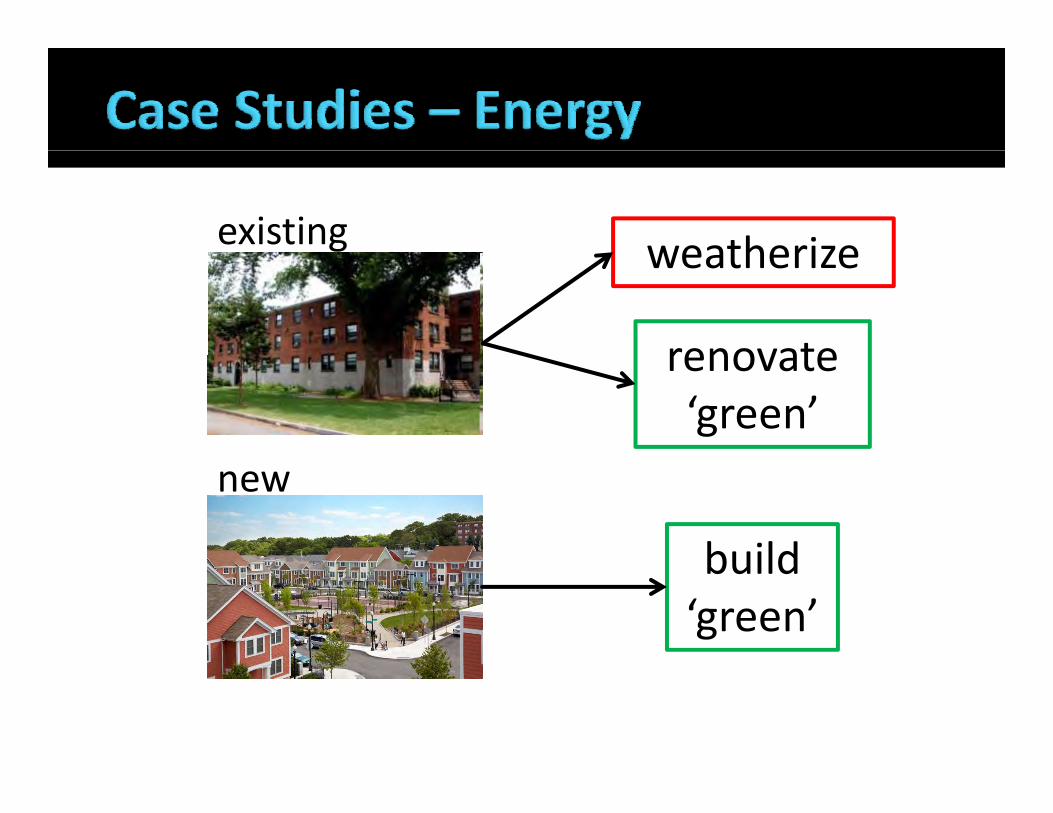
existing weatherizeweatherize
renovaterenovate‘green’
new
buildbuild‘green’
The BRIGHT Study
Boston Residential Investigation onBoston Residential Investigation on Green and Healthy Transitions
Results – all households
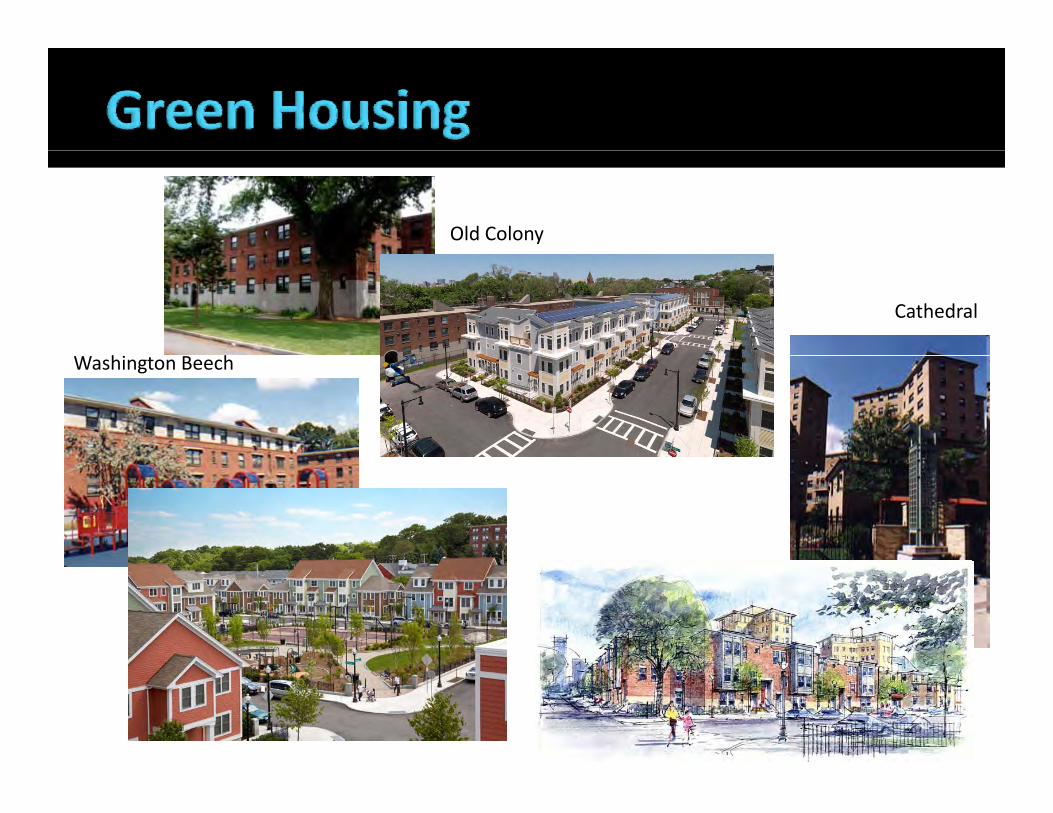
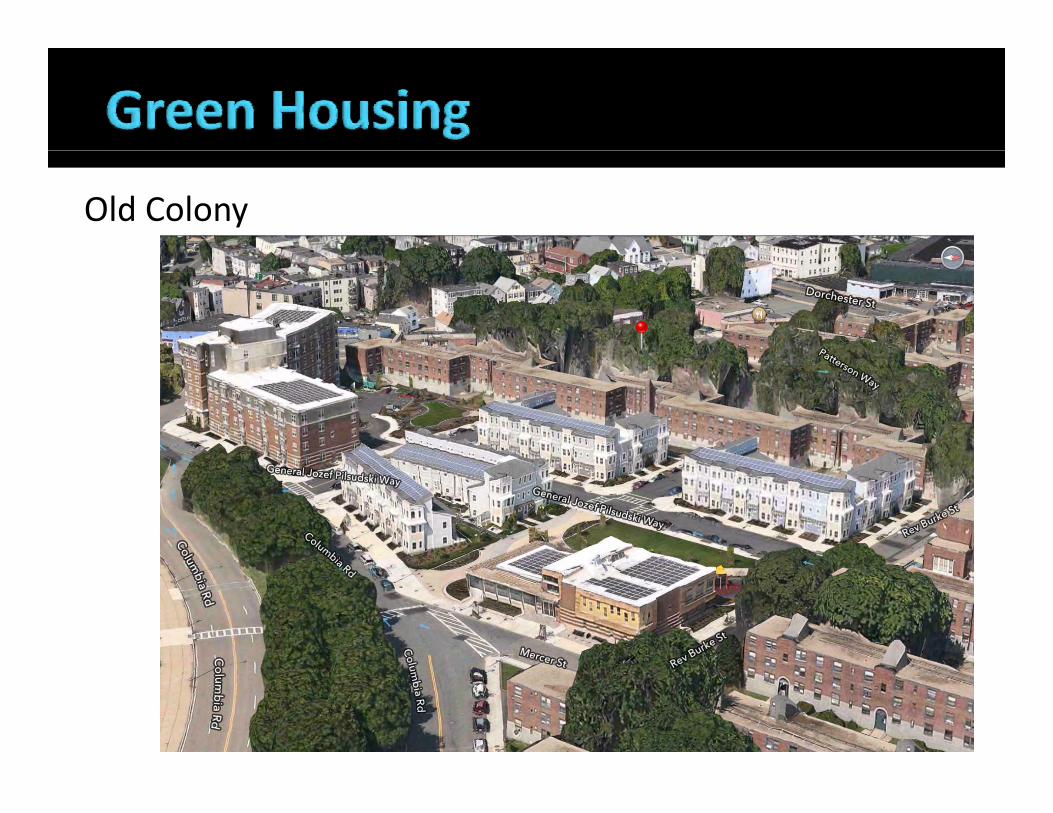
Old Colony
h h
Cathedral
Washington Beech
Results – all households
Old Colony
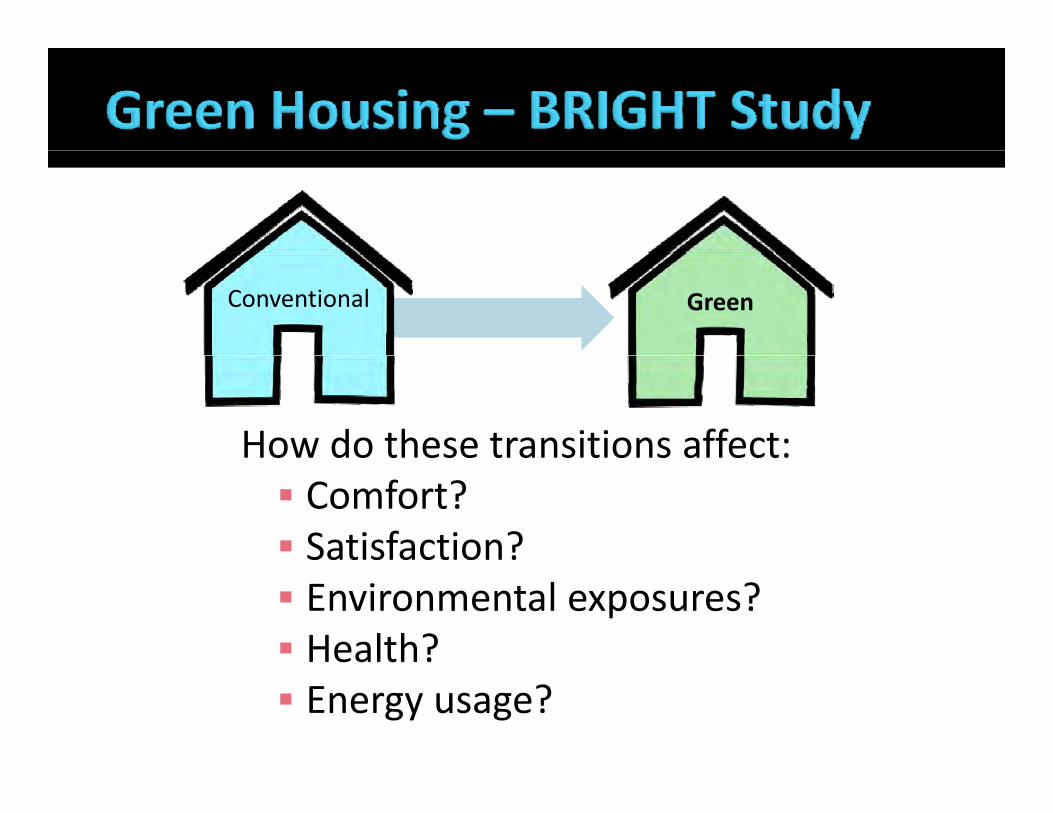
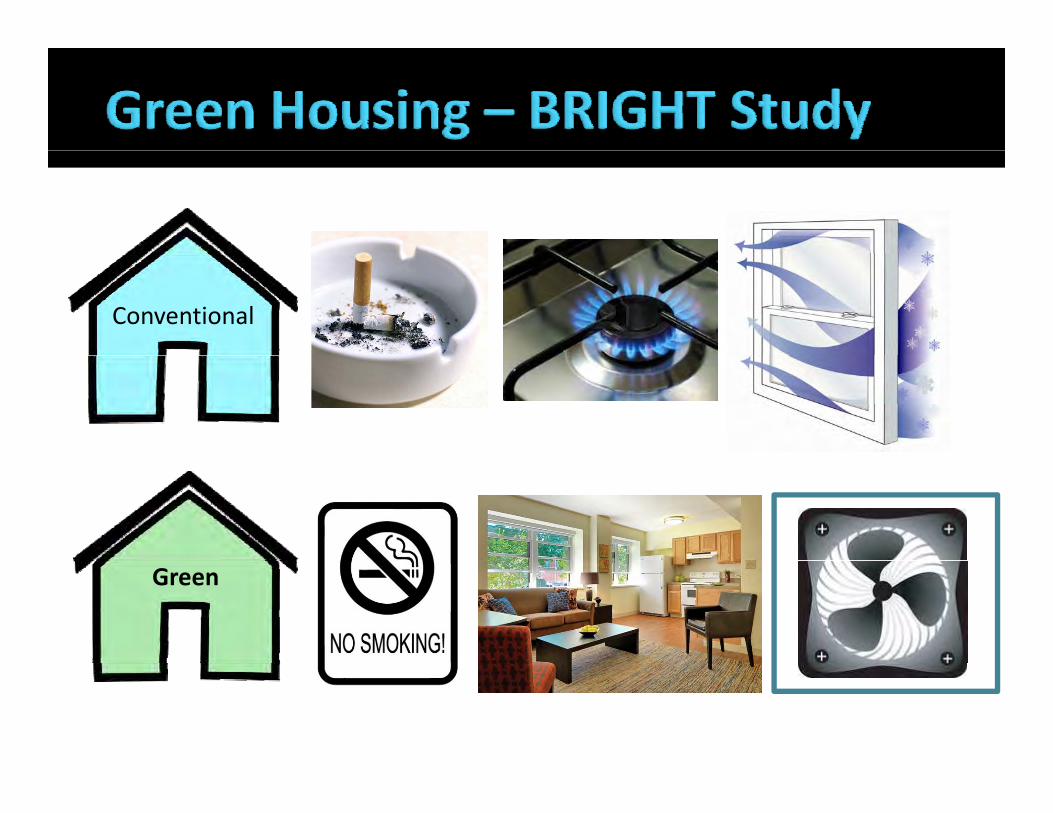
Conventional Green
How do these transitions affect: Comfort? Satisfaction? Environmental exposures? Health? Energy usage?
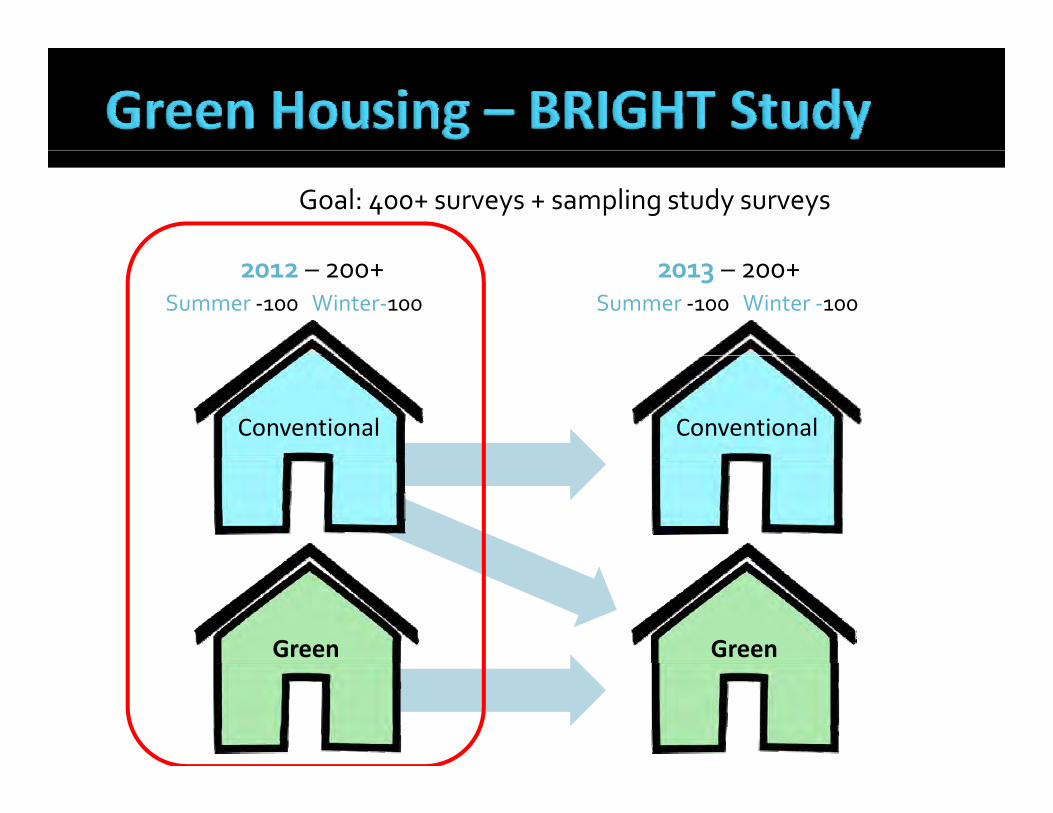
Goal: 400+ surveys + sampling study surveys
2012 – 200+ 2013 – 200+Summer ‐100 Winter‐100 Summer ‐100 Winter ‐100
Conventional Conventional
Green Green
Conventional
Green
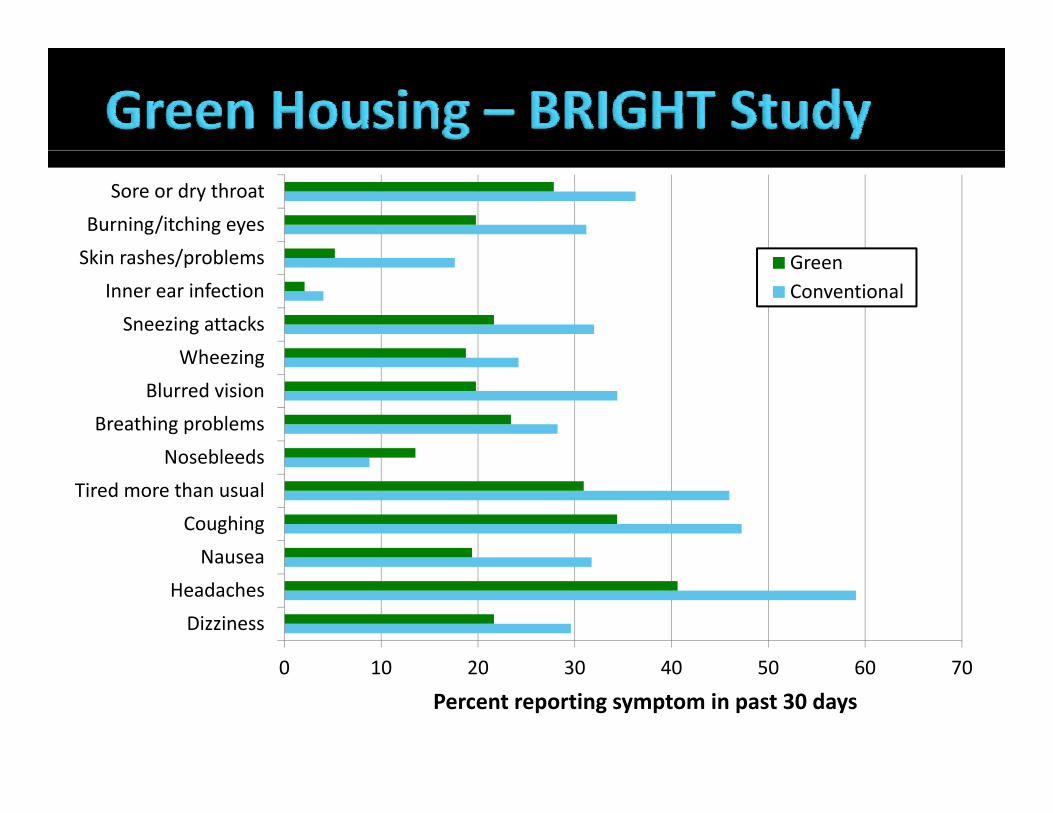
Ski h / bl
Burning/itching eyes
Sore or dry throat
Wheezing
Sneezing attacks
Inner ear infection
Skin rashes/problems GreenConventional
Nosebleeds
Breathing problems
Blurred vision
Wheezing
Nausea
Coughing
Tired more than usual
Nosebleeds
0 10 20 30 40 50 60 70
Dizziness
Headaches
Nausea
0 10 20 30 40 50 60 70
Percent reporting symptom in past 30 days
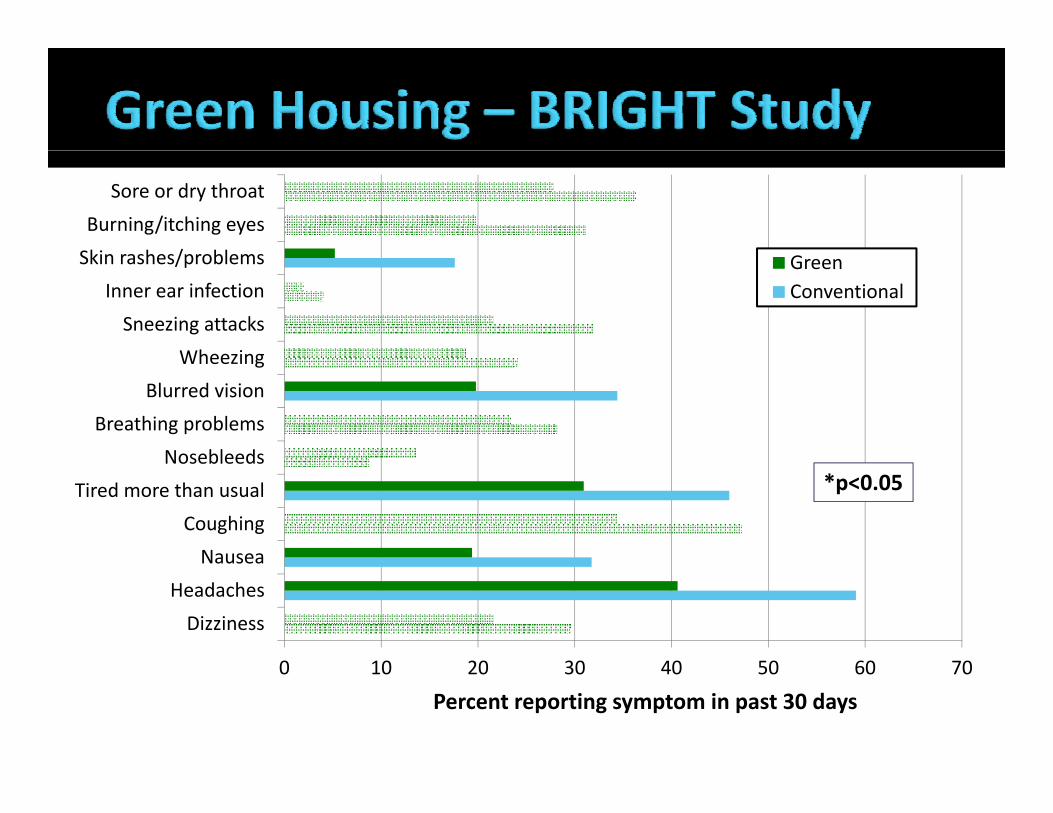
Ski h / bl
Burning/itching eyes
Sore or dry throat
Wheezing
Sneezing attacks
Inner ear infection
Skin rashes/problems GreenConventional
Nosebleeds
Breathing problems
Blurred vision
Wheezing
Nausea
Coughing
Tired more than usual
Nosebleeds*p<0.05
0 10 20 30 40 50 60 70
Dizziness
Headaches
Nausea
0 10 20 30 40 50 60 70
Percent reporting symptom in past 30 days
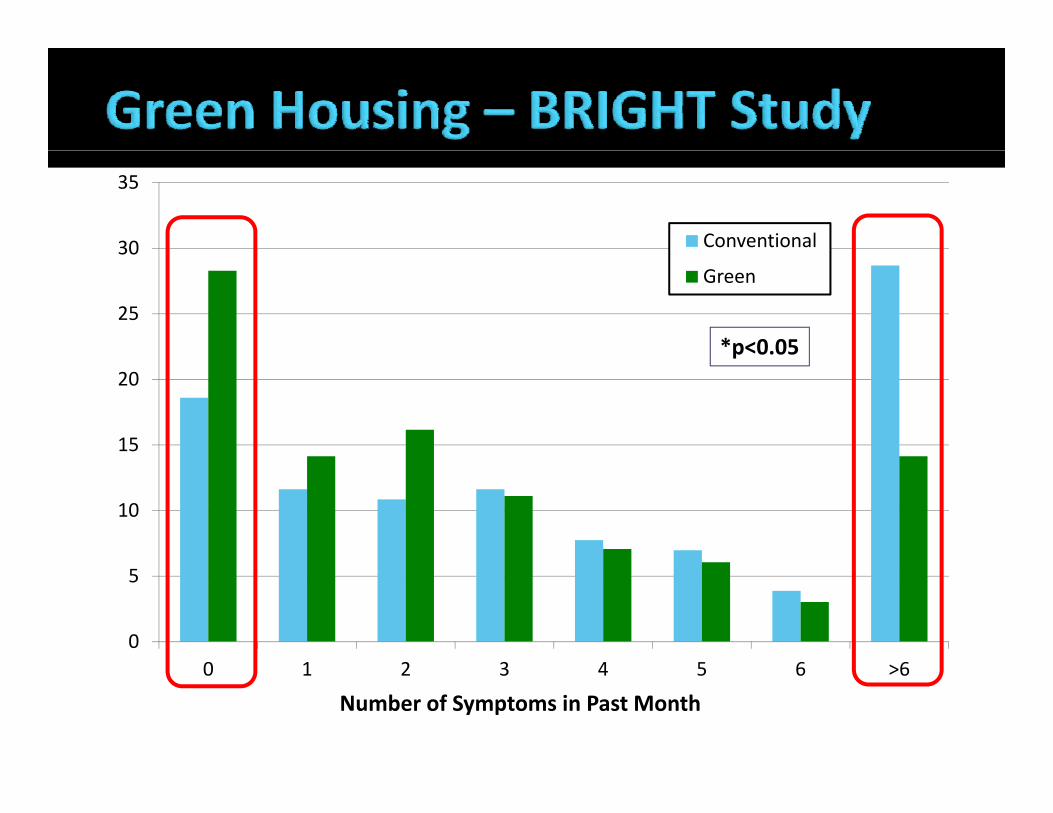
30
35
Conventional
25
30Green
*p<0.05
15
20
p
10
0
5
0 1 2 3 4 5 6 60 1 2 3 4 5 6 >6
Number of Symptoms in Past Month
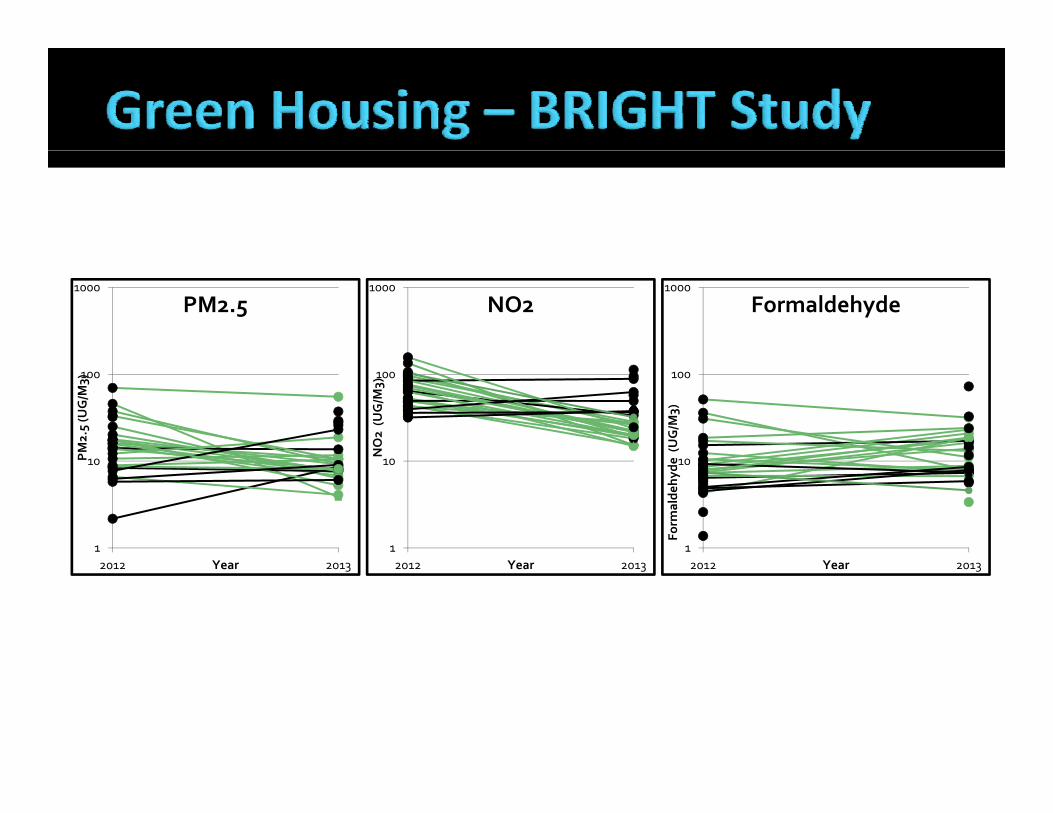
1000
PM2.51000
NO21000
Formaldehyde
100
PM2.5 (U
G/M
3) 100NO2 (U
G/M
3)100
e (U
G/M
3)
1
10P
Y1
10
Y1
10
Form
alde
hyde
Y2012 2013Year 2012 2013Year 2012 2013Year
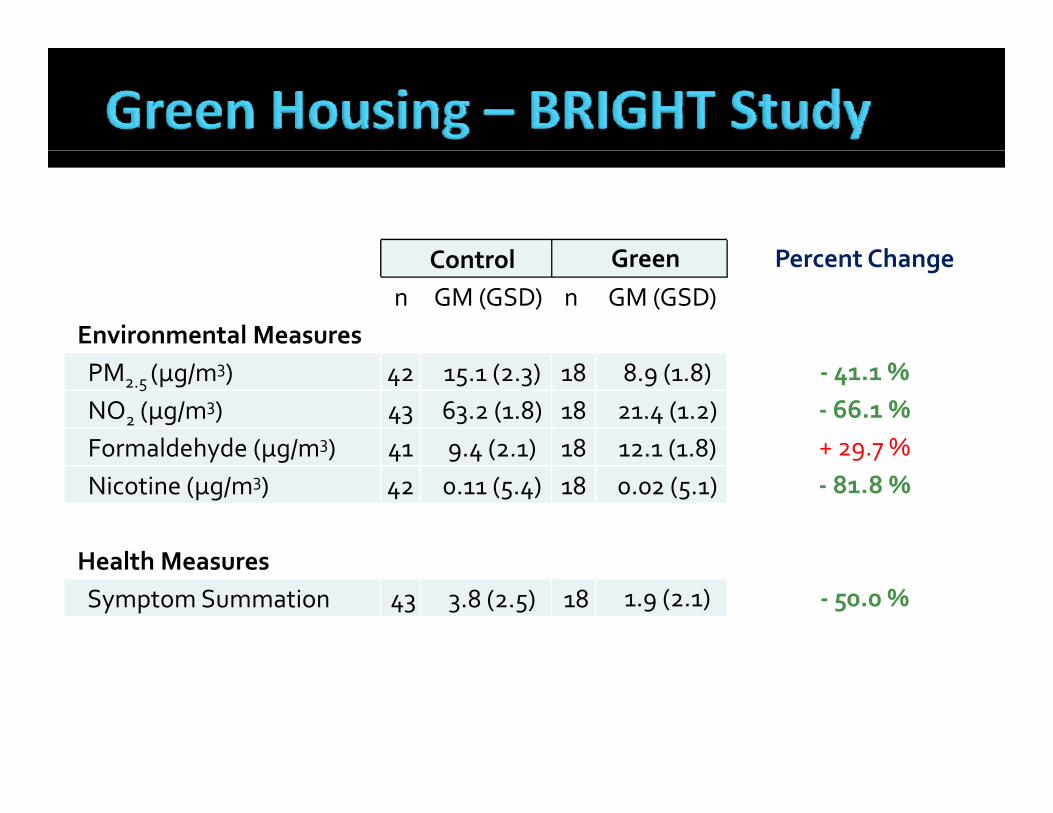
C t l G P t ChControl Green Percent Changen GM (GSD) n GM (GSD)
Environmental MeasuresPM2.5 (µg/m3) 42 15.1 (2.3) 18 8.9 (1.8) ‐ 41.1 %NO2 (µg/m3) 43 63.2 (1.8) 18 21.4 (1.2) ‐ 66.1 %Formaldehyde (µg/m3) 41 9.4 (2.1) 18 12.1 (1.8) + 29.7 %y (µg/ ) 4 9 4 ( ) ( ) 9 7Nicotine (µg/m3) 42 0.11 (5.4) 18 0.02 (5.1) ‐ 81.8 %
Health MeasuresHealth MeasuresSymptomSummation 43 3.8 (2.5) 18 1.9 (2.1) ‐ 50.0 %
80
100
omes
20
40
60
omes vs. Con
trol H
‐40
‐20
0
eren
ce in Green Ho
‐100
‐80
‐60
Perce
nt Diffe
‐100PM2.5* NO2* Formaldehyde Nicotine * Median CO2 AER†
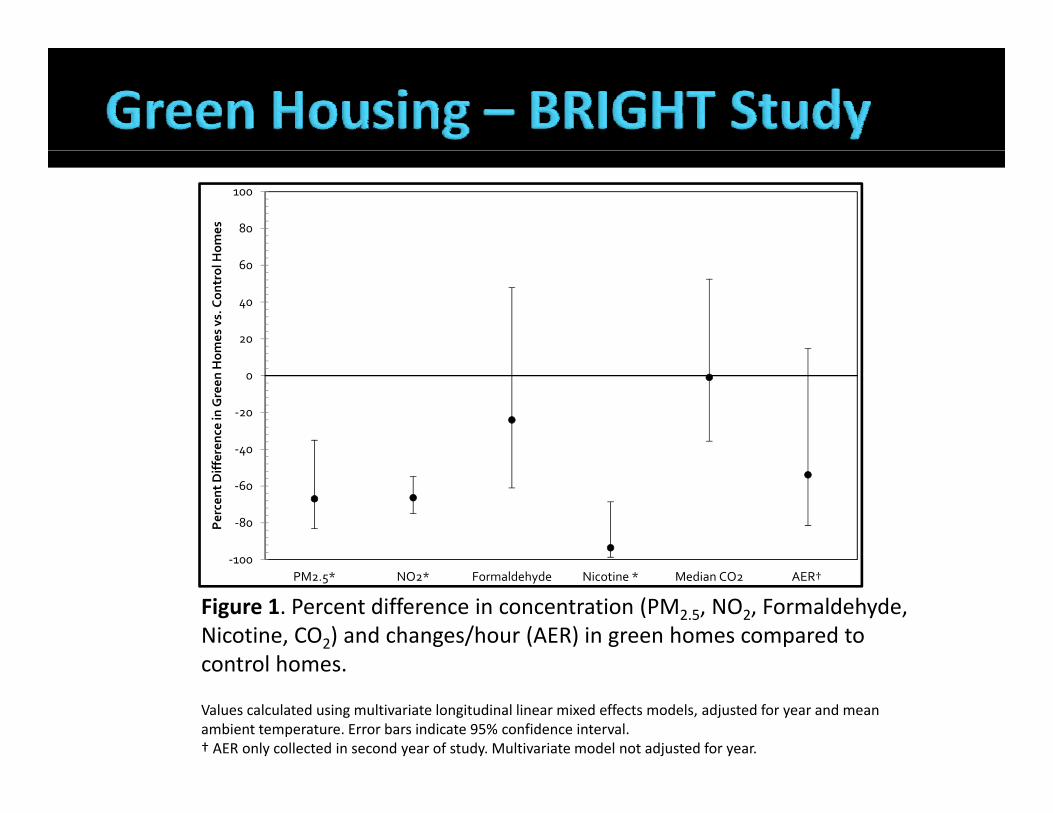
Figure 1. Percent difference in concentration (PM2.5, NO2, Formaldehyde, Nicotine, CO2) and changes/hour (AER) in green homes compared to control homescontrol homes.
Values calculated using multivariate longitudinal linear mixed effects models, adjusted for year and mean ambient temperature. Error bars indicate 95% confidence interval.† AER only collected in second year of study. Multivariate model not adjusted for year.
Sources Structure Behavior
Indoor Environments
Physical Structure • Size/design of structure• AgeSi f li i
Indoor Sources• Cooking appliances• Tobacco smokeCl i d
Source use patterns• Cooking appliance usage• Cooking practicesS ki b h i
Sources Structure Behavior
• Size of living space• Single family vs. multifamily• Leakage and/or air exchange • Heating systemsM h i l il i
• Cleaning products• Air fresheners• Personal care products• FurnishingsP i id
• Smoking behavior• Consumer product usage• Personal care product usage
• Mechanical ventilation• Pesticides• Pollutant reservoirs• Water sources
Activity Patterns• Time spent at home• Interaction with sources• Influence on air exchangeOutdoor SourcesOutdoor Sources
• Traffic• Industrial Activity• Residential Activity• Contaminated soilContaminated soil
(Adamkiewicz et al., 2011))
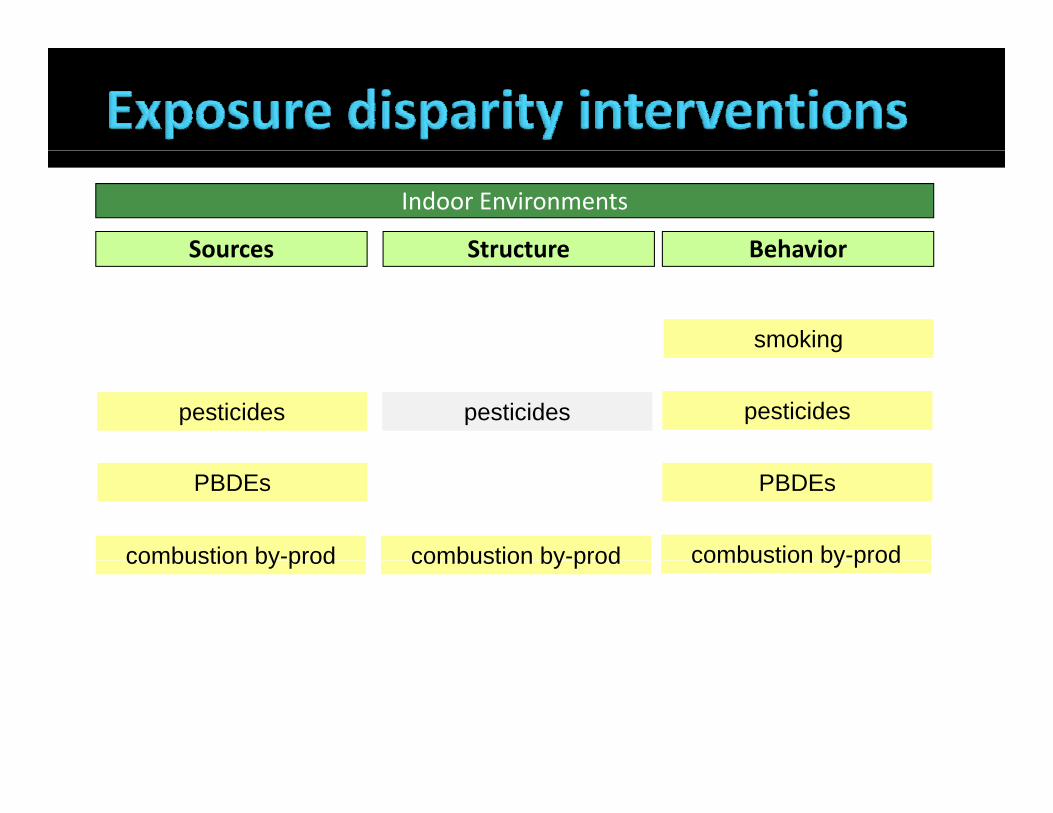
Sources Structure Behavior
Indoor Environments
Sources Structure Behavior
smoking
pesticidespesticidespesticides
PBDEs PBDEs
combustion by-prodcombustion by-prodcombustion by-prod combustion by prodcombustion by prodcombustion by prod
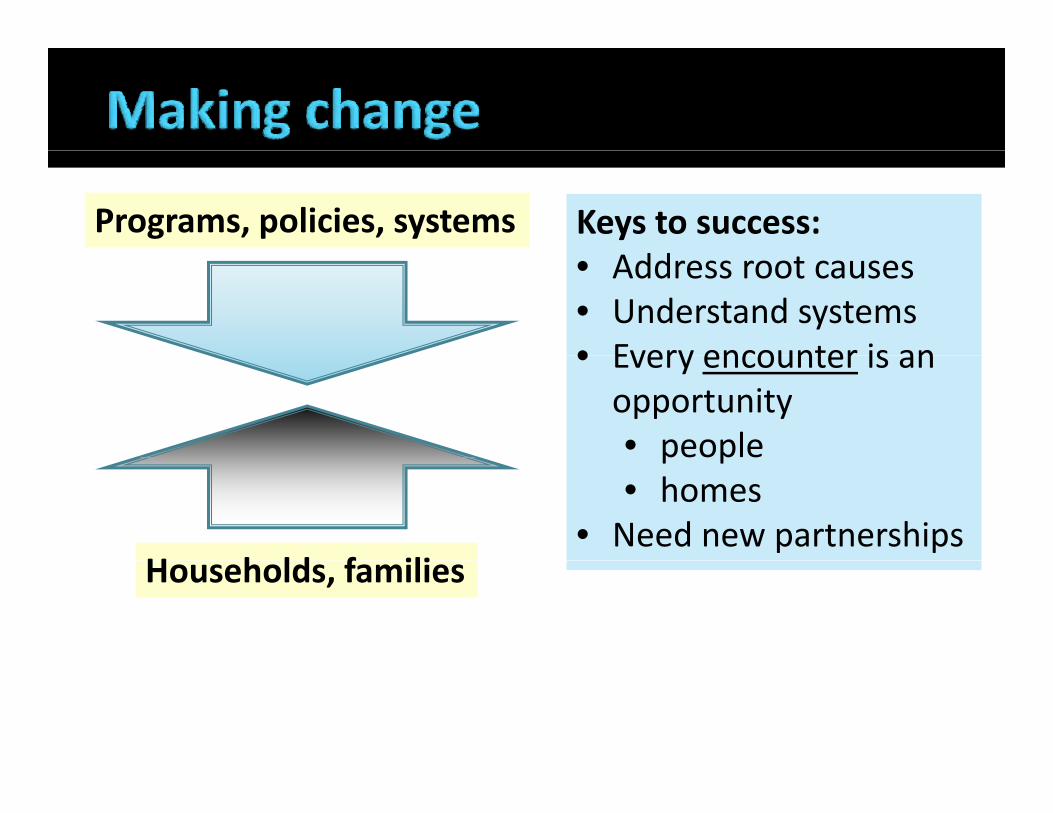
Programs, policies, systems Keys to success:• Address root causes• Understand systems• Every encounter is an• Every encounter is an opportunity• people
H h ld f ili
p p• homes
• Need new partnershipsHouseholds, families
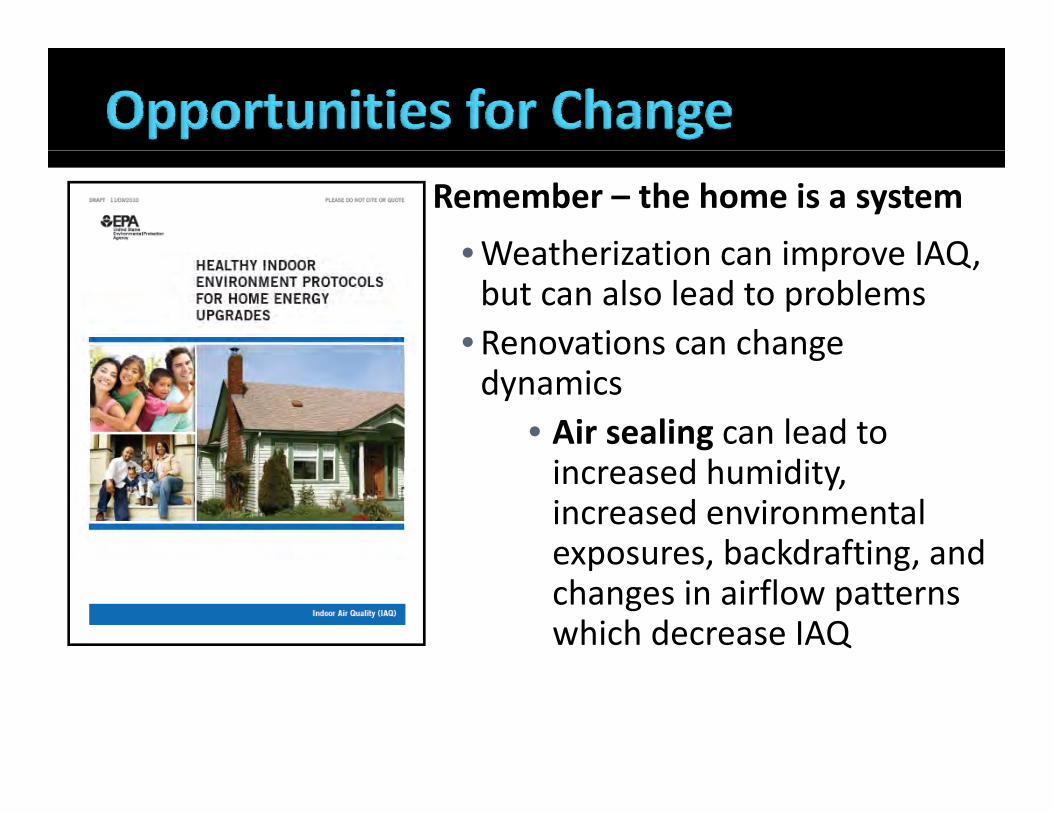
Remember – the home is a system
•Weatherization can improve IAQ•Weatherization can improve IAQ, but can also lead to problems
• Renovations can change gdynamics
• Air sealing can lead to increased humidity, increased environmental exposures, backdrafting, andexposures, backdrafting, and changes in airflow patterns which decrease IAQ

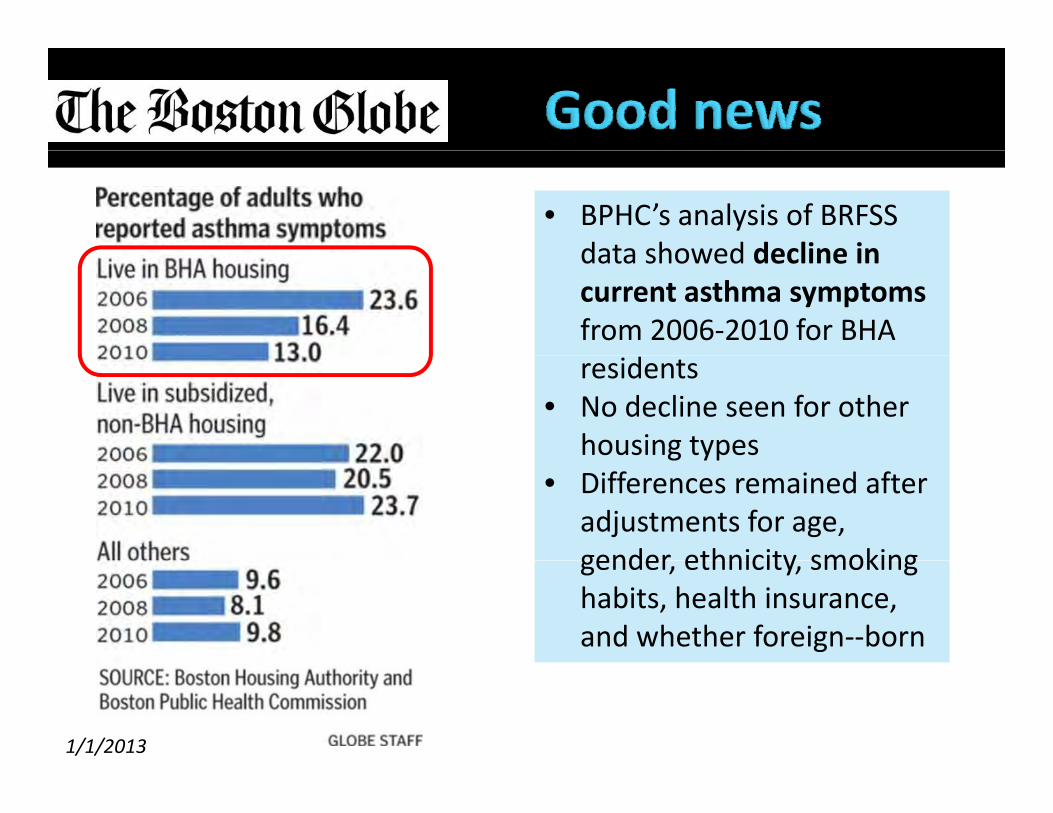
• BPHC’s analysis of BRFSS data showed decline indata showed decline in current asthma symptoms from 2006‐2010 for BHA residents
• No decline seen for other housing typesg yp
• Differences remained after adjustments for age, gender ethnicity smokinggender, ethnicity, smoking habits, health insurance, and whether foreign‐‐born
1/1/2013
Jack Spengler Jon Levy
Boston Housing Authority Committee for BostonJon Levy
Glorian Sorensen Committee for Boston Public Housing
Jose Vallarino Meryl Colton Marty Alvarez‐ReevesMarty Alvarez Reeves Joan Arnold
Patricia Fabian Tina Wan Patricia Fabian Sophia Qiu Raphael Arku Piers MacNaughton
Tina Wang Oscar Zarate Kathleen Attfield Robin Dodson Piers MacNaughton Robin Dodson
BRIGHT Study Principal Investigator: G. Adamkiewicz
M l C lt Meryl Colton Marty Alvarez‐Reeves Jose Vallarino John Kane (BHA)
HIC Study Principal Investigator: Glorian Sorensen
M Al R
Mae Bennett‐Fripp (CBPH)
Funding: U.S. Department of Housing and Urban Development (MALHH0229 10) Marty Alvarez‐Reeves
Reggie Tucker‐Seeley Brittany Bricen Lorraine Wallace
Urban Development (MALHH0229‐10).
FreshAir Study Principal Investigator Doug Levy
Ruth Lederman Funding: National Cancer Institute (R01
CA111310‐01A1).
Principal Investigator: Doug Levy Raphael Arku Piers MacNaughton Jose Vallarino
Funding: NHLBI (RO1HL112212‐01A1).

h kthanks