CorporateCraftsmanship - John Keells Holdings PLC, Sri Lanka

LANKA TILES PLCIntegrated Annual Report 2017/18
MULTIFACETED


MULTIFACETEDAt Lanka Tiles PLC, we are focussed on being the best we can be. That is why, year after year we push ourselves to become better, to ensure we are a dynamic, vibrant entity, constantly evolving and creating value for the thousands of stakeholders we partner.
We are gearing ourselves for the future through state-of-the-art technology, our forward-looking strategies, and exploring new avenues for growth. We are also mindful that our true purpose lies in our long-term impact on society and the environment in which we operate. This is the underlying reason behind our pursuit of a more holistic approach towards doing business. Our focus is multifaceted – as we continue to seek operational excellence and profitability, we are fostering a culture of sustainability, integrity and good governance, building relationships that last a lifetime.

2 LANKA TILES PLC
Introduction to report / 3
About Us / 6
Performance Highlights / 10
Chairman’s Statement / 12
Managing Director’s Review / 16
Board of Director’s / 22
Senior Management / 26
Creating Value for Our Stakeholders / 28
Corporate Governance Report / 56
Risk Management / 67
Annual report of the Board of
Directors on the Affairs of the Company / 74
Statement of Directors Responsibilities / 78
Chief Executive Officer’s and
Chief Financial Officer’s Responsibility Statement / 79
Related Party Transactions Review Committee Report / 80
Remuneration Committee Report / 81
Audit Committee Report / 82
Independent Auditor’s Report / 84
Consolidated Statement of Financial Position / 90
Consolidated Statement of
Comprehensive Income / 91
Consolidated Statement of Changes in Equity / 92
Consolidated Statement of Cash Flows / 93
Notes to the Financial Statements / 94
Five Year Summary Statement of Financial Position / 129
Five Year Summary Statement of Profit or Loss / 130
Shareholder Information / 131
Statement of Value Added / 133
Notice of Meeting / 134
Form of Proxy / 135
CONTENTS

INTEGRATED ANNUAL REPORT 2017/18 3
INTRODUCTION TO THIS REPORTContinuing our journey of integrated reporting, Lanka Tiles PLC (LTPLC) is pleased to present the Company’s performance for the reporting period 01st April 2017 to 31st March 2018.
DIRECTORS STATEMENT OF RESPONSIBILITY FOR THIS REPORT
The Board of Directors have acknowledged their responsibility for this annual report in the Annual Report of the Board of Directors on the Affairs of the Company and the Statement of Directors Responsibilities, as required under the Companies Act of 2007.
BASIS OF PREPARATION AND PRESENTATION OF THIS REPORT
The material topics selected for disclosure in this report were decided by the top management, under the guidance of the Managing Director. The process of selecting material topics took into account the disclosure requirements under:
1. The International Integrated Reporting (IR) framework of 2013
2. The Companies Act of 2007
3. The Code of Best Practice on Corporate Governance for public listed companies, jointly issued by The Institute of Chartered Accountants of Sri Lanka, The Securities and Exchange Commission of Sri Lanka and The Colombo Stock Exchange.
The Company has not obtained external assurance for the sustainability performance measures and aspects disclosed in this report.
COMPLIANCE WITH INTEGRATED REPORTING PRINCIPLES
On meeting the principle of reliability of information, we state that the financial statements of the Company have been audited by Chartered Accountants, M/s. PricewaterhouseCoopers. All other information have been approved by relevant senior managers to ensure maximum reliability.
Through the process of selecting material topics for disclosure, we have attempted to present a connected and complete, but concise report.
In addition, we have attempted to presented a consistent and strategic picture of our performance for the financial year 2017-18 and our future plans.
FEEDBACK AND CONTACT
LTPLC values stakeholder feedback on our reporting to enable us to continually meet their expectations and improve reporting criteria. For feedback on this report please contact :
Name of contact person: Mr. Tyrell Roche - General Manager (Finance)Telephone number: 011 4526700Email: [email protected]

4 LANKA TILES PLC
INTRODUCTION TO THIS REPORT
MATERIALITY ASSESSMENT
A materiality assessment process was conducted to ensure the report conforms to Integrated Reporting principles by disclosing topics of relevance to both the Company and key stakeholder groups. This was a 5-step process where:
1. Key stakeholders were identified (please refer the Stakeholder Engagement chapter for information regarding our key stakeholder groups).
2. An assessment was conducted to identify material topics under each of the coverage areas of the IR Framework, for the given period.
Influence of stakeholdersLow High
Identify key stakeholders
Prioritise topics
Select only high material topics for both key
stakeholders and company
Identify topics material to key stakeholders
+ Identify topics material to
company
Process of identifying material topics for disclosure
High interest + low influence
1. Minority shareholders
Inte
rest
leve
l of s
take
hold
ers
Low
Hig
h
High interest + high influence 1. Regulators
2. Large shareholders 3. Institutional shareholders
Low influence + low interest
1. Small shareholders
High influence + high interest 1. Employees
2. Large suppliers 3. Business
partners
Key stakeholder mapping
3. These topics were then matched against stakeholder expectations.
4. Topics were prioritised.
5. Topics deemed to be high priority for both the Company and stakeholders were selected for discussion in the report. This process is depicted below.

INTEGRATED ANNUAL REPORT 2017/18 5
PRIORITISATION OF TOPICS FOR DISCUSSION IN CURRENT REPORT Le
vel o
f im
port
ance
to k
ey s
take
hold
ers
Vital
GROUP 3
TOPICS GAINING IN INTEREST
AMONG STAKEHOLDERS
GROUP 4
TOPICS AND STATEMENTS THAT
GIVE BUDGET INFORMATION TO ALL
STAKEHOLDERS
GROUP 1
VITAL TOPICS FOR KEY
STAKEHOLDERS AND COMPANY
GROUP 2
HIGH MATERIAL TOPICS FOR
COMPANY AND KEY STAKEHOLDERS
Level of importance for companyVital
WHERE TO FIND THIS INFORMATION IN THIS ANNUAL REPORT
Group 1 topics Chapter Page Nos.
1. Regulatory compliance Corporate Governance Report 56 - 66
2. Good governance practices Financial statements 90 - 128
3. Risk management and internal controls Statutory reports 67 - 73
Group 2 topics
1. Shareholder returns Chairman’s review 12 - 15
Financial statements 90 - 128
2. Proper management of the company Managing Director’s review Operational performance
16 -21 34 - 36
3. Future outlook for the company Chairman’s MessageManaging Director’s Review
12 - 15 16- 21
4. Growth strategies and resource allocations Chairman’s MessageManaging Director’s Review
12 - 15 16 - 21
Group 3 topics
1. Sustainability related topics Capital management reports 37 - 55
2. Corporate information Corporate information 137
3. Business highlights Industrial highlights 10
Group 4 topics
1. Investors information Investor information 131 - 132
2. Finance History 5 years summary 129 - 130
3. Meeting information Notice of meeting 133

6 LANKA TILES PLC
LANKA WALLTILES
PLC
LANKA TILES PLC
SWISSTEK (CEYLON)
PLC
LWL DEVELOPMENT (PVT) LIMITED
HORANA PLANTATIONS
PLC
UNI DIL PACKAGING
LIMITED
Swisstek Aluminium Limited
Uni Dil Packaging Solutions (Pvt)
Limited
Swisstek Development (Pvt) Limited
Beyond Paradise Collections Limited
11.48%
47.80%
68.217%
100% 100%
100%
100% 51% 100%
100%
100%
51%
87.38%
Vallibel Plantation Management Limited
LTL Development (Pvt) Limited
Lankatiles Private Limited - India
Group structure and shareholding
ABOUT US VISIONOur vision is of a future, in which LankaTiles will have become not only a household name but a global one...
MISSIONOur mission is to be a Company that sets and constantly exceeds the benchmark of the highest quality in producing ceramic products of exceptional beauty and functionality and to cater to every need of discerning customers both in Sri Lanka and abroad.
These traits have kept us at the forefront of our chosen spheres, creating peerless career development opportunities within the organisation. We believe that improvement is a continuing process. It is the constant endeavour of our employees and the driving force behind our success.

INTEGRATED ANNUAL REPORT 2017/18 7
Lanka Tiles PLC, which is owned 68% by Lanka Walltiles PLC, is the majority shareholder of the Swisstek (Ceylon) PLC Group with 47.8% ownership, the 100% shareholder of Beyond Paradise Collections Ltd and LTL Development (Pvt) Ltd, the 51% shareholder of Lankatiles Private Limited.
The Swisstek (Ceylon) PLC Group includes Swisstek Aluminium Limited and Swisstek Development (Pvt) Ltd.
Swisstek (Ceylon) PLC is involved in the manufacture and sale of tile grout, tile mortar, decorative pebbles and imports wooden flooring for domestic retailing.
Managing Director
General Manager (Finance)
General Manager (Marketing)
Commercial Manager
Group Stores Manager
HR Manager
Management Accountant
Asst. General Manager (P/T)
Factory Manager
AM
AM
Group Finance Manager
AM
AMAM AMAMAM
Head of IT
AM AM
AM AM
Lanka Tiles organisation structure
Beyond Paradise Collections Ltd and LTL Development (Pvt) Ltd – Holding of property for industrial estate
Lankatiles Private Limited – Based in India to distribute ‘LANKATILES’ products in India
Customer Relations Manager
Group Engineering
Manager
TPM Manager
DFMProduction
AFMHead of Design
Group Business
Development Manager
Sales Manager
Group Manager
(Sales Administration)

8 LANKA TILES PLC
Our product portfolio of wall tiles and floor tiles represents the LANKATILES brand in the market, both in Sri Lanka and now, increasingly in foreign destinations. Over the years our portfolio has grown and evolved to become a household name in Sri Lanka. Today, the LANKATILES range of floor and wall tiles brings global interior design trends to Sri Lankan consumers, with a trusted quality guarantee backed by our quality assurance systems which incorporates international and national quality standards at every stage of the manufacturing process.
OUR PRODUCT PORTFOLIO
Combine gectangular, liner, square and big plus small sizes to layout tiles. This can be done in a pattern or randomly for more variation.
Mixed surface finishes, with matching wall and floor makes attractive harmony with in the context Eyes attract details and the unexpected features.
Contrast colours – solid colours and shades blends within moulded surface
Varied design on tile to tile gives more natural surface appearance to the context.

INTEGRATED ANNUAL REPORT 2017/18 9
OUR FOOTPRINT AROUND THE COUNTRYLANKATILES floor tiles and walltiles are now getting closer to consumers where ever they may be. Our distribution and retail network is expanding rapidly to make sure more Sri Lanka consumers have access to world class products to make their homes and office premises reflect their aspirations.
AWARDS AND ACCOLADES
Lanka Tiles was bestowed the Gold Award for Social Dialogue in the Manufacturing Sector, by the Ministry of Labour, at the National Labour Awards 2017.
OPENING OF FRANCHISE SHOWROOM AT HORANA
Lanka Tiles won the ‘Merit Award in the National Level Manufacturing Sector, Extra Large Category’ at the CNCI Achiever Awards 2017.
Vavuniya
Dambulla
Chillaw WariyapolaKurunegala
MataleKandyPeradeniyaKegalle
GampolaNittambuwa
MinuwangodaWarakapolaWennappuwa
NegomboJa Ela GampahaKadawatha
WattalaJawatteHead Office Showroom
MoratuwaPanadura
AwissawellaKaduwelaKottawaHorana Ratnapura
MathugamaAluthgama
Ambalangoda
Galle Ambalantota
Embilipitiya
Balangoda WellawayaBandarawela
BadullaMonaragala
AmparaMahiyanganaya
Kalutara
Matara
W
ata
Alu
Am
p
ara
uthgamambi
a
anganaya
mb
wa
elawana
gam
Em
Balana
a
a
m
one
WarakapolaW
oh
aWa
od
aa
ngoda
nd
aaAA
avu
egamb
aw
deamp
la

10 LANKA TILES PLC
PERFORMANCE HIGHLIGHTS 2017-18FINANCIAL HIGHLIGHTS
RS. 8,701 MN RS. 1,004 MN
RS. 6,126 MN
TOTAL ASSETS
PROFIT FOR THE YEAR
TOTAL NET REVENUE
Financial Highlights 2017/18 Change % 2016/17 2015/16
Gross income (Rs.'000) 7,000,943 19.75 5,846,505 6,123,730
Gross profit (Rs.'000) 2,379,127 2.73 2,316,003 2,454,368
Net profit before tax (Rs.'000) 1,352,792 (15.69) 1,604,508 1,578,189
Income tax (Rs.'000) 348,795 (2.89) 359,170 399,448
Net Profit (Rs.'000) 1,003,997 (19.38) 1,245,338 1,178,741
Revenue to the Government (Rs.'000) 875,873 (23.23) 1,140,843 1,096,099
Total Assets (Rs.'000) 8,756,292 4.13 8,409,103 7,676,335
Total Liabilities (Rs.'000) 1,831,145 3.72 1,765,475 1,895,286
Shareholder Funds (Rs.'000) 6,925,147 4.24 6,643,628 5,781,049
Earning per share (Rs.) 18.93 (19.38) 23.47 22.22
Dividends per share (Rs.) 10.00 33.33 7.50 7.00
Net assets value per share (Rs.) 130.54 4.24 125.23 108.97
Interest cover (Times) 55.55 7.78 51.54 43.33
Dividend payout ratio (%) 53 58.41 33 43.33
Dividend cover (Times) 1.89 (39.53) 3.13 3.17
Return on capital (%) 17.90 (20.49) 22.51 24.39
Equity :Assets ratios (Times) 0.79 0.10 0.79 0.75
Current ratio (Times) 3.82 18.57 3.22 3.17
Gearing ratio (%) 2.85 (62.42) 7.58 7.30
Profit per employee (Rs.) 2,028,277 (16.94) 2,515,834 2,311257

INTEGRATED ANNUAL REPORT 2017/18 11
SOCIAL
ENVIRONMENT
2 MN
30 MN
511
875 MN 10 MN
PROFIT PER EMPLOYEE
INVESTMENT ON COMPLIANCE
ACTIVITIES
COMPLIANCE WITH CEA STANDARDS
LEEDS GREEN BUILDING CERTIFICATION
REVENUE TO THE GOVERNMENT
TOTAL NUMBER OF EMPLOYEE
DONATION AND CSR
ACTIVITIES

12 LANKA TILES PLC
CHAIRMAN’S MESSAGE

INTEGRATED ANNUAL REPORT 2017/18 13
Economic Value Generated
Rs.3.0Bn
STAKEHOLDER VALUE CREATION82% of economic value generated was redistributed among various stakeholders.
It gives me great pleasure to present to our shareholders the annual report and audited accounts of Lanka Tiles PLC, for the financial year 2017/18. I am pleased to inform our shareholders that your Company has now entered upon a new phase of growth, directed by a multifaceted growth strategy, as conveyed by the theme of this annual report.
During the current financial year, Lanka Tiles consolidated the Indian manufacturing operation with great success to enhance the topline, despite the economic and market downturn experienced during the year. The Company also executed internal realignments, accompanied by a series of forward looking strategic interventions, to fast track growth into the future.
As a result, although the bottomline declined, the Company was able to reverse the previous year’s revenue decline and achieve comfortable income growth of 18% year-on-year, supported by increased sales and domestic production. I am confident the current growth plans will also be able to boost profitability in the near future.
Another achievement during the year was Lanka Tiles qualifying for the Green Building Certificate for its products at the National Green Building Council Awards. In addition, Lanka Tiles was bestowed the Gold Award for Social Dialogue in the Manufacturing Sector, by the Ministry of Labour, at the National Labour Awards 2017. These achievements showcase the Company’s value creation that goes beyond the numbers, towards sustainable and responsible growth.
STAKEHOLDER VALUE CREATION
The Lanka Tiles brand has a long tradition of creating value for shareholders, communities and the country and during the financial year 2017-18, the Company generated Rs. 3.05 Bn in terms of economic value through its business operations. As a much as 82% of this wealth was redistributed among various stakeholders with 20% reverting to employees in the form of salaries and benefits. Employees also continued to benefit from many opportunities for growth and development including regular foreign and local training for upskilling and leadership development.
Lanka Tiles contributed Rs. 1.3 Bn to the state coffers in the form of various taxes. The Company also distributed Rs. 10.0 Mn among the community via many charitable activities. Further details regarding the financial and business performance of the Company during the year can be obtained from the Managing Director’s Review and the Financial Capital Management chapter.
Despite the lower level of profitability compared to the previous years, Lanka Tiles ensured attractive returns for shareholders by increasing the dividend payout ratio and distributing first interim dividend of Rs. 4.00 per share and second interim dividend payment of Rs. 6.00 per share for the financial year 2017/18. With retained profits increasing by Rs. 1,004 Mn the shareholders equity reached Rs. 6.9 Bn, enhancing return on equity by 18 %. With Company assets growing to Rs. 8.7 Bn by end March 2018, return on assets has grown by 12%.
Customers meanwhile, benefited from a range of high quality and extremely competitively priced products, including new designs, sizes and colours. Moreover, under the new retail distribution strategy of Lanka Tiles, consumer accessibility to ‘LANKATILES’ products have also been increased, thereby adding value and convenience to customers. The Company also continued to invest in product development in response to changing consumer trends for new designs and larger sized and specialist tiles. Consistent product quality was maintained through conformity to ISO 9001 and the SLS standards.
Under the distribution network expansion drive, the number of ‘LANKATILES’ business partners has increased significantly and continues to grow as we penetrate further into the country. We are strengthening our distribution network by hiring more warehouses and appointing distributors and dealers in key locations to handle bigger volumes. The Company has also been building industry relationships through the Tilers’ Club and during the current financial year, approximately Rs. 21 Mn was distributed among tile masons for their promotional services.

14 LANKA TILES PLC
“DURING THE YEAR UNDER REVIEW, THE COMPANY EXECUTED INTERNAL REALIGNMENTS, ACCOMPANIED BY A SERIES OF FORWARD LOOKING STRATEGIC INTERVENTIONS, TO FAST TRACK GROWTH INTO THE FUTURE.”
CHAIRMAN’S MESSAGE
The Company also continued to invest in product development in response to changing consumer trends for new designs and larger sized and specialist tiles.
COMPLIANCE AND GOOD GOVERNANCE
As part of the Lanka Walltiles Group, Lanka Tiles PLC conforms to the stringent compliance policies of the Group at all times. Therefore, I am pleased to report that Lanka Tiles PLC and its Associate, the Swisstek (Ceylon) PLC group, which includes Swisstek (Ceylon) PLC and Swisstek Aluminium Ltd, did not face any fines or penalties for non-compliance, or delays in compliance with any applicable regulations.
Governance systems, internal controls and risk management processes were continually reviewed by the Board Sub committees, with Board participation whenever required to ensure compliance with industry best practices in all aspects of the business. Internal monitoring and oversight procedures were also assessed for maximum effectiveness, in addition to internal audits on finances and stocks. We also continued to strengthen the Company’s Audit Committee and Remuneration Committee to ensure optimum utilisation of Company financial and non-financial assets.
FUTURE DIRECTION
In line with growth plans for the Lanka Walltiles Group to double Group profitability over the short term, Lanka Tiles is positioned
to significantly grow its business volumes and markets. This growth is envisaged through organic growth in existing markets and product segments, facilitated through the Group’s new retail and distribution strategy, and also through inorganic growth that will be achieved through new business ventures.
New investments include plans to construct an industrial park, co-owned by Lanka Walltiles and Lanka Tiles, and a new venture to manufacture sandwich panels, and a number of other investment opportunities that are under
consideration for the Lanka Walltiles Group. This business diversification will be funded through internally generated funds and borrowings and will not require capital outlay from our shareholders. The Group will also make substantial investments to increase and upgrade domestic manufacturing capabilities.
Meanwhile, Lanka Tiles will continue to expand the outsourced manufacturing model in India, to supplement domestic production. The Company will also introduce new products to the market to build brand equity and brand visibility though a

INTEGRATED ANNUAL REPORT 2017/18 15
Dhammika Perera - Chairman
Lanka Tiles is positioned to significantly grow its business volumes and markets. This growth is envisaged through organic growth in existing markets and product segments, and also through inorganic growth that will be achieved through new business ventures.
diversified product portfolio. Through our investments into new product development and brand building, we hope to reposition the ‘LANKATILES’ brand as a modern, youthful brand, that continues to enshrine the core brand value of trust. We believe our plans will make it possible to offer better value to customers, while also enhancing our brand-equity, which would enhance value for all stakeholders.
We are also committed to ensure that the transition of Lanka Tiles PLC onto a higher growth trajectory will be achieved within a socially and environmentally responsible business model.
ACKNOWLEDGEMENTS
As we take on new challenges and new opportunities to transform our Company into a bigger, better organisation, I would like to express my appreciations to the Board of Directors for guiding and directing
this complex process of change. I also thank the Managing Director, the Senior Management and the entire staff of Lanka Tiles PLC, for their contributions towards the Company’s change process. To our shareholders, I extend my gratitude for their continued support of the Company and the Board of Directors. I would also like to express my appreciations to our valued customers, bankers, distributors, dealers and other business partners for their loyalty and patronage.
Sincerely
Dhammika PereraChairman
25th May 2018

16 LANKA TILES PLC
MANAGING DIRECTOR’S REVIEW

INTEGRATED ANNUAL REPORT 2017/18 17
I am happy to report that Lanka Tiles PLC maintained business growth and strategic direction in 2017/18 to consolidate our foundation for sustained future growth. As highlighted by our theme for the year, we are converting external threats into opportunities and realigning our business model onto a stronger and more sustainable growth trajectory based on a multifaceted platform that is designed to facilitate greater value creation opportunities for all our stakeholders.
OPERATING ENVIRONMENT
On a positive note, the country benefited from stable market interest rates and fairly steady exchange rates, which established a reasonably predictable business environment for financial planning and working capital management. However, the deceleration in GDP growth rate, and supply-and-demand discrepancies specific to the tile marketplace, made the financial year 2017/18 disadvantages for the tile sector from a retail perspective.
Construction sector growth, the primary demand driver for tiles, was revised downward by the Central Bank from 9%, to 3% in the current financial year, reflecting the overall lower levels of real estate development activities by businesses, and lower investments in personal living spaces by consumers. The general downturn in demand can be attributed to a range of factors, including lower disposable incomes among individual households and unfavourable investor sentiments. Compounding this situation of weak retail demand, the tile manufacturing industry was faced with rising cost structures, primarily driven by fiscal policy changes and upward revision of energy costs. As a high energy consumer for manufacturing purposes, higher energy prices contributed directly towards a disproportionate increase in operating costs, compared to the previous year, which in turn, exerted downward pressure on margins.
Meanwhile, although the floor and wall tile markets experienced a sluggish in demand, the supply side continued to expand, due to the influx of low priced, imported tiles flooding the local market. These inflows posed a serious threat to market share of domestic tile manufactures and succeeded in driving down market prices further, thereby eroding industry bottomlines as a whole.
Due to this external context, the Lanka Tiles brand was thrust into a highly price competitive environment, under a very real threat of further losses in market share. However, I am pleased to report to our shareholders that your Company has not only been able defended market share, but has rolled out a highly competitive, multifaceted strategy with enhanced revenue opportunities to expand market share and growing our profits.
Addressing TPM Forum
Rs.6.1Bn
TURNOVER GROWTH
impressive growth of 18% year-on-year, for 2017/18 from Rs. 5.1 Bn to
impressive growth

18 LANKA TILES PLC
SUMMARY OF FINANCIAL PERFORMANCE
I believe our revenue numbers indicate that Lanka Tiles is on the road to recovery and growth. Despite extremely poor demand conditions and lower priced imported substitute products, we were able to generate an impressive growth in turnover of 18% year-on-year, for 2017/18 from Rs. 5.1 Bn to Rs. 6.1 Bn, with a 43% increase in export sales. Export revenues increased from Rs. 185.4 Mn, to Rs. 265.3 Mn during the year, benefiting from favourable exchange rates and sustained export volumes to countries such as Australia.
While the cost of sales grew by 31% during the year due to cost increases, we were able to achieve a gross profit increase of 2.7% for the year, from Rs. 2.31 Bn, to Rs. 2.37 Bn.
However, the higher operating overheads and margin losses encountered in defending market share caused our profits before interest and tax to fall to Rs. 1.1 Bn, from Rs. 1.3 Bn last year. Overall, the net profits declined from Rs. 1,245 Mn in 2016/17, to Rs. 1,004 Mn this year.
Through the groupwide implementation of a Total Productive Maintenance Programme (TPM), Lanka Tiles was able to save nearly Rs. 100 Mn on manufacturing expenses.
ASSOCIATE - SWISSTEK (CEYLON) PLC GROUP
Our Associate, the Swisstek (Ceylon) PLC group, which includes Swisstek (Ceylon) PLC and Swisstek Aluminium Ltd, recorded a group revenue increase of 18% to Rs. 4 Bn in the current financial year, from Rs. 3.4 Bn in the 2016/17 financial year. Group profitability however, declined to Rs. 378 Mn from Rs. 429 Mn, due to increased aluminium prices at Swisstek Aluminium Ltd.
Further details on our financial status as at end March 2018, are presented in the Financial Capital Management chapter of this report for the benefit of our shareholders.
RISK MANAGEMENT STRATEGY
The most significant threat to the Company during the year was imports from China and other low cost manufacturing destinations. These imports have by now captured nearly 60% of the local tile market.
Although these products are inconsistent in quality, they have successfully penetrated local markets through small, often unreliable retail channels, primarily on the basis of extremely low retail pricing, as these manufacturers do not face comparable energy costs and other costs associated with quality and environmental standards that are observed by domestic tile manufacturers.
“EXPORT REVENUES INCREASED FROM RS. 185.4 MN, TO RS. 265.3 MN DURING THE YEAR, BENEFITING FROM FAVOURABLE EXCHANGE RATES AND SUSTAINED EXPORT VOLUMES.”
MANAGING DIRECTOR’S REVIEW
Tile manufacturing facility

INTEGRATED ANNUAL REPORT 2017/18 19
During the current financial year, Lanka Tiles PLC took this competition head-on, by deploying our counter strategy of own-brand, made-in-India tiles, for specific product lines. These product categories are those that can be manufactured more cost-efficiently in India and are also new product types that have augmented the ‘LANKATILES’ product portfolio. I must stress that as our tiles are marketed under the unblemished and trusted ‘LANKATILES’ brand, we have taken great care to maintain our quality standards with regards to all our Indian imports.
The inclusion of the Indian product range has given domestic consumers a wider selection of design options, sizes and colour scheme choices, under the reliable ‘LANKATILES’ service standards, to differentiate and strengthen our brand position within the crowded market.
At a parent company level, we also implemented a new retail distribution strategy with the primary objective of rapidly increasing consumer accessibility to our products. Under the new distribution strategy, we have dramatically increased the number of distribution points by entering into third party agreements across the country to penetrate the market and bring our products closer to our potential customers.
Domestic consumers now have the choice of selecting floor tiles from a wider range of designs and sizes, manufactured to international standard, priced at extremely competitive rates, under the long-trusted ‘LANKATILES’ brand name, as opposed to dubious quality, imported products. I believe our multifaceted strategy has been reasonably successful in containing market threats, as demonstrated by the growth in our sales figures in the current financial year.
OPERATIONAL PERFORMANCE
At an operational level, we have continued to gain efficiencies and cost savings, coupled with productivity improvements and attitudinal changes, primarily through ongoing internal restructuring of factory work flows, improvements to ICT applications and continuous cost-benefit assessments in all productive functions.
During the year our manufacturing facilities operated at capacity at a highly satisfactory capacity utilisation level of 99%, from 90% achieved in the previous year. Consequently, domestic production volumes increased by 7.7%, to 3.8 Mn square metres, from 3.5 Mn square metres. This is in addition to an import volume of 0.5 Mn square metres. We were able to dispose of 95% of this total volume
by leveraging our new, island wide, retail and distribution strategy. Our inventory levels increased from Rs. 1.4 Mn square metres, to Rs. 1.9 Mn square metres during the year due to the balance stocks. However, I am confident the growth of our distribution network would enable faster stock turnaround in the new financial year and will also expand market capacity for ‘LANKATILES’ products, to attain a faster topline growth.
Despite the all-round cost increases and output growth, we were able to contain the average cost of
J A P M Jayasekera - Managing Director
Your Company has not only been able to successfully defend market share, but has rolled out a highly competitive, multifaceted strategy with enhanced revenue opportunities to expand market share and revitalise our profits.
Employee long service awards

20 LANKA TILES PLC
production to a marginal increase, which I believe is a commendable achievement in cost management. That is primarily attributable to modifications to production line and cost savings from the TPM exercise, which we reduced machine breakdowns and stoppages.
As always, our drive towards self-improvement was tempered by our sense of responsibility towards the environment. During the current financial year, a major achievement by Lanka Tiles was obtaining the Green Building Certificate, which demonstrates our commitment towards environmental accountability.
As a key component of our productivity improvement programme we continued to invest in overseas and domestic training for our employees. We also created growth opportunities through regular performance assessments and promotions. The improvements to
employee satisfaction levels, as demonstrated in the ‘Great Place to Work’ survey, indicates that our employees appreciate our efforts and we also benefit from low employee turnover.
OUTLOOK AND GROWTH STRATEGY
I consider the current slow market as an opportunity to strengthen the ‘LANKATILES’ market position. Competitors, particularly opportunistic, fly-by-night new entrants are generally unwilling to expand and invest under such market conditions. Therefore, as a home-grown Sri Lankan business, I believe this is an opportunity to realign our
MANAGING DIRECTOR’S REVIEW
competitive strategies and build-up investments to consolidate our footprint in the country. This will position ‘LANKATILES’ on an extremely strong footing when the construction industry recovers and demand growth revives, which I am confident will happen in the short term with new development projects.
The export market will remain highly competitive in the near future also, considering the high manufacturing cost that we have compared to countries like China and India. However, we will continue to focus on expanding the export business by delivering high quality tiles with better designs and superior customer service. In addition we will be looking at moving in to new export markets to grow our business.
However, a key challenge facing the Company is the deffered tax provisioning component that will come into effect in the new financial year under the new Inland Revenue Act. For the 2017-18 fiscal year, we estimate an increased cost burden of up to Rs. 10.0 Mn, due to the provisioning, which will continue to increase as we grow our business every year. While Lanka Tiles has the financial capacity to absorb this cost
“AT AN OPERATIONAL LEVEL, WE HAVE CONTINUED TO GAIN EFFICIENCIES AND COST SAVINGS, COUPLED WITH PRODUCTIVITY IMPROVEMENTS AND ATTITUDINAL CHANGES.”

INTEGRATED ANNUAL REPORT 2017/18 21
increase, it will have the negative impact of constricting our growth plans by reducing available financial resources for investments.
Going forward, we will aggressively work at recapturing market share from foreign tiles. To do so, we have already initiated a capacity expansion programme with our parent, Lanka Walltiles. We are investing Rs. 2 Bn to enhance our factory capacity by 30% and we have already broken ground for this expansion, targeted to come on-line within 2018. We will also add about 400,000 square feet of warehousing space through our dealer and distributor network.
To tap into emerging market opportunities, we are diversifying into new business segments in collaboration with Lanka Walltiles. We are currently in the process of investing in a new sandwich panel factory and a number of other investment opportunities are also on the drawing board.
Our growth plans will position Lanka Tiles PLC for new era of growth hitherto not experienced by the Company. I am confident we can make this transition as a team and take our Company to new heights to generate greater benefits for all our stakeholders.
APPRECIATIONS
I would like to thank the Chairman and the Board of Directors for their dedication towards driving this Company to achieve its potential against all odds. I would also like to thank the management and staff for their commitment towards the Company. I extend a special thank you to our shareholders for the confidence placed in the management and the Company. My appreciations also go out to our customers, dealers, distributors, bankers, suppliers and other stakeholders for their continued loyalty and support to Lanka Tiles PLC.
Sincerely
J A P M JayasekeraManaging Director
25th May 2018
Perceptions showroom for high-end tile
Working towards a green factory

22 LANKA TILES PLC
BOARD OF DIRECTORS
Mr. Dhammika PereraChairman
Mr. A M Weerasinghe Deputy Chairman
“A VISIONARY LEADERSHIP DRIVING MULTIFACETED GROWTH ACROSS THE GROUP.”
Mr. J A P M JayasekeraManaging Director
Dr. S SelliahDirector

INTEGRATED ANNUAL REPORT 2017/18 23
Ms. A M L PageDirector
Mr. G A R D PrasannaAlternate Director
Mr. T G ThoradeniyaDirector
Mr. K D G GunaratneDirector

24 LANKA TILES PLC
Mr. Dhammika PereraChairman
Mr. Dhammika Perera is the quintessential strategist and business specialist with interests in a variety of key industries including Manufacturing, Banking and Finance, Hospitality and Hydropower generation. He has nearly thirty years of experience in building formidable business through unmatched strategic foresight.
Mr. Perera is the Chairman of Vallibel One PLC, Royal Ceramics Lanka PLC, Lanka Ceramic PLC, Lanka Tiles PLC, Lanka Walltiles PLC, The Fortress Resorts PLC, Vallibel Power Erathna PLC, Delmege Limited, and LB Microfinance Myanmar Company Limited. He is the Co-Chairman of Hayleys PLC, The Kingsbury PLC, Singer (Sri Lanka) PLC, Executive Deputy Chairman of LB Finance PLC and Deputy Chairman of Horana Plantations PLC. He is also the Executive Director of Vallibel Finance PLC and serves on the Boards of Amaya Leisure PLC, Haycarb PLC, Hayleys Fabric PLC, Dipped Products PLC, and Hayleys Global Beverages (Pvt) Limited.
Mr. A M Weerasinghe Deputy Chairman
Founder of Royal Ceramics Lanka PLC in 1990. A Gem Merchant by profession. Mr. Weerasinghe has been in the business field for more than 35 years involved in Real Estate, Construction, Transportation & Hospital Industry and a Landed Proprietor. In addition to the above, he is also the Chairman of Singhe Hospitals Ltd and Weerasinghe Property Development (Pvt) Ltd.
Mr. J A P M JayasekeraManaging Director
Mr. Mahendra Jayasekera is the Managing Director of Lanka Walltiles PLC, Lanka Tiles PLC, Swisstek (Ceylon) PLC, Lanka Ceramic PLC and Swisstek Aluminium Limited. He is also a Director of HNB Assurance PLC, Uni DilPackaging Limited and Uni Dil Packaging Solutions Limited.
Mr. Jayasekera holds a BSc Special (Hons) degree in Business Administration from the University of Sri Jayawardenapura and is a Fellow Member of the Institute of Chartered Accountants of Sri Lanka.
Dr. S SelliahDirector
Dr. Selliah holds an MBBS degree and a Master’s Degree (M.Phil). He has over two decades of diverse experience in various fields which include areas of manufacturing, healthcare, plantations, packaging, logistics and retail.
He currently holds the position of Deputy Chairman of Asiri Hospitals Holdings PLC, Deputy Chairman of Asiri Surgical Hospital PLC and Central Hospital Pvt Ltd. He is a Director of Lanka Tiles PLC, Lanka Walltiles PLC, Softlogic Holdings PLC, ODEL PLC, HNB Assurance PLC, ACL Cables PLC, Lanka Ceramic PLC, Swisstek (Ceylon) PLC and Swisstek Aluminium Ltd. Dr. Selliah is the Chairman of JAT Holdings Pvt Ltd, Cleanco Lanka Pvt Ltd.
Dr. Selliah serves on the Audit committee, Investment committee, Risk committee, Strategic planning committee, Related Party Transaction committee and HR & Remuneration committee of some of the companies listed above.
BOARD OF DIRECTOR’S

INTEGRATED ANNUAL REPORT 2017/18 25
Mr. T G ThoradeniyaDirector
Mr. Tharana Thoradeniya has over two decades of senior management experience in multi-industry scenarios. He sits on the Boards of several public quoted and privately held companies in Sri Lanka, including Pan Asia Banking Corporation PLC, Lanka Walltiles PLC, Lanka Ceramic PLC, Hayleys Fibre PLC, Delmege Ltd, Unidil Packaging Ltd, Vallibel Plantation Management Ltd, Dipped Products (Thailand) Ltd., and several others. He is a Group Director of Royal Ceramics Lanka PLC and CEO/Director of Rocell Bathware Ltd. Mr. Tharana has been credited as a proven business innovator across industries. A marketer by profession, Tharana was in the pioneering batch of Chartered Marketers of the Chartered Institute of Marketing (UK).
Mr. K D G GunaratneDirector
Mr. Gunaratne studied at St. Thomas’ College Mt. Lavinia and was a member of the Western Province Council during the period 1989 to 2009.
He currently holds the position of Chairman Lanka Hotels & Residences (Pvt) Ltd and Urban Investments & Development Company (Pvt) Ltd. He also serves as a Director of Lanka Tiles PLC, Lanka Walltiles PLC, Lanka Ceramic PLC and Dipped Products PLC and as an Alternate Director at Horana Plantations PLC.
Ms. A M L PageDirector
Ms. Anjalie Page holds a BSc (Hons) Psychology (First Class) from the University of Nottingham, United Kingdom and a MSc in Economics, Finance and Management (Distinction) from the University of Bristol, United Kingdom.
Ms. Page has been employed at several institutions in Sri Lanka and overseas.
Mr. G A R D PrasannaAlternate Director
Mr. Dimuth Prasanna was appointed as an Alternate Director to the Lanka Tiles Board on 10th October 2014. He is the Managing Director of Wise Property Solutions Pvt Ltd and also serves as Director on the Boards of Pan Asia Banking Corporation PLC, Delmege Limited, Grand Mark Pvt Ltd and Royal Ceramic Lanka PLC.

26 LANKA TILES PLC
SENIOR MANAGEMENT
Mahendra JayasekeraManaging Director
Nandajith Somaratne Group General Manager Manufacturing
Shirley MahendraGeneral Manager (Marketing)
Tyrell RocheGeneral Manager (Finance)
Patrick PiyasenaAssistant General Manager (Plant and Technical)
Nathalie Kehrli Head of Design

INTEGRATED ANNUAL REPORT 2017/18 27
Sajeewani AmarasingheGroup Finance Manager
Prabhath PupulewattaFactory Manager
Upul WeerasingheGroup Engineering Manager
Prasad KeerthiratnaGroup IT Manager
Anura RatnayakeGroup Business Development Manager
Kaushalya SudasingheGroup Manager - Sales Administration

28 LANKA TILES PLC
OUR BUSINESS MODEL
Our business model depicts how we utilise our financial and non financial capitals to create value for our stakeholders.
The Company’s strategic value mapping process revolve around three strategic thrusts,
1. Invest to reinforce Financial Capital and Manufacturing Capital
2. Innovate to strengthen Intellectual Capital
3. Evolve to become a sustainable business by developing Human Capital, Social Capital and Natural Capital
CREATING VALUE FOR OUR STAKEHOLDERS
Capi
tal I
nput
s Value Outputs
FINANCIAL CAPITAL
NATURAL CAPITAL
Carbon footprint
MANUFACTURING CAPITAL
Manufacturing efficiency
SOCIAL CAPITAL
Community capacity building
INTELLECTUAL CAPITAL
New products
HUMAN CAPITAL
Improvement in employee productivity
Processes
Sales, Growth, PAT
Invest to reinforce Financial and
Manufacturing Capital
Innovate to strengthen Intellectual Capital
Evolve to become a sustainable business by developing Human Capital, Social Capital
and Natural Capital
CREATING VALUE FOR OUR STAKEHOLDERS
INTEGRATED ANNUAL REPORT 2017/18 29
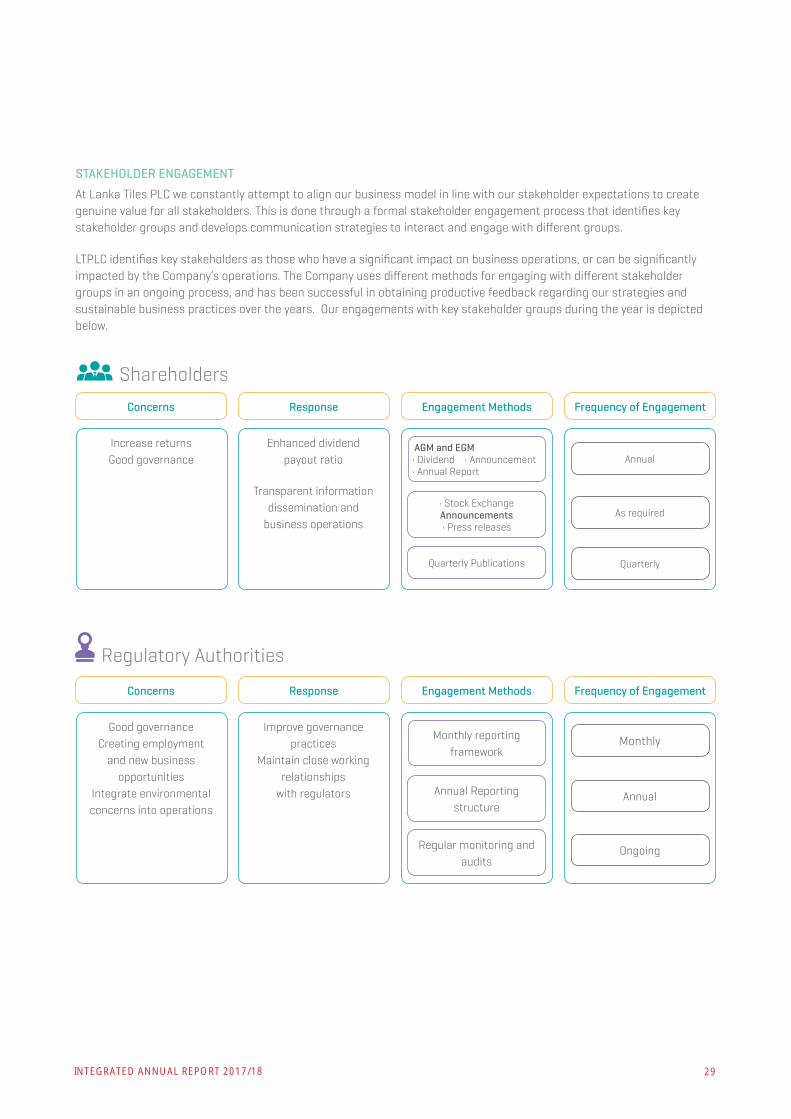
STAKEHOLDER ENGAGEMENT
At Lanka Tiles PLC we constantly attempt to align our business model in line with our stakeholder expectations to create genuine value for all stakeholders. This is done through a formal stakeholder engagement process that identifies key stakeholder groups and develops communication strategies to interact and engage with different groups.
LTPLC identifies key stakeholders as those who have a significant impact on business operations, or can be significantly impacted by the Company’s operations. The Company uses different methods for engaging with different stakeholder groups in an ongoing process, and has been successful in obtaining productive feedback regarding our strategies and sustainable business practices over the years. Our engagements with key stakeholder groups during the year is depicted below.
Increase returnsGood governance
Good governance Creating employment
and new business opportunities
Integrate environmental concerns into operations
Enhanced dividend payout ratio
Transparent information dissemination and
business operations
Improve governancepractices
Maintain close working relationships
with regulators
Regulatory Authorities
Shareholders
Concerns
Concerns
Response
Response
Engagement Methods
Engagement Methods
Frequency of Engagement
Frequency of Engagement
AGM and EGM• Dividend • Announcement• Annual Report
Monthly reportingframework
• Stock Exchange Announcements• Press releases
Annual Reportingstructure
Regular monitoring andaudits
Quarterly Publications
Annual
Monthly
As required
Annual
Quarterly
Ongoing

30 LANKA TILES PLC
Development and growth Employment security
Value for money Product quality
Reliable service Accessibility choices
Modern designs
Training opportunities were increased
Provided salary increments
Performance appraisals were conducted
Expanded retail and storage for better access
Many new products and designs introduced
Employees trained on customer
Competitive pricing
Employees
Customers
Distributor
Concerns
Concerns
Concerns
Response
Response
Response
Engagement Methods
Engagement Methods
Engagement Methods
Frequency of Engagement
Frequency of Engagement
Frequency of Engagement
Direct interactions with senior management Notice
Boards Letters/ Email Notices Meetings Workshops
Labour forums
Face-to-face interactions• Customer hotline• Customer complaints
process Monthly Customer surveys
• Customer Satisfaction Index Social media interactions
Company sponsored social Interactions
Performance Appraisals
As required
Ongoing• As and when required
Annual
An• 24/7 x 365days ual
Biannual
Improve performance and skills development
Business support services
Face-to-face interactions• Customer hotline• Customer complaints
process
OngoingAs and when
required
Knowledge transferSet-up an Index for
distributors
Customer surveys• Customer Satisfaction
Index Monthly
CREATING VALUE FOR OUR STAKEHOLDERS

INTEGRATED ANNUAL REPORT 2017/18 31
Safety and environmental concerns
Support for social events
All environmental precautions are observed at all times
Improved systems to reduce environmental impacts
We have bought land surrounding the factory
We support community activities
Communities
Suppliers
Concerns
Concerns
Response
Response
Engagement Methods
Engagement Methods
Frequency of Engagement
Frequency of Engagement
As and whenrequired
Grow their businessSkills development
Develop and Maintain asupplier base
Conduct workshops and trainings
Supplier visitsMeetings
Industry forums
As and when required
Hotline to addresscommunity complaints
Participation incommunity activities

32 LANKA TILES PLC
EXTERNAL ENVIRONMENT The country’s economic growth decelerated to 3.1 per cent in 2017, compared to the growth of 4.5 per cent in 2016, mainly attributed to drought conditions. Both services and industry related activities, which together account for 92.4 per cent of gross value added, recorded growth rates of below 4 per cent. The agriculture related activities recorded a negative growth for the second consecutive year, although estimates for Quarter 4, 2017 indicated a recovery in the sector.
Following the increase in inflation during early 2017, the policy interest rates of the Central Bank, the Standing Deposit Facility Rate (SDFR) and the Standing Lending Facility Rate (SLFR) were increased by 25 basis points in March 2017 to 7.25 per cent and 8.75 per cent, respectively, in addition to the 100 basis point increase in policy interest rates and the 1.50 percentage point increase in the Statutory Reserve Ratio (SRR) in 2016. In view of the tight monetary conditions in the economy, market interest rates continued to increase further during 2017, although some market interest rates started to stabilise or adjust downwards towards the end of the year reflecting the improved liquidity conditions in the market. Deposit and lending interest rates of commercial banks continued to increase during most of 2017 raising the cost of
funds in the economy. However, some moderation in deposit rates was observed towards the end of the year, while lending rates stabilised at elevated levels.
Reflecting the movements in the cross currency exchange rates against the US dollar, the rupee depreciated markedly against all other major currencies in 2017. Reflecting the nominal depreciation of the Sri Lankan rupee against the US dollar and other major currencies, the Nominal Effective Exchange Rate (NEER) indices depreciated. The 5-currency NEER index depreciated by 8.68 per cent, while the 24-currency index depreciated by 7.75 per cent in 2017. Meanwhile, the Real Effective Exchange Rate (REER)
based on 5-currency and 24-currency REER indices also depreciated by 4.83 per cent and 4.85 per cent, respectively, moving close to the 100 index point mark by the end of the year. Energy prices too continued to increase during the year.
INDUSTRY OVERVIEW
The market for tiles contracted in 2017, due to the sharp downturn in the construction sector and the industry faced increased inflows of imported tiles, mainly from India and China. This environment of contracting demand and rising costs, coupled with intense price competition made the industry extremely challenging in 2017-18 for domestic tile manufactures.
From the Company origins of manufacturing only tiles, today the Lanka Tiles Group is a total solutions provider to our customers.
“THE ENVIRONMENT OF CONTRACTING DEMAND AND RISING COSTS, COUPLED WITH INTENSE PRICE COMPETITION MADE THE INDUSTRY EXTREMELY CHALLENGING IN 2017-18.”
CREATING VALUE FOR OUR STAKEHOLDERS

INTEGRATED ANNUAL REPORT 2017/18 33
The value added of construction activities declined to a growth rate of by 3.1 per cent in 2017, compared to 8.3 per cent growth in 2016. This slowdown in construction activities was reflected in cement production and imports, which grew at slower rates of 4.6 per cent and 7.1 per cent, respectively, in 2017, compared to the respective growth rates of 17.8 per cent and 29.5 per cent in 2016. It collectively recorded a 6.3 per cent growth in 2017, compared to 25.3 per cent growth in 2016. Further, the building material imports volume index, which increased by 22.9 per cent in 2016, recorded an increase of 6.8 per cent in 2017, indicating the deceleration in construction activities. In the meantime, the realised growth in construction activities was supported by the infrastructure projects, and large scale residential and mixed development projects. Credit extended to the private sector for construction activities by Licensed Commercial Banks (LCBs) slowed down to 22.5 per cent as at end December 2017, compared to 26.9 per cent growth recorded as at end December 2016. Further, credit granted for personal housing construction activities by LCBs grew by 22.3 per cent as at end December 2017, reflecting the private sector involvement in construction activities.
CONSUMER TRENDS
Consumer demand trends in local tile markets continued to move towards larger tile sizes and new modern designs. Consumers also increasingly prefer porcelain tiles that can be used both on walls and tiles rather than specialised products specifically for walls and floors. The Company has responded to these changes by developing a range of new products in line with consumer trends.
LANKA TILES’ BUSINESS OPERATIONS
Lanka Tiles PLC (LTPLC) continued to overcome market changes and uncertainties with strategic focus and vision in the financial year 2017/18. From the Company origins of manufacturing only tiles, today the LANKA TILES Group is a total solutions provider to our customers by also supplying tile adhesives, tile grout, tile cleaner, tile leveller and trained tillers. This transformation has facilitated great market responsiveness while positioning the Company in a unique platform among domestic tile manufacturers, as a specialist supplier with wide ranging and unmatched synergistic technical capabilities.
In an environment of escalating competition from extreme low cost imported tiles that have permeated the width and breadth of Sri Lankan markets, the Company made commendable gains in consolidating market share and differentiating the LANKA TILES brand to stand out head and shoulders above the competition using a quality platform that has been tried and tested for decades.
As a direct outcome of the effectiveness of the Company’s counter strategies to battle the onslaught of imports, as described in detail by the Managing Director in his review for the year, LANKA TILES closed the year with a 15% stake of the country’s entire floor tile market. This dramatic market consolidation has positioned LANKA TILES as a local leader in floor tiles production and retail with a strong foundation to support future growth.
Summary of operational performance
Measure 2017/18 2016/17 Change
Domestic production 3.8 Mn Sqmt 3.5 Mn Sqmt 10%Indian production 0.5 Mn Sqmt 0.1 Mn Sqmt 400%Domestic capacity utilisation 99% 90% 10%
Perceptions showroom for high-end products

34 LANKA TILES PLC
MANUFACTURING OPERATIONS
The Company continued to streamline and improve manufacturing operations during the year to sustain market competitiveness at pricing level and product design level.
TOTAL PRODUCTIVE MAINTENANCE PROGRAMME (TPM)
During the current financial year, the LANKATILES manufacturing operations achieved remarkable operational efficiencies coupled with capacity improvements through the implementation of a Total Productive Maintenance Programme (TPM). We are pleased to report an unparalleled, almost 100% capacity utilisation
The Company achieved remarkable operational efficiencies coupled withcapacity improvements through the implementation of a Total Productive Maintenance Programme (TPM).
Before After
PATRIC PIYASENAFacilitator
MAHINDA BALASOORIYA
Training & Education
MOHAN PERERA
Autonomous Maintenance
GRASHAN JAYARATNE
Planned Maintenance
SUMEDA MADAWALA
QM & EM
PRABATH PUPULAWATTE
Focused Improvement
THILAKSIRI
Supply Chain / Logistic
THILAKARATNE
S.H.E
MAHENDRA JAYASEKARA
Managing Director
PILLAR STRUCTURE
CREATING VALUE FOR OUR STAKEHOLDERS
OPERATIONAL PERFORMANCE
Measure 2017/18 2016/17
Return on Net Assets 12% 15%Manufacturing Costs to Total Expenses ratio 60% 60%Inventory Turnover ratio 60 Days 30 DaysLabour turnover ratio 2.0% 2.0%ROCE 14% 17%

INTEGRATED ANNUAL REPORT 2017/18 35
during the year, from 90% in the previous year to 99% in the current financial year generating maximum returns on assets for the Company during the year.
The TPM, which is a Group wide exercise, is an in-depth and wide-reaching productivity improvement initiative comprising comprehensive evaluations of existing productions flows and procedures at our manufacturing units to identify changes towards enhancing overall productivity parameters. The execution of the TPM programme resulted a number of modifications to production lines that had the beneficial outcome of not only more efficient factory floor turn-around, but also cost savings and energy savings due to elimination of repetitive activities, duplications and redundant steps within crosscutting production system. Overall efficiency levels and productivity levels improved significantly due to resultant outcomes of lower incidence of machine breakdowns and work stoppages. Consequently, we are pleased to report that LANKATILES was able to save nearly Rs. 100 Mn on manufacturing expenses, as a direct
outcome of the TPM programme. We anticipate savings and efficiency gains to continue as we continue to operate within the TPM guidelines that would enable further fine-tuning and readjustments of production centres to create a leaner more streamlined manufacturing operation.
SKILL DEVELOPMENT
In parallel with TPM deployment we continued to focus on up scaling our production cadre to integrate the latest manufacturing management methodologies into the operations.
We anticipate savings and efficiency gains to continue as we continue tooperate within the TPM guidelines, creating a leaner more streamlined manufacturing operation.
One way of enriching our employee’s knowledge base was by getting them to travel overseas regularly to work in affiliated factories, mainly in India due to the use of English and cultural proximities, and also Japan. During the year, every month about 15-20 people at all levels, from factory workers to supervisors, were sent abroad. They gained first-hand experience on how these factories operate, their organisation culture and work ethics.
We are conscious that the skill-levels of employees at all levels should be enhanced to meet emerging challenges and undertake new projects. Therefore, in addition to production floor employees, executive staff and executive-level employees engaged in various projects including new product developments, and sanitary-ware and faucet marketing, promotions and merchandising, have all been given specialised training opportunities to enhance overall competitiveness of the business.
“THE COMPANY CONTINUED TO STREAMLINE AND IMPROVE MANUFACTURING OPERATIONS DURING THE YEAR TO SUSTAIN MARKET COMPETITIVENESS.”

36 LANKA TILES PLC
IMPORTS - INDIAN OUTSOURCING OPERATION
In January 2017, in a ground-breaking move to lay the foundation for future business expansion, the Company entered into a strategic partnership with a leading Indian tile manufacturer as an outsourcing partner.
Our strategic partnership with Ambani Vitrified (Pvt) Ltd, a leading manufacturer of tiles in Gujrat, will aid LANKATILES to increase its outputs under the LANKATILES brand name at a competitive rate to an address the rising threat of low cost imported tiles flooding the Sri Lankan market. The tiles manufactured in India face stringent quality standards, on par with the Company’s Sri Lankan operations, including the SLS standard manufacturing requirements.
This outsourcing partnership is a first step for the Company’s longer term aspirations of building a larger overseas market in neighbouring countries, and further expanding our reputation as a quality tile manufacturer in international markets.
During the current financial year, tiles manufactured under the LANKATILES brand from Morbi, Gujarat contributed 50 Mn Square metres of output to supplement the domestic production.
EXPORT EXPANSION
While mainly supplying tiles to the Sri Lankan market, the Company exports 5% of our manufactured tiles to several countries such as USA, Canada, Japan, Singapore, New Zealand and Australia as well as some European countries. The Company also has an established showroom in Bangalore, India. As part of the
overseas expansion drive we are constantly monitoring opportunities in foreign markets.
During 2017, the Bangalore showroom of the Company continues to serve its customers satisfactorily providing them with surface solutions that meet their requirements and quality standards. In the coming years, LTPLC will mobilise its plans to increase sales in India and expand the distribution network, while simultaneously enhancing the Company’s brand positioning in the Indian market place.
In 2017 the Company also successfully entered new export markets in North America and Europe, thereby expanding its global footprint to 10 countries.
TorontoMontreal
Vancover
Los Angeles
Charles’ Town
Gothenburg
Felionstove
RotterdamKobe
KathmanduKarachi
Oman Bangalore
Male
Singapore
Brisbane
AdelaideSydney
FremantleAuckland
Wellington
CREATING VALUE FOR OUR STAKEHOLDERS

INTEGRATED ANNUAL REPORT 2017/18 37
FINANCIAL CAPITAL This chapter sets out the status of the financial capital base of the Lanka Tiles Group as at end March 2018. It demonstrates the Group’s financial stability and ability to withstand financial shocks through prudent cash management and strategic planning of investments.
FINANCIAL CAPITAL MANAGEMENT
The risks associated with the financial capital base of the Group is managed on a daily basis through the financial risk management framework which defines risk components and risk appetite for the Company and the Group. Financial risks faced by the Company and Group are explained in the financial statements, note 04 and the Risk Management section of this report.
CHANGES TO FINANCIAL CAPITAL STRUCTURE
The Group financial capital structure did not experience changes to equity during the year and total issued share capital remained at Rs. 900 Mn in 53,050,410 ordinary shares. The Swisstek Group’s equity was Rs. 368 Mn, comprising 27,320,000 shares.
However, the market value of the Company decreased from Rs. 5.4 Bn 2016-17 to Rs. 5.3 Bn in 2017-18 with the share price standing at Rs. 99.70 as at end March 2018. As at end March 2018, the shareholders equity of the group increased to Rs. 6.9 Bn, due to growth in retained profits by Rs. 1 Bn.
CAPITAL MANAGEMENT REPORT
The debt capital of the Group, as at end March 2018, comprised Rs. 201 Mn of long term and short term borrowing. Long term liabilities decreased to Rs. 7.3 Mn from Rs. 56 Mn in 2016-17. As a result, the debt to equity ratio moved from 8% in 2016-17, to 3% in 2017-18 and the gearing ratio improved from 8%in 2016-17 to 3%. The weighted average cost of capital increased from 11% to12%, due to the higher dividend paid.
During the year the Company accessed financial facilities from banks for its imports and working capital requirements to the value of Rs. 100 Mn, in rupee loans.
Summary of operational performance
Capital component Group Company
Value in 2016-17 Rs..
Value in 2017-18 Rs..
% change Value in 2016-17 Rs..
Value in 2017-18 Rs..
% change
Equity * Ordinary shares
53,050,410 53,050,410 0 53,050,410 53,050,410 0
Debt* Short term debt (Rs..000’) 488,553 194,028 (60) 488,553 194,028 (60)
* Long term debt (Rs..000’) 56,224 7,374 (87) 56,224 7,374 (87)
Retained profits (Rs..000’) 4,443,653 4,828,272 9 4,394,551 4,478,698 9
Shareholder’s equity (Rs..Mn)
6.6 6.9 4 6.5 6.8 4
Market value (Rs..000’) 5,411,142 5,289,126 (2) 5,411,142 5,289,126 (2)
Share price 102 99.7 (2) 102 99.7 (2)

38 LANKA TILES PLC
CHANGES TO FINANCIAL CAPITAL STRUCTURE IN 2017-18
Revenue Shareholder equity
Debt toequity
FINANCE CAPITALSTRUCTURE
DISTRIBUTION OF PROFITS
First interim dividend of Rs. 4.00 per ordinary share and second interim dividend payment of Rs. 6.00 per ordinary share for the financial year 2017/18 was declared by the Board and a total dividend payout of Rs. 10.00 was made for the year.
SOLVENCY STATUS (IN ACCORDANCE WITH SECTION 56 OF THE COMPANIES ACT NO 07 OF 2007)
As per the requirements of Act, the auditors have certified that the Company has the ability to pay its debts as they fall due in the normal course of business, and that the value of the Company’s assets is greater than the value of its liabilities and stated capital.
Solvency status as at year-end.
Group 2017-18 Rs. ‘000
Company 2017-18Rs. ‘000
Non-current assets 5,023,907 4,806,349
Current assets 3,732,385 3,894,697
Total assets 8,756,292 8,701,046
Non-current liabilities 807,990 807,990
Current liabilities 1,023,155 1,022,724
Total liabilities 1,831,145 1,830,714
Assets less liabilities 6,925,147 6,870,332
Stated capital 900,968 900,968
Net position 6,024,179 5,969,364
CREATING VALUE FOR OUR STAKEHOLDERS
Revenue for the year
(Rs. Bn)
2014
2015
2016
2017
2018
0
1
2
3
4
5
6
7
8
Debt to Equity %
2014
2015
2016
2017
2018
Equity Debt
0
20
40
60
80
100
Shareholder Equity
(Rs. Bn)
2014
2015
2016
2017
2018
0
1,000,000
2,000,000
3,000,000
4,000,000
5,000,000
6,000,000
7,000,000
8,000,000

INTEGRATED ANNUAL REPORT 2017/18 39
CASH FLOW MANAGEMENT
The Group maintained prudent cash flow management by carefully monitoring cash allocations for business activities, while also accommodating expansion related investments. The Group maintained a positive net operating cash position as at end March 2018 at Rs.. 416,183. The Group current ratio improved from 3.65 times in the previous year to 3.22 times in the current year.
The Company continued to record a healthy cash flow for this year, with a net cash flow from operating activities amounting to Rs.. 704,739 Mn, against Rs.. 768,858 Mn in the previous year. In line with increased business volumes, cash was tied up with increased working capital, especially in debtors and inventory. The Company closed the year with a positive cash flow of Rs.. 338,796 against Rs. 849,982 in the previous year.
ASSETS
Company assets grew to Rs. 8.7 Bn by end March 2018.
REVENUE
The Group recorded a revenue growth of 18% from Rs.. 5,176,372 in 2016-17 to Rs.. 6,126,307 with revenues from both Lanka Tiles, and the Swisstek Group increasing.
The Company recorded a revenue growth of 18% year-on-year, for 2017-18, from Rs.. 5.1 Bn to Rs.. 6.1 Bn. This revenue growth was supported by a 34.2% increase in export tile sales. Export revenues increased from Rs.. 185.4 Mn, to Rs.. 271.8 Mn during the year, benefiting from favourable exchange rates and sustained export volumes to countries such as Australia.
EARNINGS BEFORE INTEREST AND TAX
The gross profit of the Group reached Rs.. 2,379,127 Bn with a growth of 3% compared to the previous financial year.
At Company level, Lanka Tiles was able to achieve a gross profit increase of 3% for the year, from Rs.. 2.31 Bn, to Rs.. 2.39 Bn, despite cost of sales rising by 31% and the average cost of production increasing from Rs.. 876 to Rs.. 896.
Lanka Tiles’ EBIT fell to Rs.. 1.1 Bn, from Rs.. 1.3 Bn last year, mainly due to the competitive pricing strategy maintained by Lanka Tiles in response to the extreme price competition in
the tile market from low cost imports. The Lanka Tiles strategy was to price products at extremely competitive rates and to offer special discounts and promotional rates to eliminate the competition and capture market share by simultaneously expanding distribution coverage. Based on sales volume growth, which has been achieved in spite of extreme competition, we believe this approach has worked.
NET PROFIT
Lanka Tiles recorded a net profit drop from Rs.. 1,007 Mn in 2016/17, to Rs.. 840 Mn this year with total tax payments reducing to Rs.. 349 Mn, compared to Rs.. 359 Mn in the previous year.
PERFORMANCE BENCHMARKS
ROCE
The Group and Company ROCE declined from 17% to 14% due to increment in administration expenses and selling and distribution expenses compared to previous year.
Export Revenue Country wise
%
AustraliaIndiaMaldives
51
6
30
31
9
New Zealand JapanPakistan
Recognising Tilers in Tiler club

40 LANKA TILES PLC
CREATING VALUE FOR OUR STAKEHOLDERS
ROE
The ROE of the Group decreased from 18.7% to 14.6% while the Company’s ROE increased to 36% from a ratio of 33% in the previous year due to drop in operation profit compared previous year.
ROA
The Group ROA moved from 15% to 12%, while the Company reported an ROA decrease of 10% from 12% in the previous year due to drop in operation profit.
Earning Per Share (EPS) and Dividends Per Share (DPS)
The EPS for the Group fell by 18% to Rs.. 18.93 per share from Rs.. 23.47in the previous year, while the DPS increased by 33% to Rs.. 10 per share.
The EPS for the Company fell by 16% to Rs.. 18.93 per share from Rs.. 22.48 in the previous year, while the DPS increased by 33% to Rs.. 10 per share.
However, Lanka Tiles increased the dividend payout ratio to 53% in the current year from 33% in the preceding year, to ensure our shareholders are compensated.

INTEGRATED ANNUAL REPORT 2017/18 41
HUMAN CAPITAL The human capital chapter pertains to the employees of Lanka Tiles PLC, excluding employees of Swisstek PLC, and includes the three types of employees under permanent contracts, fixed term and casual contracts. This total workforce of the Company was 511 as at end March 2018.
A highlight of the year, demonstrating the quality of Lanka Tiles’ human capital management, was the Company winning the Gold Award for Social Dialogue in the Manufacturing Sector, by the Ministry of Labour, at the National Labour Awards 2017.
Lanka Tiles human capital base by employment grade and gender as at March 31, 2018
Employment grade
Male Female
Senior Management and above
29 02
Executive Staff
20 05
Non Executive Staff
439 16
Total 488 23
The Company has a predominantly male workforce with men representing 95% of employees due to large number of male employees engaged in factory employments due to the nature of production activities of the company. A majority of employees are from urban areas with rural workforce representing only 10% of total employees.
EMPLOYEES BY UNIONISATION
There was no change to the unionised employee profile of the Company during the year.
Employment grade 2017-18 2016-17
Employees in trade union 95% 95%Non unionised employees 5% 5%Total 100% 100%
EMPLOYEE ATTRITION
Lanka Tiles experienced a comparatively low level of employee turnover at 2.7% in 2017-18 compared to 2.5% in 2016-17.
LANKA TILES LABOUR COSTS 2016-17 VS 2017-18
During the current financial year LTPLC spent Rs. 635 Mn on employee wages and over Rs. 30Mn on employee benefits. This expenditure represents 15.28% of total costs of the Company for the year.
Employment grade 2017-18 2016-17
Total expenditure on employee wages Rs. 579 Mn 635 MnWages as % of total costs 15.19 14.48Total expenditure on employee benefits Rs. 30 Mn 35 MnTotal expenditure on employees as a% of total cost 15.98 15.28Ratio of basic salary and remuneration of women to men (All employee categories)”
1:1 1:1
STATUS OF REGULATORY COMPLIANCE
Lanka Tiles PLC was fully compliant with all applicable national labour regulations during the year and did not face any fines or penalties for late compliance or non compliance of labour regulations. All statutory payments including EPF, ETF and gratuity payments have been made on time.
Statutory payments 2017-18 2016-17
Total EPF payment by employee Rs. 21 Mn 19 MnTotal EPF payment by company Rs. 32 Mn 29 MnGratuity payments Rs. 12 Mn 7 Mn
Total 65 Mn 55 Mn
CHANGES TO HUMAN CAPITAL IN 2017-18
LTPLC continued to add value to its human capital base throughout the year by recruiting specialised new skills and talent, and by increasing its investment in employee skill development for production enhancement and attitude changes, through a structured and extensive year-round training calendar. The company considers training and development of employees to be a crucial element of competitive strategy in the face of rising competition and production cost increases. Therefore, the focal area of human capital development during the year was on developing the skills required to gain a competitive advantage for the company in the market, through production related skill development and by exposing employees to working conditions in other countries, to generate attitudinal changes and strengthen the work ethic.

42 LANKA TILES PLC
There were no significant changes to human capital management policies and human capital base during the year with the exception of new recruitments and salary revisions in line with market trends. All other routine best practices in relation to human resource management were observed, including performance reviews, promotions and grievance management.
A 3-year collective agreement with the trade union is currently in operation to ensure smooth labour relations. All occupational health and safety standards have been stringently observed at all times at factory premises, conforming to national regulations and international best practices.
There is a structured Remuneration Policy in place to ensure fair and competitive compensation to all. The Company revises its remuneration rates regularly in response to market conditions such as inflation and labour market trends. LTPLC pays its workforce employed at the factory a wage that is well above the minimum wage rate stipulated by the Ceramics
Wage Board of the Department of Labour of Sri Lanka.
The Board Remuneration Committee evaluated the existing salary structures of the Company, including senior management and other employee grades, online with market rates and company strategic objectives to attract and retain high skilled cadre. Following this review, salary increments were
recommended to the Board. These recommendations were approved by the Board and enacted during the year and employees received an average salary increment of 11% against the previous year. Consequently, coupled with new recruitments, the Company experienced an increase of 10%in the wage bill from Rs. 635 Mn in the previous year, to Rs. 579 Mn in the current year. Wages accounted for 14.48% of total costs in 2017-18. We have continued to ensure that men and women are paid equal remuneration for equal work and the company does not maintain a gender pay gap.
In addition, the Company spent Rs. 32 Mn on employee benefits, above and beyond their wages.
New recruitments in 2017-18
During the current financial year, a total of 60 new recruitments were made to enhance the Company’s skill base. All recruitments are conducted according to a Board approved, formal recruitment process which is based on merit as an equal opportunity employer.
CREATING VALUE FOR OUR STAKEHOLDERS
Promoting healthy lifestyle
Training for franchise dealers

INTEGRATED ANNUAL REPORT 2017/18 43
The selection of potential candidates is based on vacancies and Companywide skill mapping, which identifies new talent required to drive strategic progress of the Company to achieve its strategic objectives. New recruitments during the current financial year were primarily in the production and sales departments in alignment with the proposed increases in production and sales in the coming year.
New recruitment by employment contract and gender
Employment contract
Male Female
Executive - -Staff 1 1Workforce 55 3Total 56 4
Performance Reviews
All employees (100%) faced bi-annual performance reviews during the year, which are based on a pre-designed format and the process is explained clearly to both the employee and supervisor/manager. The management also encourages the employees to discuss any concerns and aspirations to identify training
and Company. There was no labour unrest or industrial actions during the current financial year.
Occupational Health and Safety
LTPLC strives to maintain a ‘Zero Accident’ policy in all its business operations and practices the internationally accepted OHSAS 18001 safety standard in all its factory operations. A Safety Committee is in operation to monitor, review and advise on occupational health and safety initiatives of factory operations. This Committee is comprised of members from the management and the workforce. All our employees are represented in this Joint Management-Worker Safety Committee.
Appropriate fire-fighting and other safety equipment is installed as per the guidelines set out by the Department of Labour and OHSAS 18001 standard.
It is compulsory that all our employees wear safety gear such as goggles, helmets, gloves and industrial standard boots when undertaking work that requires it.
Signage and other safety information is also prominently displayed in critical areas of our factory to ensure employees adhere to the rules and follow correct procedures.
requirements, and to groom for promotions.
In the case of employees represented by collective bargaining agreements, performance reviews are conducted according to the terms set out in said agreements.
Freedom of Association and Collective Bargaining
A majority of the Company operative employees (95%) are members of the Inter Company Workers Union. LTPLC does not enforce any restriction on the freedom of association and collective bargaining of employees. Collective Agreements are signed every 3-years between the union
“LTPLC CONTINUED TO ADD VALUE TO ITS HUMAN CAPITAL BY RECRUITING SPECIALISED NEW SKILLS, TALENT AND INCREASING INVESTMENT IN SKILL DEVELOPMENT.”
Safety training programme

44 LANKA TILES PLC
SUCCESSION PLANNING AND CAREER DEVELOPMENT
We encourage long term career aspirations in line with Company growth objectives and we have adopted a “develop from within” philosophy. Accordingly, LTPLC offers first access to new opportunities to existing employees, as and when they arise. The Company also provides career guidance and continuous professional development programmes.
LTPLC has a standard succession plan in place, where key senior level employees are identified for future senior management roles and developed accordingly.
During the current year also promotions were effected following performance reviews.
EMPLOYEE GRIEVANCE MECHANISMS
A grievance policy and procedure is in place, supported by an Employee Grievance Committee, aligned to the requirements of OHSAS 18001. All grievances are treated as ‘strictly confidential’ and the resolution process commences immediately and is completed from within a week, to a month, depending on the seriousness of the issue raised.
There is a safety manual available for reference by employees at the factory premises. Regular safety awareness programmes are conducted.
The employees based in our factory receive regular training on use of safety equipment in case of a fire or during any other emergency/disaster situation
Health and safety is covered under the existing collective agreement
Industrial Accidents 2017-18 vs 2016-17
Type of Accident 2017-18 2016-17
Major Accidents (nos) None NoneMinor Accidents (nos) 4 17 Lost days due to accidents (nos) None None
TRAINING AND DEVELOPMENT
Employees’ training needs are identified through the Performance Management System as well as through a skill mapping process where specialist skills are identified in line with Company growth objectives.
During 2017-18, LTPLC invested Rs.20 Mn on the training and development programmes conducted for employees.
Employee training and development 2017-18 vs 2016-17
2017-18 2016-17
Number of employees trained 161 246% of total employees that received training 32.3% 49.6%Training hours per employees 3 hrs 4 hrsTotal investment in training and development Rs. 20 Mn 18 MnCost per employee on training and development Rs. 33,000 35,000
CREATING VALUE FOR OUR STAKEHOLDERS
Training improving attitude

INTEGRATED ANNUAL REPORT 2017/18 45
EMPLOYEE WELFARE, WORK-LIFE BALANCE, AND WELLBEING
As a key stakeholder of the Company, employee concerns are taken seriously and the Company conducts regular needs assessments to understand the areas of concerns of employees. The improvements to employee satisfaction levels, as demonstrated in the ‘Great Place to Work’ survey, indicates that our employees appreciate our efforts.
LTPLC has implemented some unique concepts to improve productivity of employees by allowing them a break from their routine work. These include;
Setting up a dedicated ‘relaxation area’ in the factory. These areas are equipped with games and comfortable seating arrangements to allow employees to take a break from their work routines.
A special Spiritual Management programme is conducted for managers by an external specialist.
Submit grievance to immediate boss (Supervisor)
If Not ResolvedStep 1
Step 2
Step 3
Step 4
Step 5
Step 6
Step 7
If Not Resolved
If Not Resolved
If Not Resolved
If Not Resolved
If Not Resolved
Submit grievance to the Line Manager
Submit grievance to the Department Head
Submit grievance to the HRM
Submit grievance to the GM
Submit grievance to the MD
Submit grievance to the EFC/Labour Department
Celebrating New Year at factory
Awarding employees for long service

46 LANKA TILES PLC
EMPLOYEE ENGAGEMENTS IN 2017-18
The Company conducted many employee events during the year to engage with employees and to allow employees to engage with each other in team spirit.
“THE COMPANY WON THE GOLD AWARD FOR SOCIAL DIALOGUE IN THE MANUFACTURING SECTOR, BY THE MINISTRY OF LABOUR, AT THE NATIONAL LABOUR AWARDS 2017.”
CREATING VALUE FOR OUR STAKEHOLDERS
Pirith ceremony organised by Employees
Tea with the CA Champion Programme

INTEGRATED ANNUAL REPORT 2017/18 47
MANUFACTURED CAPITAL This chapter explains the status of manufactured assets of the Company. The Company’s manufactured capital base comprises the Ranala factory facility, company owned warehouses and showrooms, company owned vehicles, inventory and furniture and equipment.
CHANGES TO MANUFACTURED ASSETS
2017-18 Rs. Mn
2016-17 Rs. Mn
% change
Factory building 811 773 5.0Plant and machinery 3,195 3,142 1.6Warehouses 178 178 0Fleet of vehicles 90 98 (8)Furniture and equipment 283 258 9.6Inventory 1,195 1,028 16Total 5,752 5,477 5.0
LANKA TILES ENVIRONMENTAL RESPONSIBILITY MODEL
The foundation of our environmental responsibility model is strict compliance with all applicable environmental laws. On top of this, we have established an additional layer of international best practices on environmentally friendly manufacturing, by adhering to international environmental standards, which are audited and tested for accurate implementation by independent external auditors. This environmental accountability base is further enhanced by adopting responsible business practices within the organisation to conserve natural resources. At a fourth level, in addition to internal efforts, we also attempt to promote an environmental consciousness among our external stakeholders.
The value of factory buildings increased by 5% to Rs. 811 Mn from Rs. 773 Mn in the previous year, while the value of plant and machinery grew by a marginal 1.6% to Rs. 3.19 Bn as a result of upgrading the effluent treatment plant located in the factory premises. Regular maintenance and upkeep schedules are duly followed at the correct time and within stipulated technical specifications to maintain plant and machinery in optimum condition.
The net worth of Company owned warehouses and showrooms did not change and remained at Rs. 178 Mn. However, during the year we continued to upgrade and maintain our buildings and showrooms to maintain their market value.
The value of the Company’s fleet of vehicles declined by 8% from Rs. 98 Mn to Rs. 90 Mn.
Total inventory value of the Company increased with higher capacity utilisation, which increased domestic outputs and the addition of imported tiles from India. The valuation of stock holdings increased by 16% year-on-year to Rs. 1.19 Bn from Rs. 1.02 Bn in the previous year.
ENVIRONMENTAL RESPONSIBILITY
Lanka Tiles does not own any specific form of natural capital with the exception of land occupying its factory premises and office premises. Therefore, the natural capital component of the Company’s reporting refers to how the Company attempts to be environmentally responsible. Over the years we have implemented may improvements to our manufacturing processes and business model to reduce negative environmental impacts.
New investment in expansion

48 LANKA TILES PLC
INTELLECTUAL CAPITALThis chapter explains how the Company has added value to the intellectual capital base during the current financial year. A valuation of the company’s intellectual capital will be done in the forthcoming year to estimate its value.
LANKATILES TRADE MARK
The LANKTILES trademark is registered with the National Intellectual Property Office and is also registered in export destinations of India, Australia, Japan, Singapore, USA, Brisbane,
The LANKATILES brand is positioned as a global brand with advertising and promotions during the year aimed at enhancing brand image and brand equity as a trusted brand delivering consistently high international quality products reflecting the latest design trends both in the local market and foreign markets.
The ‘LANKATILES’ brand in firmly established and recognised internally as a trusted and reliable brand that delivers optimum value for money for all categories of customers.
During the year, about 44 new designs and 6 new sizes were introduced to capture consumer and commercial market segments and position LANKATILES as a modern and youthful brand personifying contemporary lifestyle aspirations, which resulted in a market share of 20%.
The LANKATILES brand is positioned as a brand trusted for delivering consistently high quality international products reflecting the latest design trends in both local and foreign markets.
CREATING VALUE FOR OUR STAKEHOLDERS
LT PLC Intangible assets
Tiler Club, Tiles App, Virtual
Space
Manufacturing knowledge impact and
explicit
R&D and NPD
Inhouse developed
customized software system
LANKA TILES trademark
registered in Sri Lanka and in 10 export destinations
Dealership and distributorship
Pakistan, Maldives, Netherlands, Canada to ensure protection for the brand and brand reputation. During the current financial year, we invested Rs1 Mn on intellectual property registrations and renewals.
LANKA TILES INTELLECTUAL CAPITAL BASE

INTEGRATED ANNUAL REPORT 2017/18 49
PRODUCTION QUALITY MANAGEMENT SYSTEM
The Lanka Tiles production system is built on a quality platform comprising multiple national and international quality systems specialising in work flows, health and safety, environmental safety and management techniques.
Our production quality system at the Ranala factory includes the domestic SLS standard and international ISO standards of ISO 9001 certification and ISO 14001 standard of environmental standards of production. In addition the factory is compliant with OHSAS 18001 on occupational health and safety. This multi layered quality system is the foundation of our production process, ensuring consistent quality standards, on par with international tile brands, making the LANKATILES brand international quality in all aspects of production.
In 2017 Lanka Tiles obtained the GREEN Label certification with an investment of Rs. 5 Mn, which includes training of employees and modifications of systems to comply with the stipulations of the standard.
The new showrooms have been situated in strategic localities to ensure a competitive advantage to LANKATILES in the highly competitive local tile market.
During the year the company invested Rs. 5 Mn on complying and retaining the quality certifications.
NEW PRODUCT DEVELOPMENT (NPD)
In an environment of rapidly changing global interior design trends, continuous innovation and creativity is the foundation for success. Therefore, we continued to invest in aligning our production systems to respond to changing consumer trends, extending from raw materials, patterns, colours and finishes, to sizes and shapes, of our tile outputs.
Our current Indian partnership has supported this global focus by enabling us to provide designs to the local market that we cannot at present manufacture at our factory in Ranala.
During the current financial year, we made headway in responding to the growing demand for larger sizes of tiles which are gaining in popularity among domestic and commercial sectors due to more economical applications.
In addition, we also introduced 44 new designs to the local market during the year, giving a facelift to our design portfolio and ensuring our products remain fashionable and trendy.
Currently we have over 1,000 SKU’s of various sizes, designs, shades, body types in our product portfolio. This growth in our product portfolio has contributed to an improved sales mix and allowed us to attracted a wider customer range with more diverse preferences.
During the year we invested in excess of Rs. 15 Mn on research and development activities which includes new product developments also.
MARKET CHANNELS
Lanka Tiles has deployed a market channel development strategy through franchise agreements to rapidly penetrate the market with LANKATILES branded products. Our exclusive agreements are a part of our intellectual asset base due to their high potential for generating future revenues for the Company.
During the year, the company entered into 5 new franchise agreements and also exclusive agreements with distributors, dealers and showrooms which has consolidated the Company’s market footprint. The new showrooms in particular have been situated in strategic localities to ensure a competitive advantage to LANKATILES in the highly competitive tile market in Sri Lanka.
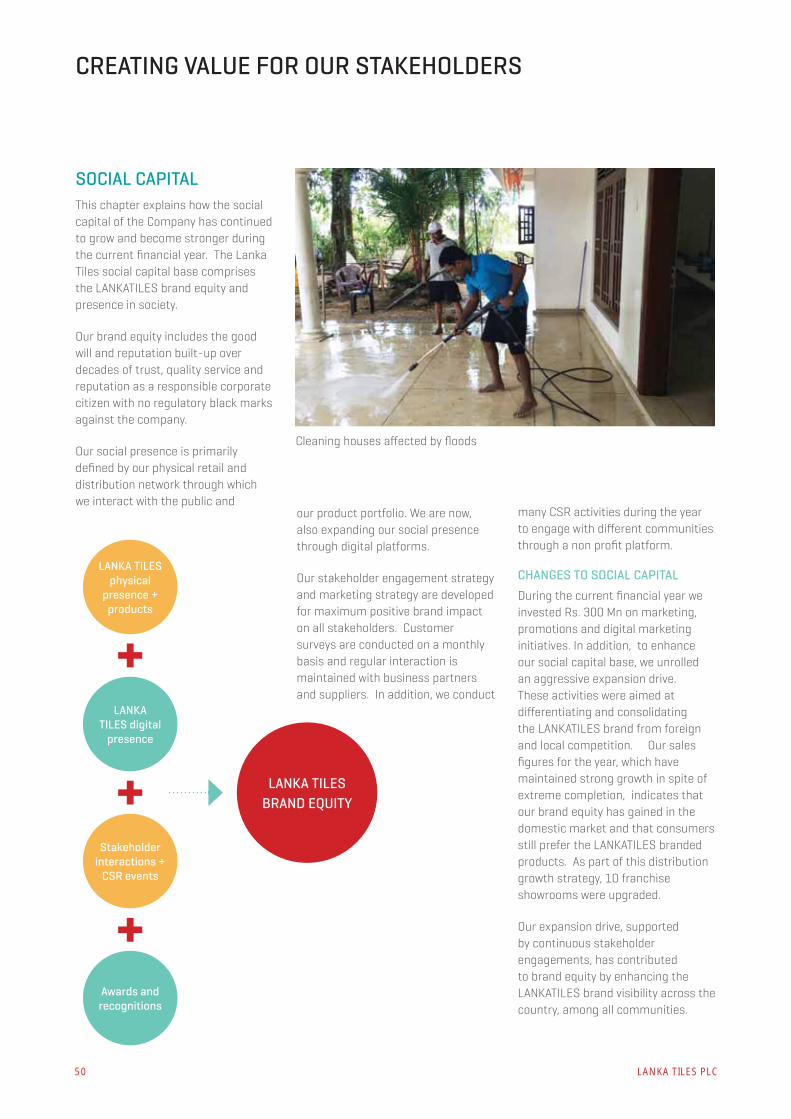
50 LANKA TILES PLC
SOCIAL CAPITAL This chapter explains how the social capital of the Company has continued to grow and become stronger during the current financial year. The Lanka Tiles social capital base comprises the LANKATILES brand equity and presence in society.
Our brand equity includes the good will and reputation built-up over decades of trust, quality service and reputation as a responsible corporate citizen with no regulatory black marks against the company.
Our social presence is primarily defined by our physical retail and distribution network through which we interact with the public and
our product portfolio. We are now, also expanding our social presence through digital platforms.
Our stakeholder engagement strategy and marketing strategy are developed for maximum positive brand impact on all stakeholders. Customer surveys are conducted on a monthly basis and regular interaction is maintained with business partners and suppliers. In addition, we conduct
many CSR activities during the year to engage with different communities through a non profit platform.
CHANGES TO SOCIAL CAPITAL
During the current financial year we invested Rs. 300 Mn on marketing, promotions and digital marketing initiatives. In addition, to enhance our social capital base, we unrolled an aggressive expansion drive. These activities were aimed at differentiating and consolidating the LANKATILES brand from foreign and local competition. Our sales figures for the year, which have maintained strong growth in spite of extreme completion, indicates that our brand equity has gained in the domestic market and that consumers still prefer the LANKATILES branded products. As part of this distribution growth strategy, 10 franchise showrooms were upgraded.
Our expansion drive, supported by continuous stakeholder engagements, has contributed to brand equity by enhancing the LANKATILES brand visibility across the country, among all communities.
CREATING VALUE FOR OUR STAKEHOLDERS
LANKA TILES physical
presence + products
LANKA TILES digital
presence
Awards and recognitions
Stakeholder interactions +
CSR events
LANKA TILES BRAND EQUITY
Cleaning houses affected by floods

INTEGRATED ANNUAL REPORT 2017/18 51
2017-18 2016-17 % change
Own showrooms 2 2 -Franchise showrooms 45 40 12Direct Dealers 36 30 20Distributors 31 27 16Suppliers 160 120 33
During the year, we also conducted many marketing and branding activities to increase brand visibility and brand recall.
Lanka Tiles continued to focus on strengthening social capital through the use of modern digital platforms including mobile, web and social media presence.
EXPANDING OUR PHYSICAL PRESENCE
During the current financial year, the Lanka Tiles market presence increased significantly with dramatic expansion of the distribution and retail network by promoting
a franchise model for retailing our products and by contracting independent third parties for warehousing and distributor services.
This strategy has:
1. Allowed more customers in all parts of the country to access trusted and reliable LANKATILES branded products, as opposed to unknown imports.
2. Strengthened the LANKATILES market hold by locking-in distribution networks through exclusive contracts with distributors, ensuring our products have higher market visibility and physical presence.
EXPANDING OUR DIGITAL PRESENCE
Lanka Tiles continued to focus on strengthening social capital through the use of modern digital platforms including mobile, web and social media presence.
Upgrade to website
The Company website http://www.lankatiles.com/ was upgraded and improved for a better user experience.
Pirity ceremony at factory enhancing spirituality

52 LANKA TILES PLC
Mobile APP for LANKATILES
A dedicated mobile app was developed and successfully introduced to the market for the public to enhance customer engagements.
Facebook promotion
A Facebook promotion was launched with great success to promote LANKATILES products.
CREATING VALUE FOR OUR STAKEHOLDERS
MARKETING AND BRAND DEVELOPMENT ACTIVITIES The Tilers’ Club
A unique initiative of the Lanka Walltiles Group, the Tilers’ Club, is a channel to reach out and add value to our customers across the breadth of the country, by engaging industry practitioners. As at end of the current financial year, the Tilers’ Club had a membership of around 4,000 active participants from the tile mason community, who were exposed to training programmes during the year about the quality standards and specific applications of Lanka Tiles products. This facilitates on-the-job professional advisory services to consumers regarding the use and application of our products towards enhance their living and working premises. During 2017 the Group distributed about Rs. 20 Mn in awards to Tilers’ Club members in recognition of their contributions for introducing and promoting our products, which has further strengthened our industry networks and market reach.
Insert picture and captions for other major marketing and branding events during the year
CSR EVENTS
Lanka Tiles contributes to many charitable events in cash or kind. Some of the events are described below.
Pre school development project to enhance quality of education of deserving pre schools . This project was done with the Vallibel One group.
Donation in cash and tiles to various schools, temples, churches, libraries for their constructions.
Donations and sponsorships to various organisations to complete the events successfully.

INTEGRATED ANNUAL REPORT 2017/18 53
NATURAL CAPITALENVIRONMENTAL REGULATORY COMPLIANCE
We are fully compliant with all applicable Central Environmental Authority (CEA) and other regulations. We did not face any fines or penalties for non-compliance.
During 2017-18 the Company invested Rs. 6 Mn on environmental compliance activities such as sound proofing, monitoring environmental impacts and reducing dust emissions.
Compliance with CEA standards
Containing air pollution
The Company’s ongoing projects to contain air emissions more efficiently, continued to make progress during the current financial year. This has ensured that the ambient air quality around the Ranala factory has a total suspended particulate matter less than the regulatory permissible level of 450 Micrograms for m3.
Tile manufacturing produces emissions in the form of Greenhouse Gas (GHG), tile dust, sound and other types of air emissions. We have ensured that all emissions are below the parameters as set by the CEA. We regularly monitor air emissions for sulphur oxides (SOx) and nitrogen oxides (NOx) which are maintained well below regulatory levels.
To reduce GHG emissions and other forms of air pollution, the Company has ensured that the kiln chimneys are at a height that will allow for the evaporation of any released vapours without harm to the environment, and has implemented a programme of fuel efficiency during the manufacturing process. All vapours and air emissions are non-toxic and are regularly monitored to measure any changes in the levels of toxicity.
• The Company has no formal mechanisms in place to monitor Co and CO2 emissions. However, we continued to introduce improvements to reduce CO and CO2 emissions by using cleaner production methods and state-of -the-art machines that have been developed with eco-efficiency features resulting in reduced emissions.
To address concerns relating to GHG emissions and other forms of air pollution, the Company has continued to make progress in on going programmes in this regard. Among other improvements, the Company ensures that kiln chimneys are at a height that will allow for the evaporation of any released vapours without harm to the environment, and has implemented a programme of fuel efficiency during the manufacturing process. The Company has on-going initiatives to reduce consumption of electricity in office premises and showrooms. These include, use of energy saving bulbs, practice of switching off lights and electronic devices like personal computers and laptops when not in use. The Company also has in place an energy audit process for our factory premises as below:
In ongoing efforts to address sound emissions from the manufacturing process and to ensure compliance with the regulations set by the CEA, we have outsourced the crushing process which generated the most amount of sound in the factory, thus enabling the Company to reduce noise by 20%. The partner to whom we have outsourced this process conducts this process in a manner that does not disturb the surrounding areas and as
per regulations. Further, strict control measures and continuous monitoring is undertaken to ensure that sound emissions are maintained at optimal levels, thus ensuring that the ambient air quality around the Ranala factory has a total suspended particulate matter less than the permissible level of 450 Micrograms for m3. To counteract any negative impact from dust emissions arising from the firing process during the manufacture of tiles, the Company has installed dust collectors or containment points to minimise the dust released into the air. This is then collected and reused in the production process. BOD and COD levels have been maintained well within regulatory stipulations to ensure a safe work environment and neighbourhood within the factory locality.
Dust emissions :
To minimise dust emissions arising from the firing process during the manufacture of tiles, the Company has installed dust collectors or containment points. This dust is collected and reused in the production process. Dust emission of the Company are below the parameters as set by the CEA.
Containing sound pollution
During the current financial year we continued to monitor and improve internal systems to measure and control sound pollution.
The crushing process has been outsourced to reduce sound pollution within the factory radius. The partner to whom we have outsourced this process conducts this process in a manner that does not disturb the surrounding areas and as per regulations.

54 LANKA TILES PLC
The Company has also bought land surrounding the factory to prevent sound disturbance to neighbours.
Effluents and Waste Management
The treatment plant was upgraded during the year to improve efficiency and has ensured compliance within CEA parameters. The treatment plant within the factory premises complies with the stipulations of the Environmental Protection License issued by the Environmental Protection Authority of Sri Lanka, to treat the non-toxic waste water generated during the manufacturing process. LTPLC does not discharge any waste water into water bodies or in biodiversity rich habitats.
Effluents and waste generated from the manufacturing process is monitored, tested and treated before its release to the environment.
This recycled water is then use in the factory for cleaning and other ancillary purposes.
The Company has no other hazardous waste or effluents that arise from our manufacturing operations.
INTERNATIONAL ENVIRONMENTAL STANDARDS CERTIFICATION
During the current financial year the company invested significantly towards complying with international environmental standards.
IMPLEMENTING ENVIRONMENTALLY RESPONSIBLE BUSINESS PRACTICES
Practicing 3R concept:
The Company advocates reduce, re-use and recycle principles within its business premises. The Company’s uses 5% of recycled raw materials such as clay, feldspar and green tiles in the production process. Further, any tiles that are rejected during the production process are also recycled.
R&D
LTPLC continues to research on new forms and types of materials that can be used as substitutes in the production of tiles that will have a lower impact on the environment. The Company’s efforts have thus far enabled us to use recycled and environmentally friendly raw materials such as clay, feldspar and green tiles in the production process.
CREATING VALUE FOR OUR STAKEHOLDERS

INTEGRATED ANNUAL REPORT 2017/18 55
Use of non toxic material
All inks used by the Company can be recycled and are not harmful to the environment or humans.
Energy conservation programme
Energy efficiency is a key production efficiency criteria and energy consumption is monitored monthly, with energy saving processes regularly reviewed and upgraded to contain energy wastage. The Company has implemented an ongoing energy project to reduce energy consumption, which has generated extremely encouraging savings to the value of Rs. 33 Mn in the current financial year.
In addition there are on-going initiatives to reduce consumption of electricity in office premises and showrooms. These include, use of energy saving bulbs, practice of switching off lights and electronic devices like personal computers and laptops when not in use. The Company also has in place an energy audit process for our factory premises.
Water conservation
We encourage employees to minimise the consumption of water and accordingly have signage in the restrooms and the cafeteria section. During the current year 80% of water used was recycled and reused.
ENCOURAGING PUBLIC ENVIRONMENTAL CONSERVATION
LTPLC continued to be involved in is advocating environmental-friendly clay mining practices among raw material suppliers in Sri Lanka. The Company works with other industry players and the government to develop a guideline to be followed by clay miners so that they can become more adept at meeting environmentally friendly practices.
LTPLC endeavours to procure raw materials from suppliers who follow environmentally friendly practices and operations. However, our efforts are sometimes hindered due to limited laws and regulations in these areas in the country. The Company, however, expects our global suppliers to fully comply with international standards for environmental safety regulations.
Responsible mining of Natural Resources
As a responsible corporate citizen, the company advocates responsible mining of natural resources to ensure precious natural resources are conserved for future generations and adheres to a strict policy of responsible mining within its supply chain.
Payment of Royalty to government via GSMB
The Company has continued to make royalty payments to the government through the Geological Survey and Mines Bureau during the year, ensuring fair repayments to the State for the use of natural resources in manufacturing activities.
Receiving social Dialog award

56 LANKA TILES PLC
CORPORATE GOVERNANCE
INTRODUCTION
The Board of Directors of Lanka Tiles PLC is committed to upholding the highest standards of integrity and transparency in its governance of the Company and its subsidiaries. The Board is guided by the Code of Best Practice issued by the Institute of Chartered Accountants of Sri Lanka in conjunction with the Securities and Exchange Commission of Sri Lanka and the Colombo Stock Exchange. As the highest governing body of the organisation, the Board is responsible for protecting the rights and interests of shareholders and is accountable to them for the overall management of the Company.
The Board of Directors of Lanka Tiles PLC is properly constituted and
comprises seven Directors of which one is Executive Director and six are Non-Executive Directors. Out of the six Non-Executive Directors, three are Independent Non-Executive Directors and there is one Alternate Director. The Board composition has ensured an optimal mix of qualification, industry knowledge and business experience for proper guidance of the Company.
The Board, headed by the Chairman, has the overall responsibility and accountability for the management of the affairs of the Company, which includes maintenance of prudent risk management practices and safeguarding stakeholder rights. In order to carry out these responsibilities, the Board has
appointed a corporate management team to implement Company strategy, led by a Managing Director.
The Board has delegated some of its functions to duly constituted Board sub committees under our parent Lanka Walltiles. These are, the Audit Committee, the Remuneration Committee and the Related Party Transactions Review Committee.
In this report the Company shares its corporate governance framework, compliance to corporate governance codes and the board statement of compliance is given. This is presented to the shareholder to ensure that their rights are protected while the business is being run to create value for them.
CORPORATE GOVERNANCE FRAMEWORK
The Corporate Governance framework to accomplish the corporate governance objective of Lanka Tiles PLC is given below.
Shareholders
THE BOARD
Nominations Committee
Audit Committee
Risk Management
Remuneration Committee
The Chief Executive and Management team
Protect rights
Provides value
Delegates day to day
management
Ensures good risk management
Ensures Remuneration is appropriate
Ensures good Board Composition
Reviews Integrity of financial statements
Electthe Board
Provides Transparent information
Risk Management Framework
External RegulationsFramework
Independent Audit
Framework
ExternalStakeholdersFramework

INTEGRATED ANNUAL REPORT 2017/18 57
COMPLIANCE WITH THE CORPORATE GOVERNANCE CODE ISSUED BY INSTITUTE OF CHARTERED ACCOUNTANTS OF SRI LANKA AND SECURITIES AND EXCHANGE COMMISSION OF SRI LANKA
Status of compliance of Lanka Tiles PLC with the Code of Best Practice on Corporate Governance issued by the Institute of Chartered Accountants of Sri Lanka and the Securities and Exchange Commission of Sri Lanka in 2017 is as follows:
Governance Principle Lanka Tiles Adherence Compliance Status
A. DIRECTORS Compliant
A.1 The Board
Frequency of Board Meetings The Board met on a monthly basis in the year under review. The Board’s sub committees met on four occasions.
Compliant
Board meeting attendance:Dhammika Perera (Chairman) - 6/12A M Weerasinghe (Deputy Chairman) - 12/12J A P M Jayasekera (Managing Director) - 12/12Dr. S.Selliah– (Director) - 12/12T G Thoradeniya – (Director) - 11/12K D G Gunaratne – (Director) - 11/12A M L Page – (Director) – 9/12G A R D Prasanna – (Alternate Director) – 11/12
Role and responsibility of the Board
The Board is responsible for:
a. The formulation and implementation of a sound business strategy.
b. Monitoring compliance of governance, laws and regulations.
c. Overseeing systems of internal control and risk management.
d. Approving annual budgets and strategic plans.
e. Appointing and reviewing the performance of the Managing Director.
f. Approving any change in the Group’s business portfolio and sanctioning major investments and disinvestments in accordance with parameters set.
g. Ensuring that effective remuneration, reward and recognition policies are in place to motivate employees to meet Company objectives.
h. Submitting themselves for re-election at regular intervals and at least once in every three years.
Compliant
Compliance with applicable law The Board ensured in the year under review that the Company adhered to all applicable laws, rules and regulations.
Compliant

58 LANKA TILES PLC
Governance Principle Lanka Tiles Adherence Compliance Status
Company Secretary The services and advice of the Company Secretary M/s. PW Corporate Secretarial (Pvt.) Ltd. is made available to Directors as necessary. The Company Secretary keeps the Board informed of new laws, regulations and requirements coming into effect which are relevant individually as Directors and collectively to the Board.
Compliant
Independent judgment The Board members are required to divulge all functions with the Company, refrain from matters of self interest and to bring independent judgement to the decision making process.
Compliant
Dedication of adequate time and effort
Board members attend all Board meetings in person and need to be prepared to engage in decision making matters which may entail an adequate amount of time and effort spent.
Compliant
Appropriate training for Directors All Directors have considerable experience in managing Companies and the ceramic industry. Relevant training opportunities are made available to all Directors locally and internationally to further their knowledge and expertise.
Compliant
A2 Chairman and CEO
Division of responsibilities between the Chairman and CEO
There is a clear division of responsibility at the head of the Company. This is between the running of the Board (Chairman) and the executive responsibility of overseeing the Company’s business (Managing Director). No single individual has liberal powers with regard to decision making.
Compliant
A.3 Chairman’s Role
Prepare good corporate governance and facilitate effective discharge of Board functions
The Chairman is responsible for the efficient conduct of Board meetings. The Chairman maintains close contact with all Directors and holds informal meetings with Non-Executive Directors whenever necessary.
Compliant
A.4 Financial Acumen
Availability of sufficient financial acumen and knowledge.
The Board includes directors, who possess the necessary knowledge and competence to offer the Board guidance on financial matters. The Managing Director is a Chartered Accountant.
Compliant
CORPORATE GOVERNANCE

INTEGRATED ANNUAL REPORT 2017/18 59
Governance Principle Lanka Tiles Adherence Compliance Status
A.5 Board Balance
The Board should have an adequate number of Directors with a balance of executive and non-executive Directors of sufficient calibre along with independent Directors.
The Board comprises of 08 executive and non-executive Directors.
Directors’ status is as follows:
Dhammika Perera – (Chairman) - Non executive
A M Weerasinghe – (Deputy Chairman) – Non Executive
J A P M Jayasekera (Managing Director) - Executive
Dr. S.Selliah - (Director) –
Non executive – Independent
T G Thoradeniya – (Director) - Non executive
K D G Gunaratne – (Director) - Non executive - Independent
A M L Page – (Director) - Non executive - Independent
G A R D Prasanna – Alternate Director of Mr. Dhammika Perera)
Dr. S Selliah, Mr. K D G Gunaratne and Ms. A M L Page are Directors of Lanka Walltiles PLC. However, after taking into consideration the fact that they are not actively involved in the management of Lanka Walltiles PLC and furthermore, since they do not directly hold a significant percentage of shares in Lanka Tiles PLC, the Board is of the view that their independence is not compromised. Accordingly, the Board has determined that Dr. Selliah, Mr. K D G Gunaratne and Ms. A M L Page are ‘independent’ Directors as per the criteria set out in the Listing Rules of the Colombo Stock Exchange.
Compliant
A.6 Supply of Information
Relevant information and agenda to be circulated in a timely manner to the Board.
The Board papers are circulated a week prior to Board meetings with an adequate briefing on relevant information.
Compliant
A.7 Appointments to the Board
Procedure for the appointment and disclosure of new Directors/ Assessment of Board composition
The appointment to the Board is undertaken by the Board itself, taking into consideration the Board composition required and the strategic input required. All Board appointments are informed to the SEC as per the existing regulations.
Compliant
A.8 Re-election
Re-election of Directors at regular intervals.
As per the Articles of Association one third of the Directors for the time being shall retire from the office and shall offer themselves for re-election each year by Shareholders.
Compliant

60 LANKA TILES PLC
Governance Principle Lanka Tiles Adherence Compliance Status
A.9 Appraisal of Board Performance
Boards should periodically appraise their own performance in order to ensure that responsibilities are discharged in a satisfactory manner
The Board regularly self evaluates its performance based on achievement of corporate objectives implementation of strategy, risk management, internal controls, compliance with laws and stakeholder requirements. In addition the Remuneration Committee also evaluating the performance of the Board and makes necessary recommendations for improvements.
Compliant
A.10 Disclosure of information in respect of Information
Shareholders at all times should be aware of relevant details with respect to Directors.
All Directors have declared their details in pages 24 - 25 as Director profiles.
Compliant
A.11 Appraisal of Chief Executive Officer
The Board should be required to assess the performance of the CEO annually.
The CEO is evaluated each year by the Board as per the yearly targets that has been agreed with the annual budget and corporate requirements.
Compliant
B. DIRECTORS’ REMUNERATION
B.1 Remuneration Procedure
Formal and transparent procedure for developing policies on remuneration.
The Board has implemented a formal and transparent procedure for developing policies on remuneration by setting up a Remuneration Committee. Its purpose is to assist the Board of Directors in matters relating to compensation of the Company’s Directors, Executive Officers and such other employees as determined by the Committee
Compliant
Composition and disclosure of the members of the Remuneration Committee
The Remuneration Report which is on Page 81 of the report addresses all related matters.
Compliant
B.2 The level and make up of Remuneration
Levels of Remuneration Remuneration levels have been designed to attract, retain and motivate Directors and Senior Management required to run the Company successfully, while remaining within the industry’s remuneration standards
Compliant
B.3 Disclosure of Remuneration
Disclosure of Remuneration in the Annual Report
Details of the Remuneration Committee and the statement of remuneration policy are provided in the Annual Report.
The aggregate remuneration paid to Executive and Non executive Directors are disclosed on Page 122 of this Report.
Compliant
CORPORATE GOVERNANCE

INTEGRATED ANNUAL REPORT 2017/18 61
Governance Principle Lanka Tiles Adherence Compliance Status
C. RELATIONS WITH SHAREHOLDERS
C.1 Constructive use of the Annual General Meeting and conduct of General Meetings
Boards should use the Annual General Meeting to communicate with shareholders and encourage their participation.
The active participation of shareholders at the AGM is encouraged. The Board believes the AGM is a means of continuing effective dialogue with Shareholders.
Compliant
C.2 Communication with shareholders
Board should implement effective communication with shareholders
Policies and processes to receive and respond matters are in place and the Company Secretary is the contact person to communicate with shareholders officially.
C.3 Major and Material Transactions
Disclosure of major and material corporate transactions that will materially effect the net asset base of the company and/or its subsidiaries.
There have been no transactions during the year under review, which fall within the definition of ‘Major Transactions’ in terms of the Companies Act. This has been reviewed by the Related Party Transactions Review Committee and the report is in the page 80
Compliant
D. ACCOUNTABILITY AND AUDIT
D.1 Financial and Business Reporting
The Board should present a balanced and understandable assessment of the Company’s financial position, performance and prospects.
The Annual Report of the Company provides a balanced and understandable assessment of the Company which is in addition to the accounts, the management and financial reviews, Director’s report and responsibility structures. All major and minor related party transactions are also reported there.
Compliant
D.2 Risk Management and Internal Control
The Board should maintain a sound system of internal control to safeguard shareholders’ investments and the Company’s assets.
The Board has taken necessary steps to ensure the integrity of the Group’s accounting, financial reporting and internal control systems and also their review and monitoring on a periodic basis. Our systems covering risk management, financial and operational control, ethical conduct, compliance with legal and regulatory requirements and corporate social responsibility are detailed below.
Compliant

62 LANKA TILES PLC
Governance Principle Lanka Tiles Adherence Compliance Status
D.3 Audit Committee
The Board should establish formal and transparent arrangements in the manner in which they select and apply accounting policies, financial reporting, internal control principles and maintaining an appropriate relationship with the Company’s Auditors.
The Audit Committee Report on page 82 - 83 of the report addresses this section in full.
Compliant
D.4 Related Party Transactions Review Committee
The Board should establish a procedure to ensure that the company does not engage in transactions with “related parties” in a manner that would grant such parties “more favourable treatment” than that accorded to third parties in the normal course of business
Related party transactions detailed in LKAS 24 and the company’s adhered to it and the details are given in the Related Party Transactions Review Committee report in Page 80 of this report.
Compliant
D.5 Code of Business Conduct and Ethics
Companies must adopt a Code of Business Conduct and Ethics for Directors and members of the Senior Management team and promptly disclose any waivers of the Code for Directors or others.
The Code of Best Practice issued by the Institute of Chartered Accountants of Sri Lanka and the Securities Exchange Commission is adopted by the Directors who then ensure that the Company and the employees behave ethically.
Compliant
D.6 Corporate Governance Disclosures
Directors should be required to disclose the extent to which the Company adheres to established principles and practices of good Corporate Governance.
Adhered to as per the Corporate Governance report in the Annual Report Page 56 - 66
Compliant
E. SHAREHOLDERS – INSTITUTIONAL INVESTORS
E.1 Shareholder Voting
Institutional shareholders should be encouraged to ensure their voting intentions are translated into practice.
All institutional shareholders are encouraged to participate and their views are communicated to all concerned.
Compliant
E.2 Evaluation of Governance Disclosures
Institutional investors should be encouraged to give due weight to all relevant factors drawn to their attention.
The Report contains the Company’s Corporate Governance process and structure for investor’s attention.
Compliant
CORPORATE GOVERNANCE

INTEGRATED ANNUAL REPORT 2017/18 63
Governance Principle Lanka Tiles Adherence Compliance Status
F. OTHER INVESTORS
F.1 Investing / Divesting Decision
Individual shareholders, should be encouraged to carry out adequate analysis in investing or divesting decisions.
The Annual Report contains sufficient information to make an informed decision. The report is hosted in Colombo Stock Exchange website with the quarterly reports to facilitate investors and shareholders to make informed decisions.
Compliant
F.2 Shareholder participation in meetings
Individual shareholders should be encouraged to participate in the General Meeting of Companies and exercise their voting rights.
All shareholders are encouraged to participate at the Annual General Meeting / Extraordinary General Meeting and cast their votes. AGM’s are noticed in advance as per Companies Act and held on accessible area to ensure shareholders can participate effectively.
Compliant
G. INTERNET OF THINGS AND CYBERSECURITY
G.1 Internet of Things and Cyber security
The Board should have a process to identify how in the organization’s business model, IT devices within and outside the organization can connect to the organization’s network to send and receive information and the consequent cyber security risks that may affect the business.
The company has implemented a cybersecurity policy and have a robust cybersecurity risk management process and has a designated Chief Information Security Officer (CISO) in place to manage this area. Details of this appear in page 71 of this report under the risk management and internal control report.
Compliant
H. ENVIRONMENT, SOCIAL AND GOVERNANCE (ESG)
H.1 ESG Reporting
ESG reporting is a Board’s responsibility and it is designated to add value by providing a credible account of the Company’s economic, social and environmental impact.
The company’s annual report should contain sufficient information to enable investors and other stakeholders to assess how ESG risks and opportunities are recognized, managed, measured and reported.
Refer page 73 in the Annual Report for information pertaining to this and the value creation report from pages 28 to 55.
Compliant

64 LANKA TILES PLC
Governance Principle Lanka Tiles Adherence Compliance Status
H.2 Environmental and Social Factors Governance
Company should establish a governance structure to support its ability to create value and manage risks in the short, medium and long term, recognizing managing and reporting on all pertinent aspects of ESG.
Environmental governance of an organization should adopt an integrated approach that takes into consideration the direct and indirect economic, social, health and environmental implications of the decisions and activities.
Social governance of an organization should include its relationship with the community, customers, employees, suppliers, outsourced providers and any other party that can influence or be influenced by the organization’s business model
Refer page 73 in the Annual Report for information pertaining to this and the value creation report from pages 28 to 55.
Compliant
COMPLIANCE TO CORPORATE GOVERNANCE RULES OF CSE
Lanka Tiles PLC’s extent of adherence to corporate governance rules under section 7.10 of continuous listing requirements of the Colombo Stock Exchange is given below.
NON-EXECUTIVE DIRECTORS
The Board of Directors should include at least two non-executive directors or such number of non-executive Directors equivalent to one third of the total number of directors whichever is higher.
Lanka Tiles PLC has four non- executive Directors out of seven as given in item A5 in the ICASL adherence table, which is above the minimum requirement.
Compliant
INDEPENDENT DIRECTORS
The Board of Directors should include two or 1/3 of non-executive Directors appointed to the Board of Directors, whichever is higher shall be ‘independent’.
The Company has three independent Directors out of seven as given in item A5 in ICASL adherence table, which is above the minimum level.
Compliant
CORPORATE GOVERNANCE

INTEGRATED ANNUAL REPORT 2017/18 65
DISCLOSURE RELATING TO DIRECTORS
The Board shall make a determination annually as to the independence or non-independence of each non-executive Director based on such declaration and other information available to the Board and shall set out in the annual report the names of Directors determined to be ‘independent’.
The Board has determined the independence of each independent director and set out and declared the independence as per item A5 in the previous table.
Compliant
CRITERIA FOR DEFINING ‘INDEPENDENCE’
The Colombo Stock Exchange identified criteria of independence should be met by the independent directors of the Company
All directors meet the above criteria and additional explanations are given in Note A5 in Institute of Chartered Accountants of Sri Lanka and the Securities and Exchange Commission corporate governance adherence report.
Compliant
REMUNERATION COMMITTEE
Composition of Remuneration Committee
The remuneration committee shall comprise of at least two non-executive Directors in which a majority shall be Independent.
As per the remuneration committee report given in page 81 the Remuneration Committee comprises of three independent non-executive Directors of Royal Ceramics Lanka PLC and who are also the members of the Group Remuneration Committee
Compliant
Functions of Remuneration Committee
The Remuneration Committee shall recommend the remuneration payable to the executive directors and Chief Executive Officer of the Listed Entity to the board of the Listed Entity among other defined functions.
The remuneration committee met once for the year and have recommended the remuneration of the CEO and the Senior management of the Company to the board and there report is published in page 81.
Compliant
Disclosure in the Annual Report
The annual report should set out the names of directors in comprising the remuneration committee and contain a statement of the remuneration policy and set out the aggregate remuneration paid to executive and non-executive directors
The remuneration committee report in page 81 as sets out the names of the directors in the remuneration committee report and aggregate remuneration paid to all directors is given in page 127.
Compliant
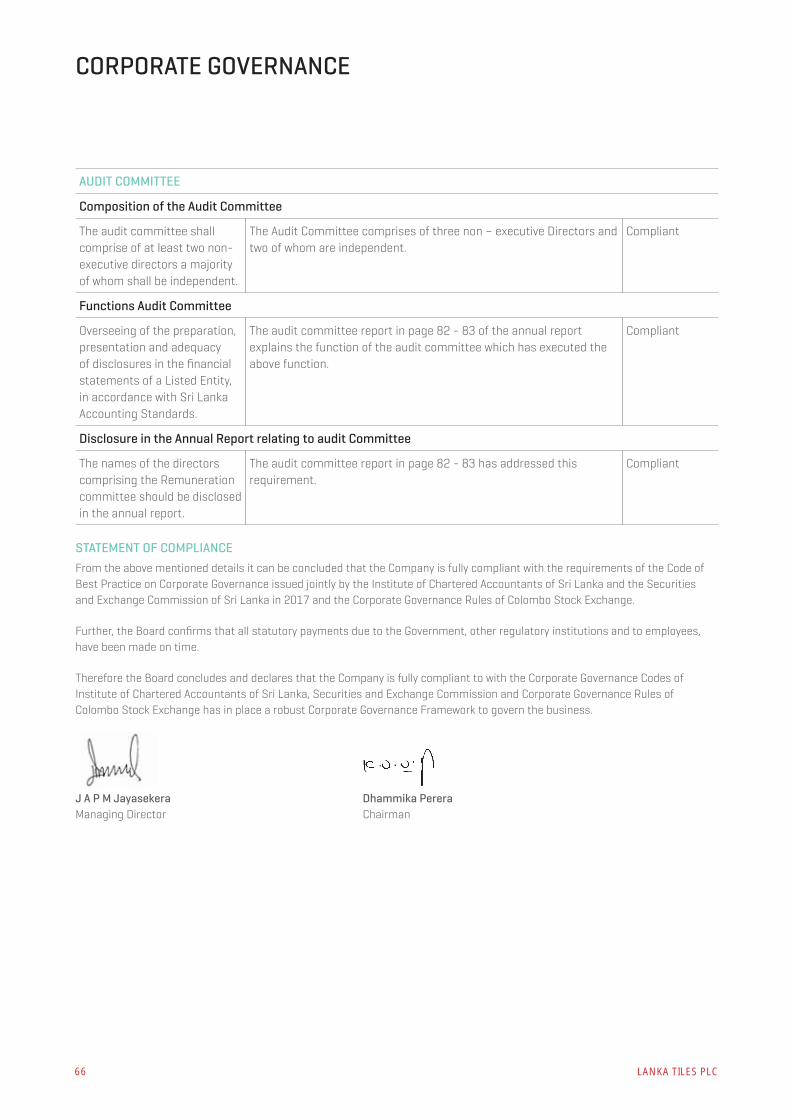
66 LANKA TILES PLC
AUDIT COMMITTEE
Composition of the Audit Committee
The audit committee shall comprise of at least two non-executive directors a majority of whom shall be independent.
The Audit Committee comprises of three non – executive Directors and two of whom are independent.
Compliant
Functions Audit Committee
Overseeing of the preparation, presentation and adequacy of disclosures in the financial statements of a Listed Entity, in accordance with Sri Lanka Accounting Standards.
The audit committee report in page 82 - 83 of the annual report explains the function of the audit committee which has executed the above function.
Compliant
Disclosure in the Annual Report relating to audit Committee
The names of the directors comprising the Remuneration committee should be disclosed in the annual report.
The audit committee report in page 82 - 83 has addressed this requirement.
Compliant
STATEMENT OF COMPLIANCEFrom the above mentioned details it can be concluded that the Company is fully compliant with the requirements of the Code of Best Practice on Corporate Governance issued jointly by the Institute of Chartered Accountants of Sri Lanka and the Securities and Exchange Commission of Sri Lanka in 2017 and the Corporate Governance Rules of Colombo Stock Exchange.
Further, the Board confirms that all statutory payments due to the Government, other regulatory institutions and to employees, have been made on time.
Therefore the Board concludes and declares that the Company is fully compliant to with the Corporate Governance Codes of Institute of Chartered Accountants of Sri Lanka, Securities and Exchange Commission and Corporate Governance Rules of Colombo Stock Exchange has in place a robust Corporate Governance Framework to govern the business.
J A P M Jayasekera Dhammika PereraManaging Director Chairman
CORPORATE GOVERNANCE

INTEGRATED ANNUAL REPORT 2017/18 67
RISK MANAGEMENT AND INTERNAL CONTROL REPORTINTRODUCTION
At Lanka Tiles PLC (LTPLC) we have put in place a robust, integrated risk management process across the business to manage risks arising from global and domestic macro dynamics to safeguard shareholder assets and ensure sustainability of the business. The Company has taken a strategic initiative to identify the risks relevant to the organisation, while continually monitoring the risk environment to respond to potential risks.
RISK MANAGEMENT FRAMEWORK
The Committee of Sponsoring Organisations of the Tradeway Commission (COSO) defines Enterprise Risk Management (ERM) as a process, effected by the entity’s Board of Directors and management and applied in strategy setting and across the enterprise, designed to identify potential events that may affect the entity, and manage risk to be within the risk appetite, to provide reasonable assurance regarding the achievement of entity objectives.
LTPLC adopted an ERM approach in year 2013, because it provides an integrated approach to the management of the Company’s business risk. The risk management process enables the administration to:
1. Evaluate strategies existing within the organisation to mitigate the risk factors identified
2. Make sure of the continuation of the business
3. Ensure the required returns to the stakeholders.
4. This process additionally assists the Company in managing sustainability of growth and profitability.
The objective is to improve performance and decision making through identification, evaluation and management of key risks.
THE RESPONSIBILITY OF THE RISK MANAGEMENT
The responsibility of the Risk Management process lies with the Board of Directors and the process is supervised by the Company’s Executive Committee. The process
is supervised by the Company’s Executive Committee and reviewed by the Audit Committee.
A review of the risk management framework and the process of the Company is described below.
A graphical overview of the Company’s risk management framework is given below.
The adherence of the Lanka Tiles PLC risk management framework with the COSO’s integrated enterprise risk management principles can be presented as follows;
Organisation Strategy
Risk Management Strategy
Risk Management Roles & Responsibilities
Risk Response & Reporting
Risk Identification & Assessment
Corporate Governance
Risk Management Policies & Procedures

68 LANKA TILES PLC
The adherence of the Lanka Tiles PLC risk management framework with the COSO’s integrated enterprise risk management principles can be presented as follows;
Principle Lanka Tiles Adherence Compliance Status
RISK CULTURE
A Company has to cultivate an appropriate risk awareness culture for effective ERM practice. A strong endorsement by the Board of Directors and senior management of the value of investing time and infrastructure in better understanding the organisation’s most significant risk exposures is an important and necessary condition that must be in place.
In this regard the senior management and the Board of Directors have a clear understanding of the objectives of ERM relative to traditional approaches to risk management and the CEO embraces the need and provides adequate endorsement of an enterprise wide approach to risk oversight that seeks to obtain a top-down view of major risk exposures. The Board of Directors is also supportive of management’s efforts to implement an enterprise wide approach to risk oversight and the Board of Directors sets aside agenda time at each of its meetings to discuss the most significant risks facing the organisation. The senior management has effective risk management capabilities and competencies.
Compliant
RISK IDENTIFICATION
Robust processes have to be in place in the organisation to identify risks, particularly those risks that may be currently unknown, but emerging and should encourage the management to regularly think about risk.
In this regard, the organisation has defined and widely communicated to members of management and the Board what it means by the term “risk.” The organisation has identified a broad range of risks that may arise both internally and externally, including risks that can be controlled or prevented, as well as those over which the organization has no control. The organisation engages in identifiable processes to regularly scan the environment in an effort to identify unknown, but potentially emerging risks such as competitor moves, new regulations, changing consumer preferences, etc. Each member of the Board of Directors has provided input into the risk identification process.
Compliant
RISK ASSESSMENT
Organisation needs methods to prioritise risks that encourages a consistent consideration of both the likelihood of the risk occurring and the impact of the event to the organisation, if the risk occurs.
The organisation defines a five year time period over which risks should be assessed to ensure consistency in management’s evaluations. The organization strives to assess inherent risk of the Company and industry and the organisation assesses not only the likelihood of a risk event occurring but also the impact of the risk to the organisation. The Board of Directors has concurred with the assessment of the risks completed by management.
Compliant
RISK MANAGEMENT AND INTERNAL CONTROL REPORT

INTEGRATED ANNUAL REPORT 2017/18 69
ARTICULATION OF RISK APPETITE
While determining the organisation’s appetite for risk taking can be challenging, it is important that the board and senior management make some attempt to articulate its overall appetite for risk taking.
The board and management have engaged in discussions to articulate the organisation’s overall appetite for risk taking. The Board of Directors has concurred with the organisation’s risk appetite.
Compliant
RISK RESPONSE
It is very important to ensure that an appropriate risk response method is implemented, and then to ensure that the response is working as intended. Periodic evaluation of whether identified risk responses are effectively being carried out will ensure an effective ongoing ERM process.
The organisation has identified risk owners with responsibility for each of its most significant risks. The organisation has evaluated whether the existing response is sufficient to manage the risks to be within the organisation’s risk appetite. The organisation has separately evaluated the potential cost of the risk response relative to the benefit provided by the response towards either reducing the impact or reducing the probability of occurrence of the risk event. The organisation’s ERM process helps identify potential overlaps or duplications in risk responses across the enterprise.
Compliant
RISK REPORTING
As risks are identified and assessed across the organisation, processes are needed to facilitate the communication of risk-related information so that an aggregate view of important risks and their related risk responses are provided to senior management, the board, and to critical stakeholders.
The organisation has developed and monitors critical risk indicators that are leading in nature in that they provide some indication that a risk event is more likely to occur in the future. Senior management regularly review management reports that provide the status of critical risks and risk response plans. The Board monthly receives and reviews these reports which provide the status of critical risks and risk response plans.
Compliant
INTEGRATION WITH STRATEGIC PLANNING
Effective ERM can be an important input and consideration into the determination and execution of any organisation’s strategy. ERM provides critical insights into the portfolio of existing and emerging risk exposures that can contribute to the strategic success of the organization.
The organisation has a formal strategic planning process and the strategic plan is updated at least annually. The organisation’s existing risk profile is an important input for the strategic planning process. Senior management links the top risk exposures to strategic objectives to determine which objectives face the greatest number of risks and to determine which risks impact the greatest number of objectives.
Compliant
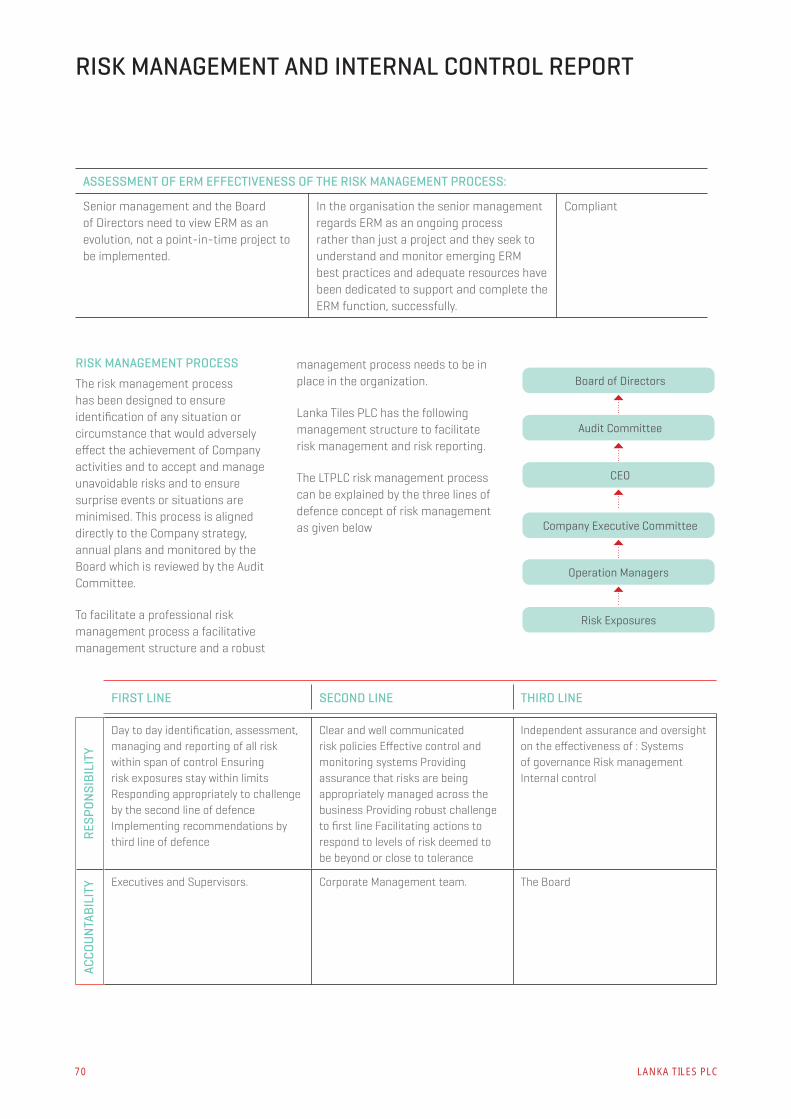
70 LANKA TILES PLC
ASSESSMENT OF ERM EFFECTIVENESS OF THE RISK MANAGEMENT PROCESS:
Senior management and the Board of Directors need to view ERM as an evolution, not a point-in-time project to be implemented.
In the organisation the senior management regards ERM as an ongoing process rather than just a project and they seek to understand and monitor emerging ERM best practices and adequate resources have been dedicated to support and complete the ERM function, successfully.
Compliant
RISK MANAGEMENT PROCESS
The risk management process has been designed to ensure identification of any situation or circumstance that would adversely effect the achievement of Company activities and to accept and manage unavoidable risks and to ensure surprise events or situations are minimised. This process is aligned directly to the Company strategy, annual plans and monitored by the Board which is reviewed by the Audit Committee.
To facilitate a professional risk management process a facilitative management structure and a robust
management process needs to be in place in the organization.
Lanka Tiles PLC has the following management structure to facilitate risk management and risk reporting.
The LTPLC risk management process can be explained by the three lines of defence concept of risk management as given below
FIRST LINE SECOND LINE THIRD LINE
RESP
ONSI
BILI
TY
Day to day identification, assessment, managing and reporting of all risk within span of control Ensuring risk exposures stay within limits Responding appropriately to challenge by the second line of defence Implementing recommendations by third line of defence
Clear and well communicated risk policies Effective control and monitoring systems Providing assurance that risks are being appropriately managed across the business Providing robust challenge to first line Facilitating actions to respond to levels of risk deemed to be beyond or close to tolerance
Independent assurance and oversight on the effectiveness of : Systems of governance Risk management Internal control
ACCO
UN
TABI
LITY Executives and Supervisors. Corporate Management team. The Board
RISK MANAGEMENT AND INTERNAL CONTROL REPORT
Board of Directors
Audit Committee
Company Executive Committee
CEO
Risk Exposures
Operation Managers

INTEGRATED ANNUAL REPORT 2017/18 71
The Key Risks that may hinder the Achievement of the Company’s Strategic Business Objectives are set out below
PRINCIPLE LANKA TILES RESPONSE CONTROL STATUS
BUSINESS ENVIRONMENT RISK
Environment risk arises when there are external forces that may affect the viability of the enterprise’s business model, including the fundamentals that drive the overall objectives and strategies that define it. Adverse political actions and changing laws may be harmful to the firm ’s resources and future cash flows in a country in which the firm has invested significantly and is dependent on a significant volume of business.
To counter political and regulation risk the Company brings the relevant issues to the notice of government institutions, persistently monitors them and maintains a close relationship with relevant government institutions and industry associations and chambers. The Company also assists government institutions in formulating new laws and regulations pertaining to the industry and provides information on relevant issues to government institutions. In addition, a legal feasibility evaluation has been made a standard process in order to approve capital projects.
In control
OPERATIONS RISK
Operations risk is the risk of inefficiency in executing the firm’s business model, satisfying customers and achieving the Company’s quality, cost and time performance objectives. Unproductive operations threaten the Company’s capacity to produce goods at or below cost levels incurred by competitors.
To counter operations risk, the Company has a strong operational control mechanism where production, quality, cost and efficiency are monitored on a daily basis and improvement projects are undertaken to increase efficiency. Plant upgrades with new plants and machinery are done annually to be on par with world class manufacturers. In addition, a five year strategic plan has been implemented to enhance capacity and ensure operations run smoothly
In control
CYBERSECURITY RISK
Cybersecurity risk is the risk that external parties by using the cyberspace or cyber tools penetrate the organisations database to obtain specific details which are counterproductive to the organisation.
Internal and external parties could have computing devices systems embedded in everyday objects which may enable them to interconnect with the company’s network to send and receive data which are unauthorised by the organisation. The external parties may also use sophisticated tools to hack into company database. These data can be then acquired and used to destabilise company operation or obtain confidential corporate information or be used to demand a financial payment from the company.
To counter cyber security risk, the company has appointed a Chief Information Security Officer (CISO) designated as Head of IT who has sufficient expertise, authority and budgetary allocation to introduce and implement robust cyber security risk and management policy and control system.
In addition a cyber security risk management process, response system, disaster recovery plan and cyber security governance practice is in place.
Also the Board allocates regular and adequate time on the board meeting for discussions about cyber risk management which includes, potential cyber security risks in the company’s business model and Company’s security strategy compliance.
Also an independent review of cyber security risk is done by third parties whose findings are reviewed by the CISO, CFO, CEO and the Board.
In control

72 LANKA TILES PLC
PRINCIPLE LANKA TILES RESPONSE CONTROL STATUS
CAPACITY RISK
Insufficient capacity will pose a hindrance to the Company’s ability to meet customer demands or excess capacity threatens the firm’s ability to generate competitive profit margins.
Presently the firm has identified that it needs more capacity and therefore a Capacity Expansion Program has been planned for next five years and reviewed monthly. This includes installation of the new kiln, importing tiles to meet specific demands and implementing the capacity expansion plan to monitor financial and resources requirements.
In control
INTEGRITY RISK
Integrity risk is the risk of management fraud, employee fraud, illegal acts, unauthorised acts and any or all of which could lead to loss of reputation in the marketplace.
To mitigate this risk the Company conducts a monthly internal audit of transactions undertaken by an independent firm of chartered accountants, to detect and reduce fraud and detail approval processes for official transactions which mitigate the above risk. In addition quarterly audit committee meeting to monitor the reporting status coupled with monthly Board meetings which supervise the financial status of the Company and the integrity of employees.
In control
FINANCIAL RISK
Exposure to lower returns or the necessity to borrow due to shortfalls in cash or expected cash flows or variances in timing or significant movements in interest rates expose the firm to a number of negative factors. These include higher borrowing costs, lower investment yields or decreased asset values and result in financial helping risk. Movements in prices, rates, indices and such, affect the value of the Company’s financial assets and stock price, which may additionally impact its cost of capital and/ or the ability to raise capital
Credit limits and given credit is reviewed through a detailed approval process reducing risk of debt, exports under DA terms are insured using SLECIC and monthly overdue debtors are reported to the Board for necessary action. These actions reduce cash flow risk and all capital projects are financially evaluated to ensure that inflows match with borrowings. Both floating and fixed rate debt is maintained and is structured using loans, share capital and internal fund management to reduce borrowings.
In control
RISK MANAGEMENT AND INTERNAL CONTROL REPORT

INTEGRATED ANNUAL REPORT 2017/18 73
PRINCIPLE LANKA TILES RESPONSE CONTROL STATUS
ENVIRONMENTAL AND SOCIAL RISK
Company should establish a structure to support its ability to create value and manage risks in the short, medium and long term, recognising managing and reporting on all pertinent aspects of Environment and Social Risk.
Environmental Risk of an organisation is the direct and indirect economic, social, health and environmental implications of the decisions and activities on the business.
Social Risk of an organisation is its relationship with the community, customers, employees, suppliers, outsourced providers and any other party that can influence the organisation’s business model
The Board and the Senior Management review Environmental, Social factory that impact the business at each board meeting. Also the compliance to regulations are tabled. The board also reviews the adequacy of management control systems and threats to manage this risk effectively.
Regular training, exposure and leadership is given to Senior Management and line management to manage the risks and mitigate them
In control
STATEMENT OF RISK MANAGEMENT AND INTERNAL CONTROL ADEQUACY The Board confirms that an effective risk management and internal control framework and an ongoing process is in place to minimise all potential risks and its probability of impact to the Company and its business.
The Board also confirms all risks were reviewed using internal and external parties and were deliberated upon by the Board and if necessary corrective actions were taken.
The Board assures the reliability of financial statements presented herein has been done in according with applicable accounting standards and regulatory requirements and training in to account all risk factors.
The Board declares that it has not found any significant risks that may impact the operation of the business as a going concern, or will impact the finance stability or the business materially.
J A P M Jayasekera Dhammika PereraManaging Director Chairman

74 LANKA TILES PLC
ANNUAL REPORT OF THE BOARD OF DIRECTORS ON THE AFFAIRS OF THE COMPANYANNUAL REPORT OF THE BOARD OF DIRECTORS FOR THE YEAR ENDED 31 MARCH 2018
The Board of Directors of Lanka Tiles PLC is pleased to present herewith the Annual Report together with the audited consolidated financial statements of the Company and its subsidiaries (collectively referred to as ‘the Group’) for the year ended 31 March 2018 as set out on pages 90 to 128.
This Annual Report of the Board on the affairs of the Company contains the information required in terms of the Companies Act No. 07 of 2007, the Listing Rules of the Colombo Stock Exchange and is guided by recommended best practices.
1. FORMATION
The Company is a public limited liability company incorporated and domiciled in Sri Lanka and is listed on the Colombo Stock Exchange. The registered office and the principal place of business of the Company is located at No. 215, Nawala Road, Narahenpita, Colombo 05.
The Company was incorporated in Sri Lanka on 30 March 1984 under the Companies Act No. 17 of 1982 as a private limited liability company bearing the name Lanka Tiles (Private) Limited.
On 7 August 1984, Lanka Tiles (Private) Limited was listed on the Colombo Stock Exchange as a Quoted Public Limited Liability Company.
Pursuant to the requirements of the new Companies Act No. 7 of 2007, the Company was re-registered on 19 March 2008 and was accordingly renamed as Lanka Tiles PLC and bears registration number PQ129.
2. PRINCIPAL ACTIVITIES OF THE COMPANY AND REVIEW OF PERFORMANCE DURING THE YEAR
The main activity of the company, which remains unchanged since the previous year, is the manufacture and sale of glazed ceramic and porcelain floor tiles.
This report together with the financial statements reflect the state of affairs of the Company.
3. FINANCIAL STATEMENTS
The financial statements of the Company and the Group together with the accounting policies and notes are given on pages 90 to 128.
Summarised financial results
Year ended 31 March
2018 2017
(Rs. '000) (Rs. '000)
Revenue 6,126,307 5,176,372 Total Comprehensive income for the year
806,026 1,260,457
4. INDEPENDENT AUDITOR’S REPORT
The independent auditor’s report on the financial statements of the Company is given on pages 84 to 87.
5. ACCOUNTING POLICIES
The financial statements of the Company and the Group have been prepared in accordance with the Sri Lanka Accounting Standards, which comprise Sri Lanka Financial Reporting Standards (SLFRSs), Sri Lanka Accounting Standards (LKASs), relevant interpretations of the Standing Interpretations Committee
(SIC) and International Financial Reporting Interpretations Committee (IFRIC). The significant accounting policies adopted in the preparation of financial statements are given on pages 94 to 128.
6. STATEMENT OF DIRECTORS’ RESPONSIBILITY
The Directors are responsible for preparing and presenting the financial statements of the Company and the Group to reflect a true and fair view of their state of affairs. The Directors are of the view that these financial statements have been prepared in conformity with requirements of the Sri Lanka Accounting Standards, the Companies Act No. 7 of 2007 and the Listing Rules of the Colombo Stock Exchange.
7. DIRECTORS
The names of Directors who held office as at the end of the accounting period are given below.
Executive Director Mr. J A P M Jayasekera Managing Director
Non-Executive DirectorsMr. Dhammika Perera Chairman (Alternate Director Mr. G A R D Prasanna)
Mr. A M WeerasingheDeputy Chairman
Mr. T G ThoradeniyaDirector
Independent Non Executive Directors Dr. S Selliah Director Mr. K D G Gunaratne Director Ms. A M L Page Director

INTEGRATED ANNUAL REPORT 2017/18 75
Ms. A M L Page and Mr. T G Thoradeniya retire by rotation at the conclusion of the Annual General Meeting in terms of Articles 103 and 104 of the Articles of Association and being eligible are recommended by the Directors for re-election.
Directors of the subsidiary Companies
Beyond Paradise Collection Ltd Mr. M H Jamaldeen Mr. K D H Perera Mr. J A P M Jayasekera
Lankatiles Private LimitedMr. A M WeerasingheMr. J A P M JayasekeraMr. Fatheraj SinghviMr. Praveen Kumar Singhvi
LTL Development (Pvt) Ltd Mr. K D A Perera Mr. J A P M Jayasekera
8. INTERESTS REGISTER
The Company maintains an Interests Register in terms of the Companies Act, No. 7 of 2007, which is deemed to form part and parcel of this Annual Report and available for inspection upon request.
All related party transactions which encompasses the transactions of Directors who were directly or indirectly interested in a contract or a related party transaction with the Company during the accounting period are recorded in the Interests Register in due compliance with the applicable rules and regulations of the relevant Regulatory Authorities.
The Directors declare that the Company is in compliance with Section 9 of the Listing Rules of the Colombo Stock Exchange pertaining to Related Party Transactions during the financial year ended 31st March 2018.
The relevant interests of Directors in the shares of the Company as at 31st March 2018 as recorded in the Interests Register are given in this Report under Directors’ shareholding.
9. DIRECTORS REMUNERATION
The Directors’ remuneration is disclosed under key management personnel compensation in note 29 to the financial statements on page 127.
10. DIRECTORS’ INTERESTS IN CONTRACTS
The Directors have no direct or indirect interest in any other contract or proposed contract with the Company. The Company carried out transactions during the year in the ordinary course of its business at commercial rates with the related entities.
11. DIRECTORS’ RESPONSIBILITY FOR FINANCIAL REPORTING
The Directors are responsible for the preparation of financial statements of the Company and the Group to reflect a true and fair view of the state of its affairs. The Directors are of the view that these financial statements have been prepared in conformity with requirements of the Sri Lanka Accounting Standards, the Companies Act No.7 of 2007 and the listing rules of the Colombo stock exchange.
12. INDEPENDENT AUDITORS
Messrs PricewaterhouseCoopers, Chartered Accountants served as the Auditors during the year under review and also provided income tax compliance services. They do not have any interest in the Company and its subsidiary other than that of auditor and provider of tax compliance related services.
A total amount of Rs. 1,658,000 (2017 - Rs. 1,528,000/-) is paid or payable by the Company to the Auditors for the year under review comprising Rs. 805,000 (2017 - Rs. 732,000/-) as audit fees and Rs. 853,000 (2017 - Rs. 796,000/-) for non audit services.
The Auditors have expressed their willingness to continue in office. The Audit Committee at a meeting held on 23 May 2018 recommended that they be re-appointed as auditors. A resolution to re-appoint the auditors and to authorise the Directors to determine their remuneration will be passed at the annual general meeting.
13. STATED CAPITAL
The stated capital of the Company is Rs. 900,967,696. (2017 - Rs. 900,967,696).
The number of shares issued by the Company stood at 53,050,410 fully paid ordinary shares as at 31 March 2018 (which was the same as at 31 March 2017).
14. DIRECTORS’ SHAREHOLDING
The relevant interests of Directors in the shares of the Company as at 31 March 2018 and 31 March 2017 are as follows.
Year ended 31 March
2018 2017
Mr. Dhammika Perera
- -
Mr. A M Weerasinghe 34,697 - Mr. J A P M Jayasekera
-
Dr. S Selliah - - Mr. T G Thoradeniya - - Mr. K D G Gunaratne - - Ms. A M L Page 2,500 2,500

76 LANKA TILES PLC
Mr Dhammika Perera is the major shareholder of Vallibel One PLC which holds 56,502,600 shares constituting 51% of the shares representing the stated capital of the company.
15. SHAREHOLDERS
There were 1,735 shareholders registered as at 31 March 2018 (1,787 shareholders as at 31 March 2017).
16. MAJOR SHAREHOLDERS, DISTRIBUTION AND OTHER INFORMATION
Information on the distribution of shareholding, analysis of shareholders, market values per share, earnings, dividends, net assets per share, twenty largest shareholders of the Company, percentage of shares held by the public as per the Listing Rules of the Colombo Stock Exchange are given on page 131 to 132 under Share Information.
17. EMPLOYMENT POLICY
The Company’s employment policy is totally non-discriminatory which respects individuals and provides
the year ending 31st March 2018 (2017-Rs. 5.00 per share) amounting 318,302,460 (2017-Rs.265,252,050) was paid on 26 March 2018.
22. SUBSTANTIAL SHAREHOLDINGS
The Company is controlled by Lanka Walltiles PLC which holds 68.2% (2017- 68.2) of the issued share capital of the Company. Lanka Walltiles PLC itself is a subsidiary of Royal Ceramic Lanka PLC of which the ultimate parent Company is Vallibel One PLC.
23. INVESTMENT
Details of the Company’s quoted and unquoted investments as at 31st March 2018 are given in Notes 07 and 08 to the Financial Statements on page 110.
24. PUBLIC HOLDING
28.27% (2017 - 29.15%) of the issued shares of the Company are widely held by the public.
25. DONATIONS
The Company made donations amounting to Rs. 977,763 (2017 - Rs.3,062,217) in total, during the year under review.
26. RISK MANAGEMENT
An ongoing process is in place to identify and manage the risks that are associated with the business and operations of the Company and its subsidiary. The Directors, review this process through the audit committee.
27. STATUTORY PAYMENTS
The Directors confirm that to the best of their knowledge, all taxes, duties and levies payable by the Company and the Group, all contributions, levies and taxes payable on behalf of, and in respect of employees of the Company and the Group and all other known statutory dues as were due and payable by the Company and the Group as at the date of Statement
ANNUAL REPORT OF THE BOARD OF DIRECTORS ON THE AFFAIRS OF THE COMPANY
career opportunities irrespective of the gender, race or religion. As at 31 March 2018, 497 persons were in employment (495 persons as at 31 March 2017).
18. RESERVES
The movement of reserves during the year is given under the statement of changes in equity on page 92.
19. CAPITAL EXPENDITURE
The total capital expenditure during the year amounted to Rs. 402 Mn compared to Rs.413 Mn incurred in the previous year. Details of movement in property, plant and equipment and capital work-in-progress are given under note 05 to the financial statements.
20. LAND HOLDINGS
The book value of property, plant and equipment as at the financial year end date amounted to Rs. 3,856 Mn (2017 - Rs. 3,609 Mn)
The extents, locations, valuations and the number of buildings of the Company’s land holdings are given below:
Location No. of Buildings
Lands in extent(Perches)
Valuation 2018
(Rs. ‘000)
Valuation 2017
(Rs. ‘000)
Factory at Jaltara, Ranala
41 4,060 1,132,942 1,137,371
Land adjacent to the factory
17 1,897 211,851 205,144
Warehouse at Biyagama 2 336 471,305 442,725Ball Clay land at Kalutara - 841 52 52Nawala Land 1 32 232,218 229,743Land at Madampe - 2,082 39,038 35,780Total 61 9,248 2,087,405 2,050,815
The movement of fixed assets during the year is given in note 5 to the financial statements.
21. DIVIDEND
An interim dividend of Rs. 4.00 per share for the year ending 31 March 2018 (2017-Rs. 2.50 per share) amounting 212,201,640 (2017-Rs.132,626,025) was paid on 13 September 2017.A second interim dividend of Rs.6.00 per share for

INTEGRATED ANNUAL REPORT 2017/18 77
of Financial Position have been duly paid or, where relevant provided for, except for certain assessments where appeals have been lodged.
28. CONTINGENT LIABILITIES
Except as disclosed in Note 30 to the Financial Statements, there were no material contingent liabilities as at the date of consolidated statement of Financial Position.
29. EVENTS AFTER REPORTING PERIOD
As disclosed in note 32 to the financial statements there are no material events as at the date of the auditor’s report which require adjustment to, or disclosure in the financial statements.
30. CORPORATE GOVERNANCE
The Board of Directors confirm that the Company is compliant with section 7.10 of the Listing Rules of the CSE.
An Audit Committee and Remuneration Committee function as board sub committees, with directors nominated for the Group and possess the requisite qualifications and experience. The composition of the said committees is as follows.
Audit CommitteeMr. J D N Kekulawala (Chairman)Dr. S Selliah Mr. T de Zoysa (Retired 29/06/2017)Mr. T G Thoradeniya
Remuneration CommitteeMr. A M Weerasinghe (Chairman) Mr K D G Gunaratne Mr. T de Zoysa (Retired 29/06/2017) Dr. S Selliah
Related Party Transaction CommitteeDr. S Selliah (Chairman) Mr. T de Zoysa (Retired 29/06/2017)Mr. J D N KekulawalaMr. T G Thoradeniya
The Corporate Governance of the Company is reflected in its strong belief in protecting and enhancing stakeholder value in a sustainable manner, supported by a sound system of policies and practices. Prudent internal controls ensure professionalism, integrity and commitment of the Board of Directors, Management and employees.
31. CORPORATE SOCIAL RESPONSIBILITY
The Company continued its Corporate Social Responsibility Programme, details of which are set out on page 52 of this report.
32. ENVIRONMENTAL PROTECTION
After making adequate enquiries from the management, the Directors are satisfied that the Company and Group operates in a manner that
minimizes the detrimental effects on the environment and provides products and services that have a beneficial effect on the customers and the communities within which the Company and its subsidiaries operates.
33. GOING CONCERN
The financial statements are prepared on going concern principles. After making adequate enquires from the management, the Directors are satisfied that the Company and its subsidiaries has adequate resources to continue its operations in the foreseeable future.
34. ANNUAL GENERAL MEETING
The Notice of the Thirty Forth (34th) Annual General Meeting appears on page 133.
This Annual Report is signed for and on behalf of the Board of Directors by
Dhammika Perera J A P M Jayasekera Chairman Managing Director
P W Corporate Secretarial (Pvt) Ltd Secretaries
Colombo 25th May 2018

78 LANKA TILES PLC
STATEMENT OF DIRECTORS’ RESPONSIBILITY
The Directors are required by the Companies Act, No. 7 of 2007 to prepare financial statements for each financial year, which give a true and fair view of the statement of affairs of the Company as at the end of the financial year and the income and expenditure of the Company for the financial year.
The Directors are also responsible to ensure that the financial statements comply with any regulations made under the Companies Act which specifies the form and content of financial statements and any other requirements which apply to the Company’s financial statements under any other law.
The Directors consider that the financial statements presented in this Annual Report have been prepared using appropriate accounting policies, consistently applied and supported by reasonable and prudent judgments and estimates and in compliance with the Sri Lanka Accounting Standards, Companies Act, No. 7 of 2007, Sri Lanka Accounting and Auditing Standards Act No. 15 of 1995.
The Directors are responsible for ensuring that the Company keeps sufficient accounting records, which disclose the financial position of the Company with reasonable accuracy and enable them to ensure that the financial statements have been prepared and presented as aforesaid. They are also responsible for taking measures to safeguard the assets of the Company and in that context to have proper regard to the establishment of appropriate systems
of internal control with a view to prevention and detection of fraud and other irregularities.
The Directors continue to adopt the going concern basis in preparing the financial statements. The Directors, after making inquiries and review of the Company’s Business Plan for the financial year 2017/2018, including cash flows and borrowing facilities, consider that the Company has adequate resources to continue in operation.
By Order of the BoardLANKA TILES PLC
P W Corporate Secretarial (Pvt) LtdSecretaries
25th May 2018

INTEGRATED ANNUAL REPORT 2017/18 79
The financial statements are prepared in compliance with the Sri Lanka Accounting Standards issued by the Institute of Chartered Accountants of Sri Lanka and the requirements of the Companies Act No. 7 of 2007 and any other applicable statues to the extent applicable to the Company. There are no departures from the prescribed accounting standards in their adoption. The accounting policies used in the preparation of the financial statements are appropriate and are consistently applied, except where otherwise stated in the notes accompanying the financial statements.
The Board of Directors and the management of your Company accept responsibility for the integrity and objectivity of these financial statements. The estimates and judgments relating to the financial statements were made on a prudent and reasonable basis, in order that the financial statements reflect in a true and fair manner, the form and substance of transactions, and reasonably present the Company’s state of affairs. To ensure this, the Company has taken proper and sufficient care in installing a system of internal control and accounting records, for safeguarding assets, and for preventing and detecting frauds as well as other irregularities, which is reviewed, evaluated and updated on an ongoing basis.
CHIEF EXECUTIVE OFFICER’S AND CHIEF FINANCIAL OFFICER’S RESPONSIBILITY STATEMENT
Our internal auditors have conducted periodic audits to provide reasonable assurance that the established policies and procedures of the Company were consistently followed. However, there are inherent limitations that should be recognised in weighing the assurances provided by any system of internal controls and accounting.
The financial statements were audited by M/s. PricewaterhouseCoopers, Chartered Accountants, the independent auditors. The independency of the external auditor has been assessed by the audit committee and the Board and have been determined as independent.
The Audit Committee of your Company meets periodically with the internal auditors and the external auditors to review the manner in which these auditors are performing their responsibilities, and to discuss auditing, internal control and financial reporting issues. To ensure complete independence, the external auditors and the internal auditors have full and free access to the members of the Audit Committee to discuss any matter of substance.
It is also declared and confirmed that the Company has complied with and ensured compliance by the auditors with the guidelines for the audit of Listed Companies.
It is also confirmed that the Company is compliant the Code of Best
Practice in Corporate Governance issued by the Institute of Chartered Accountants of Sri Lanka and the Code of Best Practice on Related Party Transactions issued by the Securities and Exchange Commission of Sri Lanka.
B T T Roche General Manager - Finance
J A P M Jayasekera Managing Director
25th May 2018

80 LANKA TILES PLC
RELATED PARTY TRANSACTIONS REVIEW COMMITTEE REPORTPURPOSE OF THE COMMITTEE The purpose of the Related Party Transaction Review Committee (RPTRC) of Lanka Tiles PLC (LTPLC)is to conduct an independent review and oversight of all related party transactions of LTPLC and to ensure that the Company complies with the rules set out in the Code Of best Practice issued by the Securities and Exchange Commission of Sri Lanka. The primary objectives of the said rules are to ensure that the interests of the shareholders as a whole are taken into account when entering into related party transactions, and to prevent Directors, Key Management Personnel or substantial shareholders from taking advantage of their positions. To exercise this purpose the Committee has adopted the related party transaction Policy which contains the company’s Policy governing the review, approval and oversight of related party transactions.
RESPONSIBILITIES OF THE RELATED PARTY TRANSACTIONS REVIEW COMMITTEEThe following are the key responsibilities have been set out in the Charter for RPTRC;
a) Ensure that the Company complies with the rules set out in the Code
b) Subject to the exceptions given under Rule 27 of the Code, review, in advance all proposed related party transactions
c) Perform other activities related to the Charter as requested by the Board
d) Have meetings every fiscal quarter and report to the Board on the Committee’s activities
e) Share information with the Audit Committee as necessary and appropriate, to permit the Audit Committee to carry out its statutory, regulatory and other
responsibilities with regard to related party transactions.
f) Review the Charter and Policy at least annually and recommend amendments to the Charter and Policy to the Board as and when determined to be appropriate by the Committee.
COMPOSITION OF THE COMMITTEEThe Related Party Transactions Review Committee comprises of the following three independent non-executive Directors.
1. Dr. S Selliah – Chairman2. Mr. J D N Kekulawala3. Mr. T G Thoradeniya
The Managing Director and the General Manager - Finance attend meetings by invitation and the Company Secretary functions as the Secretary to the Committee.
The Committee members possess vast experience in business management and financial expertise to perform the duty of the Committee successfully.
MEETINGSThe Committee held four meetings during the year under review for which all members attended. The minutes of the Committee meeting were tabled at Board meeting, for the review of the Board.
PROCEDURES FOR REPORTING RPT’SThe Managing Director (MD) is responsible for reporting to the Committee, for its review and approval the information set out under Rule 30 of the Code at the minimum, in respect of each related party transaction proposed to be entered into other than the exceptions given in Rule 27 of the code. Moreover, on a quarterly basis, the MD is required to report to the Committee on the approved related party transactions actually entered into by the Company.
The Committee has approved the Related Party Transactions Declaration Form required to be filled by the Directors and key management personnel of the Company. The Company uses this form to capture the related party transactions at the end of every quarter.
REVIEW OF RELATED PARTY TRANSACTIONSThe Committee reviewed all related party transactions of the Company for the financial year 2017/18. In terms of Rule 9.3.2 of the Listing Rules of the Colombo Stock Exchange on related party transactions, there were no one-recurrent related party transactions entered into during the course of the financial year aggregative value of which exceeded the lower of 10% of the equity or 5% of the assets. There were no recurrent related party transactions carried out during the financial year ended 31st March 2018, the aggregate value of which exceeded 10% of the revenue.
In the opinion of the Committee, the terms of these transactions were not more favourable to the related parties than those generally available to the public. The details of related party transactions entered into during the year are given in Note 29 to the Financial Statements, on pages 125 to 128 of this Annual Report.
DECLARATIONA declaration by the Board of Directors on compliance with the rules pertaining to Related Party Transactions appears on the report of the Board of Directors on pages 74 - 77 of this Annual Report.
Dr. S SelliahChairman - Related Party Transactions Review Committee
25th May 2018

INTEGRATED ANNUAL REPORT 2017/18 81
REMUNERATION COMMITTEE REPORT
ROLE OF THE REMUNERATION COMMITTEE
The Remuneration Committee is a sub - committee of the main Board, to which it is accountable. The Committee evaluates the performance of the Board, the Chief Executive Officer, Key Management Personal and executive staff against the set objectives and goals, and determines the remuneration policy of the Company for all levels of employees. The Committee supports and advises the Board on remuneration and remuneration related matters and makes decisions under delegated authority with a view to aligning the interests of employees and shareholders.
COMPOSITION OF THE REMUNERATION COMMITTEE
The Remuneration Committee comprises of the following three independent non-executive Directors.
Mr. A M WeerasingheChairman of the Remuneration Committee
Mr. K D G Gunaratne Committee Member
Dr. S SelliahCommittee Member
The Managing Director attends the Committee meeting by invitation. The Company secretary is the secretary of the Remuneration Committee.
The above Committee members possess vast experience in the fields of Business Management, Human Resources Management, Labour Relations and Labour Law. Hence the Committee has adequate expertise in remuneration policy and business management to deliberate and
propose necessary changes and improvements to meet the roles and responsibility of the Committee.
MEETINGS
The Remuneration Committee met once for the year where all members participated.
FUNCTIONS PERFORMED BY THE REMUNERATION COMMITTEE
a. Evaluating and recommending the remuneration payable to the Board, Managing Director and the Key Management Personal of the Company to the Board to make the final determination. Based on that, the aggregate remuneration paid to Executive and Non Executive Directors for last financial year is given on Page 128 of the Annual Report under key management remuneration.
b. Ensuring that the Board complies with the Companies Act in relation to Directors remunerations, especially the requirements of section 216. And it also ensures that employees are adequately compensated based on their performance and contribution for the period under review and future potential.
c. Constructing a specific remuneration policy and remuneration framework that enables the Company to attract and retain a high quality and representative staff in its operations and do this inter alia with reference to appropriate market rates where these are relevant, and benchmarking specific categories where required.
d. Ensuring internal equity and fairness in and between the various pay categories and building incentives in the cost of employment structure to encourage and reward excellent performance, on objectively defined criteria.
e. Ensuring that staff costs are within the budget set by the Board, and are sustainable over time.
CONCLUSION
The Committee is satisfied that it has performed the responsibilities that were delegated to it by the Board for the year under review and the necessary objectives were achieved for the year under review.
A M WeerasingheChairman of the Remuneration Committee
25th May 2018

82 LANKA TILES PLC
ROLE OF THE AUDIT COMMITTEE
The Audit Committee is a Sub Committee of the main Board to which it is accountable. The function of the Audit Committee is defined in the Audit Committee Charter. Primarily it is to assist the Board in its oversight of the integrity of the Financial Statements of the Company, to assess the adequacy of the risk management framework of the Company, assess the independence and the performance of the Company’s external audit function and internal audit functions, and review compliance of the Company with legal and regulatory requirements.
COMPOSITION OF THE AUDIT COMMITTEE
The Audit Committee comprised of the following three Directors of Lanka Walltiles PLC who is the parent company of Lanka Tiles PLC.
Mr. J D N Kekulawala Chairman - Independent Non-Executive Director
Dr. S Selliah Committee Member - Independent Non-Executive Director
Mr. T G Thoradeniya Committee Member - Non-Executive Director
Mr. T de Zoysa Committee Member - Independent Non-Executive Director (Resigned w.e.f. 29th June 2017)
The Managing Director and the General Manager – Finance attend the meetings at the invitation of the Audit Committee.
The Company secretary functions as the Secretary to the Audit Committee. Representatives of the Company, external auditors and internal
AUDIT COMMITTEE REPORT
auditors also attend Audit Committee meetings by invitation.
The Audit Committee has the required expertise in finance, law and business management to deliberate Audit Committee matters and recommend necessary action to be taken.
MEETINGS
The Audit Committee met 04 times during the year. The attendance of the members at the meeting is as follows.
Mr. J D N Kekulawala - 4/4
Dr. S Selliah - 4/4
Mr. T G Thoradeniya - 1/4
Mr. T de Zoysa - 1/4(Resigned w.e.f. 29th June 2017)
FUNCTIONS PERFORMED BY THE AUDIT COMMITTEE
a. The Committee reviewed the provisional financial statements that were published for financial year 2017/18 and the Annual Report of 2017/18. It reviewed the preparation, presentation and adequacy of disclosures in the financial statements of the Company, in accordance with Sri Lanka Accounting Standards and SLFRS. It also reviewed the Company’s compliance with financial reporting requirements, information requirements of the Companies Act and other relevant financial reporting related regulations and requirements.
b. The Committee reviewed the monthly internal audit reports. The internal audit function is carried out by M/s. KPMG. The Internal audits are done on a process based audit framework to improve process performance and control.
c. The Committee reviewed the external auditors’ report and management letter for the last year. All recommendations
proposed by the external auditors were discussed with the senior partner and recommendations proposed were duly carried out by the management. In addition the Audit Committee reviewed external auditors and the engagement partner’s relationships with the Company, and assessed that the external auditors are independent.
d. The Audit Committee in conjunction with the Managing Director of the Company reviewed the Company’s disclosure controls and procedures and internal control over financial reporting.
e. The Audit Committee reviewed the Company’s framework and practices with respect to risk assessment and risk management, including discussing with management the Company’s major financial risk exposures and the steps that have been taken to monitor and control such exposures.
f. The Audit Committee reviewed the company’s arrangement for the confidential receipt, retention and treatment of complaints alleging fraud, received from any sources and pertaining to accounting, internal controls or other such matters and assured the confidentiality to whistle-blowing employees. It also reviewed the company’s procedures for detecting and preventing fraud and bribery and receiving reports on non-compliance and reviewed the procedure for receiving and dealing with “Non-Compliance with Laws and Regulations (NOCLAR) referred by Professional Accountants.

INTEGRATED ANNUAL REPORT 2017/18 83
g. Performed other activities relate to this charter as requested by the Board of Directors
Oversee special investigations as needed. Reviewed and assessed the adequacy of the committee charter annually, requesting board approval for proposed changes, and ensure appropriate disclosure as may be required by law or regulation.
CONCLUSION
The Audit Committee is satisfied that the Company’s accounting policies, independence of the auditors and risk management policies are adequate for its operations. The Audit Committee has also accomplished responsibilities and functions that are delegated to it by the Board and outlined in the Charter. .
J D N KekulawalaChairman – Audit Committee
25th May 2018

84 LANKA TILES PLC
INDEPENDENT AUDITOR’S REPORT
REPORT ON THE AUDIT OF THE FINANCIAL STATEMENTS
Our opinion
In our opinion, the financial statements of Lanka Tiles PLC (“the Company”) and the consolidated financial statements of the Company and its subsidiaries (“the Group”) give a true and fair view of the financial position of the Company and the Group as at 31 March 2018, and of their financial performance and cash flows for the year then ended in accordance with Sri Lanka Accounting Standards.
What we have audited
The financial statements of the Company and the consolidated financial statements of the Group, which comprise:
∫ the statement of financial position as at 31 March 2018;
∫ the statement of comprehensive income for the year then ended;
∫ the statement of changes in equity for the year then ended;
∫ the statement of cash flows for the year then ended; and
∫ the notes to the financial statements, which include a summary of significant accounting policies.
Basis for opinion
We conducted our audit in accordance with Sri Lanka Auditing Standards (SLAuSs). Our responsibilities under those standards are further described in the Auditor’s Responsibilities for the Audit of the Financial Statements section of our report.
We believe that the audit evidence we have obtained is sufficient and appropriate to provide a basis for our opinion.
Independence
We are independent of the Group in accordance with the Code of Ethics issued by CA Sri Lanka (Code of Ethics), and we have fulfilled our other ethical responsibilities in accordance with the Code of Ethics.
Key audit matters
Key audit matters are those matters that, in our professional judgment, were of most significance in our audit of the financial statements of the current period. These matters were addressed in the context of our audit of the financial statements as a whole, and in forming our opinion thereon, and we do not provide a separate opinion on these matters.
The Company:
Key audit matter How our audit addressed the Key audit matterValuation of the land and buildings(Refer note 5 in the financial statements)
The Company owns a portfolio of land and buildings, notably in Ranala, Biyagama, Nawala and Madampe, the valuation of which amounts to LKR 2,087,404,859 as at 31 March 2018.
The Company revalues its land and buildings at regular intervals. The Company engaged an independent valuer to measure the value of land and buildings, and the resultant surplus from the valuation for the year ended 31 March 2018 amounted to LKR 83,292,949.
Our audit approach mainly included; test of details that covered the following.
We obtained evidence relating to the external valuer’s competence, independence from management and integrity. We also obtained the external valuation reports and performed the following tests:
- verified the completeness of the information provided to the independent valuer and checked that all the land and buildings were considered in the valuation;
- evaluated the appropriateness of the methodology used to value the respective properties by comparing with the methods used in general industry practices;
TO THE SHAREHOLDERS OF LANKA TILES PLC

INTEGRATED ANNUAL REPORT 2017/18 85
The Company:
Key audit matter How our audit addressed the Key audit matterThe valuation of land and buildings is an area that involves significant judgments and assumptions over market prices of land and buildings adjusting for differences in key attributes such as extent of land and buildings, site improvements and access to public roads.
- in assessing the valuer’s market prices and related assumptions used in the valuation, we compared them to price ranges at which adjacent land and buildings were actually transacted taking into account other factors such as extent of land and buildings, access to main roads, physical state of land and buildings, architectural design of the buildings etc.; and
- comparing the market prices of lands in the valuation report to publicly available independent property market information for similar lands in the area.
Based on our work, the judgements and assumptions used by the independent valuer in determining the value of land and buildings as at 31 March 2018 appropriately reflect the market rates and conditions of the said land and buildings.
Existence of finished goods held by consignees(Refer note 11 in the financial statements)
Finished goods held at the Company’s distribution network channel (consignment agents) amounted to LKR 299,287,551 which represents 36% of total value of finished goods of the Company as at 31 March 2018.
The existence of finished goods held at the Company’s distribution channel is a key audit matter because of the significance of the amount of finished goods held at consignees and the complexity involved in determining the finished good quantities on hand as at the year end date due to the distribution centres located within all provinces across Sri Lanka.
Our audit approach mainly included; test of detail which covered the following.
We selected a sample of distributor locations for attending finished goods counts based on the financial significance and risk. For locations attended, we performed the following procedures at each site:
- selected a sample of inventory items and agreed the quantities that we counted to the quantities recorded;
- observed a sample of management’s inventory count procedures to assess compliance with the Group policy; and
- made enquiries regarding obsolete inventory items and inspected the condition of items counted.
Further, we performed third party confirmation procedures of finished goods in the custody of all the distributors whilst maintaining control over the confirmation process.
There were no significant exceptions noted from these procedures that indicated non-existent finished goods at consignees’ locations.
Key audit matter How our audit addressed the Key audit matterValuation of the investment property(Refer note 6 in the financial statements)
The investment property of the Group is solely comprised of a land situated in Divulupitiya area and carries the value of LKR 223,800,000 as at 31 March 2018. The Group has leased out its land under cancellable operating lease arrangements to its affiliated company – LWL Development (Private) Limited and the property is classified as the investment property and accounted at fair value.
Our audit approach mainly included; test of details that covered the following.
We obtained evidence relating to the external valuer’s competence, independence from management and integrity. We also obtained the external valuation reports and performed the following tests:
- verified the completeness of the information provided to the independent valuer;
- evaluated the appropriateness of the methodology used to value the respective property by comparing with the methods used in general industry practices;
The Group:

86 LANKA TILES PLC
Other information
Management is responsible for the other information. The other information comprises the information included in the Annual Report but does not include the financial statements and our auditor’s report thereon.
Our opinion on the financial statements does not cover the other information and we do not and will not express any form of assurance conclusion thereon.
In connection with our audit of the financial statements, our responsibility is to read the other information identified above and, in doing so, consider whether the other information is materially inconsistent with the financial statements or our knowledge obtained in the audit, or otherwise appears to be materially misstated.
If, based on the work we have performed on the other information that we obtained prior to the date of this auditor’s report, we conclude that there is a material misstatement of this other information, we are required to report that fact. We have nothing to report in this regard.
Responsibilities of management and those charged with governance for the financial statements
Management is responsible for the preparation of financial statements that give a true and fair view in accordance with Sri Lanka Accounting Standards and for such internal control as management determines is necessary to enable the preparation of financial statements that are free from material misstatement, whether due to fraud or error.
In preparing the separate/ consolidated financial statements, management is responsible for assessing the Company’s/ Group’s ability to continue as a going concern, disclosing, as applicable, matters related to going concern and using the going concern basis of accounting unless management either intends to liquidate the Company/ Group or to cease operations, or has no realistic alternative but to do so.
Those charged with governance are responsible for overseeing the Company’s and the Group’s financial reporting process.
Auditor’s responsibilities for the audit of the financial statements
Our objectives are to obtain reasonable assurance about whether the financial statements as a whole are free from material misstatement, whether due to fraud or error, and to issue an auditor’s report that includes our opinion. Reasonable assurance is a high level of assurance, but is not a guarantee that an audit conducted in accordance with SLAuSs will always detect a material misstatement when it exists. Misstatements can arise from fraud or error and are considered material if, individually or in the aggregate, they could reasonably be expected to influence the economic decisions of users taken on the basis of these financial statements.
As part of an audit in accordance with SLAuSs, we exercise professional judgment and maintain professional skepticism throughout the audit. We also:
∫ Identify and assess the risks of material misstatement of the financial statements, whether due to fraud or error, design and perform audit procedures responsive to those risks, and obtain audit evidence that is sufficient and appropriate to
INDEPENDENT AUDITOR’S REPORT
Key audit matter How our audit addressed the Key audit matterThe subsidiary engaged an independent valuer to measure the value of its investment property and the resulting valuation indicated no movement in the fair value of the property compared to last financial year.
The valuation of land is an area that involves significant judgments and assumptions over market prices of land adjusting for differences in key attributes such as extent of land, site improvements and access to public roads.
- in assessing the valuer’s market prices and related assumptions used in the valuation, we compared them to price ranges at which adjacent lands were actually transacted taking into account other factors such as extent of land, access to main roads, physical state of lands etc.; and
- comparing the market prices of lands in the valuation report to publicly available independent property market information for similar lands in the area.
Based on our work, the judgements and assumptions used by the independent valuer in determining the value of investment property as at 31 March 2018 appropriately reflect the market rates and conditions of the said land.
TO THE SHAREHOLDERS OF LANKA TILES PLCREPORT ON THE AUDIT OF THE FINANCIAL STATEMENTS (CONTINUED)

INTEGRATED ANNUAL REPORT 2017/18 87
provide a basis for our opinion. The risk of not detecting a material misstatement resulting from fraud is higher than for one resulting from error, as fraud may involve collusion, forgery, intentional omissions, misrepresentations, or the override of internal control.
∫ Obtain an understanding of internal control relevant to the audit in order to design audit procedures that are appropriate in the circumstances, but not for the purpose of expressing an opinion on the effectiveness of the Company’s and the Group’s internal control.
∫ Evaluate the appropriateness of accounting policies used and the reasonableness of accounting estimates and related disclosures made by management.
∫ Conclude on the appropriateness of management’s use of the going concern basis of accounting and, based on the audit evidence obtained, whether a material uncertainty exists related to events or conditions that may cast significant doubt on the Company’s/ Group’s ability to continue as a going concern. If we conclude that a material uncertainty exists, we are required to draw attention in our auditor’s report to the related disclosures in the separate/ consolidated financial statements or, if such disclosures are inadequate, to modify our opinion. Our conclusions are based on the audit evidence obtained up to the date of our
auditor’s report. However, future events or conditions may cause the Company/ Group to cease to continue as a going concern.
∫ Evaluate the overall presentation, structure and content of the financial statements, including the disclosures, and whether the financial statements represent the underlying transactions and events in a manner that achieves fair presentation.
∫ Obtain sufficient appropriate audit evidence regarding the financial information of the entities or business activities within the Group to express an opinion on the consolidated financial statements. We are responsible for the direction, supervision and performance of the group audit. We remain solely responsible for our audit opinion.
We communicate with those charged with governance regarding, among other matters, the planned scope and timing of the audit and significant audit findings, including any significant deficiencies in internal control that we identify during our audit.
We also provide those charged with governance with a statement that we have complied with ethical requirements in accordance with the Code of Ethics regarding independence, and to communicate with them all relationships and other matters that may reasonably be thought to bear on our independence,
and where applicable, related safeguards.
From the matters communicated with those charged with governance, we determine those matters that were of most significance in the audit of the financial statements of the current period and are therefore the key audit matters. We describe these matters in our auditor’s report unless law or regulation precludes public disclosure about the matter or when, in extremely rare circumstances, we determine that a matter should not be communicated in our report because the adverse consequences of doing so would reasonably be expected to outweigh the public interest benefits of such communication.
Report on other legal and regulatory requirements
As required by section 163 (2) of the Companies Act, No. 07 of 2007, we have obtained all the information and explanations that were required for the audit and, as far as appears from our examination, proper accounting records have been kept by the Company.
CHARTERED ACCOUNTANTSCA Sri Lanka membership number 1581COLOMBO25 May 2018


Interim Report – 1st Quarter 28 July 2017
Interim Report – 2nd Quarter 30 October 2017
Interim Report – 3rd Quarter 05 February 2017
Interim Report – 4th Quarter 23 May 2018
Annual Report 2017/18 25 May 2018
Financial STATEMENTSFinancial Calendar

90 LANKA TILES PLC
CONSOLIDATED STATEMENT OF FINANCIAL POSITION
Group Company 31 March 31 March
Notes2018
Rs. ‘0002017
Rs. ‘0002018
Rs. ‘0002017
Rs. ‘000
ASSETSNon-current assetsProperty, plant and equipment 5 3,855,576 3,608,790 3,855,576 3,608,790Investment Properties 6 223,800 223,800 - -Investment in subsidiaries 7 - - 6,242 -Investment in associate 8 933,633 881,052 933,633 881,052Loans given to related companies 12 10,898 20,422 10,898 20,422
5,023,907 4,734,064 4,806,349 4,510,264
Current assetsInventories 11 1,945,726 1,434,412 1,945,726 1,434,412Trade and other receivables 12 1,341,661 1,013,508 1,514,996 1,187,787Cash and cash equivalents 13 444,998 1,227,119 433,975 1,227,119
3,732,385 3,675,039 3,894,697 3,849,318Total assets 8,756,292 8,409,103 8,701,046 8,359,582
EQUITYCapital and reservesEquity attributable to equity holders of the parentStated capital 18 900,968 900,968 900,968 900,968Amalgamation reserve 460,151 460,151 460,151 460,151Revaluation reserve 730,515 838,856 730,515 838,856Exchange translation reserve (132) - - -Retained earnings 4,828,272 4,443,653 4,778,698 4,394,551Shareholders’ funds 6,919,774 6,643,628 6,870,332 6,594,526
Non controlling interest 5,373 - - -Total equity 6,925,147 6,643,628 6,870,332 6,594,526
LIABILITIESNon-current liabilities Borrowings 15 7,374 56,224 7,374 56,224 Deferred income tax liabilities 16 634,246 443,787 634,246 443,787 Retirement benefit obligations 17 166,370 124,394 166,370 124,394
807,990 624,405 807,990 624,405
Current liabilitiesTrade and other payables 14 782,195 583,791 781,972 583,540 Current income tax liabilities 46,932 68,726 46,724 68,558 Borrowings 15 194,028 488,553 194,028 488,553
1,023,155 1,141,070 1,022,724 1,140,651 Total liabilities 1,831,145 1,765,475 1,830,714 1,765,056 Total equity and liabilities 8,756,292 8,409,103 8,701,046 8,359,582
The notes on pages 94 to 128 form an integral part of these financial statements.I certify that these financial statements have been prepared in compliance with the requirements of the Companies Act No. 07 of 2007.
B T T RocheGeneral Manager (Finance)
The Board of Directors is responsible for the preparation and presentation of these financial statements. Approved and signed for and on behalf of the Board of Directors.
Dhammika Perera J A P M JayasekeraChairman Managing Director25th May 2018
A P M J k

INTEGRATED ANNUAL REPORT 2017/18 91
CONSOLIDATED STATEMENT OF COMPREHENSIVE INCOME
Group Company
31 March 31 March
Notes2018
Rs. ‘0002017
Rs. ‘0002018
Rs. ‘0002017
Rs. ‘000
Revenue 19 6,126,307 5,176,372 6,126,307 5,176,372Cost of sales (3,747,180) (2,860,369) (3,747,180) (2,860,369)Gross profit 2,379,127 2,316,003 2,379,127 2,316,003Distribution costs (895,347) (706,517) (895,347) (706,517)Administrative expenses (405,817) (381,726) (404,447) (381,312)Other income 20 20,866 26,754 19,447 26,154Other gains / (losses) - net 21 4 45,739 4 (6,758)
Operating profit 1,098,833 1,300,253 1,098,784 1,247,570Finance income 110,344 150,720 110,344 150,720Finance costs (21,768) (31,749) (21,768) (31,749)Finance income - net 24 88,576 118,971 88,576 118,971Share of net profit of associate accounted for using
the equity method 8 165,383 185,284 165,383 185,284Profit before income tax 1,352,792 1,604,508 1,352,743 1,551,825Income tax expense 25 (348,795) (359,170) (348,721) (359,002)Profit for the year 1,003,997 1,245,338 1,004,022 1,192,823
Other comprehensive income :Items that will not be reclassified to profit or lossGains on revaluation of land and buildings 5 83,293 - 83,293 -"Deferred tax component - gains on revaluation of land and buildings"
16 (191,634) - (191,634) -
Remeasurements of retirement benefit obligations - gratuity 17 (28,361) 18,898 (28,361) 18,898
Deferred tax component - remeasurement of retirement benefit Obligations - gratuity 16 7,941 (5,183) 7,941 (5,183)
Exchange loss arising on translation of foreign operations (259) - - -
Items that may be subsequently reclassified to profit or loss
"Share of other comprehensive income of associate investment accounted for using the equity method” 8 (68,951) 1,404 (68,951) 1,404
Total other comprehensive income for the year, net of tax (197,971) 15,119 (197,712) 15,119
Total comprehensive income for the year 806,026 1,260,457 806,310 1,207,942
Profit attributable to :Equity holders of the parent 1,004,494 1,245,338 1,004,022 1,192,823Non controlling interest (497) - - -Profit for the year 1,003,997 1,245,338 1,004,022 1,192,823
Total comprehensive income attributable to :Equity holders of the parent 806,650 1,260,457 806,310 1,207,942Non controlling interest (624) - - -Total comprehensive income for the year 806,026 1,260,457 806,310 1,207,942Basic earnings per share (Rs.) 26 18.93 23.47 18.93 22.48
The notes on pages 94 to 128 form an integral part of these financial statements.
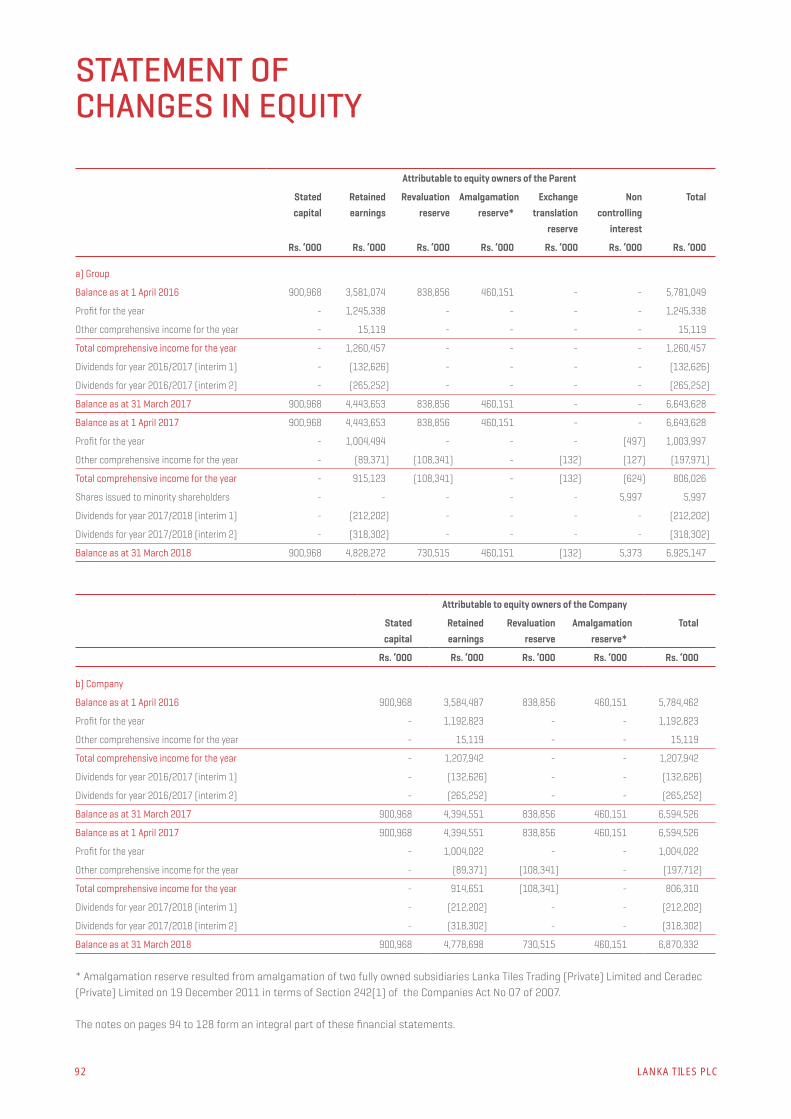
92 LANKA TILES PLC
STATEMENT OF CHANGES IN EQUITY
Attributable to equity owners of the Parent
Stated capital
Retainedearnings
Revaluationreserve
Amalgamationreserve*
Exchangetranslation
reserve
Non controlling
interest
Total
Rs. ‘000 Rs. ‘000 Rs. ‘000 Rs. ‘000 Rs. ‘000 Rs. ‘000 Rs. ‘000
a) Group
Balance as at 1 April 2016 900,968 3,581,074 838,856 460,151 - - 5,781,049
Profit for the year - 1,245,338 - - - - 1,245,338
Other comprehensive income for the year - 15,119 - - - - 15,119
Total comprehensive income for the year - 1,260,457 - - - - 1,260,457
Dividends for year 2016/2017 (interim 1) - (132,626) - - - - (132,626)
Dividends for year 2016/2017 (interim 2) - (265,252) - - - - (265,252)
Balance as at 31 March 2017 900,968 4,443,653 838,856 460,151 - - 6,643,628
Balance as at 1 April 2017 900,968 4,443,653 838,856 460,151 - - 6,643,628
Profit for the year - 1,004,494 - - - (497) 1,003,997
Other comprehensive income for the year - (89,371) (108,341) - (132) (127) (197,971)
Total comprehensive income for the year - 915,123 (108,341) - (132) (624) 806,026
Shares issued to minority shareholders - - - - - 5,997 5,997
Dividends for year 2017/2018 (interim 1) - (212,202) - - - - (212,202)
Dividends for year 2017/2018 (interim 2) - (318,302) - - - - (318,302)
Balance as at 31 March 2018 900,968 4,828,272 730,515 460,151 (132) 5,373 6,925,147
Attributable to equity owners of the Company
Stated capital
Retainedearnings
Revaluationreserve
Amalgamationreserve*
Total
Rs. ‘000 Rs. ‘000 Rs. ‘000 Rs. ‘000 Rs. ‘000
b) Company
Balance as at 1 April 2016 900,968 3,584,487 838,856 460,151 5,784,462
Profit for the year - 1,192,823 - - 1,192,823
Other comprehensive income for the year - 15,119 - - 15,119
Total comprehensive income for the year - 1,207,942 - - 1,207,942
Dividends for year 2016/2017 (interim 1) - (132,626) - - (132,626)
Dividends for year 2016/2017 (interim 2) - (265,252) - - (265,252)
Balance as at 31 March 2017 900,968 4,394,551 838,856 460,151 6,594,526
Balance as at 1 April 2017 900,968 4,394,551 838,856 460,151 6,594,526
Profit for the year - 1,004,022 - - 1,004,022
Other comprehensive income for the year - (89,371) (108,341) - (197,712)
Total comprehensive income for the year - 914,651 (108,341) - 806,310
Dividends for year 2017/2018 (interim 1) - (212,202) - - (212,202)
Dividends for year 2017/2018 (interim 2) - (318,302) - - (318,302)
Balance as at 31 March 2018 900,968 4,778,698 730,515 460,151 6,870,332
* Amalgamation reserve resulted from amalgamation of two fully owned subsidiaries Lanka Tiles Trading (Private) Limited and Ceradec (Private) Limited on 19 December 2011 in terms of Section 242(1) of the Companies Act No 07 of 2007.
The notes on pages 94 to 128 form an integral part of these financial statements.

INTEGRATED ANNUAL REPORT 2017/18 93
CONSOLIDATED STATEMENT OF CASH FLOWS
Group Company
31 March 31 March
Notes2018
Rs. ‘0002017
Rs. ‘0002018
Rs. ‘0002017
Rs. ‘000
Cash flows from operating activities
Cash generated from operations 28 703,781 768,858 704,739 768,858
Interest paid (21,768) (30,789) (21,768) (30,789)
Interest received 110,344 150,720 110,344 150,720
Gratuity paid 17 (12,385) (7,235) (12,385) (7,235)
Tax paid (363,788) (582,042) (363,789) (582,042)
Net cash generated from operating activities 416,184 299,512 417,141 299,512
Cash flows from investing activities
Purchase of property, plant and equipment 5 (64,465) (369,454) (64,465) (369,454)
Proceeds from sale of property, plant and equipment 2,449 531 2,449 531
Expenditure incurred on capital work in progress 5 (337,709) (43,202) (337,709) (43,202)
Investment in subsidiary 7 - - (6,242) -
Dividend received 43,851 31,179 43,851 31,179
Repayments by (loans to) related companies 25,709 30,834 25,709 30,834
Net cash used in investing activities (330,165) (350,112) (336,407) (350,112)
Cash flows from financing activities
Dividends paid (530,504) (397,878) (530,504) (397,878)
Proceeds on issue of shares to minority shareholders 5,997 - - -
Proceeds from borrowings 100,000 - 100,000 -
Repayments of borrowings (161,416) (231,317) (161,416) (231,317)
Net cash used in financing activities (585,923) (629,195) (591,920) (629,195)
Net (decrease) / increase in cash and cash equivalents (499,904) (679,795) (511,186) (679,795)
Movement in cash and cash equivalents
Cash and cash equivalents at beginning of year 849,982 1,529,777 849,982 1,529,777
Net (decrease) / increase in cash and cash equivalents (499,904) (679,795) (511,186) (679,795)
Net foreign exchange difference arising on translation of foreign operations (259) - - -
Cash and cash equivalents at end of year 13 349,819 849,982 338,796 849,982
The notes on pages 94 to 128 form an integral part of these financial statements.

94 LANKA TILES PLC
1 GENERAL INFORMATION
General
Lanka Tiles PLC (“the Company”) is a public limited liability company incorporated and domiciled in Sri Lanka and listed on the Colombo Stock Exchange. The registered office and the principal place of business of the Company is located at No. 215, Nawala Road, Narahenpita, Colombo 05.
Beyond Paradise Collection (Private) Limited, a wholly owned subsidiary of the Company is a limited liability company domiciled in Sri Lanka and incorporated on 12 May 2011 under the Companies Act No. 7 of 2007. The registered office of the Company is located at No. 215, Nawala Road, Narahenpita, Colombo 05.
Lankatiles Private Limited, 51% owned subsidiary of the Company is a limited liability company domiciled in India and incorporated on 02 May 2017 under the Companies Act No 18 of 2013 of India. The registered office of the Company is located at No.196 A1, Anekal Taluk, Bommasandra Industrial Area, Attibele, Bengaluru, India.
LTL Development (Private) Limited, a wholly owned subsidiary of the Company is a limited liability company domiciled in Sri Lanka and incorporated on 18 February 2018 under the Companies Act No. 7 of 2007. The registered office of the Company is located at No. 215, Nawala Road, Narahenpita, Colombo 05.
Principal activities and nature of operations
Lanka Tiles PLC manufactures and sells glazed ceramic and porcelain floor tiles through a network of dealers and distributors. The Company has its manufacturing plant located at St James Estate, Jaltara, Ranala.
Beyond Paradise Collection (Private) Limited is the property holding and developing company.
Lankatiles Private Limited is distributing tiles in India.
LTL Development (Private) Limited is the property holding and developing company.
Parent company and ultimate parent company
The Company’s immediate parent entity is Lanka Walltiles PLC. The Company’s ultimate parent undertaking and controlling party at the financial reporting date was Vallibel One PLC, which is incorporated and domiciled in Sri Lanka.
Date of authorization for issue
The financial statements were authorized for issue in accordance with a resolution of the board of directors on 25 May 2018.
2 SUMMARY OF SIGNIFICANT ACCOUNTING POLICIES
The principal accounting policies adopted in the preparation of the financial statements are set out below: These policies have been consistently applied to all years presented, unless otherwise stated.
2.1 Basis of preparation
The consolidated financial statements have been prepared under the historical cost convention as modified by the revaluation of land and buildings and financial assets and liabilities which are measured at fair value through profit or loss.
The financial statements of the Company and the Group are prepared in accordance with Sri Lanka Accounting Standards issued by the Institute of Chartered Accountants of Sri Lanka, which comprise Sri Lanka Financial Reporting Standards (SLFRSs), Sri Lanka Accounting Standards (LKASs), relevant interpretations of the Standing Interpretations Committee (SIC) and International Financial Reporting Interpretations Committee (IFRIC).
The preparation of financial statements in conformity with Sri Lanka Accounting Standards requires the use of certain critical accounting estimates. It also requires management to exercise its judgment in the process of applying the Company’s and the Group’s accounting
policies. The areas involving a higher degree of judgment or complexity, or areas where assumptions and estimates are significant to the Company’s and the Group’s financial statements are disclosed in Note 3.
2.2 Changes in accounting policies and disclosures
a) New accounting standards, amendments and interpretations adopted during the financial year.
The following amendment of standards and interpretations apply for the financial reporting periods commencing on or after 1 April 2017,
(i) Amendments to LKAS 12 ‘Income Taxes - Recognition of Deferred Tax Assets for Unrealised Losses’ (effective from 1 January 2017) clarify the requirements for recognising deferred tax assets on unrealised losses arising from deductible temporary difference on asset carried at fair value. In addition, in evaluating whether an entity will have sufficient taxable profits in future periods against which deductible temporary differences can be utilised, the amendments require an entity to compare the deductible temporary differences with future taxable profits that excludes tax deductions resulting from the reversal of those temporary differences. The amendments to the standard are effective for accounting periods beginning on or after 1 January 2017.
(ii) Amendments to LKAS 7 ‘Statement of Cash Flows – Disclosure Initiative’ introduce an additional disclosure on changes in liabilities arising from financing activities. This includes changes arising from cash flows (eg drawdowns and repayments of borrowings) and non-cash changes such as acquisitions, disposals, accretion of interest and unrealised exchange differences. The amendments to the standard are effective for accounting periods beginning on or after 1 January 2017.
NOTES TO THE FINANCIAL STATEMENTS

INTEGRATED ANNUAL REPORT 2017/18 95
(iii) Amendments to SLFRS 12 ‘Disclosure of interests in other entities’ regarding clarification of the scope of the standard. The amendments clarify that the disclosure requirements of SLFRS 12 apply to interests in entities that are classified as held for sale, except for the summarised financial information. The amendment is effective for the annual periods beginning on or after 1 January 2018
There are no other standards, IFRIC interpretations or amendments which are effective for the financial year beginning on 1 April 2017 that would be expected to have a material impact on the Company.
b) The following new standards and amendments to standards had been issued but were not mandatory for financial reporting period.
(i) SLFRS 9 ‘Financial Instruments’, replaces the multiple classification and measurement models in LKAS 39 Financial instruments: Recognition and measurement with a single model that has initially only two classification categories: amortised cost and fair value. Classification of debt assets will be driven by the entity’s business model for managing the financial assets and the contractual cash flow characteristics of the financial assets. A debt instrument is measured at amortised cost if: a) the objective of the business model is to hold the financial asset for the collection of the contractual cash flows, and b) the contractual cash flows under the instrument solely represent payments of principal and interest.
All other debt and equity instruments, including investments in complex debt instruments and equity investments, must be recognised at fair value. All fair value movements on financial assets are taken through the statement of profit or loss, except for equity investments that are not held for trading, which may be recorded in the statement of profit or loss
or in reserves (without subsequent recycling to profit or loss). For financial liabilities that are measured under the fair value option entities will need to recognise the part of the fair value change that is due to changes in the their own credit risk in other comprehensive income rather than profit or loss.
The new hedge accounting rules align hedge accounting more closely with common risk management practices. As a general rule, it will be easier to apply hedge accounting going forward. The new standard also introduces expanded disclosure requirements and changes in presentation.
“Further changes introduced to the classification and measurement rules and also introduced a new impairment model to SLFRS 9. The changes introduce:
∫ a third measurement category (FVOCI) for certain financial assets that are debt instruments.
∫ a new expected credit loss (ECL) model which involves a three-stage approach whereby financial assets move through the three stages as their credit quality changes. The stage dictates how an entity measures impairment losses and applies the effective interest rate method. A simplified approach is permitted for financial assets that do not have a significant financing component (eg trade receivables). On initial recognition, entities will record a day-1 loss equal to the 12 month ECL (or lifetime ECL for trade receivables), unless the assets are considered credit impaired.
The standard is effective for the annual periods beginning on or after 1 January 2018.
Amendments to SLFRS 9 Financial Instruments - Prepayment Features with Negative Compensation
This amendment confirm that when a financial liability measured at amortised cost is modified without this resulting in de-recognition, a gain or loss should be recognised immediately in profit or loss. The gain or loss is calculated as the difference between the original contractual cash flows and the modified cash flows discounted at the original effective interest rate. This means that the difference cannot be spread over the remaining life of the instrument which may be a change in practice from LKAS 39.
The amendment is effective for annual periods beginning on or after 1 January 2019.
(ii) SLFRS 15 ‘Revenue from contracts with customers’ replaces LKAS 18 ‘Revenue’ and LKAS 11 ‘Construction contracts’ and related interpretations. The core principle in SLFRS 15 is that an entity recognises revenue to depict the transfer of promised goods or services to the customer in an amount that reflects the consideration to which the entity expects to be entitled in exchange for those goods or services.
Revenue is recognised when a customer obtains control of goods or services, i.e. when the customer has the ability to direct the use of and obtain the benefits from the goods or services. A new five-step process is applied before revenue can be recognised:
∫ Identify contracts with customers
∫ Identify the separate performance obligations
∫ Determine the transaction price of the contract;

96 LANKA TILES PLC
∫ Allocate the transaction price to each of the separate performance obligations; and
∫ Recognise the revenue as each performance obligation is satisfied.
Key provisions of the new standard are as follows:
∫ Any bundled goods or services that are distinct must be separately recognised, and any discounts or rebates on the contract price must generally be allocated to the separate elements.
∫ If the consideration varies (such as for incentives, rebates, performance fees, royalties, success of an outcome etc), minimum amounts of revenue must be recognised if they are not at significant risk of reversal.
∫ The point at which revenue is able to be recognised may shift: some revenue which is currently recognised at a point in time at the end of a contract may have to be recognised over the contract term and vice versa.
∫ There are new specific rules on licenses, warranties, non-refundable upfront fees, and consignment arrangements, to name a few.
∫ As with any new standard, there are also increased disclosures.”
The standard is effective for accounting periods beginning on or after 1 January 2018.
(iii) SLFRS 16, ‘Leases’ SLFRS 16 will affect primarily the accounting by lessees and will result in the recognition of almost all leases on balance sheet. The standard removes the current distinction between operating and financing leases and requires recognition of an asset (the right to use the leased item) and
a financial liability to pay rentals for virtually all lease contracts. An optional exemption exists for short-term and low-value leases.
The income statement will also be affected because the total expense is typically higher in the earlier years of a lease and lower in later years. Additionally, operating expense will be replaced with interest and depreciation, so key metrics like EBITDA will change.
Operating cash flows will be higher as cash payments for the principal portion of the lease liability are classified within financing activities. Only the part of the payments that reflects interest can continue to be presented as operating cash flows.
The accounting by lessors will not significantly change. Some differences may arise as a result of the new guidance on the definition of a lease. Under SLFRS 16, a contract is, or contains, a lease if the contract conveys the right to control the use of an identified asset for a period of time in exchange for consideration.
The standard is effective for annual periods beginning on or after 1 January 2019 with earlier application permitted if SLFRS 15, ‘Revenue from Contracts with Customers’, is also applied.
(iv) Amendments to LKAS 28, ‘Investments in associates and joint ventures’ - clarifies that the election by venture capital organisations, mutual funds, unit trusts and similar entities to measure investments in associates or joint ventures at fair value through profit or loss should be made separately for each associate or joint venture at initial recognition. The amendment is effective for the annual periods beginning on or after 1 January 2018.
The impact of SLFRS 9 ‘Financial instruments’, SLFRS 15 ‘Revenue
from contracts with customers’ and SLFRS 16 ‘leases’ are being assessed. Apart from SLFRS 9, 15 and 16 the adoptions of amendments to published to have material impact to the financial statements.
There are no other standards or IFRIC interpretations that are not yet effective that would be expected to have a material impact to the Company.
2.3 Comparative information
Previous period figures and notes have been changed and reclassified wherever necessary to conform to the current year’s presentation.
2.4 Consolidation
(a) Subsidiaries
Subsidiaries are all entities (including structured entities) over which the Group has control. The Group controls an entity when the Group is exposed to, or has rights to, variable returns from its involvement with the entity and has the ability to affect those returns through its power to direct the activities of the entity. The existence and effect of potential voting rights that are currently exercisable or convertible are considered only if the rights are substantive when assessing whether the Group controls another entity. Subsidiaries are fully consolidated from the date on which control is transferred to the Group. They are deconsolidated from the date that control ceases.
The Group applies the acquisition method to account for business combinations. The consideration transferred for the acquisition of a subsidiary is the fair values of the assets transferred, the liabilities incurred to the former owners of the acquiree and the equity interests issued by the Group. The consideration transferred includes the fair value of any asset or liability resulting from a contingent consideration arrangement. Identifiable assets
NOTES TO THE FINANCIAL STATEMENTS

INTEGRATED ANNUAL REPORT 2017/18 97
acquired and liabilities and contingent liabilities assumed in a business combination are measured initially at their fair values at the acquisition date. The Group recognises any Non-Controlling Interest (“NCI”) in the acquiree on an acquisition-by-acquisition basis, either at fair value or at the NCI’s proportionate share of the recognised amounts of acquiree’s identifiable net assets.
Acquisition related costs are expensed as incurred.
When initial accounting for a business combination is incomplete by the end of the reporting period in which the combination occurs, the Group reports in the financial statements provisional amounts for the items for which the accounting is incomplete. During the measurement period, the Group retrospectively adjusts the provisional amounts recognised at the acquisition date to reflect new information obtained about facts and circumstances that existed as of the acquisition date and, if known, would have affected the measurement of the amounts recognised as of that date. During the measurement period, the Group also recognises additional assets or liabilities if new information is obtained about facts and circumstances that existed as of the acquisition date and, if known, would have resulted in the recognition of those assets and liabilities as of that date. The measurement period ends as soon as the Group receives the information it was seeking about facts and circumstances that existed as of the acquisition date or learns that more information is not obtainable. The measurement period shall not exceed one year from the acquisition date.
If the business combination is achieved in stages, the acquisition date carrying value of the acquirer’s previously held equity interest in the acquiree is remeasured to fair value at the acquisition date. Any gain or loss
arising from such remeasurement is recognised in the profit or loss.
Any contingent consideration to be transferred by the Group is recognised at fair value at the acquisition date. Subsequent changes to the fair value of the contingent consideration that is deemed to be an asset or a liability is recognised in accordance with LKAS 39, in the profit or loss. Contingent consideration that is classified as equity is not remeasured, and its subsequent settlement is accounted for within equity.
The excess of the consideration transferred by the Group, the amount of any NCI in the acquiree and the acquisition date fair value of any previous equity interest in the acquiree over the fair value of the identifiable net assets acquired is recognised as goodwill. If the total of consideration transferred, NCI recognised and previously held interest measured are less than the fair value of the net assets of the subsidiary acquired in the case of a bargain purchase, the difference is recognised directly in the profit or loss.
Inter-company transactions, balances, income and expenses on transactions between the Group’s entities are eliminated. Profits and losses resulting from inter-company transactions that are recognised in assets are also eliminated. When necessary, amounts reported by subsidiaries have been adjusted to conform with the Group’s accounting policies. The financial periods of the subsidiary undertakings are same as that of the Company.
When the Group ceases to have control, any retained interest in the entity is remeasured to its fair value at the date when control is lost, with the change in carrying amount recognised in consolidated profit or loss. The fair value is the initial carrying amount
for the purposes of subsequently accounting for the retained interest as an associate, joint venture or financial asset. In addition, any amounts previously recognised as other comprehensive income in respect of that entity are accounted for as if the Group had directly disposed of the related assets or liabilities. This may mean that amounts previously recognised in other comprehensive income are reclassified to the profit or loss.
Transactions with NCIs that do not result in loss of control are accounted for as equity transactions; i.e.as transactions with the owners in their capacity as owners. The difference between fair value of any consideration paid and the relevant share acquired of the carrying value of net assets of the subsidiary is recorded in equity. Gain or loss on disposals to NCIs is also recorded in equity.
(b) Associates
Associates are all entities over which the Group has significant influence but not control or joint control, generally accompanying a shareholding of between 20% and 50% of the voting rights. Significant influence is power to participate in the financial and operating policy decisions of the associates but not power to exercise control or jointly control over those policies.
Investments in associates are accounted for in the separate financial statements using the equity method of accounting as allowed by amended LKAS 27 - equity method in separate financial statements which is effective for annual periods beginning on or after 01 January 2016.Under the equity method of accounting, the investment is initially recognised at cost, and the carrying amount is increased or decreased to recognise the investor’s share of the post-acquisition results and

98 LANKA TILES PLC
changes of the associate’s reserves in the consolidated statement of comprehensive income after the date of acquisition and net off with any accumulated impairment loss, if any.
When the Group’s share of losses in an associate equals or exceeds its interest in the associate, including any other unsecured receivables, the Group does not recognise further losses, unless it has incurred obligations (legal or constructive) or made payments on behalf of the associate. If the associate subsequently reports profits, the Group resumes recognising its share of those profits only after its share of the profits equals the share of losses not recognised.
Profits and losses resulting from upstream and downstream transactions between the Group and its associates are recognised in the consolidated financial statements only to the extent of unrelated investors’ interests in the associates. Unrealised losses are eliminated unless the transaction provides evidence of an impairment of the asset transferred. When necessary, amounts reported by associates have been adjusted to conform with the Group’s accounting policies. Equity accounting is discontinued when the Group ceases to have significant influence over the associates.
If the ownership interest in an associate is reduced but significant influence is retained, only a proportionate share of the amounts previously recognised in the statement of comprehensive income as other comprehensive income is reclassified to profit or loss where appropriate. The cost of acquiring an additional stake in an associate is added to the carrying amount of associate and equity accounted. Goodwill arising on the purchase of additional stake is computed using fair value information at the date the additional interest is purchased.
The previously held interest is not remeasured.
The Group determines at each reporting date whether there is any objective evidence that the investment in the associate is impaired. If this is the case, the Group calculates the amount of impairment as the difference between the recoverable amount of the associate and its carrying value and recognises the difference in the consolidated profit or loss.
2.5 Foreign currency translation
(a) Functional and presentation currency
Items included in the financial statements of each of the Group’s entities are measured using the currency of the primary economic environment in which the entity operates (‘the functional currency’). The financial statements are presented in ‘Sri Lanka Rupees’ (LKR), which is the Company’s and the Group’s functional and presentation currency since the entities use LKR in majority of their transactions and reflect the economic substance of the underlying events and circumstances relevant to the Group.
(b) Transactions and balances
Foreign currency transactions are translated into the functional currency using the exchange rates prevailing at the dates of the transactions or valuation where items are remeasured.
Foreign exchange gains and losses resulting from the settlement of such transactions and from the translation at year end exchange rates of monetary assets and liabilities denominated in foreign currencies are recognised in the profit or loss. Foreign exchange gains and losses that relate to borrowings and cash and cash equivalents are presented in the profit or loss within ‘Finance income or cost.
Non-monetary items that are measured at fair value in a foreign currency are translated using the exchange rates at the date when the fair value was determined. Translation differences on assets and liabilities carried at fair value are reported as part of the fair value gain or loss. For example, translation differences on non-monetary assets and liabilities such as equities held at fair value through profit or loss are recognised in profit or loss as part of the fair value gain or loss and translation differences on non-monetary assets such as equities classified as available-for-sale financial assets are recognised in other comprehensive income.
2.6 Current and deferred income tax
The tax expense for the period comprises current and deferred income tax. Tax is recognised in the profit or loss, except to the extent that it relates to items recognised in other comprehensive income or directly in equity. In this case, the tax is also recognised in other comprehensive income or directly in equity respectively. The current income tax charge is calculated on the basis of the tax laws enacted or substantively enacted at the end of the reporting period. Management periodically evaluates positions taken in tax returns with respect to situations in which applicable tax regulations are subject to interpretation. Management establishes provisions where appropriate on the basis of amounts expected to be paid to the tax authorities.
Deferred income tax is recognised using the liability method, on temporary differences arising between the tax bases of assets and liabilities and their carrying amounts in the financial statements. However, deferred income tax liabilities are not recognised if they arise from the initial recognition of goodwill. Deferred income tax is also not accounted for if it arises from the initial recognition of an asset or liability in a transaction other than a business combination that at the time of the transaction affects neither accounting nor taxable profit or
NOTES TO THE FINANCIAL STATEMENTS

INTEGRATED ANNUAL REPORT 2017/18 99
loss. Deferred income tax is determined using tax rates (and laws) that have been enacted or substantially enacted by the end of the reporting period and are expected to apply when the related deferred income tax asset is realised or the deferred income tax liability is settled.
Deferred income tax is provided on temporary differences arising on investments in subsidiaries and associates, except where the timing of the reversal of the temporary difference is controlled by the Group and it is probable that the temporary difference will not reverse in the foreseeable future.
Deferred income tax assets are recognised only to the extent that it is probable that future taxable profit will be available against which the temporary differences can be utilised.
Deferred income tax assets and liabilities are offset when there is a legally enforceable right to offset current tax assets against current tax liabilities and when the deferred income taxes assets and liabilities relate to income taxes levied by the same taxation authority on either the same taxable entity or different taxable entities where there is an intention to settle the balances on a net basis.
2.7 Borrowing costs
General and specific borrowing costs directly attributable to the acquisition, construction or production of qualifying assets, which are assets that necessarily take a substantial period of time to get ready for their intended use or sale, are added to the cost of those assets, until such time as the assets are substantially ready for their intended use or sale.
Investment income earned on the temporary investment of specific borrowings pending their expenditure on qualifying assets is deducted from the borrowing costs eligible for capitalisation.
All other borrowing costs are recognised in the statement of comprehensive income in the period in which they are incurred.
2.8 Inventories
Inventories are valued at the lower of cost and net realisable value, after making due allowances for obsolete and slow moving items. Net realisable value is the price at which inventories can be sold in the ordinary course of business less the estimated cost of completion and the estimated cost necessary to make the sale. Cost of the trading stock is determined using the first-in, first-out (FIFO) method. Cost of the finished goods and work in progress is determined using the weighted average cost method. The cost of finished goods and work in progress comprises raw materials, direct labour, other direct costs and related production overheads (based on normal operating capacity). It excludes borrowing costs.
2.9 Financial assets
2.9.1 Classification
The Company and the Group classify its financial assets in the following categories: at fair value through profit or loss, loans and receivables, held to maturity, and available for sale. The classification depends on the purpose for which the financial assets were acquired. Management determines the classification of its financial assets at initial recognition. At the balance sheet date and during the period the Company and the Group only held financial assets classified as loans and receivables.
Loans and receivables
Loans and receivables are non-derivative financial assets with fixed or determinable payments that are not quoted in an active market. They are included in current assets, except for maturities greater than 12 months after the date of the statement of financial position.
2.9.2 Recognition and measurement
Loans and receivables are initially recognised at fair vale plus transaction costs. Financial assets are de-recognised when rights to receive the cash flows from the investments have expired or have been transferred. Loans and receivables
are subsequently carried at amortised cost using the effective interest rate method.
2.9.3 Offsetting financial instruments
Financial assets and liabilities are offset and the net amount presented in the statement of financial position when, and only when, the Company and the Group have a legally enforceable right to offset the recognised amounts and there is an intention to settle on a net basis or to realise the asset and settle the liability simultaneously.
2.9.4 Impairment of financial assets - Assets carried at amortised cost
The Company and the Group assess at the end of each reporting period whether there is objective evidence that a financial asset or group of financial assets is impaired. A financial asset or a group of financial assets is impaired and impairment losses are incurred only if there is objective evidence of impairment as a result of one or more events that occurred after the initial recognition of the asset (a ‘loss event’) and that loss event (or events) has an impact on the estimated future cash flows of the financial asset or group of financial assets that can be reliably estimated.
Evidence of impairment may include indications that the debtors or a group of debtors is experiencing significant financial difficulty, default or delinquency in interest or principal payments, the probability that they will enter bankruptcy or other financial reorganisation, and where observable data indicate that there is a measurable decrease in the estimated future cash flows, such as changes in arrears or economic conditions that correlate with defaults.
For loans and receivables category, the amount of the loss is measured as the difference between the asset’s carrying amount and the present value of estimated future cash flows (excluding future credit losses that have not been incurred) discounted at the financial asset’s original effective interest rate. The

100 LANKA TILES PLC
carrying amount of the asset is reduced and the amount of the loss is recognised in the statement of comprehensive income.
If, in a subsequent period, the amount of the impairment loss decreases and the decrease can be related objectively to an event occurring after the impairment was recognised, the reversal of the previously recognised impairment loss is recognised in the statement of comprehensive income.
When an asset is uncollectible, it is written off against the related accumulated impairment losses account. Such assets are written off after all the necessary procedures have been completed and the amount of the loss has been determined.
2.10 Cash and cash equivalents
In the statement of cash flows, cash and cash equivalents includes cash in hand, deposits held at call with banks, other short-term highly liquid investments with original maturities of three (3) months or less and bank overdrafts.
In the Consolidated balance sheet, bank overdrafts are shown within borrowings in current liabilities.
2.11 Trade receivables
Trade receivables are amounts due from customers for merchandise sold or services performed in the ordinary course of business. If collection is expected in one year or less (or in the normal operating cycle of the business if longer), they are classified as current assets. If not, they are presented as non-current assets.
Trade receivables are recognised initially at fair value and subsequently measured at amortised cost using the effective interest method, less accumulated impairment losses.
The carrying amount of the asset is reduced through the use of an allowance account, and the amount of the loss is recognised in the statement of comprehensive income within ‘selling and distribution costs’. When a trade
receivable is uncollectible, it is written off against the allowance account for trade receivables. Subsequent recoveries of amounts previously written off are credited against ‘selling and distribution expenses’ in the statement of comprehensive income.
2.12 Trade payables
Trade payables are obligations to pay for goods or services that have been acquired in the ordinary course of business from suppliers. Trade payable are classified as current liabilities if payment is due within one year or less (or in the normal operating cycle of the business if longer). If not, they are presented as non-current liabilities.
Trade payables are recognised initially at fair value and subsequently measured at amortised cost using the effective interest method.
2.13 Borrowings
Borrowings are recognised initially at fair value, net of transaction costs incurred. Borrowings are subsequently carried at amortised cost; any difference between the proceeds (net of transaction costs) and the redemption value is recognised in the income statement over the period of the borrowings using the effective interest method.
Fees paid on the establishment of loan facilities are recognised as transaction costs of the loan to the extent that it is probable that some or all of the facility will be drawn down. In this case, the fee is deferred until the draw-down occurs. To the extent there is no evidence that it is probable that some or all of the facility will be drawn down, the fee is capitalised as a pre-payment for liquidity services and amortised over the period of the facility to which it relates.
Borrowings are classified as current liabilities unless the Company and the Group have an unconditional right to defer settlement of the liability for at least twelve months after the end of the reporting period.
2.14 Property, plant and equipment
Property, plant and equipment other than land and buildings is stated at historical cost less accumulated depreciation. Historical cost includes expenditure that is directly attributable to the acquisition of the items and also includes the initial estimate of the costs of dismantling and removing the item and restoring the site on which it is located, the obligation for which an entity incurs either when the item is acquired or as a consequence of having used the item during a particular period for purposes other than to produce inventories during that period.
Land and buildings are shown at fair value based on a valuation performed by an external independent professional valuer. Where an item of property, plant and equipment is revalued, the entire class of such asset is revalued. Revaluations are made with sufficient regularity (every three or five years) to ensure that their carrying value do not differ materially from their fair value at the reporting date.
Increases in the carrying amount arising on revaluation of land and building is credited to other comprehensive income and shown as revaluation reserve in shareholders’ equity. Decreases that offset previous increases of the same asset are charged in other comprehensive income and debited against revaluation reserve directly in equity; all other decreases are charged to the statement of comprehensive income.
Subsequent costs are included in the asset’s carrying amount or recognised as a separate asset, as appropriate, only when it is probable that future economic benefits associated with the item will flow to the Company and the Group and the cost of the item can be measured reliably. The carrying amount of the replaced part is derecognised. All other repairs and maintenance are charged to the statement of comprehensive income during the financial period in which they are incurred.
NOTES TO THE FINANCIAL STATEMENTS
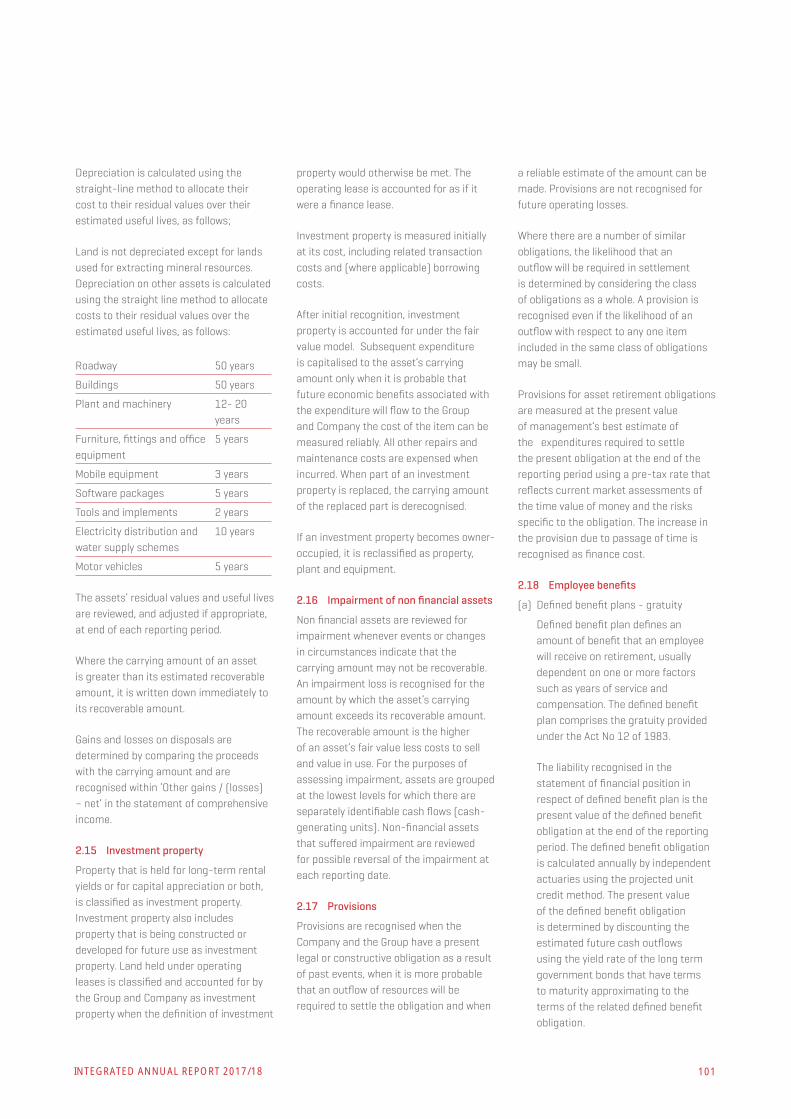
INTEGRATED ANNUAL REPORT 2017/18 101
Depreciation is calculated using the straight-line method to allocate their cost to their residual values over their estimated useful lives, as follows;
Land is not depreciated except for lands used for extracting mineral resources. Depreciation on other assets is calculated using the straight line method to allocate costs to their residual values over the estimated useful lives, as follows:
Roadway 50 years
Buildings 50 years
Plant and machinery 12- 20 years
Furniture, fittings and office equipment
5 years
Mobile equipment 3 years
Software packages 5 years
Tools and implements 2 years
Electricity distribution and water supply schemes
10 years
Motor vehicles 5 years
The assets’ residual values and useful lives are reviewed, and adjusted if appropriate, at end of each reporting period.
Where the carrying amount of an asset is greater than its estimated recoverable amount, it is written down immediately to its recoverable amount.
Gains and losses on disposals are determined by comparing the proceeds with the carrying amount and are recognised within ‘Other gains / (losses) – net’ in the statement of comprehensive income.
2.15 Investment property
Property that is held for long-term rental yields or for capital appreciation or both, is classified as investment property. Investment property also includes property that is being constructed or developed for future use as investment property. Land held under operating leases is classified and accounted for by the Group and Company as investment property when the definition of investment
property would otherwise be met. The operating lease is accounted for as if it were a finance lease.
Investment property is measured initially at its cost, including related transaction costs and (where applicable) borrowing costs.
After initial recognition, investment property is accounted for under the fair value model. Subsequent expenditure is capitalised to the asset’s carrying amount only when it is probable that future economic benefits associated with the expenditure will flow to the Group and Company the cost of the item can be measured reliably. All other repairs and maintenance costs are expensed when incurred. When part of an investment property is replaced, the carrying amount of the replaced part is derecognised.
If an investment property becomes owner-occupied, it is reclassified as property, plant and equipment.
2.16 Impairment of non financial assets
Non financial assets are reviewed for impairment whenever events or changes in circumstances indicate that the carrying amount may not be recoverable. An impairment loss is recognised for the amount by which the asset’s carrying amount exceeds its recoverable amount. The recoverable amount is the higher of an asset’s fair value less costs to sell and value in use. For the purposes of assessing impairment, assets are grouped at the lowest levels for which there are separately identifiable cash flows (cash-generating units). Non-financial assets that suffered impairment are reviewed for possible reversal of the impairment at each reporting date.
2.17 Provisions
Provisions are recognised when the Company and the Group have a present legal or constructive obligation as a result of past events, when it is more probable that an outflow of resources will be required to settle the obligation and when
a reliable estimate of the amount can be made. Provisions are not recognised for future operating losses.
Where there are a number of similar obligations, the likelihood that an outflow will be required in settlement is determined by considering the class of obligations as a whole. A provision is recognised even if the likelihood of an outflow with respect to any one item included in the same class of obligations may be small.
Provisions for asset retirement obligations are measured at the present value of management’s best estimate of the expenditures required to settle the present obligation at the end of the reporting period using a pre-tax rate that reflects current market assessments of the time value of money and the risks specific to the obligation. The increase in the provision due to passage of time is recognised as finance cost.
2.18 Employee benefits
(a) Defined benefit plans - gratuity
Defined benefit plan defines an amount of benefit that an employee will receive on retirement, usually dependent on one or more factors such as years of service and compensation. The defined benefit plan comprises the gratuity provided under the Act No 12 of 1983.
The liability recognised in the statement of financial position in respect of defined benefit plan is the present value of the defined benefit obligation at the end of the reporting period. The defined benefit obligation is calculated annually by independent actuaries using the projected unit credit method. The present value of the defined benefit obligation is determined by discounting the estimated future cash outflows using the yield rate of the long term government bonds that have terms to maturity approximating to the terms of the related defined benefit obligation.

102 LANKA TILES PLC
The net interest cost is calculated by applying the discount rate to the net balance of the defined benefit obligation and included in employee benefit expense in the profit or loss.
Remeasurement gains and losses arising from experience adjustments and changes in actuarial assumptions are charged or credited to equity in other comprehensive income in the period in which they arise and will not be reclassified to the profit or loss. They are included in retained earnings in the statement of changes in equity and in the balance sheet.
Past service costs are recognised immediately in the profit or loss.
The assumptions based on which the results of the actuarial valuation was determined, are included in note 17 to the financial statements.
(b) Defined contribution plans
For defined contribution plans, such as the Employees’ Provident Fund and Employees’ Trust Fund, the Company and the Group contributes 12% and 3% respectively, of the employees’ basic or consolidated wage or salary. The Company and the Group have no further payment obligations once the contributions have been paid. The Company and the employees are members of these defined contribution plans.
(c) Short term employee benefits
Wages, salaries, bonuses and non-monetary benefits are accrued in the period in which the associated services are rendered by employees of the Company and the Group.
2.19 Stated capital
Ordinary shares are classified as equity. Incremental costs directly attributable to the issue of new ordinary shares or options are shown in equity as a deduction, net of tax, from the proceeds.
Where any group company purchases the Company’s equity share capital (treasury shares), the consideration paid, including any directly attributable incremental costs (net of income taxes) is deducted from equity attributable to the Company’s equity holders until the shares are cancelled or reissued. Where such ordinary shares are subsequently reissued, any consideration received, net of any directly attributable incremental transaction costs and the related income tax effects, is included in equity attributable to the Company’s equity holders.
2.20 Dividend distribution
Dividend distribution to the Company’s shareholders is recognised as a liability in the Company’s financial statements in the period in which the dividends are approved by the Company’s shareholders.
2.21 Revenue recognition
Revenue comprises the fair value of the consideration received or receivable for the sale of goods and services rendered in the ordinary course of the Company’s and the Group’s activities. Revenue is stated net of all applicable taxes and levies, returns, rebates and discounts.
The Company and the Group recognise revenue when the amount of revenue can be reliably measured, it is probable that future economic benefits will flow to the entity and specific criteria have been met for each of the Company’s and the Group’s activities as described below. The amount of revenue is not considered to be reliably measurable until all contingencies relating to the sale have been resolved. The Company and the Group base their estimates on historical results, taking into consideration the type of customer, the type of transaction and the specifics of each arrangement.
(a) Sale of goods
Revenue from sale of goods is recognised when the significant risks and rewards of ownership of the goods have passed to buyer with the Company and the Group retaining
neither continuing managerial involvement to the degree usually associated with ownership nor effective control over the goods sold.
(b) Interest income
Interest income is recognised using the effective interest method. When a loan and receivable is impaired, the Company and the Group reduce the carrying amount to its recoverable amount, being the estimated future cash flow discounted at the original effective interest rate of the instrument, and continues unwinding the discount as interest income. Interest income on impaired loan and receivables is recognised using the original effective interest rate. Interest income on bank balances and bank deposits is recognised on accrual basis.
(c) Rental income
Rental income is recognised on an accrual basis.
2.22 Leases
Leases in which a significant portion of the risks and rewards of ownership are retained by the lessor are classified as operating leases. Payments made under operating leases (net of any incentives received from the lessor) are charged to the statement of comprehensive income on a straight-line basis over the period of the lease.
The Company and the Group lease certain property, plant and equipment. Leases of property, plant and equipment where the Company and the Group have substantially all the risks and rewards of ownership are classified as finance leases. Finance leases are capitalised at the lease’s commencement at the lower of the fair value of the leased property and the present value of the minimum lease payments.
Each lease payment is allocated between the liability and finance charges. The corresponding rental obligations, net of finance charges, are included in other
NOTES TO THE FINANCIAL STATEMENTS

INTEGRATED ANNUAL REPORT 2017/18 103
long-term payables. The interest element of the finance cost is charged to the statement of comprehensive income over the lease period so as to produce a constant periodic rate of interest on the remaining balance of the liability for each period. The property, plant and equipment acquired under finance leases is depreciated over the shorter of the useful life of the asset and the lease term.
2.23 Segment reporting
The Company and the Group do not identify any segments for reporting purposes.
3 CRITICAL ACCOUNTING ESTIMATES AND JUDGMENTS
3.1 Critical accounting estimates and assumptions
The Company and the Group make estimates and assumptions concerning the future. The resulting accounting estimates will, by definition, rarely equal the related actual results. The estimates and assumptions that have a significant risk of causing a material adjustment to the carrying amounts of assets and liabilities within the next financial year are outlined below:
(a) Defined benefit plans - gratuity
The present value of the defined benefit plan depends on a number of factors that are determined on an actuarial basis using a number of assumptions. The assumptions used in determining the net cost (income) for defined benefit plan include the discount rate, future salary increases etc. Any changes in these assumptions will impact the carrying amount of defined benefit plan.
(b) Estimated useful lives of PPE
Management reviews annually the useful lives and carrying values of assets. This require estimates and judgment.
The useful lives of the assets are estimated by the Company and the Group as detailed in Note 2.14.
(c) Impairment of non financial assets
The Company and the Group annually test the indicators to ascertain whether non-current assets have suffered any impairment. These calculations require the use of estimates.
3.2 Critical judgments in applying the Company’s accounting policies
In the process of applying the accounting policies, management has made the following judgments, apart from those involving estimations, which has the most significant effect on the amounts recognised in the financial statements.
(a) Deferred tax asset
Deferred income tax assets are recognised to the extent that it is probable that future taxable profit will be available against which temporary differences can be utilised. This involves judgment regarding future financial performance of a particular entity in which the deferred income tax asset has been recognised.
The Company and the Group review all receivables at the date of statement of financial position to assess whether an allowance should be recorded in the statement of comprehensive income. Management uses judgment in estimating such amounts in the light of the duration of outstanding and any other factors management are aware of that indicates uncertainty in recovery.
4 FINANCIAL RISK MANAGEMENT
The Company’s and the Group’s activities are exposed to variety of financial risks: market risk (including currency risk, fair value interest rate risk, cash flow interest rate risk and price risk), credit risk and liquidity risk.
The Company’s and the Group’s overall financial risk management programme focus on the unpredictability of financial markets and seek to minimise potential adverse effects on the financial performance of the Company and the
Group. Financial risk management is carried out through risk reviews, internal control systems, insurance programmes and adherence to the Company’s and the Group’s financial risk management policies. The board of directors regularly reviews these risks and approves the risk management policies, which covers the management of these risks.
Market risk consists of:
(i) Foreign exchange risk–risk that the value of recognised assets and liabilities, future commercial transactions will fluctuate due to changes in foreign exchange rates.
(ii) Fair value interest rate risk–risk that the value of a financial instrument will fluctuate due to changes in market interest rates.
(iii) Cash flow interest rate risk–risk that future cash flows associated with a financial instrument will fluctuate.
(iv) Price risk-risk that the value of a financial instrument will fluctuate as a result of changes in market prices, whether those changes are caused by factors specific to the individual instrument or its issuer or factors affecting all instrument traded in the market.
Credit risk–risk that one party to a financial instrument will fail to discharge an obligation and cause the other party to incur a financial loss (refer note 9).
Liquidity risk (Funding risk)–risk that an entity will encounter difficulty in raising funds to meet commitments associated with operational and financial obligations.
Foreign exchange risk
The Company and the Group operate internationally and are exposed to foreign exchange risk arising from various currency exposures, primarily with respect to the USD and EURO. Foreign exchange risk arises when future commercial

104 LANKA TILES PLC
Less than 3 months
Between 3 months and 1
year
Between year 1 and year 2
Between year 2 and year 5
Over 5 years
Rs. ‘000 Rs. ‘000 Rs. ‘000 Rs. ‘000 Rs. ‘000
At 31 March 2018
Borrowings 163,016 31,012 7,374 - -
Trade and other payables 269,433 - - - -
At 31 March 2017
Borrowings 435,041 53,512 48,850 7,374 -
Trade and other payables 206,068 - - - -
transactions or recognised assets or liabilities are denominated in a currency that is not the entity’s functional currency.
As at end of the reporting period, if the functional currency (LKR) had weakened/strengthened by 5% against the US dollar with all other variables held constant, post-tax profit for the year would have been Rs. 9,525,005 (2017: Rs. 9,312,009 ) lower/higher, mainly as a result of foreign exchange gains/losses on translation of US dollar-denominated loans granted, trade receivables and trade creditors.
As at end of the reporting period, if the functional currency (LKR) had weakened/strengthened by 5% against the EURO with all other variables held constant, post-tax profit for the year would have been Rs. 6,042,938 (2017: Rs. 5,917,854) lower/higher, mainly as a result of foreign exchange gains/losses on translation of EURO-denominated trade creditors.
Cash flow and fair value interest rate risk
The Company’s and the Group’s interest rate risk arise from long-term borrowings issued at variable rates. The Company and the Group manage their interest rate risk by actively monitoring the yield curve trend and interest rate movement with reference to AWPLR and LIBOR for the various financial instruments.
The Company’s and the Group’s borrowings comprise borrowings from financial institutions. The Company’s and the Group’s interest rate risk objective is to manage an acceptable level of rate
fluctuation on the interest expense. In order to achieve this objective, the Company and the Group target floating borrowings based on assessment of its existing exposure and desirable interest rate profile. The Company and the Group analyse their interest rate exposure on a dynamic basis.
At 31 March 2018, if interest rates on foreign currency-denominated borrowings had been 10 basis points higher/lower with all other variables held constant, pre-tax profit for the year would have been Rs. 182,885 (2017 - Rs. 212,750) lower/higher, mainly as a result of higher/lower interest expense on floating rate borrowings. At 31 March 2018, if interest rates on Sri Lankan rupee-denominated borrowings at that date had been 0.5% higher/lower with all other variables held constant, pre-tax profit for the year would have been Rs. 1,051,815 (2017 - Rs. 2,481,897) lower/higher, mainly as a result of higher/lower interest expense on floating rate borrowings.
Credit risk
Credit risk arises from cash and cash equivalents, deposits with banks, as well as credit exposures to customers, including outstanding receivables. Trade receivables are mainly secured with bank guarantees given by customers in favour of the Company and the Group. Individual credit limits are set based on the amount of the bank guarantee. The utilisation of credit limits is regularly monitored.
The Company and the Group place their cash and cash equivalents with a number
of creditworthy financial institutions. The Company’s and the Group’s policy limits the concentration of financial exposure to any single financial institution. The maximum credit risk exposure of the financial assets of the Company and the Group is approximately their carrying amounts as at balance sheet date, except for trade receivables which are secured by bank guarantees.
Liquidity risk
Prudent liquidity risk management implies maintaining sufficient liquid funds to meet its financial obligations.
In the management of liquidity risk, the Company and the Group monitor and maintain a level of cash and cash equivalents deemed adequate by management to finance the Company’s and the Group’s operations and to mitigate the effects of fluctuations in cash flows. Due to the dynamic nature of the underlying business, the Company and the Group aim at maintaining flexibility in funding by keeping both committed and uncommitted credit lines available. The Company and the Group use both short term bank facilities (overdrafts) together with cash in hands and in banks in managing the liquidity position.
The table below analyses the Company’s and the Group’s non-derivative financial liabilities into relevant maturity groupings based on the remaining period at the balance sheet date to the contractual maturity date. The amounts disclosed in the table are the contractual undiscounted cash flows.
NOTES TO THE FINANCIAL STATEMENTS

INTEGRATED ANNUAL REPORT 2017/18 105
Capital management risk
The primary objective of the Company’s and the Group’s capital management is to ensure that the Group maintain a strong credit rating and healthy capital ratios in order to support its business and maximise shareholder value.
The Company and the Group manage their capital structure and makes adjustments to it in light of changes in economic conditions. To maintain or adjust the capital structure, the Company and the Group may or may not make dividend payments to shareholders, return capital to shareholders or issue new shares or other instruments.
Consistent with others in the industry, the Company and the Group monitor capital on the basis of the gearing ratio. This ratio is calculated as net debt divided by total capital. Net debt is calculated as total borrowings (including ‘current and non-current borrowings’ as shown in the balance sheet) less cash and cash equivalents. Total capital is calculated as ‘equity’ as shown in the consolidated balance sheet plus net debt.
The gearing ratio as at 31 March is as follows:Group/ Company
Group Company
2018Rs. ‘000
2017Rs. ‘000
2018Rs. ‘000
2017Rs. ‘000
Borrowings (net of cash) - - - -
Total equity 6,919,774 6,643,628 6,870,332 6,594,526
Total capital 6,919,774 6,643,628 6,870,332 6,594,526
Gearing ratio - - - -
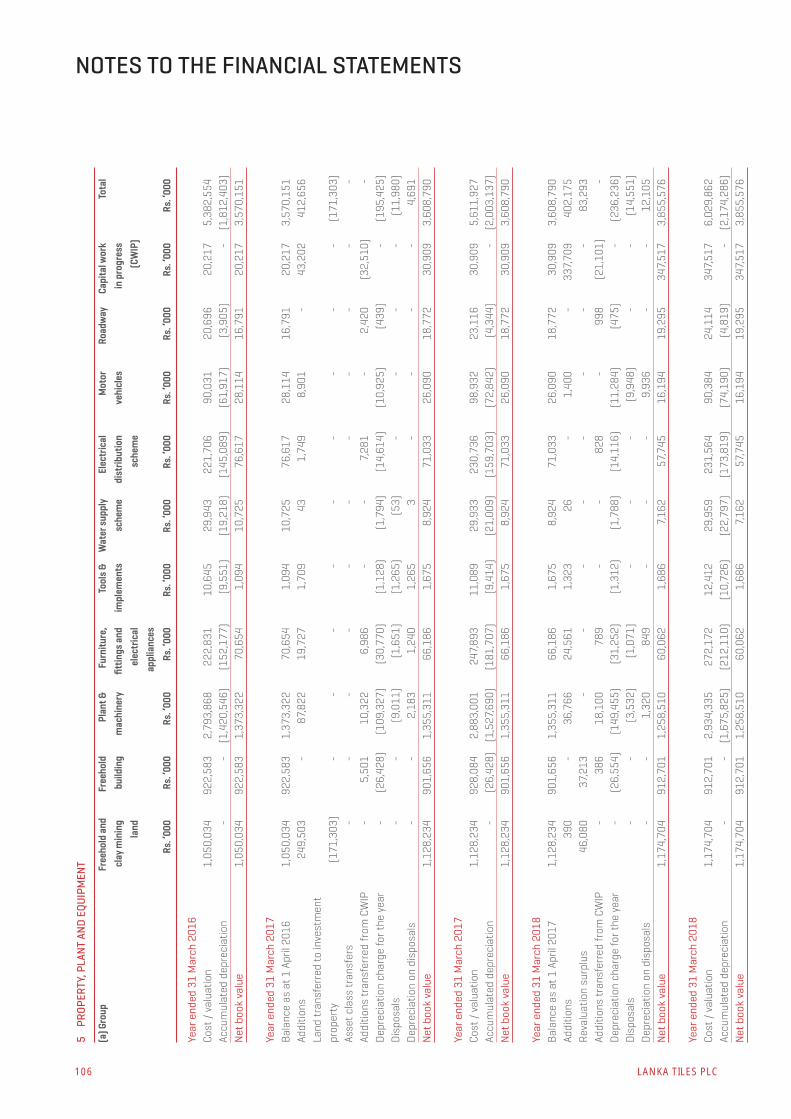
106 LANKA TILES PLC
5
PROP
ERTY
, PLA
NT
AND
EQU
IPM
ENT
(a) G
roup
Fre
ehol
d an
d cl
ay m
inin
g la
nd
Free
hold
bu
ildin
g Pl
ant &
m
achi
nery
Furn
iture
, fi
ttin
gs a
nd
elec
tric
al
appl
ianc
es
Tool
s & im
plem
ents
W
ater
supp
lysc
hem
e E
lect
rical
di
strib
utio
n sc
hem
e
Mot
or
vehi
cles
Roa
dway
Capi
tal w
ork
in p
rogr
ess
(CW
IP)
Tota
l
Rs. ‘
000
Rs. ‘
000
Rs. ‘
000
Rs. ‘
000
Rs. ‘
000
Rs. ‘
000
Rs. ‘
000
Rs. ‘
000
Rs. ‘
000
Rs. ‘
000
Rs. ‘
000
Year
end
ed 3
1 M
arch
201
6Co
st /
val
uatio
n1,
050,
034
922,
583
2,79
3,86
822
2,83
110
,645
29,9
4322
1,70
690
,031
20,6
9620
,217
5,38
2,55
4Ac
cum
ulat
ed d
epre
ciat
ion
--
(1,4
20,5
46)
(152
,177
)(9
,551
)(1
9,21
8)(1
45,0
89)
(61,
917)
(3,9
05)
-(1
,812
,403
)N
et b
ook
valu
e1,
050,
034
922,
583
1,37
3,32
270
,654
1,09
410
,725
76,6
1728
,114
16,7
9120
,217
3,57
0,15
1
Year
end
ed 3
1 M
arch
201
7Ba
lanc
e as
at 1
Apr
il 20
161,
050,
034
922,
583
1,37
3,32
270
,654
1,09
410
,725
76,6
1728
,114
16,7
9120
,217
3,57
0,15
1Ad
ditio
ns
249,
503
-87
,822
19,7
271,
709
431,
749
8,90
1-
43,2
0241
2,65
6La
nd tr
ansf
erre
d to
inve
stm
ent
prop
erty
(171
,303
)-
--
--
--
--
(171
,303
)As
set c
lass
tran
sfer
s-
--
--
--
--
--
Addi
tions
tran
sfer
red
from
CW
IP-
5,50
110
,322
6,98
6-
-7,
281
-2,
420
(32,
510)
-D
epre
ciat
ion
char
ge fo
r the
yea
r-
(26,
428)
(109
,327
)(3
0,77
0)(1
,128
)(1
,794
)(1
4,61
4)(1
0,92
5)(4
39)
-(1
95,4
25)
Dis
posa
ls-
-(9
,011
)(1
,651
)(1
,265
)(5
3)-
--
-(1
1,98
0)D
epre
ciat
ion
on d
ispo
sals
--
2,18
31,
240
1,26
53
--
--
4,69
1N
et b
ook
valu
e1,
128,
234
901,
656
1,35
5,31
166
,186
1,67
58,
924
71,0
3326
,090
18,7
7230
,909
3,60
8,79
0
Year
end
ed 3
1 M
arch
201
7Co
st /
val
uatio
n1,
128,
234
928,
084
2,88
3,00
124
7,89
311
,089
29,9
3323
0,73
698
,932
23,1
1630
,909
5,61
1,92
7Ac
cum
ulat
ed d
epre
ciat
ion
-(2
6,42
8)(1
,527
,690
)(1
81,7
07)
(9,4
14)
(21,
009)
(159
,703
)(7
2,84
2)(4
,344
)-
(2,0
03,1
37)
Net
boo
k va
lue
1,12
8,23
490
1,65
61,
355,
311
66,1
861,
675
8,92
471
,033
26,0
9018
,772
30,9
093,
608,
790
Year
end
ed 3
1 M
arch
201
8Ba
lanc
e as
at 1
Apr
il 20
171,
128,
234
901,
656
1,35
5,31
166
,186
1,67
58,
924
71,0
3326
,090
18,7
7230
,909
3,60
8,79
0Ad
ditio
ns
390
-36
,766
24,5
611,
323
26-
1,40
0-
337,
709
402,
175
Reva
luat
ion
surp
lus
46,0
8037
,213
--
--
--
--
83,2
93Ad
ditio
ns tr
ansf
erre
d fr
om C
WIP
-38
618
,100
789
--
828
-99
8(2
1,10
1)-
Dep
reci
atio
n ch
arge
for t
he y
ear
-(2
6,55
4)(1
49,4
55)
(31,
252)
(1,3
12)
(1,7
88)
(14,
116)
(11,
284)
(475
)-
(236
,236
)D
ispo
sals
--
(3,5
32)
(1,0
71)
--
-(9
,948
)-
-(1
4,55
1)D
epre
ciat
ion
on d
ispo
sals
--
1,32
084
9-
--
9,93
6-
-12
,105
Net
boo
k va
lue
1,17
4,70
491
2,70
11,
258,
510
60,0
621,
686
7,16
257
,745
16,1
9419
,295
347,
517
3,85
5,57
6
Year
end
ed 3
1 M
arch
201
8Co
st /
val
uatio
n1,
174,
704
912,
701
2,93
4,33
527
2,17
212
,412
29,9
5923
1,56
490
,384
24,1
1434
7,51
76,
029,
862
Accu
mul
ated
dep
reci
atio
n-
-(1
,675
,825
)(2
12,1
10)
(10,
726)
(22,
797)
(173
,819
)(7
4,19
0)(4
,819
)-
(2,1
74,2
86)
Net
boo
k va
lue
1,17
4,70
491
2,70
11,
258,
510
60,0
621,
686
7,16
257
,745
16,1
9419
,295
347,
517
3,85
5,57
6
NOTES TO THE FINANCIAL STATEMENTS

INTEGRATED ANNUAL REPORT 2017/18 107
(b) C
ompa
ny F
reeh
old
and
clay
min
ing
land
Free
hold
bu
ildin
g Pl
ant &
m
achi
nery
Furn
iture
, fi
ttin
gs a
nd
elec
tric
al
appl
ianc
es
Tool
s & im
plem
ents
W
ater
supp
lysc
hem
e E
lect
rical
di
strib
utio
n sc
hem
e
Mot
or
vehi
cles
Roa
dway
Capi
tal w
ork
in p
rogr
ess
(CW
IP)
Tota
l
Rs. ‘
000
Rs. ‘
000
Rs. ‘
000
Rs. ‘
000
Rs. ‘
000
Rs. ‘
000
Rs. ‘
000
Rs. ‘
000
Rs. ‘
000
Rs. ‘
000
Rs. ‘
000
Year
end
ed 3
1 M
arch
201
6Co
st /
val
uatio
n87
8,73
192
2,58
32,
793,
868
222,
831
10,6
4529
,943
221,
706
90,0
3120
,696
20,2
175,
211,
251
Accu
mul
ated
dep
reci
atio
n-
-(1
,420
,546
)(1
52,1
77)
(9,5
51)
(19,
218)
(145
,089
)(6
1,91
7)(3
,905
)-
(1,8
12,4
03)
Net
boo
k va
lue
878,
731
922,
583
1,37
3,32
270
,654
1,09
410
,725
76,6
1728
,114
16,7
9120
,217
3,39
8,84
8
Year
end
ed 3
1 M
arch
201
7Ba
lanc
e as
at 1
Apr
il 20
1687
8,73
192
2,58
31,
373,
322
70,6
541,
094
10,7
2576
,617
28,1
1416
,791
20,2
173,
398,
848
Addi
tions
24
9,50
3-
87,8
2219
,727
1,70
943
1,74
98,
901
-43
,202
412,
656
Land
tran
sfer
red
to in
vest
men
t pr
oper
ty-
--
--
--
--
--
Asse
t cla
ss tr
ansf
ers
--
--
--
--
--
-Ad
ditio
ns tr
ansf
erre
d fr
om C
WIP
-5,
501
10,3
226,
986
--
7,28
1-
2,42
0(3
2,51
0)-
Dep
reci
atio
n ch
arge
for t
he y
ear
-(2
6,42
8)(1
09,3
27)
(30,
770)
(1,1
28)
(1,7
94)
(14,
614)
(10,
925)
(439
)-
(195
,425
)D
ispo
sals
--
(9,0
11)
(1,6
51)
(1,2
65)
(53)
--
--
(11,
980)
Dep
reci
atio
n on
dis
posa
ls-
-2,
183
1,24
01,
265
3-
--
-4,
691
Net
boo
k va
lue
1,12
8,23
490
1,65
61,
355,
311
66,1
861,
675
8,92
471
,033
26,0
9018
,772
30,9
093,
608,
790
Year
end
ed 3
1 M
arch
201
7Co
st /
val
uatio
n1,
128,
234
928,
084
2,88
3,00
124
7,89
311
,089
29,9
3323
0,73
698
,932
23,1
1630
,909
5,61
1,92
7Ac
cum
ulat
ed d
epre
ciat
ion
-(2
6,42
8)(1
,527
,690
)(1
81,7
07)
(9,4
14)
(21,
009)
(159
,703
)(7
2,84
2)(4
,344
)-
(2,0
03,1
37)
Net
boo
k va
lue
1,12
8,23
490
1,65
61,
355,
311
66,1
861,
675
8,92
471
,033
26,0
9018
,772
30,9
093,
608,
790
Year
end
ed 3
1 M
arch
201
8Ba
lanc
e as
at 1
Apr
il 20
171,
128,
234
901,
656
1,35
5,31
166
,186
1,67
58,
924
71,0
3326
,090
18,7
7230
,909
3,60
8,79
0Ad
ditio
ns
390
-36
,766
24,5
611,
323
26-
1,40
0-
337,
709
402,
175
Reva
luat
ion
surp
lus
46,0
8037
,213
--
--
--
--
83,2
93Ad
ditio
ns tr
ansf
erre
d fr
om C
WIP
-38
618
,100
789
--
828
-99
8(2
1,10
1)-
Dep
reci
atio
n ch
arge
for t
he y
ear
-(2
6,55
4)(1
49,4
55)
(31,
252)
(1,3
12)
(1,7
88)
(14,
116)
(11,
284)
(475
)-
(236
,236
)D
ispo
sals
--
(3,5
32)
(1,0
71)
--
-(9
,948
)-
-(1
4,55
1)D
epre
ciat
ion
on d
ispo
sals
--
1,32
084
9-
--
9,93
6-
-12
,105
Net
boo
k va
lue
1,17
4,70
491
2,70
11,
258,
510
60,0
621,
686
7,16
257
,745
16,1
9419
,294
347,
517
3,85
5,57
6
Year
end
ed 3
1 M
arch
201
8Co
st /
val
uatio
n1,
174,
704
912,
701
2,93
4,33
527
2,17
212
,412
29,9
5923
1,56
490
,384
24,1
1434
7,51
76,
029,
862
Accu
mul
ated
dep
reci
atio
n-
-(1
,675
,825
)(2
12,1
10)
(10,
726)
(22,
797)
(173
,819
)(7
4,19
0)(4
,819
)-
(2,1
74,2
86)
Net
boo
k va
lue
1,17
4,70
491
2,70
11,
258,
510
60,0
621,
686
7,16
257
,745
16,1
9419
,294
347,
517
3,85
5,57
6

108 LANKA TILES PLC
5 PROPERTY, PLANT AND EQUIPMENT
(a) Property, plant and equipment of the Group / Company include fully depreciated assets in use at 31 March 2018, the cost of which amounted to the Group / Company Rs. 621,328,751 (2017 - Rs. 584,007,960).
(b) The bank borrowings are secured on freehold land, freehold building and plant and machinery. The values of assets secured is given in Note 15 to the financial statements.
(c) Valuation of the Company’s land and buildings was performed by the independent valuer Mr. R. J. Samarakone on 31 March 2018. The revaluation surplus net of applicable deferred income taxes was credited to other comprehensive income and is shown in revaluation reserve in shareholders equity. Different levels of fair valuation methods have been defined as follows:
- Quoted prices (unadjusted) in active market for identical assets or liabilities (Level 1);
- Inputs other than quoted prices with in level 1 that are observable for the asset or liability, either directly (that is, as prices) or indirectly (that is, derived from prices) (Level 2);
- Input for the assets or liability that are not based on observable market data (that is, unobservable inputs) (Level 3).
The fair values of land and buildings have been derived by level 2 valuation method using the sales comparison approach. Sales prices of comparable properties in close proximity were adjusted for differences in key attributes such as property size, site improvements and access to public roads. The most significant input into this valuation approach was market price per perch of land and square feet of buildings.
The land and buildings were stated at the historical cost basis, the amounts would be as follows:
Cost AccumulatedDepreciation
Carry value
Rs. ‘000 Rs. ‘000 Rs. ‘000
Land 1,128,624 - 1,128,624
Buildings 928,470 (52,982) 875,488
2,057,094 (52,982) 2,004,112
6 INVESTMENT PROPERTY
Group Company
2018Rs. ‘000
2017Rs. ‘000
2018Rs. ‘000
2017Rs. ‘000
Opening balance 223,800 - - -
Transfer from property plant and equipment - 171,303 - -
Disposal - - - -
Net fair value gain recognised in profit or loss - 52,497 - -
Closing balance 223,800 223,800 - -
NOTES TO THE FINANCIAL STATEMENTS

INTEGRATED ANNUAL REPORT 2017/18 109
The group has leased out its land under cancellable operating lease arrangements to its affiliated company - LWL Development (Private) Limited. This property has been classified as investment property in accordance with LKAS 40 Investment Property (“LKAS 40”). The Group has initially accounted for the investment property at cost, and subsequently accounted for it under the fair value model.
Amounts recognised in profit or loss in relation to investment properties
Group Company
2018Rs. ‘000
2017Rs. ‘000
2018Rs. ‘000
2017Rs. ‘000
Rental income 1200 600 - -
1,200 600 - -
Details of the valuation of the invesment property (freehold land) carried out by the independent valuer Mr. R. J. Samarakone are as follows:
Total extent of land 48 acre - 3 rood - 17.9 perches
Total valuation for land Rs. 223,800,000
Location Agalagedara Village, Divulapitiya, Gampha
Date of valuation 31 March 2018
Details of entities in which the Company had control as at 31 March 2018 are set out below.
- Quoted prices (unadjusted) in active market for identical assets or liabilities (Level 1);
- Inputs other than quoted prices with in level 1 that are observable for the asset or liability, either directly (that is, as prices) or indirectly (that is, derived from prices) (Level 2);
- Input for the assets or liability that are not based on observable market data (that is, unobservable inputs) (Level 3).
The fair values of Investment Property have been derived by level 2 valuation method using the sales comparison approach. Sales prices of comparable properties in close proximity were adjusted for differences in key attributes such as property size, site improvements and access to public roads. The most significant input into this valuation approach was market price per perch of land.

110 LANKA TILES PLC
7 INVESTMENT IN SUBSIDIARIES
Details of entities in which the company had control as at 31 March 2018 are set out below,
Name of the subsidiaries Number of shares
% Holding 2018 Rs.
2017 Rs.
Beyond Paradise Collection (Private) Limited (a) 1 100 10 10
Lankatiles Private Limited (b) 255,000 51 6,241,727 -
LTL Development (Private) Ltd (c) 1 100 1 -
(a) The Company invested in one share of Beyond Paradise Collection (Private) Limited amounting to Rs.10/-. The principal business of the subsidiary is holding and developing the property of the Company.
(b) The Company invested in two hundred fifity five thousand share of Lankatiles Private Limited amounting to Rs.24.47/- (IND Rs. 10/-). The principal business of the subsidiary is manufacturing the glazed ceramic and porcelain floor tiles.
(c) The Company invested in one share of LTL Developement (Private) Limited amounting to Rs.1/-. The principal business of the subsidiary is holding and developing the property of the Company.
8 INVESTMENT IN ASSOCIATE
Group Company
Number of shares
2018Rs. ‘000
2017Rs. ‘000
2018Rs. ‘000
2017Rs. ‘000
Opening net book amount 881,052 725,543 881,052 725,543
Share of results of associate for the year 96,432 186,688 96,432 186,688
Dividend received (43,851) (31,179) (43,851) (31,179)
At the end of year 13,085,180 933,633 881,052 933,633 881,052
(a) The Company holds 47.8% (2017 - 47.8%) ownership interest in Swisstek (Ceylon) PLC. The principal activities of Swisstek (Ceylon) PLC are manufacturing and selling of Tile Grout and Tile Mortar. Its subsidiary Swisstek Aluminium Limited manufacture and sells aluminium extrusions.
(b) The market value of quoted associate investment as at date of consolidated balance sheet is Rs. 775,951,174 (2017 - Rs. 858,387,808).
(c) The Company’s share of the results of the associate and its summarised financial information are as follows:
As at 31 March 2018Rs. ‘000
2017Rs. ‘000
Assets 5,430,314 3,870,775
Liabilities 3,262,016 1,856,425
For the year ended 31 March
Revenue 4,077,367 3,432,357
Profit for the year 402,753 428,722
Other comprehensive income for the year (144,168) 3,301
% interest held 47.8 47.8
Share of profit 165,383 185,284
Share of other comprehensive income (68,951) 1,404
NOTES TO THE FINANCIAL STATEMENTS

INTEGRATED ANNUAL REPORT 2017/18 111
9 FINANCIAL INSTRUMENTS BY CATEGORY
31 March 2018 Loans and receivables
GroupRs. ‘000
CompanyRs. ‘000
Assets as per the consolidated balance sheet
Loans given to related companies (Note 12) 21,797 21,797
Trade and other receivables (excluding pre-payments) (Note 12) 1,180,228 1,353,576
Cash and cash equivalents (Note 13) 444,998 433,975
Total 1,647,023 1,809,348
31 March 2018 Other financial liabilities at amortised cost
GroupRs. ‘000
CompanyRs. ‘000
Liabilities as per the consolidated balance sheet
Borrowings (excluding finance lease liabilities) (Note 15) 201,402 201,402
Trade and other payables excluding non-financial liabilities (Note 14) 782,195 781,972
Total 983,597 983,374
31 March 2017 Loans and receivables
GroupRs. ‘000
CompanyRs. ‘000
Assets as per the consolidated balance sheet
Loans given to related companies (Note 12) 47,506 47,506
Trade and other receivables (excluding pre-payments) (Note 12) 861,650 1,035,929
Cash and cash equivalents (Note 13) 1,227,119 1,227,119
Total 2,136,275 2,310,554
31 March 2017 Other financial liabilities at amortised cost
GroupRs. ‘000
CompanyRs. ‘000
Liabilities as per the consolidated balance sheet
Borrowings (excluding finance lease liabilities) (Note 15) 544,777 544,777
Trade and other payables excluding non-financial liabilities (Note 14) 583,791 583,540
Total 1,128,568 1,128,317

112 LANKA TILES PLC
10 CREDIT QUALITY OF FINANCIAL ASSETS
The credit quality of financial assets that are neither past due nor impaired can be assessed by reference to external credit ratings (if available) or to extent of collaterals provided by counter parties:
Group Company
2018Rs. ‘000
2017Rs. ‘000
2018Rs. ‘000
2017Rs. ‘000
Trade receivables
Counterparties without external credit ratings
Group 1 204,501 227,004 204,501 227,004
Group 2 56,793 126,748 56,793 126,748
Group 3 249,761 64,645 249,761 64,645
Total trade receivables 511,055 418,397 511,055 418,397
Group Company
2018Rs. ‘000
2017Rs. ‘000
2018Rs. ‘000
2017Rs. ‘000
Cash at bank and short-term bank deposits
AA + 48,839 4,556 46,397 4,556
AA 162,451 34,993 162,451 34,993
A 1,070 - 1,070 -
A + 532 - 532 -
AA - 224,696 1,180,815 216,115 1,180,815
A - - 253 - 253
Counterparties without external credit rating 6,309 5,421 6,309 5,421
Total 443,897 1,226,038 432,874 1,226,038
Group 1 – Customers whose due amounts are secured with bank guarantees.Group 2 – Customers whose due amounts are secured with documentary credits.Group 3 – Customers whose due amounts are not secured with any collaterals.
11 INVENTORIES
Group Company
2018Rs. ‘000
2017Rs. ‘000
2018Rs. ‘000
2017Rs. ‘000
Raw materials 749,435 650,244 749,435 650,244
Work in progress 35,766 23,584 35,766 23,584
Finished goods 822,089 495,005 822,089 495,005
Trading stock 420,542 365,814 420,542 365,814
Less: Provision for slow moving inventories (81,895) (100,812) (81,895) (100,812)
1,945,937 1,433,835 1,945,937 1,433,835
Goods in transit (211) 577 (211) 577
1,945,726 1,434,412 1,945,726 1,434,412
The cost of inventories recognised as an expense and included in cost of goods sold amounted to Rs. 3,747,179,792 (2017 - Rs. 2,860,809,196).
NOTES TO THE FINANCIAL STATEMENTS

INTEGRATED ANNUAL REPORT 2017/18 113
12 TRADE AND OTHER RECEIVABLES
Group Company
2018Rs. ‘000
2017Rs. ‘000
2018Rs. ‘000
2017Rs. ‘000
Trade receivables 686,430 446,927 686,430 446,927
Less: Provision for impairments (7,308) (3,217) (7,308) (3,217)
679,122 443,710 679,122 443,710
Receivables from parent company [Note 29 (j)] 234,917 160,352 234,917 160,352
Receivables from related companies [Note 29 (j)] 257,238 234,461 430,586 408,740
Loans to related companies [Note 29 (k)] 21,797 47,506 21,797 47,506
Prepayments and deposits 150,534 124,774 150,521 124,774
Other receivables 8,951 23,127 8,951 23,127
1,352,559 1,033,930 1,525,894 1,208,209
Less: non current portion - loans to related companies (10,898) (20,422) (10,898) (20,422)
Current portion 1,341,661 1,013,508 1,514,996 1,187,787
The Directors consider the carrying amount of the trade and other receivables equals its fair value.
The long term loans to related companies are carried at amortised cost based on effective interest rates which equals to market interest rates.
(a) Trade receivables by credit quality are as follows:
Group Company
2018Rs. ‘000
2017Rs. ‘000
2018Rs. ‘000
2017Rs. ‘000
Neither past due nor impaired 511,055 418,397 511,055 418,397
Past due but not impaired 168,067 25,313 168,067 25,313
Impaired 7,308 3,217 7,308 3,217
686,430 446,927 686,430 446,927
(b) The aging of trade receivables that are past due but not impaired are as follows:
Group Company
2018Rs. ‘000
2017Rs. ‘000
2018Rs. ‘000
2017Rs. ‘000
Amount overdue:
1 month to 3 months 106,157 16,001 106,157 16,001
3 months to 1 year 59,220 4,756 59,220 4,756
More than 1 year 2,690 4,556 2,690 4,556
168,067 25,313 168,067 25,313
Rs. 168,067,000 (2017- Rs. 25,313,000) of debtors which are past due but not impaired are secured with bank guarantees, hence no impairment considered necessary.

114 LANKA TILES PLC
(c) Movements on the provision for impairment of trade receivables are as follows:
Group Company
2018Rs. ‘000
2017Rs. ‘000
2018Rs. ‘000
2017Rs. ‘000
At 1 April 2017 3,217 7,781 3,217 7,781
Provision for impairment 5,238 - 5,238 -
Reversal of impairment provision (1,147) (199) (1,147) (199)
Receivables written off during the year as uncollectible - (4,365) - (4,365)
At 31 March 2018 7,308 3,217 7,308 3,217
(d) The carrying amounts of trade and other receivables are denominated in following currencies,
Group Company
2018Rs. ‘000
2017Rs. ‘000
2018Rs. ‘000
2017Rs. ‘000
United States dollars 26,343 14,514 26,343 14,514
Australian dollars 33,874 21,382 33,874 21,382
Sri Lankan rupees 1,281,444 977,612 1,454,779 1,151,891
1,341,661 1,013,508 1,514,996 1,187,787
The maximum exposure to credit risk at the reporting date is the carrying value of each class of receivables mentioned above, except for trade receivables which are secured by bank guarantees and documentary credits.
(e) The effective interest rates of non current receivables are based on market interest rates.
13 CASH AND CASH EQUIVALENTS
Group Company
2018Rs. ‘000
2017Rs. ‘000
2018Rs. ‘000
2017Rs. ‘000
Cash at bank and cash in hand 228,036 46,821 225,594 46,821
Short term deposits 216,962 1,180,298 208,381 1,180,298
Cash and cash equivalents (excluding bank overdraft) 444,998 1,227,119 433,975 1,227,119
For the purpose of the cash flow statement, the year end cash and cash equivalents comprise the following:
Group Company
2018Rs. ‘000
2017Rs. ‘000
2018Rs. ‘000
2017Rs. ‘000
Cash and cash equivalents 444,998 1,227,119 433,975 1,227,119
Bank overdrafts (Note 15) (95,179) (377,137) (95,179) (377,137)
Total cash and cash equivalents 349,819 849,982 338,796 849,982
NOTES TO THE FINANCIAL STATEMENTS

INTEGRATED ANNUAL REPORT 2017/18 115
Group Company
2018Rs. ‘000
2017Rs. ‘000
2018Rs. ‘000
2017Rs. ‘000
Sri Lankan rupees 417,354 1,218,972 417,354 1,218,972
Indian rupees 11,023 - - -
United States dollars 10,108 4,541 10,108 4,541
Australian dollars 6,165 3,545 6,165 3,545
Euro 348 61 348 61
444,998 1,227,119 433,975 1,227,119
14 TRADE AND OTHER PAYABLES
Group Company
2018Rs. ‘000
2017Rs. ‘000
2018Rs. ‘000
2017Rs. ‘000
Trade payables 269,433 206,068 269,433 206,068
Amount due to related parties { Note 29 (j) } 79,256 91,327 79,199 91,276
Accrued expenses 187,887 150,908 187,887 150,908
Other payables 245,619 135,488 245,453 135,288
782,195 583,791 781,972 583,540
Other payables of the Company and the Group mainly include Value Added Tax payable amounting to Rs. 68,400,613 ( 2017 - Rs. 34,902,627), cash sales advance amounting to Rs. 4,810,193 (2017-- Rs. 3,726,131) and Nations Building Tax payable amounting to Rs. 3,979,826 (2017 - Rs. 8,280,043).
The carrying amounts of trade and other payable are denominated in following currencies;
Group Company
2018Rs. ‘000
2017Rs. ‘000
2018Rs. ‘000
2017Rs. ‘000
Sri Lankan rupees 626,516 457,043 626,293 456,792
United States dollars 95,250 67,569 95,250 67,569
Euro 60,429 59,179 60,429 59,179
782,195 583,791 781,972 583,540
The cash and cash equivalents are denominated in following currencies;

116 LANKA TILES PLC
15 BORROWINGS
Group Company
2018Rs. ‘000
2017Rs. ‘000
2018Rs. ‘000
2017Rs. ‘000
Current
Bank borrowings 98,849 111,416 98,849 111,416
Bank overdrafts (Note 13) 95,179 377,137 95,179 377,137
194,028 488,553 194,028 488,553
Non-current
Bank borrowings 7,374 56,224 7,374 56,224
7,374 56,224 7,374 56,224
Total borrowings 201,402 544,777 201,402 544,777
(a) Bank overdrafts are secured primarily on inventories.
(b) The security offered and the interest rate applicable to each bank borrowings are set out below:
Loan Security offered Interest rate per annum (%)
DFCC LKR 165 Mn A primary mortgage over land, buildings and plant and machinery located at Ranala amounting to Rs.300 Mn
4 WEEK AWPLR + 0.5%
DFCC LKR 150 Mn A primary mortgage over land, buildings and plant and machinery located at Ranala amounting to Rs.300 Mn
4 WEEK AWPLR + 0.5%
DFCC LKR 80 Mn A primary mortgage over land, buildings and plant and machinery located at Ranala amounting to Rs.300 Mn
4 WEEK AWPLR + 0.5%
(c) Weighted average effective interest rates:
Group Company
2018Rs. ‘000
2017Rs. ‘000
2018Rs. ‘000
2017Rs. ‘000
Bank overdrafts 12.32% 12.49% 12.32% 12.49%
Bank borrowings 12.25% 11.79% 12.25% 11.79%
(d) Maturity of non - current bank borrowings is as follows;
Group Company
2018Rs. ‘000
2017Rs. ‘000
2018Rs. ‘000
2017Rs. ‘000
Between one and two years 7,374 48,849 7,374 48,849
Between two and five years - 7,375 - 7,375
Non Current Bank borrowings 7,374 56,224 7,374 56,224
NOTES TO THE FINANCIAL STATEMENTS

INTEGRATED ANNUAL REPORT 2017/18 117
(e) The carrying amounts of the Company’s and the Group’s borrowing are denominated in following currencies;
Group Company
2018Rs. ‘000
2017Rs. ‘000
2018Rs. ‘000
2017Rs. ‘000
Sri Lankan rupees 201,402 504,710 201,402 504,710
United States dollars - 40,067 - 40,067
Current Bank borrowings 201,402 544,777 201,402 544,777
(f) The exposure of the Company’s and the Group’s borrowings to interest rate changes and the contractual re-pricing dates at the end of the reporting period varies between 1 month to 3 months period.
16 DEFERRED INCOME TAX
(a) Deferred income taxes are calculated on all temporary differences under the liability method.
The gross movement on the deferred income tax account is as follows:
Group Company
2018Rs. ‘000
2017Rs. ‘000
2018Rs. ‘000
2017Rs. ‘000
At beginning of year 443,787 453,542 443,787 453,542
Income statement charge (Note 25) 6,766 (14,938) 6,766 (14,938)
Deferred tax release on the components of other comprehensive income 183,693 5,183 183,693 5,183
At end of year 634,246 443,787 634,246 443,787
(b) The analysis of the deferred tax assets and liabilities is as follows:
Group Company
2018Rs. ‘000
2017Rs. ‘000
2018Rs. ‘000
2017Rs. ‘000
Deferred tax assets (69,515) (63,751) (69,515) (63,751)
Deferred tax liabilities 703,761 507,538 703,761 507,538
Deferred tax liabilities (net) 634,246 443,787 634,246 443,787

118 LANKA TILES PLC
(c) The movement in deferred tax assets and liabilities during the year, without taking into consideration the offsetting of balances within the same tax jurisdiction is as follows:
Group / Company
Revaluation reserve
Accelerated tax
depreciation
Total
Rs. ‘000 Rs. ‘000 Rs. ‘000
Deferred tax liabilities
At 1 April 2016 - 518,034 518,034
Charged to income statement - (10,496) (10,496)
Charged to other comprehensive income - - -
At 31 March 2017 - 507,538 507,538
Charged to income statement - 4,589 4,589
Charged to other comprehensive income 191,634 - 191,634
At 31 March 2018 191,634 512,127 703,761
Group / Company
Retirement benefit
obligations
InventoryProvision
Total
Rs. ‘000 Rs. ‘000 Rs. ‘000
Deferred tax assets
At 1 April 2016 (35,150) (29,342) (64,492)
Credited to income statement (4,155) (287) (4,442)
Charged to other comprehensive income 5,183 - 5,183
At 31 March 2017 (34,122) (29,629) (63,751)
(Credited)/Charged to income statement (4,521) 6,698 2,177
Credited to other comprehensive income (7,941) - (7,941)
At 31 March 2018 (46,584) (22,931) (69,515)
NOTES TO THE FINANCIAL STATEMENTS

INTEGRATED ANNUAL REPORT 2017/18 119
17 RETIREMENT BENEFIT OBLIGATIONS - GRATUITY
Group Company
2018Rs. ‘000
2017Rs. ‘000
2018Rs. ‘000
2017Rs. ‘000
Balance sheet obligations for:
Defined benefits - gratuity 166,370 124,394 166,370 124,394
Income statement charge included in operating profit for:
Defined benefits - gratuity 26,000 21,454 26,000 21,454
Remeasurements for:
Defined benefits - gratuity 28,361 (18,898) 28,361 (18,898)
The movement in the defined benefit obligations is as follows
Group Company
2018Rs. ‘000
2017Rs. ‘000
2018Rs. ‘000
2017Rs. ‘000
At 1 April 124,394 129,073 124,394 129,073
Current service cost 11,073 7,901 11,073 7,901
Interest expense 14,927 13,553 14,927 13,553
Benefits paid (12,385) (7,235) (12,385) (7,235)
Remeasurements:
Loss from change in financial assumptions 17,569 (10,222) 17,569 (10,222)
Gain from change in demographic assumptions (720) (8,676) (720) (8,676)
Experience losses 11,512 - 11,512 -
At 31 March 166,370 124,394 166,370 124,394
The amount recognised in the income statement are as follows:
2018Rs. ‘000
2017Rs. ‘000
2018Rs. ‘000
2017Rs. ‘000
Current service cost 11,073 7,901 11,073 7,901
Interest cost 14,927 13,553 14,927 13,553
Total, included in staff costs (Note 23) 26,000 21,454 26,000 21,454

120 LANKA TILES PLC
The obligation is not externally funded.
The gratuity liability of the Company / the Group is based on the actuarial valuation carried out by the independent acturary Messrs Actuarial and Management Consultants (Private) Limited, as at 31 March 2018. The principal actuarial valuation assumptions used were as follows:
Group Company
2018Rs.. ‘000
2017Rs.. ‘000
2018Rs.. ‘000
2017Rs.. ‘000
Discount rate 10.00% 12.00% 10.00% 12.00%
Future salary increase rate
- Executive staff 12.50% 12.50% 12.50% 12.50%
- Others 10.00% 10.00% 10.00% 10.00%
In additions to above, demographic assumptions such as mortality and withdrawal disability were considered for the actuarial valuation. A 1967/70 mortality table issued by the Institute of Actuaries, London was taken as the base for the valuation.
The weighted average duration of the defined benefit obligations is 7.27 years.
Expected maturity analysis of undiscounted defined benefits - gratuity;
Less thana year
Between 1-2 years
Between3- 5 years
Between6- 10 years
Over year 10 Total
Rs.. ‘000 Rs.. ‘000 Rs.. ‘000 Rs.. ‘000 Rs.. ‘000 Rs.. ‘000
Defined benefits - gratuity 13,592 40,365 47,302 22,108 43,003 166,370
As at 31 March 2018 13,592 40,365 47,302 22,108 43,003 166,370
The sensitivity of the defined benefit obligation to changes in the weighted principal assumptions is :
Discount Rate as at 31 March 2018 10.00%
One percentage point increase in discount rate 155,965
One percentage point decrease in discount rate 178,269
Salary escalation rate as at 31 March 2018 12.50%
One percentage point increase in salary escalation rate 178,500
One percentage point decrease in salary escalation rate 155,573
The above sensitivity analyses are based on a change in an assumption while holding all other assumptions constant. In practice, this is unlikely to occur, and changes in some of the assumptions may be correlated. When calculating the sensitivity of the defined retirement benefit obligations to significant actuarial assumptions, the same method (present value of the defined retirement benefit obligations calculated with the projected unit credit method at the end of the reporting period) has been applied as when calculating the defined benefit liability recognised within the Statement of Financial Position.
NOTES TO THE FINANCIAL STATEMENTS

INTEGRATED ANNUAL REPORT 2017/18 121
18 STATED CAPITAL
Group Company
Number of shares
Stated capital
Number of shares
Stated capital
Rs. ‘000 Rs. ‘000
At 31 March 2017 53,050,410 900,968 53,050,410 900,968
At 31 March 2018 53,050,410 900,968 53,050,410 900,968
All issued shares are fully paid.
19 REVENUE
The Company’s and the Group’s revenue are primarily derived from ;
Group Company
2018Rs. ‘000
2017Rs. ‘000
2018Rs. ‘000
2017Rs. ‘000
(i) Revenue from local sales 5,861,016 4,990,911 5,861,016 4,990,911
(ii) Revenue from export sales 265,291 185,461 265,291 185,461
Total revenue for the year 6,126,307 5,176,372 6,126,307 5,176,372
20 OTHER INCOME
Group Company
2018Rs. ‘000
2017Rs. ‘000
2018Rs. ‘000
2017Rs. ‘000
Sundry income 20,866 26,754 19,447 26,154
20,866 26,754 19,447 26,154
Sundry income mainly include the rental income Rs. 12,876,432 (2017 - Rs. 9,680,000) and sales from excess raw material stock of Rs..333,839 (2017-Rs.1,899,223).
21 OTHER GAINS / (LOSSES) - NET
Group Company
2018Rs.. ‘000
2017Rs.. ‘000
2018Rs.. ‘000
2017Rs.. ‘000
Gains/(Loss) on disposal of property, plant and equipment 4 (6,758) 4 (6,758)
Net fair value gain recognised in profit or loss - 52,497 - -
4 45,739 4 (6,758)

122 LANKA TILES PLC
22 EXPENSES BY NATURE
Group Company
2018Rs.. ‘000
2017Rs.. ‘000
2018Rs.. ‘000
2017Rs.. ‘000
Directors' emoluments
- As Directors’ fees 10,458 11,904 10,458 11,904
- For managerial services 37,485 27,778 37,485 27,778
Auditors' remuneration
- Audit 885 732 805 732
- Non-Audit services 324 254 324 254
-Reimbursable expenses 529 542 529 542
Depreciation on property, plant and equipment (Note 5) 236,236 195,425 236,236 195,425
Changes in inventories of finished goods, trading items and work in progress
393,994 263,972 393,994 263,972
Raw materials and consumables used 2,804,022 2,073,180 2,802,748 2,073,180
Technical fee 95,020 110,309 95,020 110,309
Advertising expenses 41,953 21,484 41,953 21,484
Promotional expenses and sales commission 546,575 449,191 546,575 449,191
Repair and maintenance expenditure 228,644 180,665 228,644 180,665
(Reversal) / provision for slow moving inventories (18,916) (2,705) (18,916) (2,705)
Staff costs (Note 23) 622,553 592,840 622,553 592,840
Other expenses 48,582 23,041 48,566 22,627
Total cost of sales, distribution costs and administrative expenses 5,048,344 3,948,612 5,046,974 3,948,198
23 STAFF COSTS
Group Company
2018Rs.. ‘000
2017Rs.. ‘000
2018Rs.. ‘000
2017Rs.. ‘000
Wages, salaries and bonus 557,127 534,941 557,127 534,941
Defined contribution plans 39,426 36,445 39,426 36,445
Defined benefit plan - gratuity (Note 16) 26,000 21,454 26,000 21,454
622,553 592,840 622,553 592,840
Average no of persons employed as at 31st March - full time 497 495 497 495
NOTES TO THE FINANCIAL STATEMENTS

INTEGRATED ANNUAL REPORT 2017/18 123
24 NET FINANCE INCOME
Group Company
2018Rs.. ‘000
2017Rs.. ‘000
2018Rs.. ‘000
2017Rs.. ‘000
Interest income 90,459 142,420 90,459 142,420
Interest Income from Related Companies 19,885 8,300 19,885 8,300
Finance income 110,344 150,720 110,344 150,720
Interest expenses (23,492) (30,789) (23,492) (30,789)
Net foreign exchange gains/(losses) on transactions / translations 1,724 (960) 1,724 (960)
Finance costs (21,768) (31,749) (21,768) (31,749)
Net finance income 88,576 118,971 88,576 118,971
25 INCOME TAX
Group Company
2018Rs.. ‘000
2017Rs.. ‘000
2018Rs.. ‘000
2017Rs.. ‘000
(a) Current tax :
Current tax on profit for the year 342,029 374,108 341,955 373,940
Total current tax 342,029 374,108 341,955 373,940
(b) Deferred tax (Note 16)
Increase in of temporary differences 6,766 (14,938) 6,766 (14,938)
Total income tax expense 348,795 359,170 348,721 359,002
The tax on the Company’s and the Group’s profit before tax differ from the theoretical amount that would arise using the statutory tax rate applicable to profits of the Company and the Group as follows :
Group Company
2018Rs.. ‘000
2017Rs.. ‘000
2018Rs.. ‘000
2017Rs.. ‘000
Profit before tax 1,352,792 1,604,508 1,352,743 1,551,825
Tax calculated at average rate 28% (2017 : 27.44%) 382,000 440,116 381,680 425,665
Tax on share of results of associate (46,297) (125,851) (46,297) (125,851)
Income not subject to tax (81,694) (14,427) (81,582) -
Expenses not deductible for tax purposes 94,920 59,331 94,920 59,187
Under/(over) provision in respect of previous year (134) - - -
348,795 359,170 348,721 359,002
The weighted average applicable tax rate was 28% (2017 : 27.44%).

124 LANKA TILES PLC
26 EARNINGS PER SHARE
Basic earnings per share is calculated by dividing the net profit attributable to shareholders by the weighted average number of shares in issue during the year.
Group Company
2018Rs.. ‘000
2017Rs.. ‘000
2018Rs.. ‘000
2017Rs.. ‘000
Profit attributable to equity holders 1,004,495 1,245,338 1,004,022 1,192,823
Weighted average number of ordinary shares (thousands) 53,050 53,050 53,050 53,050
Basic earnings per share (Rs.) 18.93 23.47 18.93 22.48
27 DIVIDENDS
A first interim dividend of Rs..212,201,640 (2017 - Rs.. 132,626,025) at Rs. 4.00. (2017 - Rs. 2.50) per share for the year ended 31 March 2018 was paid on 13 September 2017. A second interim dividend of Rs.. 318,302,460 (2017-Rs. 265,252,050) at Rs.. 6.00 (2017-Rs.5.00) per share for the year ended 31 March 2018 was paid on 26 March 2018.
28 CASH GENERATED FROM OPERATIONS
Reconciliation of profit before tax to cash generated from operations:
Group Company
2018Rs.. ‘000
2017Rs.. ‘000
2018Rs.. ‘000
2017Rs.. ‘000
Profit before tax 1,352,792 1,604,508 1,352,743 1,551,825
Adjustments for:
Depreciation (Note 5) 236,236 195,425 236,236 195,425
Provision for retirement benefit obligations (Note 17) 26,000 21,454 26,000 21,454
Net fair value gain recognised in profit or loss (Note 21) - (52,497) - -
Gains/ (Losses) on disposal of assets (Note 21) (4) 6,758 (4) 6,758
Interest expenses (Note 24) 21,768 30,789 21,768 30,789
Interest income (Note 24) (110,344) (150,720) (110,344) (150,720)
Unrealised (losses)/profits on inventory purchased from associate 211 (440) 211 (440)
Profit share of results of associate (165,383) (185,284) (165,383) (185,284)
Provision for slow moving inventories (18,917) (6,139) (18,917) (6,139)
Changes in working capital
- increase in inventories (492,608) (495,577) (492,608) (495,577)
- increase in trade and other receivables (344,338) (202,444) (343,394) (202,007)
- Increase in trade and other payables 198,368 3,025 198,431 2,774
Cash generated from operations 703,781 768,858 704,739 768,858
NOTES TO THE FINANCIAL STATEMENTS

INTEGRATED ANNUAL REPORT 2017/18 125
29 RELATED PARTY TRANSACTIONS
The Company is controlled by Lanka Walltiles PLC which owns 68.22% (2017 - 68.22%) of the Company’s issued share capital. The remaining 31.78% of the shares are widely held. The ultimate parent of the Company is Vallibel One PLC.
The related parties with whom Lanka Tiles PLC carried out transactions in the ordinary course of business are set out below:
(a) Sale of goods to: Relationship Group Company 2018
Rs.. ‘0002017
Rs.. ‘0002018
Rs.. ‘0002017
Rs.. ‘000
Lanka Walltiles PLC Parent Raw materials 3,477 12,454 3,477 12,454
Royal Porcelain (Private) Limited Affiliate Raw materials 3,972 5,374 3,972 5,374
Spares 213 462 213 462
Consumables 199 1,197 199 1,197
Royal Bathware Limited Affiliate Raw materials - 37 - 37
Services - 74 - 74
Royal Ceramics Lanka PLC Intermediate parent
Raw materials947 96 947 96
Spares 29 464 29 464
M N Properties (Private) Limited Affiliate Finished goods 180 1,476 180 1,476
9,017 21,634 9,017 21,634
(b) Purchase of goods/services from: Relationship Group Company 2018
Rs.. ‘0002017
Rs.. ‘0002018
Rs.. ‘0002017
Rs.. ‘000
Swisstek (Ceylon) PLC Associate Trading items 252,868 189,398 252,868 189,398
Sales commission 45,693 9,170 45,693 9,170
Reimbursement of operational expense 4,361 4,417 4,361 4,417
Swisstek Aluminium Limited Affiliate Trading items - 859 859
Lanka Ceramic PLC Affiliate Raw materials 123,960 165,741 123,960 165,741
Lanka Walltiles PLC Parent Raw materials 726 864 726 864
Consumables 1,516 8,340 1,516 8,340
Royal Porcelain (Private) Limited Affiliate Raw materials 6,222 2,563 6,222 2,563
Spares 101 79 101 79
Consumables 553 - 553 -
Royal Ceramics Lanka PLC Intermediate parent
Raw materials- 933 - 933
Spares 141 - 141 -
Uni-Dil Packaging Limited Affiliate Raw materials 70,099 54,087 70,099 54,087
Hayleys Travels & Tours (Private) limited
Affiliate Services10,274 7,972 10,274 7,972
Hayleys Agriculture Holding Limited Affiliate Services 206 187 206 187
Hayleys Electronic Lighting (Private) Limited
Affiliate Services258 251 258 251
Hayleys Industrial Solutions (Private) Limited
Affiliate Services9,506 6,823 9,506 6,823
Hayleys Leisure Holdings (Pvt) Ltd Affiliate Services - 2,550 - 2550
Delmage Freight Services (Private) Limited
Affiliate Services1,433 2,746 1,433 2,746
527,917 456,980 527,917 456,980

126 LANKA TILES PLC
(c) Receipt of funds from: Relationship Group Company
2018Rs.. ‘000
2017Rs.. ‘000
2018Rs.. ‘000
2017Rs.. ‘000
Swisstek (Ceylon) PLC Associate Interest received 4,865 8,299 4,865 8,299
Loan settlement 30,834 30,834 30,834 30,834
35,699 39,133 35,699 39,133
(d) Transfer of funds to: Relationship Group Company
2018Rs.. ‘000
2017Rs.. ‘000
2018Rs.. ‘000
2017Rs.. ‘000
Lanka Walltiles PLC Parent Expenses Reim: Settlement 108,133 - 108,133 -
Raw Material Sale- Settlement 1,784 1,784
Swisstek (Ceylon) PLC Associate 242,698 185,996 242,698 185,996
LWL Development (Private) Limited Affiliate 22,475 69,000 22,475 69,000
375,090 254,996 375,090 254,996
(e) Expenses incurred and transferred to/(from) Relationship Group Company
2018Rs.. ‘000
2017Rs.. ‘000
2018Rs.. ‘000
2017Rs.. ‘000
Lanka Walltiles PLC Parent
- Administration expenses 42,651 11,407 42,651 11,407
- Distribution expenses 100,056 120,902 100,056 120,902
Swisstek (Ceylon) PLC Affiliate
- Administration expenses 9,892 4,193 9,892 4,193
Swisstek Aluminium Limited Affiliate
- Administration expenses 1,238 497 1,238 497
Royal Ceramics Lanka PLC Intermediate parent
-Technical fees 73,445 110,309 73,445 110,309
Vallibel One PLC
- Technical fees 36,328 - 36,328 -
Beyond Paradise Collection Limited Subsidiary
- Administration expenses - - 189 162
LTL Development (Private) Limited Subsidiary
- Administration expenses - - 79 -
LWL Development (Private) Limited Affiliate
- Administration expenses 7 51 - -
263,617 247,359 263,878 247,470
NOTES TO THE FINANCIAL STATEMENTS

INTEGRATED ANNUAL REPORT 2017/18 127
(f) Key management compensation
Key management personnel include members of the Board of Directors and Senior management of Lanka Tiles PLC.
Group Company
2018Rs.. ‘000
2017Rs.. ‘000
2018Rs.. ‘000
2017Rs.. ‘000
Salaries and short-term employee benefits 47,943 39,398 47,943 39,398
Salaries and long-term employee benefits 19,995 15,925 19,995 15,925
67,938 55,323 67,938 55,323
The Directors have disclosed the nature of their interests in contracts at meetings of Directors.
(g) Rental expense
The Company has paid a rental income of Rs..7,830,641 (2017 - Rs..5,789,409) to Swisstek (Ceylon) PLC for the use of warehouse space at Balummahara during the financial year ended and Rs. 28,602,672 (2017 - Rs. 28,186,512) to Lanka Walltiles PLC for the use of office space at Nawala, during the financial year ended 31 March 2018.
(h) Rental Income
The Company has received a rental income of Rs..12,532,653 (2017 - Rs..12,383,673) from Lanka Walltiles PLC for Biyagama warehouse during the financial year ended 31 March 2018.
The Group has received a rental income of Rs1,200,000 (2017 - Rs..600,000) from LWL Development (Private) Limited for Divulapitiya land during the financial year ended 31 March 2018.
(i) The property owned by Swisstek (Ceylon) PLC at Balummahara, has been mortgaged to Lanka Tiles PLC as security to the value of Rs.. 78 Mn against the outstanding balance due to Lanka Tiles PLC by Swisstek (Ceylon) PLC. Lanka Tiles PLC charges interest at AWPLR + 1% per annum on the loans given to Swisstek (Ceylon) PLC.
(j) Outstanding balances arising from sale/purchase of goods/services
Receivables from related Companies: Group Company
2018Rs.. ‘000
2017Rs.. ‘000
2018Rs.. ‘000
2017Rs.. ‘000
Lanka Walltiles PLC 234,917 160,352 234,917 160,352
Swisstek Aluminium Limited 499 1,007 499 1,007
Royal Porcelain (Private) Limited 855 3,287 855 3,287
Royal Bathware Limited - 11 - 11
Beyond Paradise Collection (Private) Limited - - 175,068 174,879
LWL Development (Private) Limited 255,884 230,156 254,084 229,556
LTL Development (Private) Limited - - 79 -
492,155 394,813 665,502 569,092
Payables to related parties:
Lanka Ceramic PLC 17,059 16,510 17,059 16,510
Royal Ceramics Lanka PLC 5,150 25,624 5,150 25,624
Swisstek (Ceylon) PLC 43,959 42,861 43,959 42,861
Uni-Dil Packaging Limited 7,119 6,281 7,119 6,281
Swisstek Aluminium Limited - - - -
Vallibel One PLC 5,912 - 5,912 -
LWL Development (Private) Limited 57 51 - -
79,256 91,327 79,199 91,276

128 LANKA TILES PLC
NOTES TO THE FINANCIAL STATEMENTS
(k) Loans given to related parties
Group Company
2018Rs.. ‘000
2017Rs.. ‘000
2018Rs.. ‘000
2017Rs.. ‘000
Swisstek (Ceylon) PLC (see note 29i) above 21,797 47,506 21,797 47,506
21,797 47,506 21,797 47,506
(l) Deposits
Group Company
2018Rs.. ‘000
2017Rs.. ‘000
2018Rs.. ‘000
2017Rs.. ‘000
Vallibel Finance PLC 208,213 274,992 208,213 274,992
208,213 274,992 208,213 274,992
30 CONTINGENCIES AND COMMITMENTS
Contingent liabilities
There were no material contingent liabilities outstanding at the end of the reporting period.
Financial commitments
The Company is committed to pay Rs. 453,750 and Rs2,072,657 as rent per month for the use of building located at Rajagiriya and Nawala respectively.
Capital commitments
There were no capital commitments outstanding at the end of the reporting period.
31 RESTATEMENT AND RECLASSIFICATIONS OF COMPARATIVES
The presentation and classification of figures of previous year have been amended, where relevant, to be comparable with those for the current year.
32 EVENTS AFTER THE REPORTING PERIOD
No circumstances have arisen since the balance sheet date which require adjustments to, or disclosure in the financial statements.

INTEGRATED ANNUAL REPORT 2017/18 129
FIVE YEAR SUMMARY STATEMENT OF COMPREHENSIVE INCOME
GROUP
Year ended 31st March 2014 2015 2016 2017 2018
Rs. '000 Rs. '000 Rs. '000 Rs. '000 Rs. '000
Revenue 5,109,318 5,349,670 5,541,368 5,176,372 6,126,307 Operating profit 920,915 980,738 1,396,581 1,300,253 1,098,833Finance income/(costs) (146,531) (25,250) 45,610 118,971 88,576 Share of results of associate-Net of Tax 52,098 110,736 139,411 185,284 165,383 Profit before income tax 826,482 1,066,224 1,581,602 1,604,508 1,352,792 Income tax expense (174,426) (225,949) (399,448) (359,170) (348,795)
Profit for the year 652,056 840,275 1,182,154 1,245,338 1,003,997
Profit attributable to the equity ownersof the Company 652,056 840,275 1,182,154 1,245,338 1,003,997Dividends (244,032) (344,828) (371,353) (397,878) (530,504)
Retained profit for the year 408,024 495,447 810,801 847,460 473,493
Earnings per share - basic (Rs.) 12.29 15.84 22.28 23.47 18.93
COMPANY
Year ended 31st March 2014 2015 2016 2017 2018
Rs. '000 Rs. '000 Rs. '000 Rs. '000 Rs. '000
Revenue 5,109,318 5,349,670 5,541,368 5,176,372 6,126,307 Operating profit 920,915 980,738 1,396,581 1,247,570 1,098,784 Finance income/(costs) (146,531) (25,250) 45,610 118,971 88,576 Share of results of associate-Net of Tax 52,098 110,736 139,411 185,284 165,383 Profit before income tax 826,482 1,066,224 1,581,602 1,551,825 1,352,743 Income tax expense (174,426) (225,949) (399,448) (359,002) (348,721)
Profit for the year 652,056 840,275 1,182,154 1,192,823 1,004,022
Profit attributable to the equity ownersof the Company 652,056 840,275 1,182,154 1,192,823 1,004,022Dividends (244,032) (344,828) (371,353) (397,878) (530,504)
Retained profit for the year 408,024 495,447 810,801 794,945 473,518
Earnings per share - basic (Rs.) 12.29 15.84 22.28 22.48 18.93

130 LANKA TILES PLC
Year ended 31st March 2014 2015 2016 2017 2018
Rs. '000 Rs. '000 Rs. '000 Rs. '000 Rs. '000
ASSETSNon-current assetsProperty, plant and equipment 2,607,779 2,556,753 3,398,848 3,608,790 3,855,576 Investment in subsidiaries - - - - 6,242 Investments in associates 308,846 493,136 725,543 881,052 933,633 Loan given to related companies 110,467 79,885 49,050 20,422 10,898 Finance lease debtors 1,225 - - -
3,028,317 3,129,774 4,173,441 4,510,264 4,806,349
Current assetsInventories 1,473,550 1,137,108 932,256 1,434,412 1,945,726 Trade and other receivables 1,148,034 898,820 987,986 1,187,787 1,514,996 Cash and cash equivalents 74,996 846,794 1,586,065 1,227,119 433,975
2,696,580 2,882,722 3,506,307 3,849,318 3,894,697 Total assets 5,724,897 6,012,496 7,679,748 8,359,582 8,701,046
EQUITY Capital and reservesStated capital 900,968 900,968 900,968 900,968 900,968 Retained earnings 2,186,632 2,745,049 3,584,487 4,394,551 4,778,698 Revaluation reserve - 838,856 838,856 730,515 Amalgamation reserve 460,151 460,151 460,151 460,151 460,151
3,547,751 4,106,168 5,784,462 6,594,526 6,870,332
LIABILITIES Non-current liabilitiesBorrowings 488,395 383,974 260,824 56,224 7,374 Deferred income tax liabilities 340,527 375,486 453,542 443,787 634,246 Defined benefit obligations 87,836 110,577 129,073 124,394 166,370
916,758 870,037 843,439 624,405 807,990
Current liabilitiesTrade and other payables 463,642 536,171 580,766 583,540 781,972 Current income tax liabilities 33,087 139,565 276,660 68,558 46,724 Borrowings 763,659 360,555 194,421 488,553 194,028
1,260,388 1,036,291 1,051,847 1,140,651 1,022,724 Total liabilities 2,177,146 1,906,328 1,895,286 1,765,056 1,830,714 Total equity and liabilities 5,724,897 6,012,496 7,679,748 8,359,582 8,701,046
FIVE YEAR SUMMARY STATEMENT OF FINANCIAL POSITION

INTEGRATED ANNUAL REPORT 2017/18 131
Year ended 31st March 2014 2015 2016 2017 2018
Authorised share capital (Rs..Mn) 500.0 500.0 500.0 500.0 500.0Stated capital (Rs..Mn) 900.9 900.9 900.9 900.9 900.9Shares in issue (Mn) 53.05 53.5 53.5 53.5 53.5(as at end of year)
Shareholders- Institutions (Number) 152 141 144 143 140- Individuals (Number) 1674 1579 1619 1644 1595Total 1,826 1,720 1,763 1,787 1,735
Shares held by- Institutions (%) 90.80 91.85 91.49 92.13 93.15- Individuals (%) 9.20 8.15 8.51 7.87 6.86Total 100.0 100.0 100.0 100.0 100.0
Transactions (Number) 1,328 1,352 1,605 978 610 Shares traded (Mn) 12.28 315.00 224.00 1,173.00 115.00 Dividends (%) 37.4 41.4 31.4 33.4 53 Dividends per share (Rs..) 4.00 4.50 7.00 7.50 10.00
Market price per share- Highest during the year (Rs..) 84.90 117.90 128.00 123.90 121.40- Lowest during the year (Rs..) 61.00 75.10 97.00 95.00 99.50- As at end of the year (Rs..) 75.70 106.00 100.60 102.00 99.70
Market Capitalization (Rs..Mn) 4,015.89 5,623.30 5,336.83 5,411.10 5,289.09 (as at end of year)Earnings per share (Rs..) 12.29 15.84 22.28 22.48 18.93Price/Earnings ratio (Times) 6.16 6.69 4.51 4.54 5.27Net assets per share (Rs..) 66.88 77.40 109.04 124.31 129.51
DISTRIBUTION OF SHAREHOLDINGS AS AT 31ST MARCH 2018
Size of shareholdings Shareholders Shares HoldingsNumber Number Number %
1 - 1,000 1,311 277,379 0.521,001 - 10,000 345 1,154,161 2.1810,001 - 100,000 66 1,669,207 3.14100,001 - 1,000,000 8 2,544,356 4.80Over 1,000,001 5 47,405,307 89.36
1,735 53,050,410 100.00
CATEGORIES OF SHAREHOLDERS No of Holders No of Shares %
Local Individuals 1,545 3,008,117 5.67Local Institutions 130 44,454,260 83.80Foreign Individuals 50 628,935 1.18Foreign Institutions 10 4,959,098 9.35
1,735 53,050,410 100
PUBLIC HOLDING
Percentage of public holding as at 31 st March 2018 was 28.28% comprising of 1,729 share holders.
SHAREHOLDER INFORMATION

132 LANKA TILES PLC
20 MAJOR SHAREHOLDERS
Name No of Shares No of Shares
31.03.2018 % 31.03.2017 %
1 Lanka Walltiles PLC 36,189,195 68.217 36,189,195 68.217 2 Employees Provident Fund 4,968,313 9.365 4,968,313 9.365 3 BNYM SA/NV -Frontaura Global Frontier fund LLC 3,505,980 6.609 3,505,980 6.609 4 Royal Ceramics Lanka PLC 1,388,481 2.617 1,388,481 2.617 5 Caceis bank Luxemburg S/A Barca Globel Master fund LP 1,353,338 2.551 548,532 1.034 6 Bank of Ceylon No. 1 Account 973,200 1.834 973,200 1.834 7 Mr. K R Kamon 537,628 1.013 537,628 1.013 8 Mr. A A Page 433,939 0.818 433,939 0.818 9 Aruna Enterprises (Pvt) Limited 128,500 0.242 128,500 0.242 10 Mr S.M Fernando 126,446 0.238 126,446 0.238 11 Mrs A A Merchant 125,000 0.236 125,000 0.236 12 Deutsche Bank AG-Comtrust Equity Fund 111,500 0.210 108,000 0.204 13 Dr A C Visvalingam and Mrss Y I A C Visvalingam 108,143 0.204 77,342 0.146 14 Mr Y H Abdulhussein 98,833 0.186 98,833 0.186 15 Pinnacle Trust (Pvt) Limited 92,038 0.173 92,038 0.173 16 Sampath Bank PLC /Dr T Sethilverl 90,600 0.171 90,600 0.171 17 Seylan Bank PLC/Channa Nalin Rajahmoney 72,104 0.136 71,317 0.134 18 Mrs B C Sansoni 62,495 0.118 62,495 0.118 19 Mr.M S Fernando 49,105 0.093 49,105 0.093 20 Saboor Chatoor (Pvt) Ltd 42,200 0.080 42,200 0.080
Sub Total 50,457,038 95.111 49,617,144 93.528 Others 1,715 Shareholders 2,593,372 4.889 3,433,266 6.472 Grand Total 53,050,410 100.00 53,050,410 100.00
DIRECTORS’ AND CEO’S SHAREHOLDING AS AT 31ST MARCH 2018
Name of Director No of Shares %
Mr. Dhammika Perera - - Mr. A M Weerasinghe 34,697 0.0654Mr. J A P M Jayasekera - - Dr. S Selliah - - Mr. T G Thoradeniya - - Mr. K D G Gunaratne - - Ms. A M L Page 2,500 0.0047Mr. G A R D Prasanna (Alternate Director to Mr. Dhammika Perera) - -
The fractional shares of 582 arising from the capitalization of revenue reserves issue were issued jointly in the names of Mr. J A P M Jayasekera and Mr. A A Page
SHARE PRICE FOR THE YEAR
Market price per share
Highest during the year Rs.. 121.40 (08-08-2017)Lowest during the year Rs.. 99.50 (29-03-2018)As at end of the year Rs.. 99.70Number of Transactions during the year 610Number of Shares traded during the year 1,038,311 Value of shares traded during the year (Rs.) 115,447,270.70
PUBLIC HOLDING
The Percentage of shares held by the Public 28.277%No of shareholders representing the above percentage 1,729

INTEGRATED ANNUAL REPORT 2017/18 133
STATEMENT OF VALUE ADDED
For the year ended 31st March 2014 2015 2016 2017 2018
Rs. ’000 % Rs. '000 % Rs. '000 % Rs. '000 % Rs. '000 %
Sales 5,789,073 5,941,148 6,123,730 5,805,556 6,126,307 Duty rebate 853 - - - - Other income 29,599 25,939 37,328 26,154 19,447 Less:Cost of materials & services bought in
(3,546,878) (3,535,313) (3,179,762) (2,899,677) (3,096,393)
Value added 2,272,647 2,431,774 2,981,296 2,932,033 3,049,361
Distribution of Value Added
Employees as remuneration & welfare
453,101 19.94 526,439 21.65 597,336 20.04 571,757 19.50 630,588 20.68
Government as taxes 748,708 32.94 877,775 36.10 1,096,099 36.77 1,140,843 38.91 1,320,290 43.30
Lenders of capital as interest 172,814 7.60 49,242 2.02 26,518 0.89 30,789 1.05 23,492 0.77
Shareholders as dividends 106,101 4.67 238,727 9.82 371,353 12.46 397,878 13.57 530,504 17.40 Retained in the business as - - - - - - Depreciation/deferred tax 298,063 13.12 248,779 10.23 218,600 7.33 181,106 6.18 236,352 7.75 - Profits 493,860 21.73 490,812 20.18 671,390 22.52 609,660 20.79 308,135 10.10
Total 2,272,647 100.00 2,431,774 100.00 2,981,296 100.00 2,932,033 100.00 3,049,361 100.00
134 LANKA TILES PLC
NOTICE IS HEREBY GIVEN that the Thirty Fourth (34th) Annual General Meeting of Lanka Tiles PLC will be held at the Winchester Hall, The Kingsbury Hotel, No. 48, Janadhipathi Mawatha, Colombo 01 on the 28th day of June 2018 at 10.20 a.m for the following purposes:
1. To receive and consider the Annual Report of the Board of Directors on the affairs of the Company and the Statement of Accounts for the year ended 31st March 2018 and the Report of the Auditors thereon.
2. To re-elect Ms. A M L Page, who retires by rotation in terms of Articles 103 and 104 of the Articles of Association, as a Director of the Company
3. To re-elect Mr. T G Thoradeniya, who retires by rotation in terms of Articles 103 and 104 of the Articles of Association, as a Director of the Company.
4. To re-appoint Messrs PricewaterhouseCoopers, Chartered Accountants, the retiring Auditors and to authorize the Directors to determine their remuneration.
5. To authorize the Directors to determine Donations for the ensuing year.
By Order of the BoardLANKA TILES PLC
P W Corporate Secretarial (Pvt) LtdSecretaries
At Colombo
25th May 2018
Notes:
1) A shareholder entitled to attend or attend and vote at the Meeting is entitled to appoint a Proxy who need not be a shareholder, to attend and vote instead of him/her. A Proxy need not be a member of the Company. A Form of Proxy is enclosed for this purpose.
2) A Form of Proxy is enclosed in this Report.
3) The completed Form of Proxy should be deposited at the Registered Office of the Company, No. 215, Nawala Road, Narahenpita, Colombo 05, not less than forty-eight (48) hours before the time fixed for the commencement of the Meeting.
NOTICE OF MEETING

INTEGRATED ANNUAL REPORT 2017/18 135
*I/We………………………………………………………………………………….....................…………………………...…………………………………........……… of
……………………………………………………………….....................................................………………………………………………………………................……
being a *Shareholder /Sha ………………………................................................................…………….....………………………………………………………
reholders of Lanka Tiles PLC, do hereby appoint ……………………………….................…………………..........................................……….….....of
…………………………………………………………………………………………………………………………………………………………………or failing him/her
Mr. Dhammika Perera of Colombo or failing him *
Mr. Amarakone Mudiyanselage Weerasinghe of Colombo or failing him*
Mr. Jayasekera Arachchige Panduka Mahendra Jayasekera of Colombo or failing him*
Dr. Sivakumar Selliah of Colombo or failing him*
Mr. Tharana Gangul Thoradeniya of Colombo or failing him*
Mr. Kalupathiranalage Don Gamini Gunaratne of Colombo or failing him*
Ms. Anjalie Maryanne Letitia Page of Colombo or failing him*
as *my/our proxy to represent me/us to speak and vote for me/us on my/our behalf at the Annual General Meeting of the Company to be held on 28th June 2018 at 10.20 a.m and any adjournment thereof and at every poll which may be taken in consequence thereof.
FOR AGAINST
1) To re-elect Ms. A M L Page, who retires by rotation in terms of Article 103 and 104 of the Articles of Association as a Director of the Company.
2) To re-elect Mr. T G Thoradeniya, who retires by rotation in terms of Article 103 and 104 of the Articles of Association as a Director of the Company.
3) To re-appoint M/s PricewaterhouseCoopers as Auditors of the Company for the ensuing year and to authorize the Directors to determine their remuneration.
4) To authorize the Directors to determine donations for the ensuing year
Signed this………………………… day of ………………………… Two Thousand and Eighteen.
………………………… Signature
1) *Please delete the inappropriate words.2) Instructions as to completion are noted on the reverse thereof.
FORM OF PROXY

INSTRUCTIONS AS TO COMPLETION
1. This Form of Proxy must be deposited at No. 215, Nawala Road, Narahenpita, Colombo 5 not less than forty eight (48) hours before the time fixed for the Meeting.
2. In perfecting the Form of Proxy please ensure that all details are legible.
3. If you wish to appoint a person other than a Director of the Company as your proxy, please insert the relevant details in the space provided.
4. Please indicate with an ‘X’ in the space provided, how your proxy is to vote on the resolution. If no indication is given, the proxy in his discretion will vote as he thinks fit.
5. In the case of a Company/Corporation, the proxy must be under its Common Seal, which should be affixed and attested in the manner prescribed by its Articles of Association.
6. In the case of a Proxy signed by an Attorney, the Power of Attorney must be deposited at The Secretaries’ Office (i.e. P W Corporate Secretarial (Pvt) Ltd, No.3/17, Kynsey Road, Colombo 8) for registration.
7. In the case of joint holders the Form of Proxy must be signed by the first holder.

CORPORATE INFORMATION
NAME OF THE COMPANY
Lanka Tiles PLC
LEGAL FORM
Public Limited Liability Company listed on the Colombo Stock Exchange. (Incorporated as a Private Limited Liability Company on 30th March 1984 under the Companies Act No. 17 of 1982 and converted to a Public Limited Liability Company on 07th August 1984.) The Company was re-registered under the New Companies Act No. 07 of 2007 on 19th March 2008. (Registration No. PQ 129)
DIRECTORS
Mr. Dhammika Perera (Chairman) Mr. A M Weerasinghe (Deputy Chairman)Mr. J A P M Jayasekera (Managing Director)Dr. S Selliah Mr. T G Thoradeniya Mr. K D G Gunaratne Ms. A M L PageMr. G A R D Prasanna (Alternate Director to Mr. Dhammika Perera)
SECRETARIES
P W Corporate Secretarial (Pvt) LtdNo. 3/17, Kynsey RoadColombo 08 Telephone : + 94 -11 - 4640360-3 Facsimile : + 94 -11 - 4740588 E-mail : [email protected]
REGISTERED OFFICE
215, Nawala Road, Narahenpita, Colombo 05 Telephone : + 94 -11 - 2808050 / 2808001-3 Facsimile : + 94 -11 - 2806232 E-mail : [email protected] Website : www.lankatiles.com
FACTORY
St. James Estate, Jaltara, Ranala Telephone : + 94 - 11 - 2141055, 2141057, 2141819 Facsimile : + 94 - 11 - 2141045E-mail : [email protected]
BANKERS
Commercial Bank of Ceylon PLC DFCC Bank Bank of Ceylon Hongkong & Shanghai Banking Corp. LimitedHatton National Bank PLC Sampath Bank PLC
AUDITORS
PricewaterhouseCoopers Chartered Accountants 100, Braybrooke Place, Colombo 2.Telephone : + 94 - 11 - 4719838 Facsimile : + 94 - 11 - 2303197
Designed & produced by
Printed by Printage (Pvt) Ltd