
Multidrug-/ rifampicin- resistant TB (MDR/RR-TB) incidence, 2016 Estimated number of deaths, 2016...
34
Multidrug-/ rifampicin- resistant TB (MDR/RR-TB): Update 2017
-
Upload
dangnguyet -
Category
Documents
-
view
217 -
download
0
Transcript of Multidrug-/ rifampicin- resistant TB (MDR/RR-TB) incidence, 2016 Estimated number of deaths, 2016...

Multidrug-/ rifampicin-resistant TB
(MDR/RR-TB):
Update 2017

Estimated incidence, 2016
Estimated number of deaths, 2016
1.3 million* (1.2–1.4 million)
10.4 million (8.8–12.2 million)
600,000 (540,000–660,000)
All forms of TB
Multidrug- / rifampicin-resistant TB (MDR/RR-TB)
HIV-associated TB 1.0 million
(0.9–1.2 million)
374,000 (325,000–427,000)
Source: WHO Global Tuberculosis Report 2017 * Excluding deaths attributed to HIV/TB
240,000 (140,000–340,000)
The global TB situation (1)
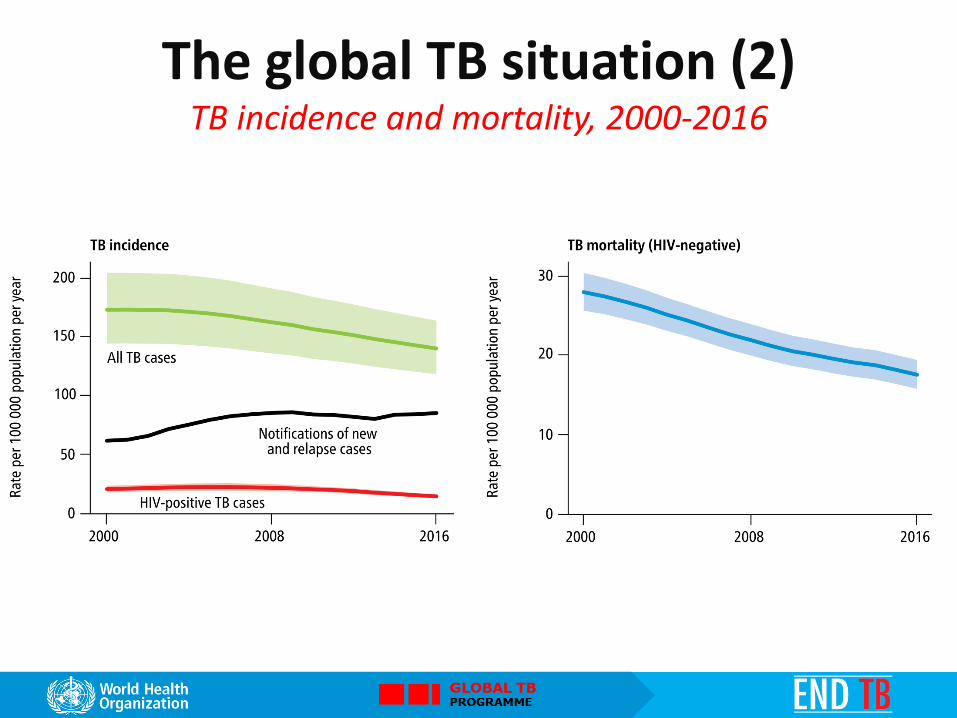
The global TB situation (2) TB incidence and mortality, 2000-2016
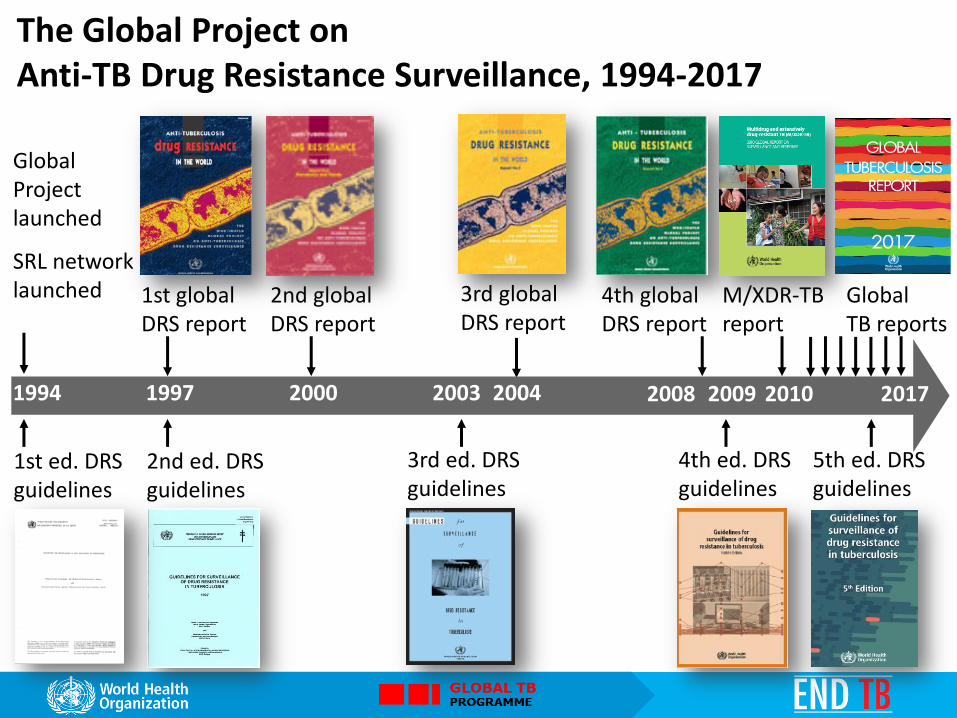
1st ed. DRS guidelines
Global Project launched
SRL network launched
2nd ed. DRS guidelines
1st global DRS report
2nd global DRS report
3rd ed. DRS guidelines
3rd global DRS report
4th global DRS report
4th ed. DRS guidelines
M/XDR-TB report
1994 1997 2000 2003 2004 2008 2009 2010 2017
Global TB reports
5th ed. DRS guidelines
The Global Project on Anti-TB Drug Resistance Surveillance, 1994-2017

The boundaries and names shown and the designations used on this map do not imply the expression of any opinion whatsoever on the part of the World Health Organization concerning the legal status of any country, territory, city or area or of its authorities, or concerning the delimitation of its frontiers or boundaries. Dotted lines on maps represent approximate border lines for which there may not yet be full
agreement. WHO 2016. All rights reserved
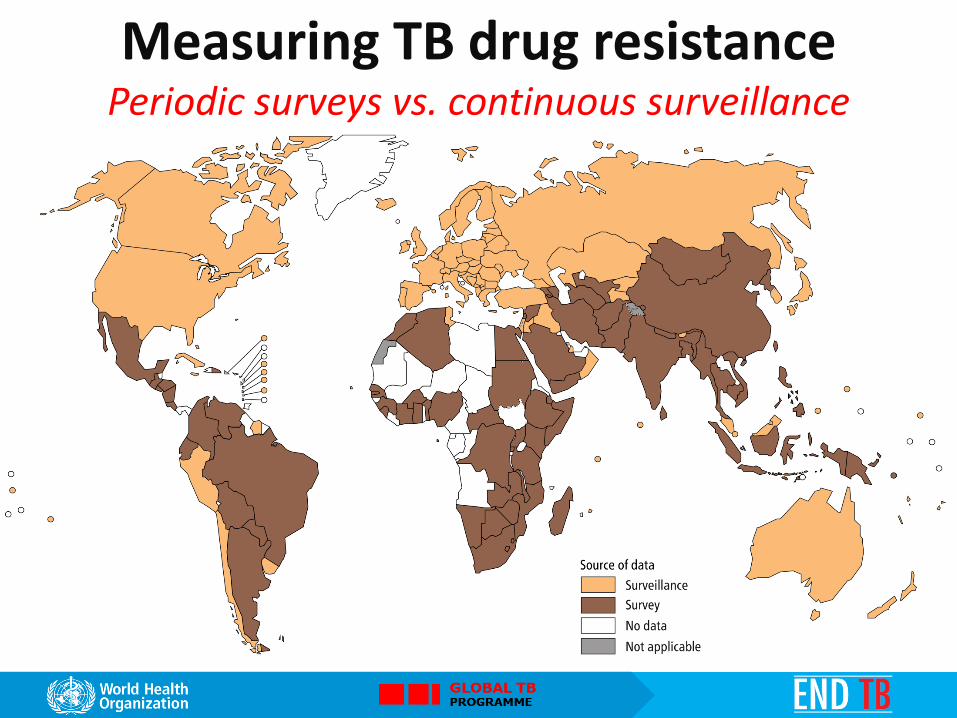
Measuring TB drug resistance Periodic surveys vs. continuous surveillance

Measuring TB drug resistance Year of most recent data
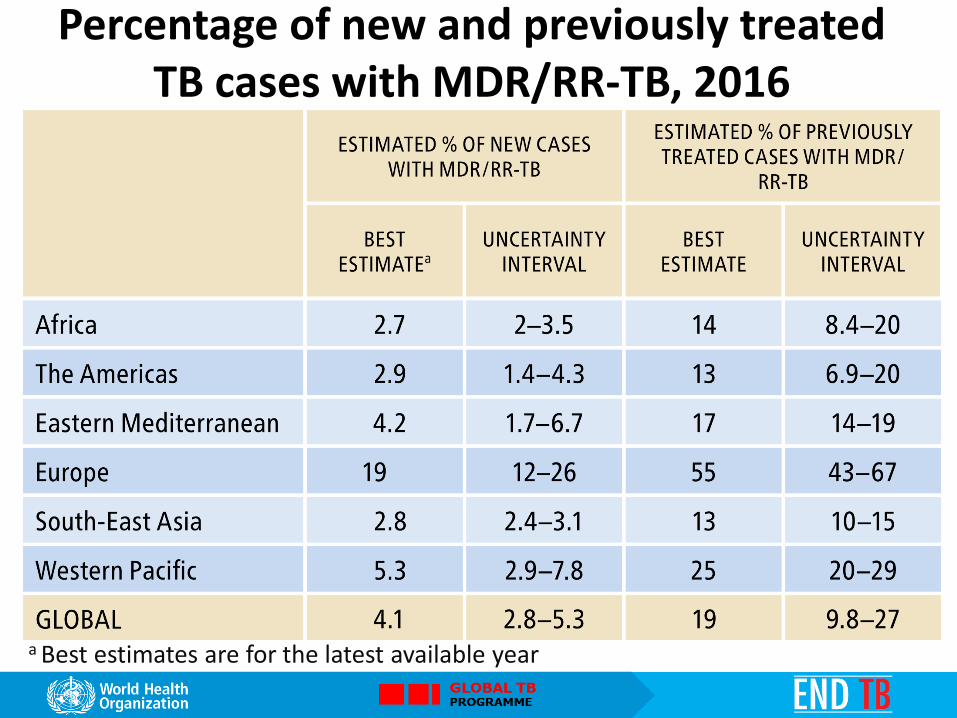
Percentage of new and previously treated TB cases with MDR/RR-TB, 2016
a Best estimates are for the latest available year

% MDR/RR-TB in new TB cases
Figures are based on the most recent year for which data have been reported, which varies among countries. Data reported before 2002 are not shown

% MDR/RR-TB in previously treated TB cases
Figures are based on the most recent year for which data have been reported, which varies among countries. Data reported before 2002 are not shown. The high percentages of previously treated TB cases with MDR-TB in Bahamas, Belize, French Polynesia, Puerto Rico and Sao Tomé and Principe refer to only a small number of notified cases (range: 1–8 notified previously treated TB cases).

30 high MDR-TB burden countries

Estimated incidence of MDR/RR-TB, 2016
for countries with at least 1000 incident cases

Trends in new TB (blue) and new MDR-TB (red) case rates selected high MDR-TB burden countries

Isoniazid-resistant TB cases (Hr-TB) Relative burden of Hr-TB among all new and all retreatment TB cases
notified globally in 2016 (compared with RR-TB)
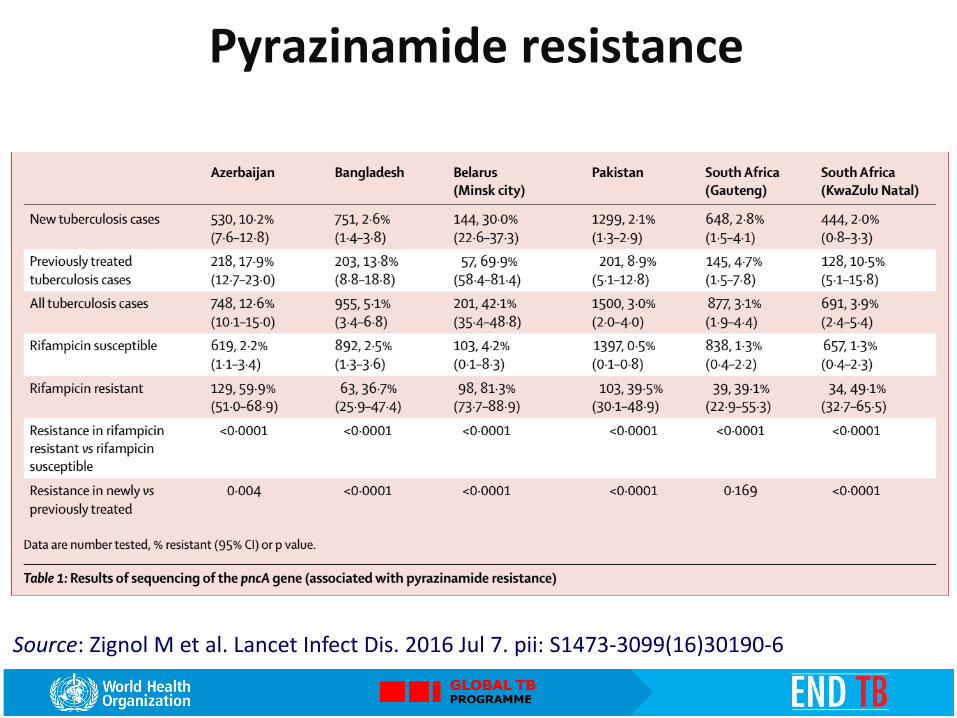
Pyrazinamide resistance
Source: Zignol M et al. Lancet Infect Dis. 2016 Jul 7. pii: S1473-3099(16)30190-6

Countries ever notifying an XDR−TB case
The boundaries and names shown and the designations used on this map do not imply the expression of any opinion whatsoever on the part of the World Health Organization concerning the legal status of any country, territory, city or area or of its authorities, or concerning the delimitation of its frontiers or boundaries. Dotted lines on maps represent approximate border
lines for which there may not yet be full agreement. WHO 2017 All rights reserved

Moxifloxacin resistance
Source: Zignol M et al. Lancet Infect Dis. 2016 Jul 7. pii: S1473-3099(16)30190-6

DR-TB RESPONSE
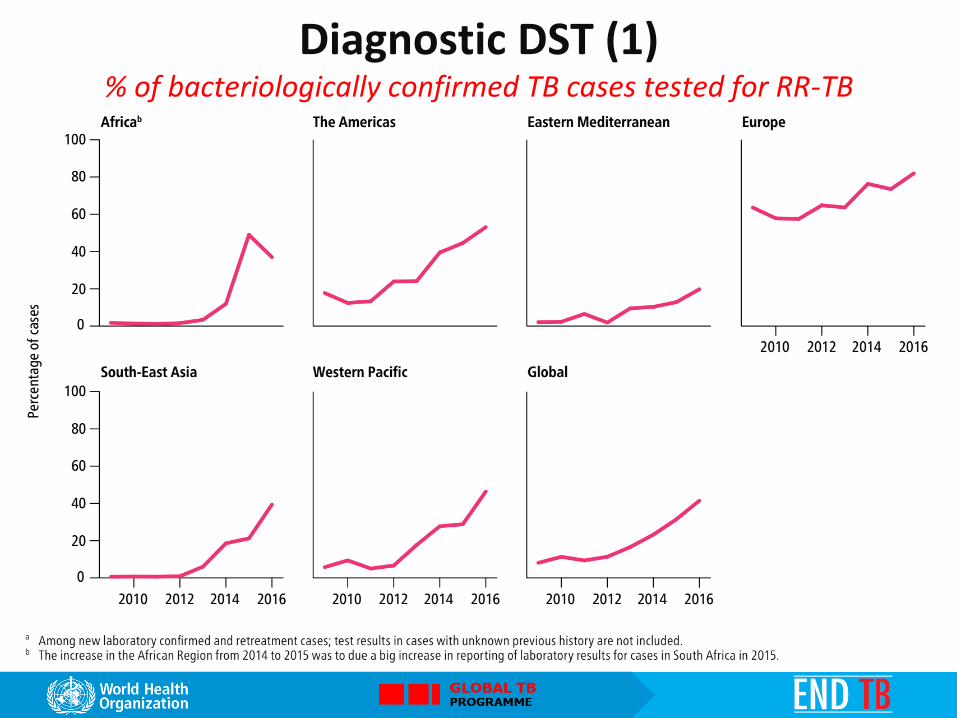
Diagnostic DST (1) % of bacteriologically confirmed TB cases tested for RR-TB

Diagnostic DST (2) % of MDR/RR-TB cases with DST results for
fluoroquinolones and 2nd line injectable agents

MDR/RR-TB detection and treatment MDR/RR-TB cases detected (violet) and number enrolled on MDR-TB treatment (green) 2009-2016, compared with incident MDR/RR-TB cases in 2016 (uncertainty interval shown in blue)

MDR/RR-TB treatment coverage
Enrolments on MDR-TB treatment as a % of the incident MDR/RR-TB cases,
30 high MDR−TB burden countries, regions and globally, 2016

Countries that had used shorter MDR-TB treatment regimens by the end of 2016
The boundaries and names shown and the designations used on this map do not imply the expression of any opinion whatsoever on the part of the World Health Organization concerning the legal status of any country, territory, city or area or of its authorities, or concerning the delimitation of its frontiers or boundaries. Dotted lines on maps represent approximate border
lines for which there may not yet be full agreement. WHO 2017. All rights reserved
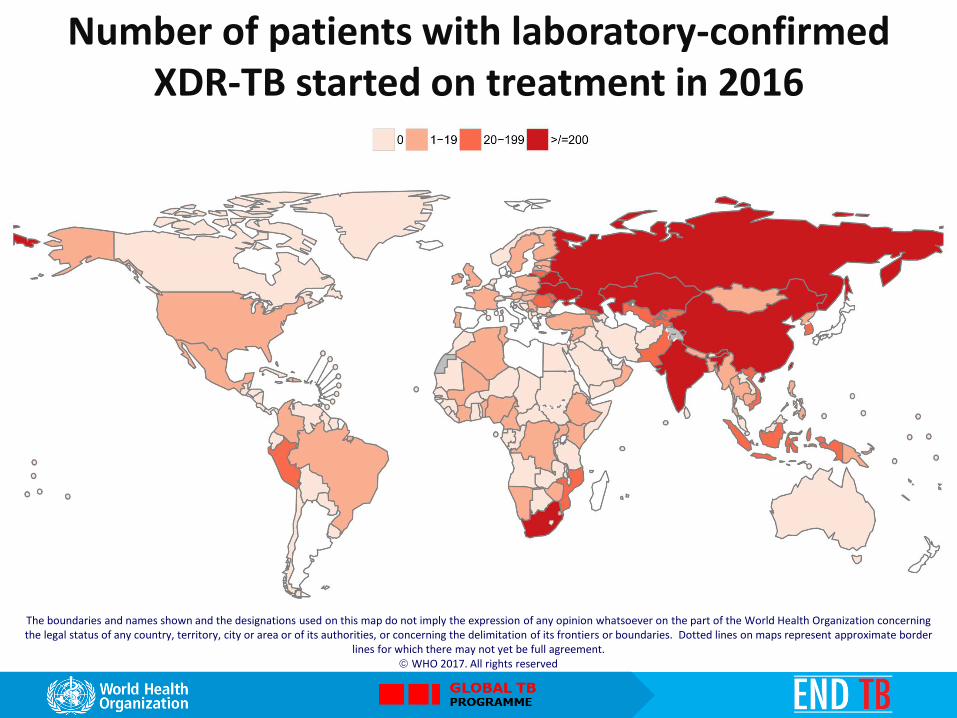
Number of patients with laboratory-confirmed XDR-TB started on treatment in 2016
The boundaries and names shown and the designations used on this map do not imply the expression of any opinion whatsoever on the part of the World Health Organization concerning the legal status of any country, territory, city or area or of its authorities, or concerning the delimitation of its frontiers or boundaries. Dotted lines on maps represent approximate border
lines for which there may not yet be full agreement. WHO 2017. All rights reserved
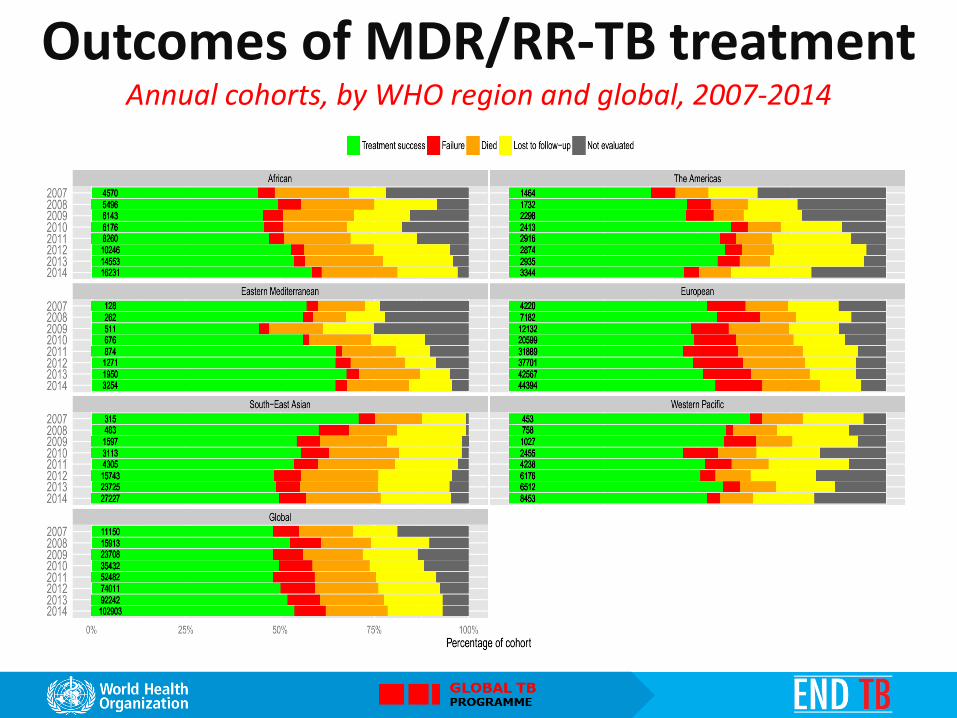
Outcomes of MDR/RR-TB treatment Annual cohorts, by WHO region and global, 2007-2014

*number of cases observed shown next to the bars
Outcomes of XDR-TB treatment 2014 cohort, by WHO region and global
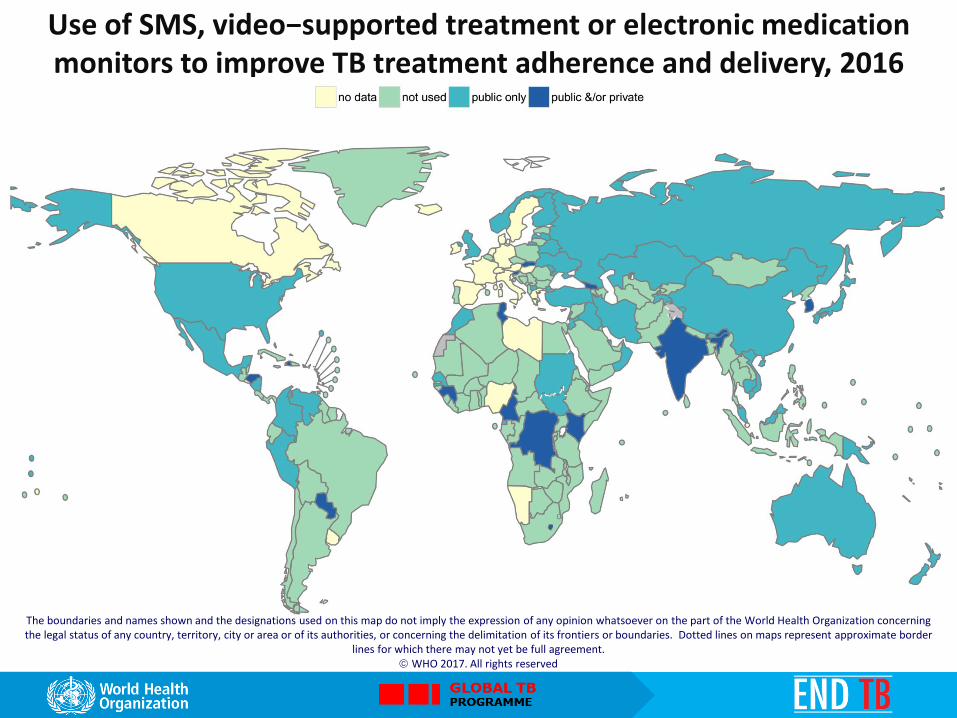
Use of SMS, video−supported treatment or electronic medication monitors to improve TB treatment adherence and delivery, 2016
The boundaries and names shown and the designations used on this map do not imply the expression of any opinion whatsoever on the part of the World Health Organization concerning the legal status of any country, territory, city or area or of its authorities, or concerning the delimitation of its frontiers or boundaries. Dotted lines on maps represent approximate border
lines for which there may not yet be full agreement. WHO 2017. All rights reserved

MDR/RR-TB and financing (1) Funding for prevention, diagnosis and treatment
by intervention area, 2006—2017 (constant 2017 US$ billions)
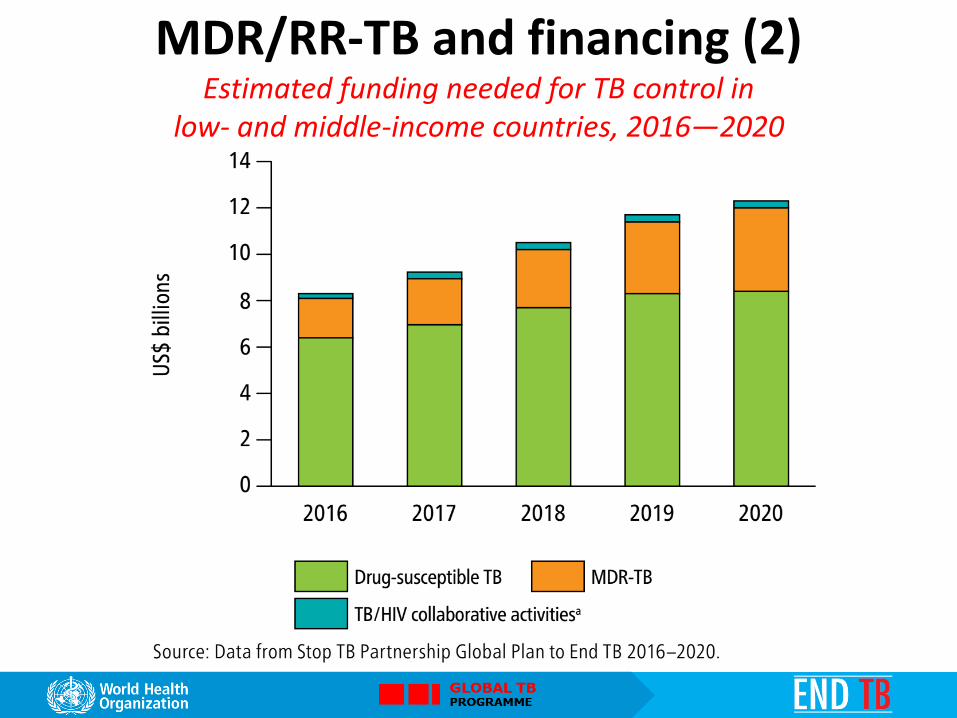
MDR/RR-TB and financing (2) Estimated funding needed for TB control in
low- and middle-income countries, 2016—2020

MDR/RR-TB and financing (3) Funding for drug-susceptible TB (green) and MDR-TB (brown), 2006–2017,
by country group (constant 2017 US$ millions)

MDR/RR-TB and financing (4) Estimated cost per patient treated for MDR-TB, 2016*
* Limited to 80 countries with at least 20 patients on MDR-TB treatment in 2016
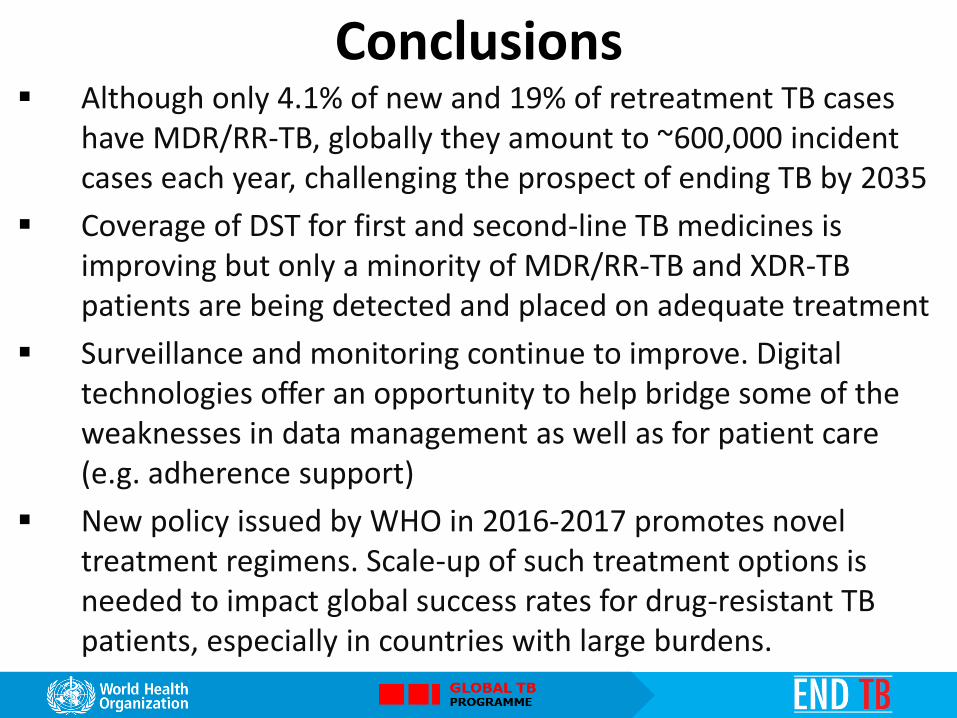
Although only 4.1% of new and 19% of retreatment TB cases have MDR/RR-TB, globally they amount to ~600,000 incident cases each year, challenging the prospect of ending TB by 2035
Coverage of DST for first and second-line TB medicines is improving but only a minority of MDR/RR-TB and XDR-TB patients are being detected and placed on adequate treatment
Surveillance and monitoring continue to improve. Digital technologies offer an opportunity to help bridge some of the weaknesses in data management as well as for patient care (e.g. adherence support)
New policy issued by WHO in 2016-2017 promotes novel treatment regimens. Scale-up of such treatment options is needed to impact global success rates for drug-resistant TB patients, especially in countries with large burdens.
Conclusions

5 priority actions In summary
© World Health Organization 2017 All rights reserved. Publications of the World Health Organization are available on the WHO web site (www.who.int) or can be purchased from WHO Press, World Health Organization, 20 Avenue Appia, 1211 Geneva 27, Switzerland (tel.: +41 22 791 3264; fax: +41 22 791 4857; e-mail: [email protected]). Requests for permission to reproduce or translate WHO publications – whether for sale or for noncommercial distribution – should be addressed to WHO Press through the WHO web site (http://www.who.int/about/licensing/copyright_form/en/index.html). The designations employed and the presentation of the material in this publication do not imply the expression of any opinion whatsoever on the part of the World Health Organization concerning the legal status of any country, territory, city or area or of its authorities, or concerning the delimitation of its frontiers or boundaries. Dotted lines on maps represent approximate border lines for which there may not yet be full agreement. The mention of specific companies or of certain manufacturers’ products does not imply that they are endorsed or recommended by the World Health Organization in preference to others of a similar nature that are not mentioned. Errors and omissions excepted, the names of proprietary products are distinguished by initial capital letters. All reasonable precautions have been taken by the World Health Organization to verify the information contained in this publication. However, the published material is being distributed without warranty of any kind, either expressed or implied. The responsibility for the interpretation and use of the material lies with the reader. In no event shall the World Health Organization be liable for damages arising from its use.

![In silico identification and characterization of a ... · In 2014, 1.5 million people died from TB, including 0.4 million people who were HIV-positive [1]. Apart from this, MDR-TB](https://static.fdocuments.in/doc/165x107/5f07aa307e708231d41e1e99/in-silico-identification-and-characterization-of-a-in-2014-15-million-people.jpg)


