Multidimensional Warnings: Evaluating Curve Warning ...
195
Multidimensional Warnings: Evaluating Curve Warning Stimuli in an On-Road Environment Melinda Jean McElheny Thesis Submitted to the Faculty of the Virginia Polytechnic Institute and State University in partial fulfillment of the requirements for the degree of Master of Science in Industrial and Systems Engineering Tonya L. Smith-Jackson, Ph.D., Co-Chair Myra Blanco, Ph.D., Co-Chair Brian M. Kleiner, Ph.D. September 6, 2005 Blacksburg, Virginia Keywords: age, auditory, curve, haptic, hazard perception, modality, on- road, risk-taking style, visual, warning Copyright 2005, Melinda J. McElheny
Transcript of Multidimensional Warnings: Evaluating Curve Warning ...

Multidimensional Warnings: Evaluating Curve Warning Stimuli
in an On-Road Environment
Melinda Jean McElheny
Thesis Submitted to the Faculty of the Virginia Polytechnic Institute and State University
in partial fulfillment of the requirements for the degree of
Master of Science in
Industrial and Systems Engineering
Tonya L. Smith-Jackson, Ph.D., Co-Chair
Myra Blanco, Ph.D., Co-Chair Brian M. Kleiner, Ph.D.
September 6, 2005 Blacksburg, Virginia
Keywords: age, auditory, curve, haptic, hazard perception, modality, on-road, risk-taking style, visual, warning
Copyright 2005, Melinda J. McElheny
M u l t i d i m e n s i o n a l W a r n i n g s : E v a l u a t i n g C u r v e W a r n i n g S t i m u l i
i n a n O n - R o a d E n v i r o n m e n t
Melinda J. McElheny
A B S T R A C T
Horizontal curves on roadways are the site of numerous crashes and motorist deaths each year. Traditional methods to warn drivers of curve hazards, including static roadside signs, are sometimes ineffective at influencing driver behavior for reasons such as driver acclimation to inconsistency in posted advisory speeds. In-vehicle curve warning devices (CWDs) may be an effective alternative for reducing the number of collisions at curves. Multi-modality displays have elicited positive driver results and should be further explored. The objective of this study was to determine the most effective curve warning system using on-road performance and subjective evaluation. Two top-performing warning stimulus presentations, as determined by a recent simulator study, were tested at the Virginia Smart Road closed test highway. Both warnings exhibited auditory (speech) and visual (Heads Down Display) stimuli, however one included a throttle pushback haptic stimulus and the other did not. No on-road studies of this type of haptic stimulus, nor of CWDs, have been published to date. Forty-eight individuals, 24 age 18-25 years and 24 age >60 years, participated in the study. A 2 (Age) x 3 (Stimulus Presentation) between-subjects design was used to examine participant performance and ratings for the first “surprise” experience with the stimulus while driving on the Smart Road, and a 2x3 mixed factors design examined stimulus as a repeated measure. Participant braking reaction times, speed, and subjective evaluations were compared between stimulus presentations as well as driver age. Throttle reaction times and brake reaction times were significantly quicker, and curve entry speed significantly closer to an advisory speed for participants receiving a warning presentation than those without a warning presentation at α=0.05. No statistical differences between objective measures were found between the stimulus presentation with the haptic and the stimulus presentation without the haptic stimulus. Age was a significant main effect as older drivers reached more appropriate curve entry speeds than younger drivers. Driver risk-taking style was significantly related to age and to curve entry speed. During an interview, participants demonstrated higher comprehension when presented with the stimulus lacking the haptic component, and ranked this presentation higher, though ratings gathered from questionnaires were not significantly different between the two stimulus presentations. Driver comments were examined using a content analysis technique organized by design guideline topics. Discussion was presented in terms of four main research questions and recommendations toward CWD design guidelines were developed based on the objective and subjective results of this study. In addition, this research developed a foundation for further on-road testing of CWDs and other multi-modal in-vehicle warning systems.

D E D I C A T I O N
I did this research for my Aunt Barb. Barb was killed in the Fall of 2001 when
her car ran off the road on a dangerous curve in rural New York State. For all of our
beloved family members and friends lost in crashes, I hope this research provides even
just a little fuel for the drive toward safer transportation.
iii

A C K N O W L E D G E M E N T S
I’d like to give a tremendous thanks to my advisory committee members for their
help with each stage of this process. To Dr. Myra Blanco who taught me so much and
spent so many hours helping me to do the best that I can. To Dr. Tonya Smith-Jackson
who always showed confidence in me, telling me that she knows I’ll be back for more
some day because she can see the passion for research in me. And to Dr. Brian Kleiner
who was supportive with his calm presence and sense of humor and who generously
offered presentation A-V assistance.
I would like to express my thanks to Dr. Michael Brown at the Virginia
Transportation Research Council for providing the funding for this project.
Data collection was a grueling process on the Smart Road and couldn’t have
occurred without the amazing help of Miguel Guerrero, Jared Bryson, Andy Alden, Ryan
Talbot, Fang Huang, Stacy Payne, Mark Young, Luke Neurauter, Julie Taverna, Leonore
Nadler and the Smart Road Dispatch crew who stayed awake and alert late at night for
me. Thanks to Jon and Angie Hankey and Deb Young for providing me with homes
away from home. And many thanks to the huge VTTI family as well as the caring and
supportive people in the HFEE department at Virginia Tech.
Finally, I cannot begin to say thank you enough to my loved ones. To my girls,
Sarah, Rachel, and Julianna – you have helped me to find a true “fabulous life” in
Blacksburg. And most of all to my Mom and Dad, thank you so much for your
unconditional support and love, even (especially) when I decided to become a Hokie.
iv

T A B L E O F C O N T E N T S
ABSTRACT.................................................................................................................. ii
DEDICATION ............................................................................................................. iii
ACKNOWLEDGEMENTS ......................................................................................... iv
TABLE OF CONTENTS.............................................................................................. v
LIST OF TABLES ........................................................................................................ x
LIST OF FIGURES..................................................................................................... xii
ACRONYM LIST...................................................................................................... xiv
CHAPTER 1 : INTRODUCTION ................................................................................ 1
Motivation ............................................................................................................1
Review of Literature.............................................................................................2
The Problem: Curve Hazards ........................................................................... 2
One Solution: Curve Warnings......................................................................... 2
Human Information Processing........................................................................ 9
Hazard Perception.......................................................................................... 11
Risk-Taking Style ............................................................................................ 12
Age and Driving Behavior .............................................................................. 13
Warning Modalities ........................................................................................ 15
Warning Urgency............................................................................................ 18
Effects of Warning False Alarms .................................................................... 20
Alarm Annoyance............................................................................................ 21
Summary ......................................................................................................... 22
CHAPTER 2 : RESEARCH OBJECTIVES ............................................................... 23
Rationale for the Study.......................................................................................23
Background.........................................................................................................24
Experimental Goal..............................................................................................25
Research Questions and Hypotheses ..................................................................25
Research Question 1: Stimulus Presentation and Performance..................... 26
Research Question 2: Age and Performance.................................................. 27
v
Research Question 3: Subjective Evaluation.................................................. 28
Research Question 4: Hazard Perception and Risk-Taking Style .................. 28
CHAPTER 3 : METHODS ......................................................................................... 30
Experimental Design ..........................................................................................30
Participants .........................................................................................................31
Independent Variables ........................................................................................31
Age .................................................................................................................. 31
Stimulus Presentations.................................................................................... 32
Dependent Variables...........................................................................................35
Objective Data Collection............................................................................... 35
Subjective Data Collection ............................................................................. 36
Overview of Variables: Warning Process Conceptual Model............................38
Apparatus............................................................................................................39
Smart Road...................................................................................................... 39
Research Vehicle and Data Collection Equipment......................................... 40
Curve Design ......................................................................................................45
Advisory Speed................................................................................................ 45
Warning Onset ................................................................................................ 46
Experimental Procedure .....................................................................................47
Participant Screening ..................................................................................... 47
Study Conditions ............................................................................................. 48
Participant Orientation................................................................................... 49
Data Collection............................................................................................... 50
Data Analysis......................................................................................................51
Data Reduction ............................................................................................... 51
Objective Data Analysis.................................................................................. 51
Subjective Data Analysis................................................................................. 53
CHAPTER 4 : RESULTS ........................................................................................... 54
Data Reduction ...................................................................................................54
Research Question 1: Stimulus Presentation and Performance..........................56
vi

Stimulus Presentation and Performance for the Surprise Stimulus
Presentation .............................................................................................. 56
Overall Stimulus Presentation and Performance ........................................... 59
Performance for Each Run ............................................................................. 61
Research Question 2: Age and Performance ......................................................63
Age and Performance ..................................................................................... 63
Age, Stimulus Presentation, and Performance ............................................... 64
Summary of Objective Measures Results........................................................ 64
Power Analysis for Between-Subjects Objective Measures............................ 65
Research Question 3: Subjective Evaluation......................................................67
Stimulus Comprehension Interview ................................................................ 67
Post-Condition Questionnaire ........................................................................ 68
Curve Warning Acceptance Questionnaire .................................................... 73
Research Question 4: Hazard Perception and Risk-Taking Style ......................76
Hazard Perception.......................................................................................... 76
Risk-Taking Style ............................................................................................ 79
CHAPTER 5 : DISCUSSION..................................................................................... 83
Research Questions Revisited ............................................................................83
Research Question 1: Stimulus Presentation and Performance..................... 83
Research Question 2: Age and Performance.................................................. 86
Research Question 3: Subjective Evaluation.................................................. 88
Research Question 4: Hazard Perception and Risk-Taking Style .................. 89
Limitations..........................................................................................................90
Loss of Data Points......................................................................................... 90
Brief Study Duration ....................................................................................... 91
Test Highway .................................................................................................. 91
CHAPTER 6 : CONCLUSIONS................................................................................. 92
Summary of Findings .........................................................................................92
Results and the Warning Process Model ............................................................92
Recommendations toward Design Guidelines....................................................95
Future Research ..................................................................................................95
vii

Stimuli Design................................................................................................. 95
Naturalistic Study............................................................................................ 96
The Potential for Multi-Modality Curve Warnings............................................97
REFERENCES............................................................................................................ 98
APPENDICES........................................................................................................... 105
Appendix A: Balanced Latin Square ................................................................106
Appendix B: Participant Recruitment Flyer .....................................................107
Appendix C: IRB..............................................................................................108
Appendix D: Sound Measurements of the Speech Stimulus............................114
Appendix E: Haptic Pedal Maintenance Protocol ............................................115
Appendix F: Stimulus Comprehension Interview ............................................117
Appendix G: Post-Condition Questionnaire.....................................................118
Appendix H: Curve Warning Acceptance Questionnaire.................................119
Appendix I: Hazard Perception Questionnaire.................................................120
Appendix J: Risk-Taking Style Questionnaire .................................................122
Appendix K: Advisory Speed Calculation .......................................................124
Appendix L: Warning Distance Onset Calculations.........................................125
Appendix M: Participant Screening Questionnaire ..........................................126
Appendix N: Informed Consent Form I ...........................................................129
Appendix O: Virginia Tech W-9 Tax Form .....................................................133
Appendix P: Vision and Hearing Tests Form...................................................135
Appendix Q: Sound Level Measurements for Each Hearing Test Tone ..........136
Appendix R: Greeter Protocol ..........................................................................138
Appendix S: Experimenter Protocol.................................................................145
Appendix T: On-Road Participant Debriefing Script .......................................154
Appendix U: Informed Consent Form II ..........................................................155
Appendix V: Participant Debriefing and Payment Form .................................156
Appendix W: ANOVA Tables .........................................................................157
Appendix X: Stimulus Comprehension Interview Participant Comments
and SC Score...............................................................................................168
Appendix Y: Post-Condition Questionnaire Open-Ended Responses..............175
viii

Appendix Z: Curriculum Vita...........................................................................179
ix

L I S T O F T A B L E S
Table 1.1: Images of three curve warning types tested (Charlton, 2004, p. 879). ........5
Table 1.2: Summary of visual warning attributes........................................................15
Table 1.3: Summary of auditory warning attributes....................................................16
Table 1.4: Summary of haptic warning attributes. ......................................................17
Table 1.5: Criticality Rating Scale (ISO, 2003, p. 6). .................................................19
Table 1.6: Urgency Rating Scale (ISO, 2003, pp. 6-7)................................................19
Table 1.7 Signal Detection Theory as applied to curve warnings. ..............................20
Table 3.1: Experimental design - between-subjects for first “Surprise” Stimulus
Presentation. ..........................................................................................................30
Table 3.2: Experimental design – mixed factors. ........................................................31
Table 3.3: Photographs of curve signage on the orientation route.............................50
Table 3.4 ANOVA degrees of freedom for between-subjects design. ..........................52
Table 3.5 ANOVA degrees of freedom for mixed factors design. ................................52
Table 4.1: Descriptions of removed data points..........................................................55
Table 4.2: Adjusted participant counts for each stimulus presentation and
objective dependent variable. ................................................................................55
Table 4.3: Mean (M), n, and Standard Error (SE) for Surprise Stimulus
Presentation performance measures (n is the number of measurements
included out of 16 possible). ..................................................................................57
Table 4.4: Participant reactions to the “surprise” grouped by Stimulus
Presentation. ..........................................................................................................59
Table 4.5: Mean (M), n, and Standard Error (SE) for each stimulus presentation
overall. ...................................................................................................................60
Table 4.6: Summary of significant main effects and interactions for the between-
subjects objective measures ANOVA. ....................................................................65
Table 4.7: Summary of significant main effects and interactions for the mixed
factors objective measures ANOVA. ......................................................................65
Table 4.8: Power analysis results for the between-subjects design categorized
by each source (N Total is the whole sample size, not the n for each cell). ..........66
x
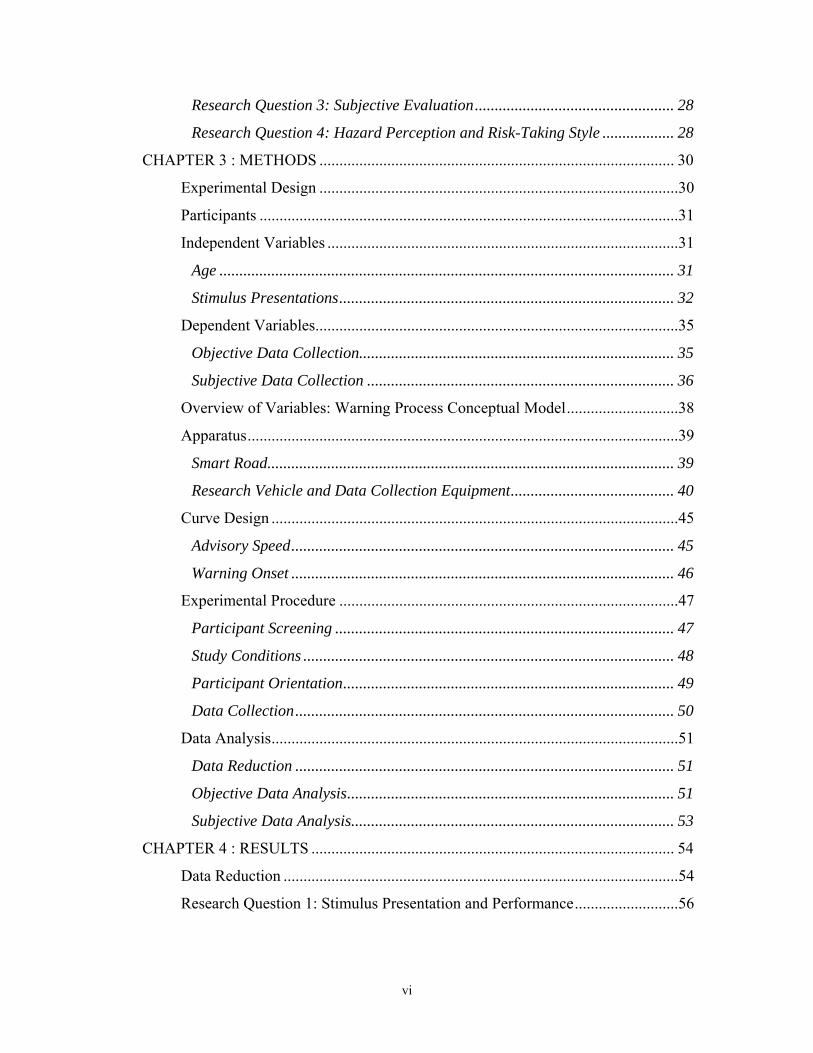
Table 4.9: Total number of participants receiving each stimulus comprehension
rating (Low, Medium, or High) for the two stimulus presentations. .....................68
Table 4.10: Summary of significant main effects and interactions for the Post-
Condition Questionnaire mixed factors ANOVA. ..................................................69
Table 4.11: Codes and code definitions developed for the Post-Condition
Questionnaire content analysis based on human factors design guidelines..........72
Table 4.12: Frequency for each code in responses to the Post-Condition
Questionnaire open-ended item, ““Would you change something about the
warning? If yes, what would it be?”.....................................................................73
Table 4.13: Pearson Correlation for Hazard Perception Questionnaire Ratings
and overall Score with Public and Smart Road Curve Entry Speeds
(Significant cells are highlighted)..........................................................................79
Table 4.14: Pearson Correlation for Risk-Taking Style Questionnaire Ratings
and overall Score with Public and Smart Road Curve Entry Speeds
(Significant cells are highlighted)..........................................................................82
xi
L I S T O F F I G U R E S
Figure 1.1: Warning Process Model (Rogers et al., 2000, p. 105). ............................10
Figure 3.1 Visual icon for left-handed turn with 15mph advisory speed. ...................33
Figure 3.2: HDD location on dash. .............................................................................33
Figure 3.3: HDD..........................................................................................................33
Figure 3.4: Analog force meter used to measure throttle push-back force. ................35
Figure 3.5: Conceptual model detailing variables for the study as they relate to
the warning process (Adapted from the model in Rogers et al., (2000), p.
105). .......................................................................................................................38
Figure 3.6: Diagram of the Smart Road......................................................................40
Figure 3.7: Photograph of the Bottom Turnaround at the end of the Smart Road......40
Figure 3.8: Research vehicle, Cadillac Deville DTS...................................................41
Figure 3.9: Custom-built hand brake accessible to backseat passenger.....................42
Figure 3.10: Nitrogen tank located in trunk used to power throttle push-back as
well as emergency brake........................................................................................42
Figure 3.11: Data collection hardware located in trunk.............................................43
Figure 3.12: Experimenter data collection interface. .................................................44
Figure 3.13: Mounted camera in experimental vehicle...............................................44
Figure 3.14: Four camera views (Image taken while driving the orientation
route on public roads)............................................................................................45
Figure 3.15: Diagram of points of interest on the Smart Road curve. ........................47
Figure 4.1: Bonferonni post-hoc results for Reaction Times by Surprise
Stimulus Presentation (Means with the same letter are not significantly
different).................................................................................................................57
Figure 4.2: Bonferonni post-hoc results for Smart Road Curve Entry Speed by
Surprise Stimulus Presentation (Means with the same letter are not
significantly different)............................................................................................58
Figure 4.3: Bonferonni post-hoc results for Reaction Times by Stimulus
Presentation (Means with the same letter are not significantly different).............60
xii
Figure 4.4: Bonferonni post-hoc results for Curve Speed Entry by Stimulus
Presentation (Means with the same letter are not significantly different).............61
Figure 4.5: Bonferonni post-hoc results for Reaction Times by Run (Means with
the same letter are not significantly different). ......................................................62
Figure 4.6: Bonferonni post-hoc results for Curve Entry Speed by Run (Means
with the same letter are not significantly different). ..............................................62
Figure 4.7: Means and standard errors for SRspeed by Age for the Surprise
Stimulus Presentation and for All Stimulus Presentations Combined...................63
Figure 4.8: Interaction of Stimulus Presentation and Age for TRT. ...........................64
Figure 4.9: Mean ratings and standard errors for Post-Condition Questionnaire
Items by Driver Age ...............................................................................................69
Figure 4.10: Mean ratings and standard errors for Post-Condition
Questionnaire items (Age by Stimulus Presentation). ...........................................70
Figure 4.11: Mean ratings and standard errors for Post-Condition
Questionnaire items (Age by Surprise Stimulus Presentation)..............................70
Figure 4.12: Mean ratings for the significant interaction of Age and Stimulus
Presentation for the item, "If my car was equipped with a curve warning
device, I would want this type of warning to be presented." .................................71
Figure 4.13: Mean ratings and standard errors for Curve Warning Acceptance
Questionnaire items by Age. ..................................................................................74
Figure 4.14: Total participant responses categorizing stimulus presentations as
“most liked” and “least liked.”.............................................................................75
Figure 4.15: Percentages in which the stimulus presentation chosen as least
liked was presented in each Run............................................................................75
Figure 4.16: Mean ratings and standard error bars for Hazard Perception
Questionnaire items by Age. ..................................................................................76
Figure 4.17: Response percentages for the Hazard Perception Questionnaire
Item, "When did you first become aware of the sharp curve (turnaround
loop) at the end of the Smart Road?".....................................................................77
xiii

Figure 4.18: Mean SRspeed and standard errors for participants reporting that
they “First noticed the curve: Prior to the warning,” “During the warning,”
and “After the warning.”.......................................................................................78
Figure 4.19: Mean ratings and standard errors for Risk-Taking Style
Questionnaire items by Age (Questions 1-6). ........................................................80
Figure 4.20: Mean ratings for Risk-Taking Style Questionnaire items by Age
(Questions 7-12).....................................................................................................80
Figure 4.21: Mean Risk Scores by Age........................................................................81
Figure 6.1: Original Warning Process Model developed for the current study
(changes based on results of this study are highlighted). ......................................94
Figure 6.2: Warning Process Model modified to reflect results from the current
study. ......................................................................................................................94
A C R O N Y M L I S T
AASHTO – American Association of State Highway and Transportation Officials
ATIS – Advanced Traveler Information System
A-V – Audio-Visual Stimulus Presentation
BRT – Brake Reaction Time
C-HIP – Communications Human Information Processing model
CMS – Changeable Message Sign
CWD – Curve Warning Device
H – Hypothesis
H-A-V – Haptic-Audio-Visual Stimulus Presentation
HDD – Heads Down Display
HUD – Heads Up Display
IRB – Institutional Review Board
ISO – International Organization for Standardization
ITS – Intelligent Transportation Systems
IVCAWS – In-Vehicle Collision Avoidance Warning System
JND – Just Noticeable Difference
LCD – Liquid Crystal Display
xiv

MUTCD – Manual on Uniform Traffic Control Devices
PRspeed – Public Road Curve Entrance Speed
SAE – Society of Automotive Engineers
SRspeed – Smart Road Curve Entrance Speed
RQ – Research Question
TRT – Throttle Reaction Time
VTTI – Virginia Tech Transportation Institute
xv

C H A P T E R 1 : I N T R O D U C T I O N
Mot ivat ion
In 2003, more than 42,000 people were killed in fatal crashes on United States
highways. Of these fatal crashes, approximately 25% occurred on horizontal curves
(National Highway Traffic Safety Administration, 2004a). In addition to these fatality
statistics, it has been found that the accident rate for horizontal curves is about three times
the average accident rate for straight highway segments (Torbic, Harwood, Gilmore,
Pfefer, Neuman, Slack, & Hardy, 2004). These considerable figures have prompted
federal organizations, research institutes, and vehicle manufacturers to explore ways to
mitigate the accidents that occur on curved roadways.
Crashes on curves are sometimes attributed to poor weather, roadway design or
condition, or some other external circumstance. The majority of crashes, however, are
attributed to driver behavior (Persaud, Retting, & Lyon, 2000). Causation for crashes is a
complicated mixture of many different agents. The human factors in curve accident
causation may include driving at an unsafe speed, driver distraction, overconfidence,
and/or under-experience. Though it is important for engineers and researchers to address
the physical infrastructure factors in roadway safety, these factors may not address the
whole problem. Improvements focusing on the human component of the equation need
to be explored.
One method of driver support currently under evaluation is an in-vehicle curve
warning device (CWD). The number of Intelligent Transportation Systems (ITS) has
been growing rapidly over the past decade. With this rapid development comes a great
need for empirical testing to determine the safety and success of new technologies.
Simulator studies have examined the performance of CWD (Comte & Jamson, 2000;
Neurauter, 2004), however additional research, especially occurring in an on-road setting,
is necessary to determine the capabilities of this technology. If designed properly, ITS,
specifically curve warnings, have the potential to save thousands of lives each year.
1
Review o f L i terature
The Problem: Curve Hazards
Excessive speed and miscalculated maneuvers can create a very dangerous
situation on curved roadways. Outcomes include run-off-road accidents, collision with
fixed objects, head-on crashes, and rollovers. Run-off-road and hit fixed object crashes
are more numerous at curves and turns than along other sections of roadway (Fleming,
2004; Hood, 2001). Approximately 76% of curve-related fatal crashes were single-
vehicle crashes in which the vehicle left the roadway and either hit a fixed object or
rolled over and 11% of the curve-related fatal crashes were head-on crashes (Torbic et al.,
2004). The ratio for rollover odds among single-vehicle fatal crashes was 2.15 for curved
verses straight roadways from 1995 to 1998 (Farmer & Lund, 2002). Rollover risk was
highest on rural curves, but rollover risk was also high for young drivers of smaller light
trucks on urban curves. The geometry of a curved roadway creates an implicit hazard.
Not only are crashes on curves numerous, but they are also more likely to be fatal.
Crashes in which the vehicle failed to negotiate a curve were 4.7% of total crashes, but
about three times that (14%) of fatal crashes (O'Connor, 2004). Other counts have also
indicated that motor-vehicle crashes on curved roadway sections are more frequent and
severe than crashes on straight sections. A study of statistics from the Fatality Analysis
Reporting System (FARS) and the National Automotive Sampling System (NASS) found
that more than twice as many people were in crashes per mile of curved road compared
with straight sections, and crashes on curves resulted in three times as many fatalities per
mile as crashes on straight sections (Persaud et al., 2000).
One Solution: Curve Warnings
Safety professionals have developed a hierarchy of methods of hazard control:
1)Design out, 2)Guard, 3)Warn (Laughery & Hammond, 1999). Designing a hazard out
of a system is the most desirable solution; however this is not always possible. In the
case of roadway design, curves are often unavoidable and thus cannot be designed out.
Certain guards do exist in driving such as barriers, guard rails, airbags, and seatbelts,
however these are reactive measures rather than proactive in preventing crashes.
2
Warnings are third in the hierarchy because it is often difficult to influence behavior. In
the case of curve dangers, however, the prevalence of roadway curves and the cost of
installing and maintaining guards at each may prove warnings to be a viable approach in
improving curve safety.
Another hierarchy of engineering responses, directed toward collision mitigation,
can be designed on three levels (O'Connor, 2004). The first, and least invasive, is the
warning or advisory based on sensors inside or outside the vehicle. The second and more
severe responses are those that take over partial control of the vehicle by actions such as
tightening seatbelts and/or decreasing vehicle speed without driver action. The most
invasive response is to assume total control of the vehicle. Curve and other collision
warning systems exist on the principle that enabling drivers to accurately recognize their
environment will enhance their safety. If these technologies work, they could not only
save lives and money, but may also help to correct some unsafe driver behaviors.
Traditional curve warning signs. Warning signs and advisory speed plates
have been used to inform unfamiliar drivers of possible hazardous situations at curves for
many years. Hood (2001) explains guidelines for these signs including arrow symbol
shapes, advisory speeds, and placement. Several sources indicate that warning signs
reduce the occurrence of accidents at curves (Bhullar, Moore, & Cutler, 1993; Donald,
1997); however, few recent studies have examined the effectiveness of this method in
detail.
A study by Chowdhury, Warren, Bissell, and Taori (1998) identified several
shortcomings of the traditional hazard warning system. Methods for setting advisory
speeds have remained relatively unchanged since the 1930’s and were hypothesized to be
too conservative for today’s vehicles. In the study, 28 sites on two-lane highways in
three different states were selected to assess the advisory speeds as well as monitor the
compliance of traffic to the posted speeds. Researchers found that at most curves,
prevailing traffic speed was well above advisory speeds posted on the signs. They also
found that many posted advisory speeds were below the recommended values as
determined by either of the two standard advisory speed calculation methods used in the
United States; the ball bank method and the advisory speed formula (see descriptions of
these methods in Neurauter, 2004 and in the American Association of State Highway
3

Transportation Officials, 2001). Though signs advised drivers to slow down an average
of 15 miles per hour, most only slowed an average of 6 miles per hour. The combination
of already conservative methods with additionally conservative signage created a large
mismatch between suggestion and practice.
Because there is some subjectivity in the suggested methods of advisory speed
posting, there is a lack of uniformity between speeds posted in different states.
Chowdhury et al. (1998) found notable differences in advisory speeds posted in
Maryland, Virginia, and West Virginia. This poses a problem as motorists may become
accustomed to speed signs that are much more conservative than necessary for their
driving comfort. The motorist may then encounter less conservative speed postings and
choose an unsafe speed based on past experience.
Even if the driver is in compliance with the advised speed, the speed may not be
appropriate for the vehicle in question. Advisory speed guidelines were originally
designed for passenger vehicles in daylight with clear weather (Donald, 1997). Trucks
and sport utility vehicles exhibit different performance dynamics than cars; therefore,
roadside advisory speeds may not be correct for such vehicles to safely maneuver curves.
One option suggested in response to this discrepancy is to install separate truck advisory
speed signs (Donald, 1997). Rather than adding more visual clutter to the roadside
environment, in-vehicle warnings designed to support individual vehicle capabilities may
be a more appropriate solution.
Non-traditional curve warning signs. Because several studies have
indicated that traditional curve warning signs can be ineffective in influencing motorists’
speeds, a number of institutions are examining the effectiveness of new warning sign
designs. Researchers in New Zealand measured drivers’ speed selection after they were
presented with roadside curve speed warnings in a driving simulator (Charlton, 2004).
Three warning types were tested: (a) a diamond warning sign with curved arrow plus a
curve advisory speed, similar to traditional signage, (b) chevron warning with advisory
speed, and (c) road marking warning with advisory and transverse lines painted on the
pavement approaching the curve (Table 1.1).
4

Table 1.1: Images of three curve warning types tested (Charlton, 2004, p. 879).
a) Diamond warning sign with curved arrow plus curve advisory speed
b) Chevron warning with advisory speed
c) Road marking warning with advisory and transverse lines painted on pavement approaching curve
There were also three types of curves in the study from smallest radii (most “severe”), to
be driven at 28 mph (45 km/h), middle at 40 mph (65 km/h), and largest at 53 mph (85
km/h). Seventeen female and 13 male participants, age 17 to 68 years (mean 28.43
years), performed multiple tasks including driving the simulated curved road, detecting
signals in the form of road signs, road markings, and vehicle dash lights, and performing
secondary cell phone tasks of varying levels of difficulty. Results indicated that drivers’
speed decreased in the presence of each of the warnings as compared to a no warning
condition for the most severe curves (45 km/h), regardless of the presence of a cell phone
task. In the pavement marking conditions, participants failed to slow on the 53 mph
curves, and the diamond signs were ineffective at slowing participants at both the 40 and
53 mph curves in the presence of secondary tasks. The author suggests that the chevron
signs result in the slower speeds because they are more visible to drivers at greater
distances than the pavement markings, and because the signs highlight the shape of the
upcoming curves, suggesting that they contain additional perceptual cues. Charlton
concludes that curve warnings that emphasize the physical features of the roadway
curvature work best.
Several studies have evaluated the effectiveness of roadside dynamic signs;
devices that measure motorists’ speed and display personalized speed information. The
Minnesota Department of Transportation conducted a study of a dynamic warning device
(Preston & Schoenecker, 1999). In this study, the dynamic device consisted of a radar
5

system to detect vehicle speed. For all vehicles traveling at a speed higher than 53 mph,
video and speed data were recorded, and the system randomly chose half of the vehicles
to display the message “CURVE AHEAD – REDUCE SPEED” for 10 seconds. A total
of three sign categories were examined:
1. Static Curve Ahead Warning Sign + LED “CURVE AHEAD” Message
2. Static Curve Ahead Warning Sign + Alternating LED “CURVE AHEAD” /
“REDUCE SPEED” Message
3. Static Curve Ahead Warning Sign
Two main questions were addressed in this research: 1) Is there a relationship
between a vehicle’s speed during the approach to a curve and the ability to successfully
navigate the curve? and 2) Is there a difference between static and dynamic signing in the
ability to reduce the speed of high-speed vehicles? Field data including speed and video
of lane behavior were collected for 2,600 vehicles over four days. Results indicated that
the speed of a vehicle prior to entering a curve is significantly related to the probability of
successfully navigating the curve. Overall, the effect of the dynamic sign on vehicle
speed was relatively small; however the dynamic system had a greater effect on high-
speed vehicles than the static curve warning sign.
In California, the Advanced Curve Warning Project also examined the success of
interactive curve warning signs (Wenham, 2000). Results of a seven-month test period
indicated a reduction of truck collision rate from 6.4 to 1.4 per year. The advanced curve
warning systems combined speed-measuring radar and 7 x 10 foot changeable message
signs (CMS). The LEDs displayed warning messages that included “YOUR SPEED XX
MPH,” “XX MPH CURVES,” a graphic of a truck tipping over, and a graphic of a curve
warning sign. Since the implementation of the CMS, the average number of annual
tractor-trailer collisions has dropped to less than two. The researchers attributed much of
this drop to the presence of the warning system. One drawback of the system as
identified by the authors was limitations of radar: improper aim causes the system to
detect traffic on the opposite side of the freeway creating inaccurate displays to drivers.
In-Vehicle Curve Warning Potential. In response to the shortcomings of
roadside signs, researchers are exploring the option of an in-vehicle curve warning
system. These devices may be able to help drivers anticipate hazards without degradation
6

by weather conditions, physical obstruction or wear of the sign, or driver inattention.
Hypothetically, in-vehicle curve warning devices could alert a driver if he or she is
approaching a curve at an unsafe speed.
Comte and Jamson (2000) compared both external and in-vehicle curve warning
devices using a driving simulator. These devices included transverse bars (pavement
marking with decreasing spacing), a variable message sign (dynamic display including
advisory speed and driver’s license plate), an in-vehicle Liquid Crystal Display (LCD) (to
left of instrument panel displaying advisory speed), and a speed limiter (automatically
reduces vehicle speed to advisory speed). Performance measures included percentage of
speed reduction completed before curve entry, steering performance, and curve
negotiation speed in relation to advisory speed. As expected, the automatic speed limiter
affected drivers’ speeds the most, as it directly controlled vehicle speed at curves. This
device, however, was rated unacceptable by drivers because it was more obtrusive and
took control from the drivers. Contrary to initial speculation, driver performance
indicated no disruption caused by the presence of an in-vehicle visual stimulus. Results
indicated that each of the devices was effective in significantly reducing speeds when
activated.
Various types of technology exist which could support the development of an in-
vehicle curve warning system. In the August 2002 edition of ITS View, Dr. Ralf G.
Herrtwich, head of Telematics and E-business, Research and Technology for
DaimlerChrysler AG commented on the emerging applicability of digital roadmaps. The
curve warning device under development by DaimlerChrysler utilizes safety-relevant
information stored in digital maps. Herrtwich explains the device as follows:
It uses the road map data to calculate the topography of the
highways. The radius of curvature gives an indication of the speed
at which this curve can be safely negotiated. If the navigation
system determines that the vehicle is approaching a curve at
excessive speed, it first issues a visual warning in the display, e.g.
in the form of an illuminated miniature curve warning sign. If the
driver then fails to brake, he or she additionally receives an
acoustical warning.
7

For this technology to be successful, curves need to be registered with sufficient
precision. The system is to not only retrieve information from the outside conditions, but
also recognize and register the driver’s style, adapting threshold values to the individual
driver (Herrtwich, 2002). Other research is being conducted at Ohio State University to
also determine the performance of a curve warning system that utilizes digital mapping
technology (Ohio State Center for Mapping, n.d.).
Technology for Advanced Traveler Information Systems (ATIS) is in rapid
development, from digital entertainment and communications technology to navigation
systems and vehicle warning displays. In relation to in-vehicle warning display design, a
simulator study conducted by Neurauter (2004) examined the effectiveness of twenty-
four combinations of stimuli in presenting curve warnings. Modalities and presentation
formats included the following:
• Visual
o Heads Down Display (HDD)
o Heads Up Display (HUD)
• Auditory
o Icon (tire screech)
o Tone
o Speech
• Haptic (throttle push-back)
Objective measures included speed, lane position, and braking, and subjective measures
included ratings of acceptability gathered from younger (18-25 years old) and older (>60
years old) participants. Results suggested that the speech stimulus was the most
appropriate of the auditory modality for both objective and subjective measurements.
Objectively, the HDD and HUD were comparable with respect to performance, although
the participants tended to favor the HDD with their subjective ratings. The throttle push-
back was not successful when presented alone, however the speech, HDD, and throttle
push-back combination warning elicited the second best subjective and objective results
overall. Ranking slightly above this multi-modality display was the top-performing
combination of the speech and HDD (no haptic stimulus included).
8

Human Information Processing
Some of the human responses to warnings can be explained by fundamental
principles of human information processing. The Communication Human Information
Processing (C-HIP) Model is one framework that describes how people process warnings
and other forms of communication (Wogalter, DeJoy, & Laughery, 1999). The model is
a flow chart that combines the communication model (source, channel, and receiver) with
the human information processing framework (stages associated with the receiver).
Human information processing has been simplified in this model to create a serial process
that can generalize to any form of communication, though the authors acknowledge that
the chain of events is not always linear.
Using elements similar to the ones in the C-HIP Model, but tailoring the model
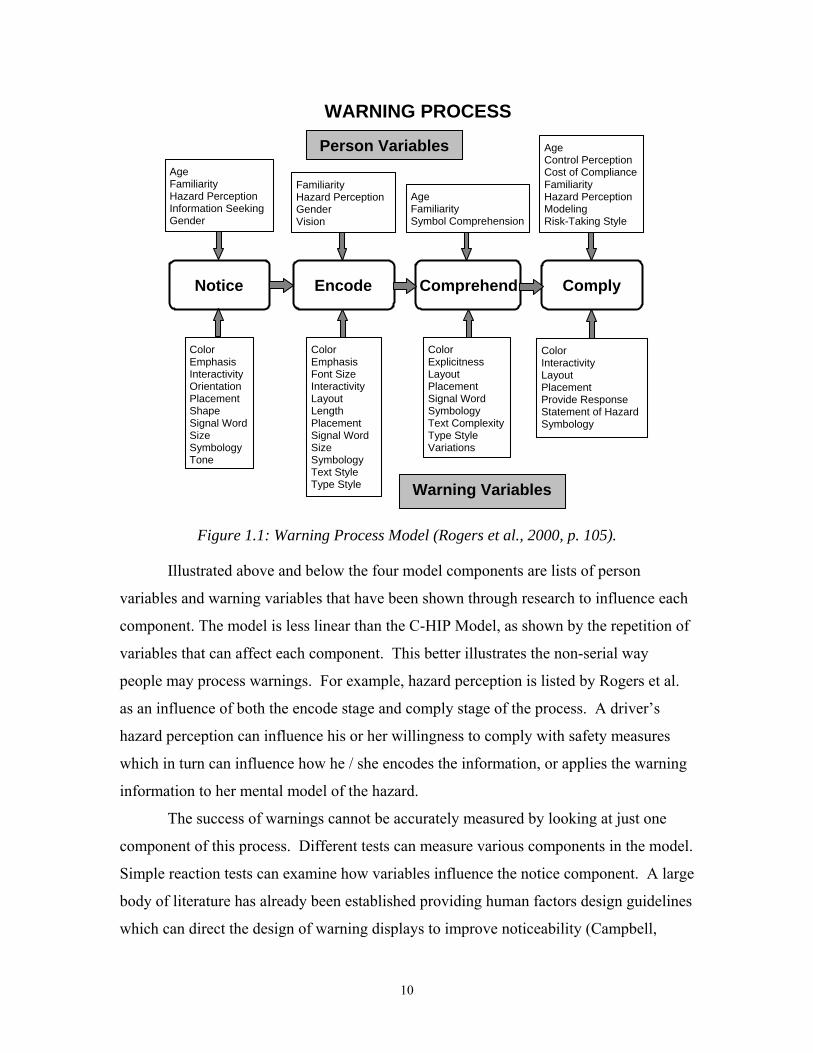
specifically to warnings, Rogers, Lamson, and Rousseau (2000) describe the less serial
nature of warning processing. It should be noted that Rogers et al. used only visual
warning literature to fill in variables in the model, though it can still translate to the
processing of other warnings. The main warning process components are notice, encode,
comprehend, and comply (Figure 1.1). These broad components were defined as follows:
• Notice the warning – attention is directed to the warning
• Encode the warning – external information is translated into some internal
representation through reading words, processing symbols, and so on
• Comprehend the warning – the meaning of the warning is understood
• Comply with the warning – behavior is in accordance with the warning
9
Notice Encode Comprehend Comply
Age Familiarity Hazard Perception Information Seeking Gender
Familiarity Hazard Perception Gender Vision
Age Familiarity Symbol Comprehension
Age Control Perception Cost of Compliance Familiarity Hazard Perception Modeling Risk-Taking Style
Person Variables
Color Emphasis Interactivity Orientation Placement Shape Signal Word Size Symbology Tone
Color Emphasis Font Size Interactivity Layout Length Placement Signal Word Size Symbology Text Style Type Style
Color Explicitness Layout Placement Signal Word Symbology Text ComplexityType Style Variations
Color Interactivity Layout Placement Provide Response Statement of Hazard Symbology
Warning Variables
WARNING PROCESS
Figure 1.1: Warning Process Model (Rogers et al., 2000, p. 105).
Illustrated above and below the four model components are lists of person
variables and warning variables that have been shown through research to influence each
component. The model is less linear than the C-HIP Model, as shown by the repetition of
variables that can affect each component. This better illustrates the non-serial way
people may process warnings. For example, hazard perception is listed by Rogers et al.
as an influence of both the encode stage and comply stage of the process. A driver’s
hazard perception can influence his or her willingness to comply with safety measures
which in turn can influence how he / she encodes the information, or applies the warning
information to her mental model of the hazard.
The success of warnings cannot be accurately measured by looking at just one
component of this process. Different tests can measure various components in the model.
Simple reaction tests can examine how variables influence the notice component. A large
body of literature has already been established providing human factors design guidelines
which can direct the design of warning displays to improve noticeability (Campbell,
10

Carney, & Kantowitz, 1998; Green, Levison, Paelke, & Serafin, 1995; Sanders &
McCormick, 1993). Encoding and comprehension of the information can be examined
using subjective measurement tools such as questionnaires and interviews. Compliance
with the warning is sometimes considered the ultimate test of warnings, and it is often the
most difficult to measure. Behavioral responses to warnings are evaluated using true
experiments involving participants exposed to simulated hazards and warnings. Results
of studies strictly examining compliance may not be generalizable to real-life instances of
hazards. In some cases it is beneficial to measure the users’ intent to comply, as
projected to a real-world situation (Silver & Braun, 1999). However, compliance, or
even intent to comply, does not examine the full range of factors that determine the
successfulness of warnings. By testing a number of person and warning variables and
their effects on various components of the Warning Process model, it is possible to have a
more complete view of the system and identify where problems exist to improve warning
design.
Hazard Perception
One of the person variables affecting warning compliance identified in the
Warning Process model is hazard perception (Rogers et al., 2000). Hazard perception is
an individual’s judgment of the degree of danger associated with a product, activity, or
situation. In a study measuring hazard perception, users of two different liquid chemical
products were more likely to comply with a warning to the degree that they perceived the
products as dangerous (Friedmann, 1988). In another study of hazard perception,
Vredenbugh and Cohen (1995) examined the perceptions and activities of scuba divers
and skiers. The researchers found that people who thought that the activity was more
dangerous were more likely to read and comply with safety precautions.
Specific to curve warning signs, studies have indicated a mismatch between the
hazard information presented to drivers, and driver compliance (Chowdhury et al., 1998).
Methods for determining curve advisory speeds have remained the same since their
creation in the 1930’s. Their development, therefore, was based on the capabilities of
vehicles in the 1930’s and may be too conservative for vehicle capabilities today. As
noted earlier, several studies have found low driver compliance with curve speed
11

advisories (Charlton, 2004; Chowdhury et al., 1998; Preston & Schoenecker, 1999). It
seems that drivers perceive curves to be less hazardous than advisory speed signs indicate
those curves to be, and are thus less likely to comply with curve warning advisory speeds.
Risk-Taking Style
As described in Rogers et al. (2000), risk-taking style has been found to influence
warning compliance. Willingness to engage in risk varies between individuals. The
amount of influence that warnings have on individuals’ risk-taking behavior may also
vary from person to person. In a study by Purswell, Schlegel, and Kejriwal (1986),
participants considered risk-takers based on a risk-taking attitude questionnaire were less
likely to comply with warnings indicating the safe use of tools. Similarly, a strong
correlation between risk-taking attitudes gathered using questionnaires and future risky
driving behavior was found in a study by Iversen (2004). Results in this study indicate
the usefulness of subjective measures of risk-taking style in predicting driver behavior.
Hazard perception and risk-taking style are interrelated concepts. Several studies
have examined participants’ perceptions of driving hazards and the participants’
corresponding risk-taking style. In a study by Lerner and Rabinovich (1997), seventeen
younger participants (age 16 and 17 years) and 17 older participants (25-47 years) viewed
20 video clips of driving scenarios from the driver’s view, 16 of which were potentially
hazardous situations. The participants then rated the scene on risk acceptance, degree of
risk, collision likelihood, and vehicle control ability. The ratings were examined between
the two Age groups, Genders, and interactions of the two. The effects of Gender and Age
were additive, as young males were the most “risk-prone” and older females the least
“risk prone,” without significant interaction effects. Specifically, younger male drivers
rated the scenes as less risky, collisions less likely, considered themselves to be better
able to handle the vehicle to avoid the hazard, and found the risks more acceptable than
any of the other groups. It has been found that the younger (16-20 years old) male
demographic group has substantially higher accident involvement rates than any other
group of drivers (NHTSA, 2003). Drivers age 16-20 have an accident rate per-mile
traveled that is about four times the crash rate of adults in other age groups. Thus this
12

group of drivers has been found to perceive driving scenarios to be less hazardous, report
riskier driving decisions, and exhibit higher real-world accident rates than other drivers.
Age and Driving Behavior
In addition to risk-taking style and hazard perception, age is a person variable that
affects the warning process. Age is also an important factor to examine when
considering transportation safety. The aging population is growing rapidly. In the past
10 years, the number of people age 70 and older increased twice as fast as the total
population. This age group makes up approximately 9% of the total U.S. population, but
accounts for close to 14% of all traffic fatalities and around 18% of all pedestrian deaths
annually (NHTSA, 2004b). Seniors drive markedly fewer miles per year than younger
drivers. According to a report by NHTSA, the vehicle miles traveled per year for the
previously mentioned older driver group (age 70+ years) is only 4% of the total vehicle
miles traveled (NHTSA, 1993). Since older drivers’ exposure to driving is much lower
than younger drivers’ exposure, the older group’s fatality statistics are even more
staggering.
Aging individuals experience some deterioration of psychophysiological
functions. A review of literature conducted by Owens and Lehman (2001) describes
some of these functions such as greater difficulty in simultaneously performing multiple
tasks, reduced functional field of view, and slower reaction time. In terms of reaction
times, Warshawsky-Livne and Shinar (2002) tested the capabilities of participants in
three age groups defined as young (18-25 years, mean of 23), middle (26-49 years, mean
of 30), and older (>50 years, mean of 62). Only the youngest and oldest groups were
significantly different from each other (p = 0.03).
Various studies specific to the transportation domain have found that older drivers
have delayed reaction times to the appearance of brake lights of a lead vehicle, difficulty
judging the distance to oncoming vehicles, and deterioration of steering tracking
performance with a slowing of steering angle input (Uno & Hiramatsu, 2001). One
study of driving performance and age found older drivers (>60 years) to have
significantly lower sign detection and recognition, peripheral reaction times, and driving
time than younger drivers (<30 years) (Wood, 1998). Participants drove on a closed
13

circuit course and identified traffic signs placed along the road. Of the 62 participants, 15
were normal-vision younger drivers, 26 were normal-vision older drivers, and 21 were
older drivers with a range of early visual impairments. Older drivers with normal vision
missed twice as many signs than the younger group with normal vision, and visually
impaired older drivers missed three times as many signs than the young normal group.
Only 11% of the variance could be attributed to differences in visual acuity. The author
suggested that the difference in performance could also be attributed to the possibility
that older individuals were less adept at dividing attention between concurrent tasks, in
this case driving, reacting to vehicle-mounted lights, and identifying signs. Wood
concluded that driving performance differences exist based on age irregardless of visual
acuity. In general, aging drivers can experience deterioration of perception, information
processing, and motor skills, thus increasing risk when encountering dangerous driving
situations.
A simulator study examined the capabilities of older drivers (>65 years versus
<60 years) when encountering a surprise emergent traffic situation in a simulator (Uno &
Hiramatsu, 2001). Findings indicated, as expected, that older drivers needed anywhere
from 1.35 to 2.7 seconds more than the younger drivers in order to successfully avoid the
oncoming hazard. Other results indicated that the older drivers had a much more
restricted steering velocity (250 deg/s) versus younger drivers (450 deg/s).
Encouragingly, older drivers’ avoidance performance improved greatly when presented
with an advanced auditory warning 3.0 seconds prior to their arrival at the simulated
intersection. If ITS design and development centers on the needs of older drivers, there is
potential to augment the older driver’s on-road experience to improve safety.
In summary, three different person variables are described in the previous
sections: risk-taking style, hazard perception, and age. Some research links these
variables with the way that people process warnings. The next few sections examine the
influence of specific warning variables on receiver performance. These variables include
modality, urgency, and false alarms.
14

Warning Modalities
Warning stimuli are traditionally presented to drivers in two forms: Auditory and
visual stimuli. Many studies have been performed to determine the most appropriate
form of these for different in-vehicle displays. Results from a wide range studies indicate
both strengths and weaknesses for both the auditory and visual modalities depending on
display characteristics, environment, operator characteristics, and driving situation
urgency. In addition to this huge body of results, researchers are investigating a new
form of warning stimuli: haptic displays which use movement or tactile means to transmit
information to the receiver. The major findings pertaining to modality and warning
design are highlighted in Table 1.2, Table 1.3, and Table 1.4.
Table 1.2: Summary of visual warning attributes.
Warning Type
Positive Attributes Negative Attributes
Visual
(Pictorial) Warnings in
General
Lee, Gore, & Campbell (1999) • Traditional means for
portraying driving information • The potential for higher
information rate • Less likely to startle Wogalter, Conzola, & Smith-Jackson (2002) • Can enhance comprehension
Sprenger (1993) • Compete with other visual
driving information • Less attention-grabbing Wogalter, DeJoy, & Laughery (1999) • Discriminability affected by
light conditions
Heads Down
Display (HDD)
Hanowski, Dingus, Gallagher, Kieliszewski, & Neale (1999) • Traditional location for in-
vehicle warnings and alerts; more easily recognized by older population
• May have increased discriminability due to better figure/ground contrast as compared to HUDs
Sprenger (1993) • May not be in line of sight –
result in eyes-off-road time
Heads Up Display (HUD)
Sprenger (1993) • May be more apt to notice; in
the line of sight • Shorter glance time necessary
Sprenger (1993) • Discriminability of HUD may
be compromised in bright conditions
• Visibility of road objects blocked by HUD
15

Table 1.3: Summary of auditory warning attributes.
Warning Type
Positive Attributes Negative Attributes
Auditory
Warnings in General
Lee et al. (1999) • Do not add to visual demand of
driving task Edworthy (1994) • Omnidirectional
Sanders & McCormick (1993) • Can be masked by radio or
other in-vehicle sounds Lee et al. (1999) • Can startle receiver
Tone
Lee et al. (1999) • Quickly attract attention; alert Edworthy (1994) • Short, simple • Discreet if situation alerting to
is embarrassing • Can be designed to portray
levels of urgency
Edworthy (1994) • Do not provide hazard details • Do not inform receiver of
specific correct response • Depending on design could
startle receiver
Speech
Wogalter, DeJoy, & Laughery (1999) • Can portray level of urgency Wogalter, Kalsher, & Racicot (1993) • May increase compliance
Edworthy (1994) • Can embarrass if not discreet • May take too long to convey
necessary info (if imminent situation)
Auditory
Icon
Belz, Robinson, & Casali (1999) • Can convey recognizable
meaning if match mental model Graham (1999) • Shorter driver-reaction times
than tones and speech
Graham (1999) • More false positives –
inappropriate response (accelerate when should apply brake)
• Can result in larger and more abrupt reactions
16

Table 1.4: Summary of haptic warning attributes.
Warning Type
Positive Attributes Negative Attributes
Haptic
Warnings in
General
Suzuki & Jansson (2003) • Do not add to visual demand of
driving task • If match mental model, can
elicit quick response
Suzuki & Jansson (2003) • Unfamiliar to receivers • May not be salient as an alert • Can startle • Can cause inappropriate
response or even opposite of desired response
Lloyd, Wilson, Nowak, & Bittner (1999) • Intrusive to receiver as cannot
be “shut out”
Throttle Push-Back
Janssen & Nilsson (1993) • Show positive results in vehicle
studies (reduction in collisions, increase in safe headway, fewer lane deviations)
Tijerina (2001) • Could stop more abruptly when
presented with a high brake pedal jerk rate
Manser, Ward, Kuge, & Boer (2004) • Decreased driver response time
and improved response appropriateness when alerting to lead vehicle braking in a simulator
Neurauter (2004) • May go unnoticed by driver if
foot is not positioned on pedal Manser et al. (2004) • Increase in driver decision time
when alerting to lead vehicle braking in a simulator
Steering Wheel
Feedback
Suzuki & Jansson (2003) • Can improve reaction time to
run-off-road hazards • Can assist in monitoring vehicle
lateral position (steering wheel vibration)
Suzuki & Jansson (2003) • More false positives –
inappropriate response (accelerate when should apply brake)
Seat Vibrations
Gray, Tan, & Young (2002) • Potential for improving
response times by cuing to changes in a scene
Hoffman, Lee, & Hayes (2003) • Rated to be trustworthy and
beneficial by drivers in a simulator study
Tijerina, Johnston, Parmer, Pham, & Winterbottom (2000) • Limited information can be
conveyed • Mostly used to alert to lane
violations (Virtual Rumble Strips)
17
Mutli-Modal Warnings. Several studies indicate that displays combining
several modalities lead to better performance (Belz et al., 1999; Labiale, 1990). In
driving tasks, vision is always engaged, therefore visual warning devices may be more
effective when an additional stimulus is presented (Liu, 2001). When a visual icon in the
dash cluster was accompanied by an auditory tone, reaction times in collision-avoidance
scenarios were almost one-third of the reaction times recorded when no warning was
presented (Hanowski et al., 1999). Warning developers need to be cautious about
presenting too many stimuli to the driver, as senses may become overloaded with the
proliferation of in-vehicle information systems, however multi-modal displays
demonstrate advantages that should be further explored.
Warning Urgency
The urgency of warnings varies depending on the driving situation, for example
some in-vehicle warnings inform the driver of low fuel level while others alert the driver
of a potential forward collision. The International Organization for Standardization (ISO)
issued a technical specification outlining a method to determine in-vehicle message
priority (International Organization for Standardization, 2003b). Table 1.5 and Table 1.6
describe the prioritization criteria, criticality and urgency, and levels of each. Using these
criteria, a curve warning may be rated a 2 for criticality, or “Injury or possible injury,”
and also rated 2 for urgency, or “Respond within a few seconds.” The combined rating
for a CWD would then be 4, whereas the highest priority messages are rated 6. This
categorization illustrates that the CWD is neither the most critical nor the most urgent
type of message system. It is important, then, that the level of criticality and urgency of
the curve hazard is accurately portrayed by the modalities and design of the curve
warning display.
18

Table 1.5: Criticality Rating Scale (ISO, 2003, p. 6).
Rating Risk to vehicle, occupants and / or pedestrians Examples
3 Severe or fatal injury
Ignoring speed warning when driving significantly above the speed limit. Collision as a result of loss of braking due to ignoring the brake failure warning. Departing roadway due to ignoring lane departure warning. Collision at high speed. Leaving the roadway, head-on collision and collision with structures at intermediate speed. Following vehicle ahead too closely at high speed.
2 Injury or possible injury Risk of collision due to following a vehicle ahead too closely at intermediate speed. Vehicle(side)-to-vehicle(side) collision due to ignoring collision warning at intermediate or low speed, vehicle leaving the road, head on collision and collision with structures at intermediate or low speed.
1 No injury (vehicle damaged)
Vehicle-to-vehicle collision except head-on collision at low speed. Following vehicle ahead too closely at low speed. Collision with structures at low speed.
0 No injury (no vehicle damage)
Vehicle-to-vehicle contact at very low speed. Collision with structures at very low speed.
Table 1.6: Urgency Rating Scale (ISO, 2003, pp. 6-7).
Rating Description Examples
3
Respond immediately Take immediate action or decision (within zero to three seconds) according to the displayed information.
Obstacle immediately in the vehicle path. Brake immediately. Steer to avoid dangerous situations. ACC malfunctioning.
2 Respond within a few seconds Take action or decision according to the information within 3 to 10 seconds.
Obstacle within a few seconds in the vehicle path. Brake in a few seconds. Steer away from danger as required.
1
Response preparation Prepare to take action or decision according to the information within 10 seconds to 2 minutes.
Onset of detection of an obstacle.
0 Information only No direct action or decision required by the driver
System on.
19
Effects of Warning False Alarms
Even if the physical characteristics of a warning are salient and understandable,
the warning can be unsuccessful if the underlying technology of the system is faulty.
Warnings must convey an appropriate level of sensitivity and reliability in alerting the
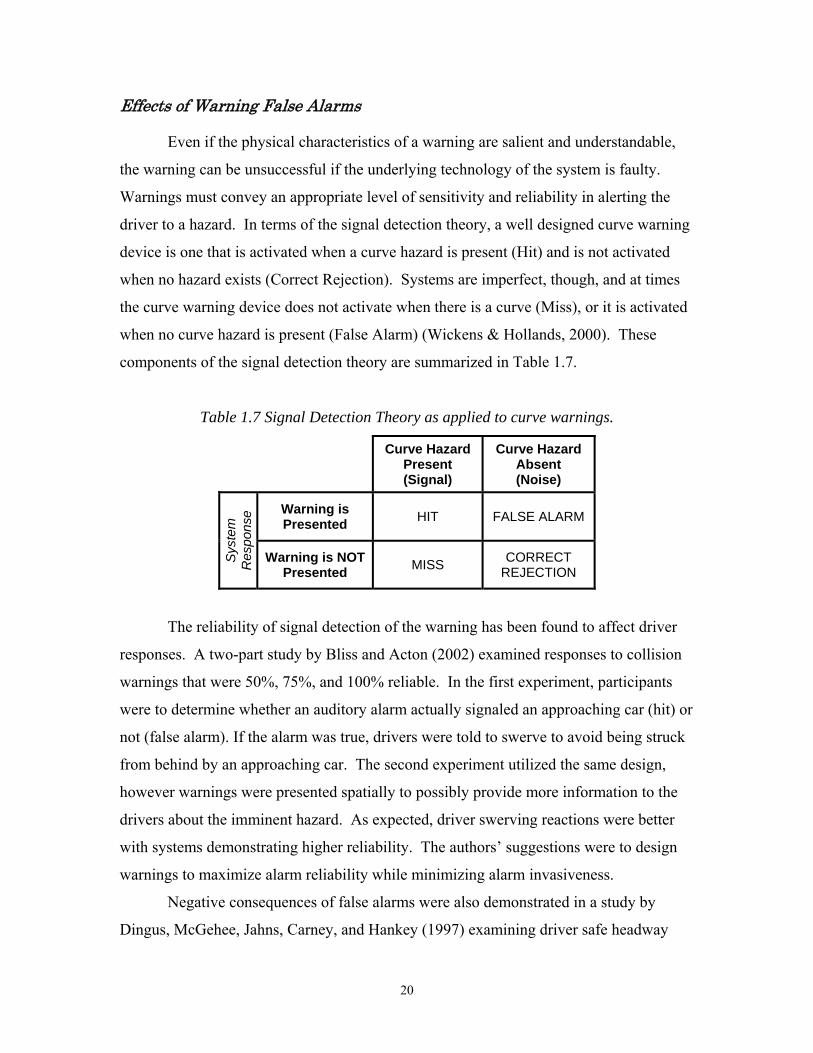
driver to a hazard. In terms of the signal detection theory, a well designed curve warning
device is one that is activated when a curve hazard is present (Hit) and is not activated
when no hazard exists (Correct Rejection). Systems are imperfect, though, and at times
the curve warning device does not activate when there is a curve (Miss), or it is activated
when no curve hazard is present (False Alarm) (Wickens & Hollands, 2000). These
components of the signal detection theory are summarized in Table 1.7.
Table 1.7 Signal Detection Theory as applied to curve warnings.
Curve Hazard Present (Signal)
Curve Hazard Absent (Noise)
Warning is Presented HIT FALSE ALARM
Sys
tem
R
espo
nse
Warning is NOT Presented MISS CORRECT
REJECTION
The reliability of signal detection of the warning has been found to affect driver
responses. A two-part study by Bliss and Acton (2002) examined responses to collision
warnings that were 50%, 75%, and 100% reliable. In the first experiment, participants
were to determine whether an auditory alarm actually signaled an approaching car (hit) or
not (false alarm). If the alarm was true, drivers were told to swerve to avoid being struck
from behind by an approaching car. The second experiment utilized the same design,
however warnings were presented spatially to possibly provide more information to the
drivers about the imminent hazard. As expected, driver swerving reactions were better
with systems demonstrating higher reliability. The authors’ suggestions were to design
warnings to maximize alarm reliability while minimizing alarm invasiveness.
Negative consequences of false alarms were also demonstrated in a study by
Dingus, McGehee, Jahns, Carney, and Hankey (1997) examining driver safe headway
20

maintenance when using a forward collision warning system. The study indicated that
overall, younger drivers (18 – 25 years old) tended to follow a lead vehicle more closely
than older drivers (>65 years old). Drivers were presented with different forward
collision warning displays while driving in a simulator. As warning false alarms
increased, younger drivers increased their following distance more than older drivers.
This continued until warning presentation was 60% false alarms, at which point younger
drivers decreased headways indicating possible loss of trust in the system.
Unlike the previous results, two other studies found little negative effect of false
alarms (Maltz & Shinar, 2004; Mitta & Folds, 1997). In the research by Mitta and Folds,
participants were asked to monitor twenty-four cameras for reports of incidents. After
receiving a report of an incident they were required to either locate the incident or to
reject it (false alarm). Operator performance indicated no significant effect of false alarm
rate. In Maltz and Shinar, the in-vehicle collision avoidance warning system (IVCAWS)
led to safer (longer) headway maintenance overall. The reliability of the IVCAWS was
not a significant factor in the responses to true alerts. Drivers were able to assess the
situation independently of the warning systems. Overall, the drivers with IVCAWS
drove more cautiously than without them even when there was a higher false alarm rate.
Credibility can be lost when a false warning sends a message to a motorist
traveling at a safe speed that they should reduce their speed to navigate a curve (Torbic et
al., 2004). Design tradeoffs must consider the consequences of either missing the hazard
or ‘crying wolf’. It has also been suggested that warning signs should not be used for
conditions that are readily apparent to motorists as excessive use results in disrespect for
warnings in general (Hood, 2001).
Alarm Annoyance
Alarm annoyance is sometimes related to false alarms (Maltz & Shinar, 2004). If
drivers are annoyed with the performance of the system and have the option to disable the
system, no benefits from warnings will result. Lerner, Dekker, Steinberg, and Huey
(1996) examined how many false alarms are too many according to drivers. Results
indicated that 4 false alarms per hour and 1 false alarm per hour were significantly more
21

annoying and less acceptable than 1 false alarm per 4 hours and 1 false alarm per 8 hours.
The two less-frequent rates appeared potentially reasonable for systems.
When encountering two warning messages in close temporal proximity, it was
predicted that drivers would be more annoyed if auditory warnings were not correctly
mapped to urgency (Wiese & Lee, 2004). Annoyance with highly urgent sounds (such as
a tire skid sound) increased workload. In Wiese and Lee (2004), ratings of annoyance
and subjective workload were found to be strongly associated.
Summary
Literature reviewed in this section illustrates the need to address the transportation
safety issue of curve crashes and fatalities. The danger of curves is a complicated issue
made up of many contributing factors such as roadway design, poor weather, and driver
behavior. One possible way to mitigate the dangers associated with driving on curves is
to provide an in-vehicle curve warning to the driver. The research cited sheds some light
on the warning process and what factors may contribute to a successful warning.
Researchers have found that both person-related and warning-related variables affect the
way that a receiver processes and responds to a warning. The following sections will
describe a means of further examining these person and warning variables to then provide
recommendations toward the design of a curve warning device.
22
C H A P T E R 2 : R E S E A R C H O B J E C T I V E S
Rat iona le f or the Study
According to the Fatality Accident Reporting System (FARS), 10,709 people, or
about 25% of all recorded crash-related fatalities, were killed on curved roadways in
2003 (NHTSA, 2004a). The precision of any fatality count categorized by road curvature
is questionable, though, as highway agencies operating accident record-keeping often do
not have inventory files that identify the locations or geometrics of horizontal curves to
link to accident data (Persaud, 2000). The crash and fatality count may be higher than
what is on record. It has been estimated that there are more than 10 million horizontal
curves in the U.S. on two-lane highways alone (Torbic et al., 2004). That is a large
number of curves to monitor, especially since many exist on rural roadways, sometimes
outside of Department of Transportation jurisdiction.
Not only is it difficult to keep track of all of the potentially dangerous curves on
US roadways, it is also difficult to maintain these roads and institute measures at each
hazard to improve safety. Efforts are being made, however, and AASHTO has created a
Strategic Highway Safety Plan with the goal to reduce annual highway fatalities by 5,000
to 7,000 (Torbic et al., 2004). The seventh volume of this plan provides strategies to
reduce the number of collisions that occur on horizontal curves. The two main objectives
for improving the safety on horizontal curves are to
1) Reduce the likelihood of a vehicle leaving its lane and either crossing the
roadway centerline or leaving the roadway at a horizontal curve
2) Minimize the adverse consequences of leaving the roadway at a horizontal
curve.
The majority of AASHTO’s potential strategies to address Objective 1 and all for
Objective 2 relate to physical aspects of the curved road. These include providing
adequate sight distance, installing rumble strips, widening the roadway, improving
lighting, preventing edge drop-offs, installing automated anti-icing systems, and
removing objects in hazardous locations. These solutions may prove to be very difficult
23

to institute on rural roadways, the setting for 72% of curve-related accidents (NHTSA,
2004a).
AASHTO also proposed two strategies to reduce the likelihood of the vehicle
leaving its lane or the road in the first place. The first is to provide advance warning of
unexpected changes in horizontal alignment, and the second is to provide dynamic curve
warning systems. These more proactive approaches refer to advance warnings in the
form of roadside signage. Traditional signage is one of the least costly and most timely
strategies suggested. As noted in the literature, however, traditional signage may not be
the most effective solution. Nontraditional signs such as pavement arrows, transverse
striping treatments, and roadside dynamic warning signs with more individualized
displays show promise in reducing speeds and accidents, at least in the short-term
(Charlton, 2004; Preston & Schoenecker, 1999; Wenham, 2000), however few studies of
these types of warnings have been performed.
As shown by the efforts of AASHTO and a number of research institutions,
improving curve-related safety is a priority. An effective solution needs to overcome the
challenges posed by hazards in rural areas, construction costs, and driver inattention to
traditional warning efforts. These criteria point to the potential success of an in-vehicle
warning system.
Background
Technology for the creation of in-vehicle curve warning systems already exists.
For example, means to communicate hazardous curve information to an in-vehicle device
include digital roadmaps (Herrtwich, 2002). Some guidelines for curve warning systems
also exist (Pomerleau et al., 1999), however there is little current research establishing the
most-effective presentation format for curve warnings.
The research study by Neurauter (2004) set out to contribute empirical evidence
toward the design of curve warnings. This simulator study examined driver performance
and reactions to a number of curve warning presentation modalities and determined
combinations of stimuli that were most successful based on objective and subjective
measurements. The top performing stimulus presentation was the speech and HDD, and
24
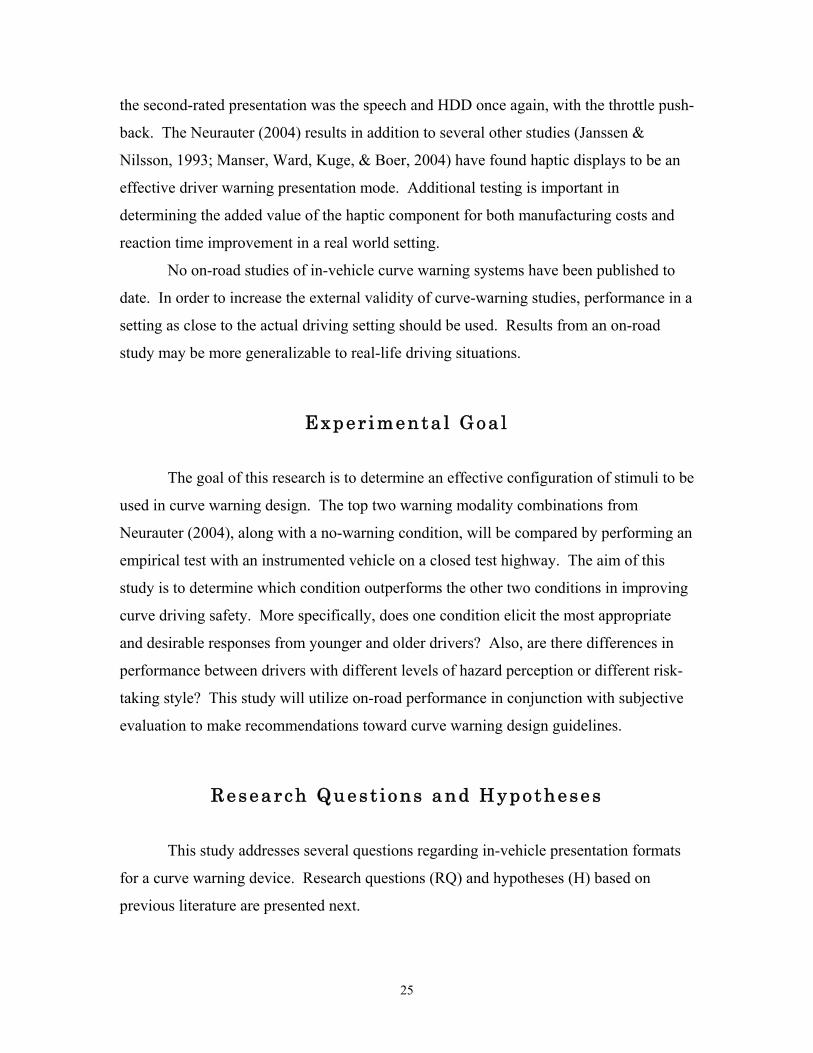
the second-rated presentation was the speech and HDD once again, with the throttle push-
back. The Neurauter (2004) results in addition to several other studies (Janssen &
Nilsson, 1993; Manser, Ward, Kuge, & Boer, 2004) have found haptic displays to be an
effective driver warning presentation mode. Additional testing is important in
determining the added value of the haptic component for both manufacturing costs and
reaction time improvement in a real world setting.
No on-road studies of in-vehicle curve warning systems have been published to
date. In order to increase the external validity of curve-warning studies, performance in a
setting as close to the actual driving setting should be used. Results from an on-road
study may be more generalizable to real-life driving situations.
Exper imenta l Goa l
The goal of this research is to determine an effective configuration of stimuli to be
used in curve warning design. The top two warning modality combinations from
Neurauter (2004), along with a no-warning condition, will be compared by performing an
empirical test with an instrumented vehicle on a closed test highway. The aim of this
study is to determine which condition outperforms the other two conditions in improving
curve driving safety. More specifically, does one condition elicit the most appropriate
and desirable responses from younger and older drivers? Also, are there differences in
performance between drivers with different levels of hazard perception or different risk-
taking style? This study will utilize on-road performance in conjunction with subjective
evaluation to make recommendations toward curve warning design guidelines.
Research Quest ions and Hypotheses
This study addresses several questions regarding in-vehicle presentation formats
for a curve warning device. Research questions (RQ) and hypotheses (H) based on
previous literature are presented next.
25

Research Question 1: Stimulus Presentation and Performance
RQ 1.1. How does driving performance compare between stimulus presentation
groups based on the presentation (including the condition with no stimulus presentation)
received first in the “surprise” stimulus presentation?
H 1.1. Based on previous research cited in the Review of Literature section,
participants presented with a curve warning stimulus are expected to have quicker throttle
and brake reaction times as well as greater speed compliance once reaching the curve
entrance than those not receiving a curve warning stimulus (Comte & Jamson, 2000;
Dingus et al., 1997; Neurauter, 2004; Uno & Hiramatsu, 2001). Participant performance
in the first surprise stimulus presentation could mirror overall results for the stimulus
presentation types. When examining the performance of drivers receiving a stimulus
including the haptic mode, though, a difference may emerge as a result of participant
annoyance and/or confusion associated with the haptic stimulus shown in the Neurauter
(2004) study. These ratings of annoyance may be related to the intrusiveness associated
with this modality – there is no way for those experiencing haptic feedback to shut the
stimulus out (Lloyd et al., 1999). According to the findings from Suzuki & Jansson
(2003), driver responses to haptic feedback are sometimes “false positives,” or opposite
to the desired response, possibly due to driver unfamiliarity or confusion. It is predicted
that participants receiving a warning containing the haptic stimulus in the first stimulus
presentation will not perform as well as those receiving warnings without the haptic
stimulus first due to confusion or annoyance. A warning presentation that does not
perform well in the first “naïve” presentation may indicate a weakness in the warning
design. Warnings are to be effective even without training, and should elicit appropriate
responses even in surprise situations.
RQ 1.2. Overall, what changes in driving performance occur when different
stimulus presentations are presented to the driver?
H 1.2. As predicted for the first “surprise” stimulus presentation, participants
presented with a curve warning stimulus are expected to have quicker throttle and brake
reaction times as well as greater speed compliance once reaching the curve entrance than
26

those not receiving a curve warning stimulus (Comte & Jamson, 2000; Dingus et al.,
1997; Neurauter, 2004; Uno & Hiramatsu, 2001).
Based on simulator study objective results, a stimulus presentation including the
HDD, and Speech stimuli is expected to elicit quicker reaction times and lower curve
entrance speeds than the same presentation with the throttle push-back haptic stimulus
(Neurauter, 2004), though the degree of this difference is uncertain. Also, the haptic
throttle push-back may have some added value as found in the Manser (2004) study, and
results may change in the on-road setting as compared to the simulator setting.
RQ 1.3. How does driving performance compare between the surprise and
subsequent stimulus presentations?
H 1.3. Participants are likely to show improved performance over time due to a
training or experience effect. Brake and throttle reaction times are likely to be quicker in
subsequent stimulus presentations as participants become aware of what to expect in
terms of the roadway and the warning presentation. Driver curve entry speed may also
improve, or better match the advisory speed, once participants gain experience with a
warning system.
Research Question 2: Age and Performance
RQ 2.1. How does driving performance differ between age groups?
H 2.1. Older drivers are likely to have slower reaction times, including brake and
throttle reaction times, in response to the stimuli (Hanowski et al., 1999; Neurauter, 2004;
Warshawsky-Livne& Shinar, 2002). Participants may, however, may reach a more
appropriate curve entry speed (closer to the advisory speed). Older participants have
exhibited greater warning compliance while driving in several studies (Neurauter, 2004;
Uno & Hiramatsu, 2001).
RQ 2.2. In what ways do stimulus presentations affect driving performance of
participants in different age groups?
H 2.2. It is expected that reaction times between age groups will differ, however
the overall performance results indicating the greater effect of one warning over the other
27

is likely to stay constant between the age groups. Throttle reaction times may be quicker
for both younger and older participants in the stimulus presentation including a haptic
push-back. Brake reaction times are likely to be similar between warning stimulus
presentations for each age group. For curve entry speed, the stimulus presentation
including throttle push-back may be accompanied by better performance by younger
participants while a stimulus presentation without the throttle may lead to better
performance by older participants (Neurauter, 2004). Owens and Lehman (2001)
described general findings that aging leads to deterioration of perception and information
processing and such deterioration may impair older participants’ experience of the haptic
stimulus.
Research Question 3: Subjective Evaluation
RQ 3. How will subjective ratings differ between the stimulus presentations and
driver age groups?
H 3. A HDD and Speech stimulus presentation is expected to be rated more
favorably than a HDD, Speech, and Throttle Push-back presentation based on the results
of the simulator study. Ratings gathered by Neurauter (2004) indicated that the
presentation including the haptic stimulus may be rated as more annoying than a
presentation without this stimulus. Lloyd et al.(1999) also cites the potential for the
misinterpretation of the haptic component as a mechanical failure, and thus this may
result in unfavorable reactions. Despite low subjective reactions, the presence of haptic
stimuli in driving studies has been found to improve driving performance in several
studies and its contribution should be evaluated (Janssen & Nilsson, 1993; Manser et al.,
2004; Neurauter, 2004)
Research Question 4: Hazard Perception and Risk-Taking Style
RQ 4. Is there a relationship between drivers’ hazard perception and/or risk-
taking style with curve warning compliance?
H 4. Individuals with higher hazard perception scores are likely to comply with
curve advisory speeds more than individuals with low hazard perceptions (Friedmann,
1988; Vredenburgh & Cohen, 1995). A tendency toward risky behavior may influence
28

compliance with curve warnings (Purswell et al., 1986). The risk-taking style
measurement described in Iversen (2004) may be more appropriate in predicting long-
term or future compliance with warnings than predicting short-term performance.
29

C H A P T E R 3 : M E T H O D S
Exper imenta l Des ign
The experimental design for this study was a 2 (Age) X 3 (Surprise Stimulus
Presentation) between-subjects design. The Age variable included two levels, Younger,
18-25 years old, and Older, >60 years old. The three levels of Surprise Stimulus
Presentation included the two top-performing warning presentation configurations as
determined by Neurauter (2004): 1) Speech with Heads Down Display (HDD) (Audio-
Visual), 2) Throttle push-back, Speech, and HDD (Haptic-Audio-Visual), 3) Baseline
condition. In this design, Stimulus Presentation was treated as a nested factor balanced
between participants, as each participant received one of the stimulus presentations
during their first “surprise” stimulus presentation (See Table 3.1.) In other words, though
participants encountered each of the three stimulus presentations, the first stimulus
presentation occurred without any prior knowledge of the stimuli or the curvature of the
road. Performance and reactions to this first stimulus encounter were examined.
Presentation orders were determined using a Balanced Latin Square included in
Appendix A.
The study data were also analyzed as a 2 (Age) X 3 (Stimulus Presentation) mixed
factors design. The between-subjects variable was Age and the within-subject variable
was Stimulus Presentation. Table 3.2 shows the structure for the mixed-factors design.
Table 3.1: Experimental design - between-subjects for first “Surprise” Stimulus
Presentation.
Age
S1 S5 S7 S11 S2 S6 S8 S12 S3 S4 S9 S10
S13 S17 S19 S23 S14 S18 S20 S24 S15 S16 S21 S22
S25 S29 S31 S35 S26 S30 S32 S36 S27 S28 S33 S34
S37 S41 S43 S47 S38 S42 S44 S48 S39 S40 S45 S46
Audio-Visual Baseline
Stimulus Presented First in "Surprise" Stimulus Presentation
Younger
Older
Haptic-Audio-Visual
30

Table 3.2: Experimental design – mixed factors.
Age Audio-Visual Haptic-Audio-Visual
Baseline Driving
Younger S1 - S24 S1 - S24 S1 - S24
Older S25-S48 S25-S48 S25-S48
Stimulus Presentation
Part i c ipants
Eight participants ran as pilots and 48 additional participants performed the study.
Pilot data were not used in data analysis. The participants were recruited by word of
mouth in addition to posted flyers (Appendix B). The study lasted no more than one and
a half hours and participants were paid $20.00 per hour for their time. No participants
chose to withdraw from the study before its completion. More details pertaining to
participants are in the following sections, and are included in the Institutional Review
Board (IRB) document in Appendix C.
Independent Var iab les
Participants from two age groups participated in the study. Each participant was
presented with three stimulus presentations: Audio-Visual; Haptic-Audio-Visual; and a
Baseline condition (as seen earlier in Table 3.1 and Table 3.2). In the Baseline condition,
no stimulus was presented.
Age
Participants were recruited from two age groups: 24 Younger (18-25 years old)
and 24 Older (>60 years old). The mean age for the younger group was 22 years (SD =
31

1.7) and mean age for the older group was 69 years (SD = 3.5). Significant differences in
reaction times have been found between these age groups (Warshawsky-Livne & Shinar,
2002; Wood, 1998). Each age group was balanced for gender (i.e., 12 male and 12
female per group). Running an equal number of male and female participants upheld
equal opportunity in the hiring of those eligible. Balancing for gender also controlled the
variable to allow for further exploratory analyses based on gender.
Stimulus Presentations
Stimulus Presentations.
1. Audio-Visual: Speech and HDD
2. Haptic-Audio-Visual: Throttle Push-Back, Speech, and HDD
3. Baseline - No stimulus is presented
First “Surprise” Stimulus Presentation. The components of this
independent variable were the same as Stimulus Presentation; however they were
analyzed as a between-subjects variable. This independent variable (IV) was defined as
the first stimulus presentation that the participant received.
Visual Stimulus. The HDD was an orange-yellow and black flashing icon
created using the drawing in Figure 3.1. This symbol was derived from the combination
Horizontal Curve / Advisory Speed Sign following specifications in the Manual on
Uniform Traffic Control Devices (MUTCD) (Federal Highway Administration, 2003)
and was adapted for use in the Neurauter study (2004). The image was 222 x 160 pixels,
equaling 1.81 inches wide by 1.12 inches high. The icon flashed at a blinking cycle of
0.2 seconds until the participant reached 15 mph. Figure 3.2 shows the location of the
HDD, though the color quality in the photograph is skewed due to the flash-rate of the
display. This position on the dash display was chosen for several reasons: 1) Viewing
angle (within proper limits as defined by Sanders and McCormick (1993)) 2) Availability
of space to accommodate the HDD without interfering with other displays 3) Proximity
to relevant information (speedometer) on the display. A close-up of the HDD is included
in Figure 3.3. Only a left-handed turn arrow was used in this study as Neurauter (2004)
32
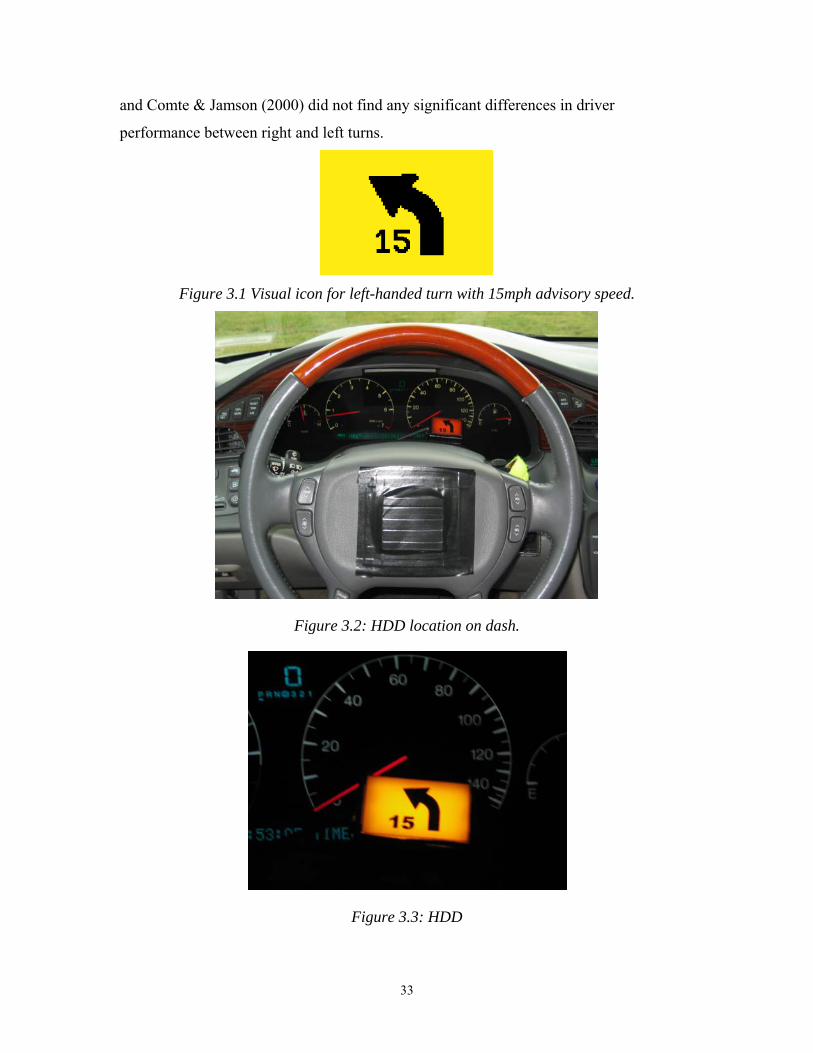
and Comte & Jamson (2000) did not find any significant differences in driver
performance between right and left turns.
Figure 3.1 Visual icon for left-handed turn with 15mph advisory speed.
Figure 3.2: HDD location on dash.
Figure 3.3: HDD
33
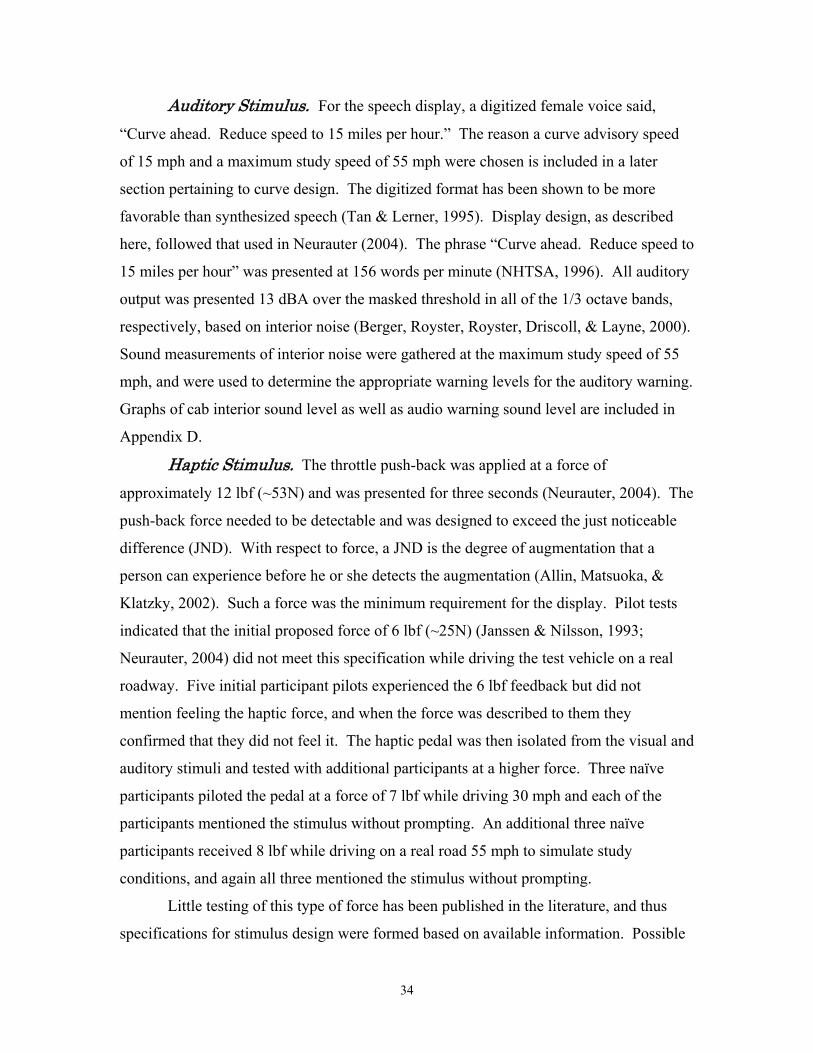
Auditory Stimulus. For the speech display, a digitized female voice said,
“Curve ahead. Reduce speed to 15 miles per hour.” The reason a curve advisory speed
of 15 mph and a maximum study speed of 55 mph were chosen is included in a later
section pertaining to curve design. The digitized format has been shown to be more
favorable than synthesized speech (Tan & Lerner, 1995). Display design, as described
here, followed that used in Neurauter (2004). The phrase “Curve ahead. Reduce speed to
15 miles per hour” was presented at 156 words per minute (NHTSA, 1996). All auditory
output was presented 13 dBA over the masked threshold in all of the 1/3 octave bands,
respectively, based on interior noise (Berger, Royster, Royster, Driscoll, & Layne, 2000).
Sound measurements of interior noise were gathered at the maximum study speed of 55
mph, and were used to determine the appropriate warning levels for the auditory warning.
Graphs of cab interior sound level as well as audio warning sound level are included in
Appendix D.
Haptic Stimulus. The throttle push-back was applied at a force of
approximately 12 lbf (~53N) and was presented for three seconds (Neurauter, 2004). The
push-back force needed to be detectable and was designed to exceed the just noticeable
difference (JND). With respect to force, a JND is the degree of augmentation that a
person can experience before he or she detects the augmentation (Allin, Matsuoka, &
Klatzky, 2002). Such a force was the minimum requirement for the display. Pilot tests
indicated that the initial proposed force of 6 lbf (~25N) (Janssen & Nilsson, 1993;
Neurauter, 2004) did not meet this specification while driving the test vehicle on a real
roadway. Five initial participant pilots experienced the 6 lbf feedback but did not
mention feeling the haptic force, and when the force was described to them they
confirmed that they did not feel it. The haptic pedal was then isolated from the visual and
auditory stimuli and tested with additional participants at a higher force. Three naïve
participants piloted the pedal at a force of 7 lbf while driving 30 mph and each of the
participants mentioned the stimulus without prompting. An additional three naïve
participants received 8 lbf while driving on a real road 55 mph to simulate study
conditions, and again all three mentioned the stimulus without prompting.
Little testing of this type of force has been published in the literature, and thus
specifications for stimulus design were formed based on available information. Possible
34
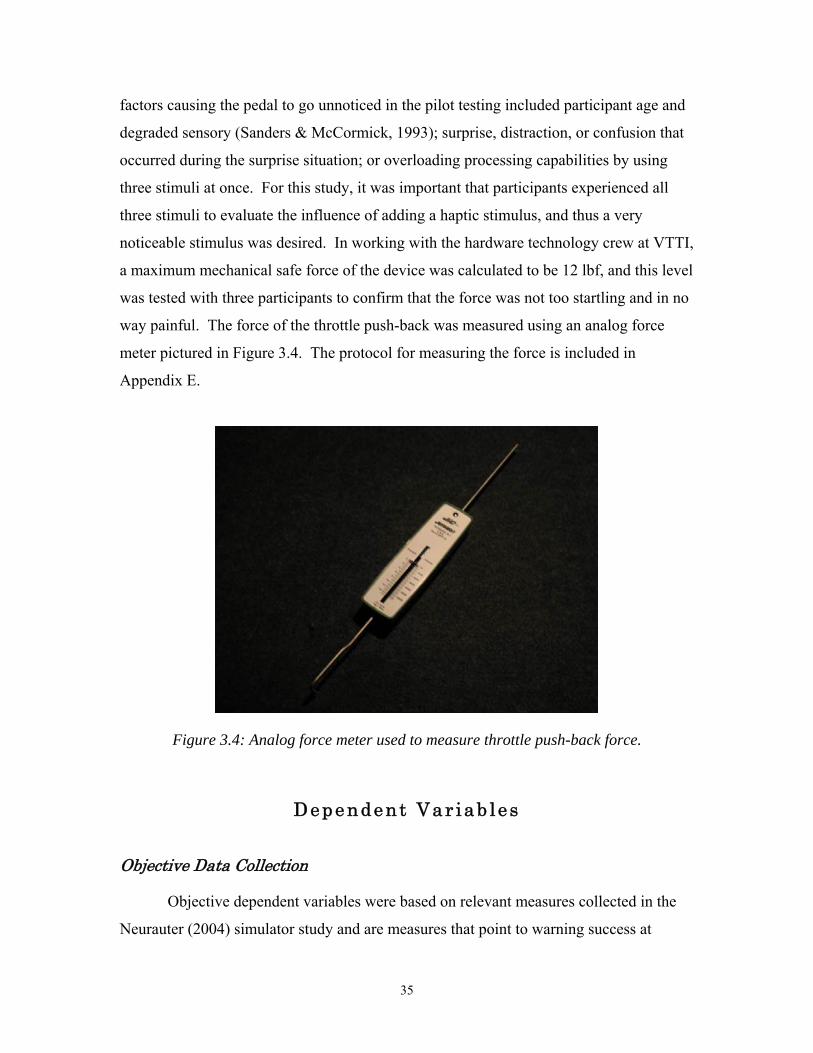
factors causing the pedal to go unnoticed in the pilot testing included participant age and
degraded sensory (Sanders & McCormick, 1993); surprise, distraction, or confusion that
occurred during the surprise situation; or overloading processing capabilities by using
three stimuli at once. For this study, it was important that participants experienced all
three stimuli to evaluate the influence of adding a haptic stimulus, and thus a very
noticeable stimulus was desired. In working with the hardware technology crew at VTTI,
a maximum mechanical safe force of the device was calculated to be 12 lbf, and this level
was tested with three participants to confirm that the force was not too startling and in no
way painful. The force of the throttle push-back was measured using an analog force
meter pictured in Figure 3.4. The protocol for measuring the force is included in
Appendix E.
Figure 3.4: Analog force meter used to measure throttle push-back force.
Dependent Var iab les
Objective Data Collection
Objective dependent variables were based on relevant measures collected in the
Neurauter (2004) simulator study and are measures that point to warning success at
35

various stages of the warning process. Response times and speed are also main measures
taken in a number of other driver warning studies, including Charlton (2004), Dingus et
al. (1997), and Manser et al. (2004).
1. Throttle Reaction Time (TRT) – the time it took for a participant to remove
his/her foot from the throttle pedal if his/her foot was in this location at
stimulus onset.
2. Brake Reaction Time (BRT) – the time it took for a participant to begin
braking, starting from stimulus onset.
3. Vehicle Speed at Entrance of Curve – vehicle speed calculated for the
entrance of the curve.
Subjective Data Collection
Stimulus Comprehension. Once participants completed a stimulus
presentation, they parked the vehicle and verbally answered questions pertaining to
stimulus comprehension. Retrospective probing consisting of a short interview was used
to elicit the driver’s knowledge about the stimulus. Initial interview questions were very
general to avoid biasing the participants, and then more specific questions gathered driver
thoughts and understanding of the curve warnings. Example questions are in Appendix F
and include, “Did you notice anything just now?”, “Can you describe what you noticed?”,
and “What did it mean to you?” The stimulus comprehension interview was
administered after the Baseline condition in addition to the two warning stimulus
presentations.
Post-Condition Questionnaire. After each curve warning presentation,
participants completed the Post-Condition Questionnaire. This questionnaire consisted of
5 items rated on a five-point Likert-type scale and are the same items used in Neurauter
(2004). The items gathered drivers’ reactions to the warning in categories such as its
urgency, annoyance, and appropriateness. Responses were written and on a scale from 1,
Strongly Agree to 5, Strongly Disagree. One written open-ended question was also
included in the questionnaire which asked whether participants would change something
36

about the warning, and if yes, what it would be. The Post-Condition Questionnaire is
included in Appendix G.
Curve Warning Acceptance. After all three curve warning presentations,
participants completed the Curve Warning Acceptance Questionnaire. This questionnaire
was based on a tool developed by Van Der Laan, Heino, and De Waard (1997) and
consisted of 9 items rated on a five-point Likert-type scale. Items asked the participants
to rate whether the warnings were useful, pleasant, annoying, effective, irritating, and
desirable, to name a few. The full questionnaire is included in Appendix H. Just after
completing this questionnaire the participants were asked to choose which warning
stimulus presentation they liked most, and which they liked least. These questions were
asked and answered verbally.
Hazard Perception. Participants’ perceptions of driving hazards, specifically
those on curves, were collected once at the end of the night using a Hazard Perception
Questionnaire (Appendix I). The Hazard Perception Questionnaire consisted of 5 items
rated on a five-point Likert-type scale. Participants indicated at what point on their first
trial they became aware of a curve ahead on the Smart Road (SR) (prior to the warning,
during the warning, or after the warning). They also indicated whether they perceived the
SR curve to be a potential hazard. In addition, they rated the level of danger associated
with driving on curves in general.
Risk-Taking Style. Participants’ risk-taking style were measured by written
questionnaires based on those used by Iversen (2004). The Risk-Taking Style
Questionnaire (Appendix J) was administered to each participant once, at the end of the
night. Items pertaining to attitude towards rule violations and speeding, and attitude
towards drinking and driving were measured using a scale from (1), strongly agree to (5)
strongly disagree. On another scale, from (1), very often to (5) never, drivers indicated
their behaviors such as traffic rule violations/speeding, reckless driving, and seat belt use.
37
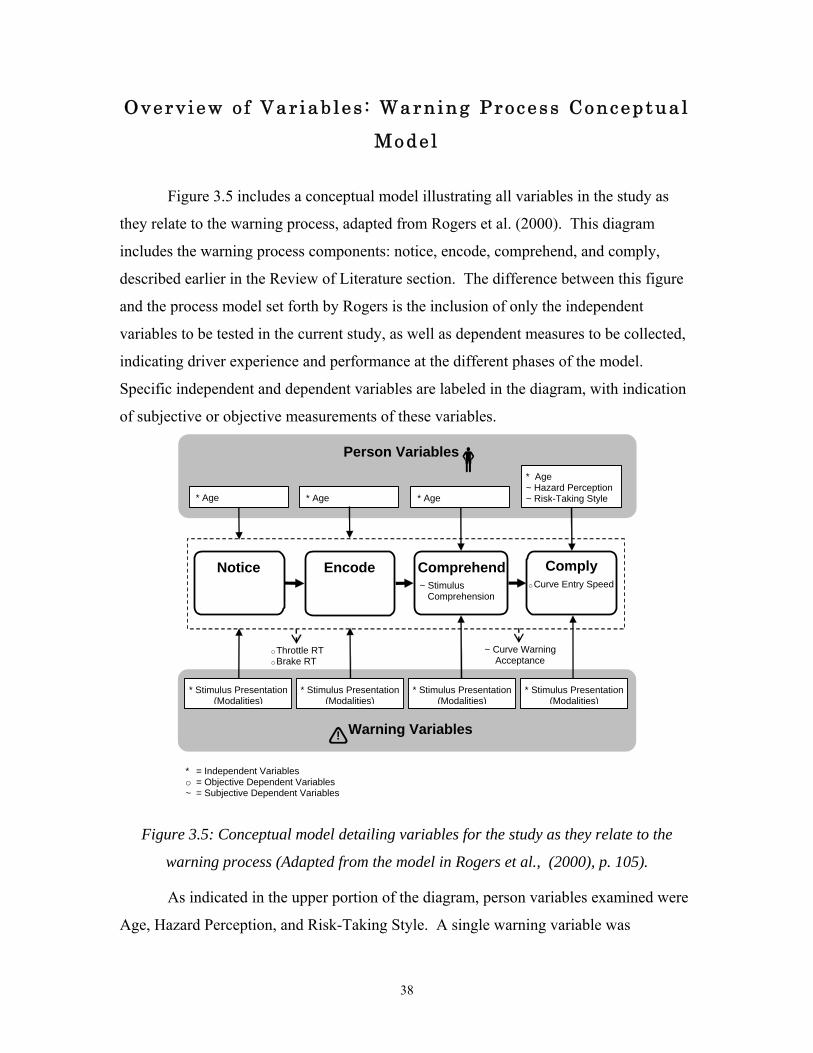
Overv iew o f Var iab les : Warning Process Conceptua l
Mode l
Figure 3.5 includes a conceptual model illustrating all variables in the study as
they relate to the warning process, adapted from Rogers et al. (2000). This diagram
includes the warning process components: notice, encode, comprehend, and comply,
described earlier in the Review of Literature section. The difference between this figure
and the process model set forth by Rogers is the inclusion of only the independent
variables to be tested in the current study, as well as dependent measures to be collected,
indicating driver experience and performance at the different phases of the model.
Specific independent and dependent variables are labeled in the diagram, with indication
of subjective or objective measurements of these variables.
Notice Encode Comprehend Comply
* Age ~ Hazard Perception ~ Risk-Taking Style
Person Variables
Warning Variables !
o Curve Entry Speed
~ Stimulus Comprehension
* Age
o Throttle RT o Brake RT
* Stimulus Presentation (Modalities)
* Age * Age
* = Independent Variables o = Objective Dependent Variables ~ = Subjective Dependent Variables
~ Curve Warning Acceptance
* Stimulus Presentation (Modalities)
* Stimulus Presentation (Modalities)
* Stimulus Presentation (Modalities)
Figure 3.5: Conceptual model detailing variables for the study as they relate to the
warning process (Adapted from the model in Rogers et al., (2000), p. 105).
As indicated in the upper portion of the diagram, person variables examined were
Age, Hazard Perception, and Risk-Taking Style. A single warning variable was
38
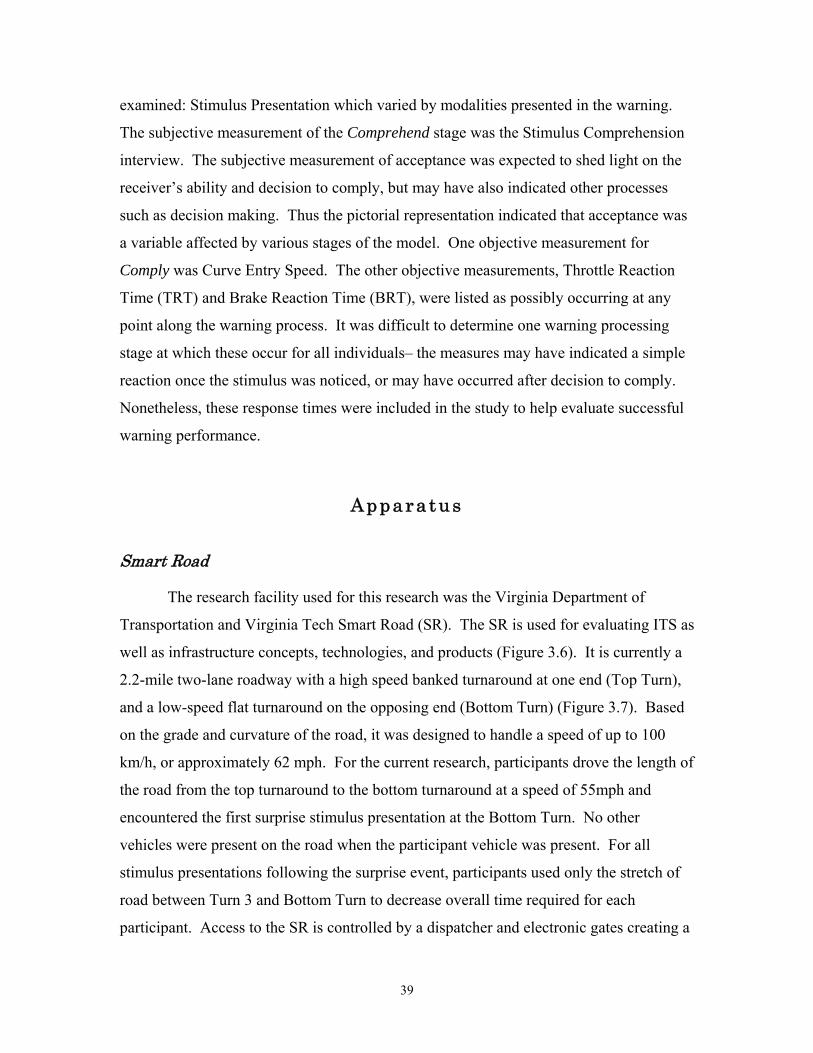
examined: Stimulus Presentation which varied by modalities presented in the warning.
The subjective measurement of the Comprehend stage was the Stimulus Comprehension
interview. The subjective measurement of acceptance was expected to shed light on the
receiver’s ability and decision to comply, but may have also indicated other processes
such as decision making. Thus the pictorial representation indicated that acceptance was
a variable affected by various stages of the model. One objective measurement for
Comply was Curve Entry Speed. The other objective measurements, Throttle Reaction
Time (TRT) and Brake Reaction Time (BRT), were listed as possibly occurring at any
point along the warning process. It was difficult to determine one warning processing
stage at which these occur for all individuals– the measures may have indicated a simple
reaction once the stimulus was noticed, or may have occurred after decision to comply.
Nonetheless, these response times were included in the study to help evaluate successful
warning performance.
Apparatus
Smart Road
The research facility used for this research was the Virginia Department of
Transportation and Virginia Tech Smart Road (SR). The SR is used for evaluating ITS as
well as infrastructure concepts, technologies, and products (Figure 3.6). It is currently a
2.2-mile two-lane roadway with a high speed banked turnaround at one end (Top Turn),
and a low-speed flat turnaround on the opposing end (Bottom Turn) (Figure 3.7). Based
on the grade and curvature of the road, it was designed to handle a speed of up to 100
km/h, or approximately 62 mph. For the current research, participants drove the length of
the road from the top turnaround to the bottom turnaround at a speed of 55mph and
encountered the first surprise stimulus presentation at the Bottom Turn. No other
vehicles were present on the road when the participant vehicle was present. For all
stimulus presentations following the surprise event, participants used only the stretch of
road between Turn 3 and Bottom Turn to decrease overall time required for each
participant. Access to the SR is controlled by a dispatcher and electronic gates creating a
39

safe location to conduct research. This allows researchers to complete experiments that
would not be possible on an open roadway.
Figure 3.6: Diagram of the Smart Road.
Figure 3.7: Photograph of the Bottom Turnaround at the end of the Smart Road.
Research Vehicle and Data Collection Equipment
A 2000 Cadillac Deville DTS was used as the test vehicle for the study (Figure
3.8). The vehicle’s safety features included anti-lock brakes, dual front and side airbags,
traction control, StabiliTrak antiskid system, and Continuously Variable Road Sensing
Suspension. An additional safety feature was a custom-built hand-operated braking
system located in reach for the experimenter seated in the rear passenger-side seat (Figure
3.9). Force for this system, as well as for the throttle push-back system, was generated
40

using a nitrogen tank located in the trunk (Figure 3.10). For the throttle push-back
system, the tank was a 20 cubic foot compressed nitrogen cylinder with heavy duty rotary
air actuator and 6.75” throttle to generate force at the assumed point on the pedal. The
braking system utilized the same nitrogen cylinder along with a pneumatic air cylinder
which applied axial force to the brake pedal arm.
Figure 3.8: Research vehicle, Cadillac Deville DTS.
41

Figure 3.9: Custom-built hand brake accessible to backseat passenger.
Figure 3.10: Nitrogen tank located in trunk used to power throttle push-back as well as
emergency brake.
42
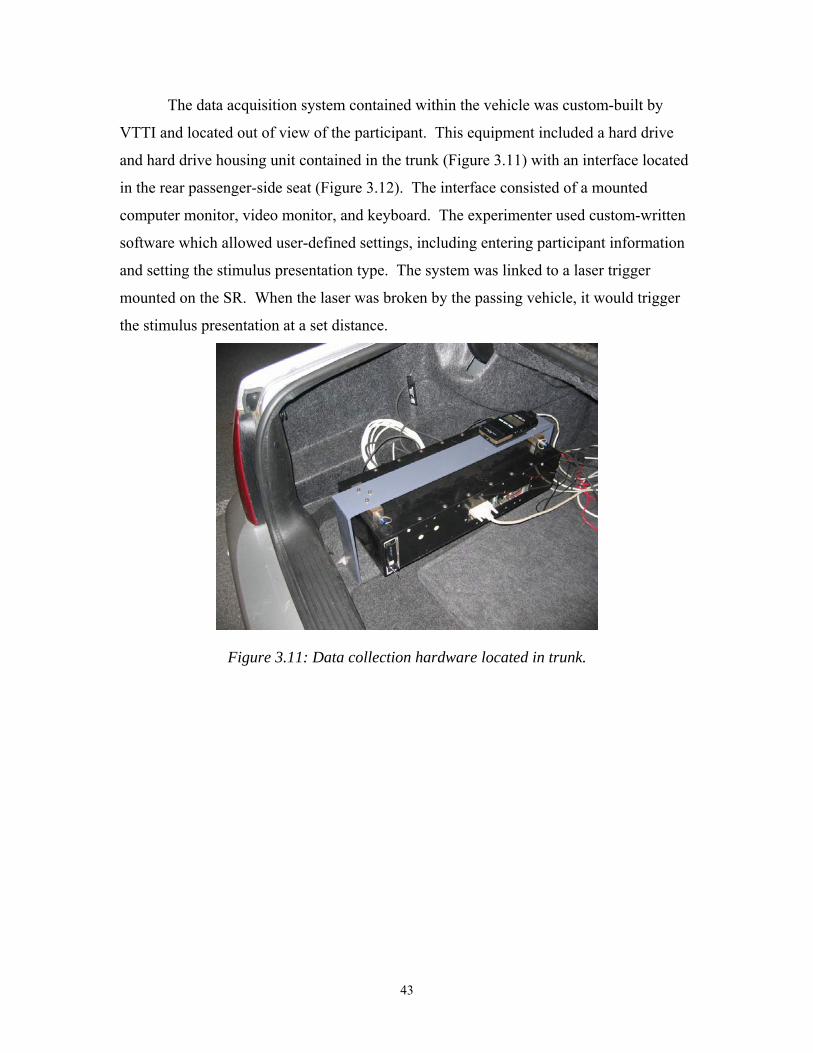
The data acquisition system contained within the vehicle was custom-built by
VTTI and located out of view of the participant. This equipment included a hard drive
and hard drive housing unit contained in the trunk (Figure 3.11) with an interface located
in the rear passenger-side seat (Figure 3.12). The interface consisted of a mounted
computer monitor, video monitor, and keyboard. The experimenter used custom-written
software which allowed user-defined settings, including entering participant information
and setting the stimulus presentation type. The system was linked to a laser trigger
mounted on the SR. When the laser was broken by the passing vehicle, it would trigger
the stimulus presentation at a set distance.
Figure 3.11: Data collection hardware located in trunk.
43
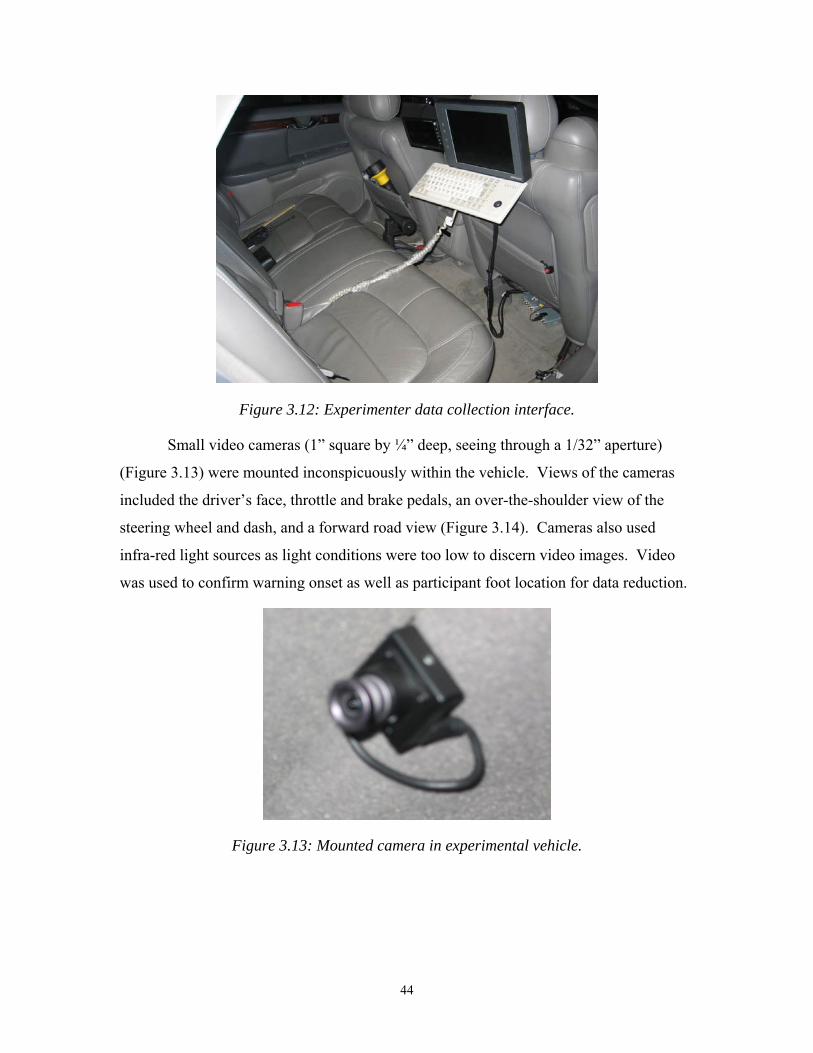
Figure 3.12: Experimenter data collection interface.
Small video cameras (1” square by ¼” deep, seeing through a 1/32” aperture)
(Figure 3.13) were mounted inconspicuously within the vehicle. Views of the cameras
included the driver’s face, throttle and brake pedals, an over-the-shoulder view of the
steering wheel and dash, and a forward road view (Figure 3.14). Cameras also used
infra-red light sources as light conditions were too low to discern video images. Video
was used to confirm warning onset as well as participant foot location for data reduction.
Figure 3.13: Mounted camera in experimental vehicle.
44

Figure 3.14: Four camera views (Image taken while driving the orientation route on
public roads).
Curve Des ign
Advisory Speed
Safe speeds for curves on U.S. roadways are usually determined by one of two
methods: 1) the ball-bank method and 2) the standard curve formula. A detailed
description of these methods can be found in Neurauter (2004). The curve formula was
used for this study, and calculations are detailed in the following sections.
The SR curve used for this project had a radius of 92ft and average superelevation
of 6%. The following formula set forth by Pomerleau et al. (1999) was used to calculate
the curve advisory speed:
effeRgV
−+
=1
For the equation, V is the calculated advisory speed, R is the radius of the curve (ft), g is
the gravitational constant (32.2. ft/s2), e is the superelevation (%), and f is the side friction
45
factor. Based on criteria from the ball-bank advisory speed method, the side friction
factor was 0.21 (AASHTO, 2001). Also, curve warnings should indicate a speed that is
90% of the maximum safe speed (Pomerleau et al., 1999) as well as a rounded number to
include on the advisory sign. Based on these criteria and the formula stated above, the
warning indicated an advisory speed of 15 mph (see calculations in Appendix K).
As in the simulator study by Neurauter (2004), SR participants were instructed to
maintain 55 mph. The speed limit of 55 mph was based on the fact that nearly 40% of all
fatalities involving a curve from 2000 to 2003 were on roads with a speed limit of 55mph
(NHTSA, 2004a). Also, a speed of 55 mph paired with a turn advisory speed of 15 mph
required a large amount of deceleration in order to maneuver the curve safely.
Warning Onset Once the curve radius and safe advisory speeds were calculated, the location for
warning onset was determined. The guidelines set forth by Pomerleau et al. (1999)
recommend a longitudinal deceleration threshold of 4.92 ft/s (or no more than 50% of
what the vehicle is capable of). To determine the point at which the warning should be
presented based on speed, the following equation was used:
)(2
22
VtdVVa
r
c
−−
=
where a is the deceleration (4.92 ft/s), V is the current speed (55 mph or 80.67 ft/s), Vc is
the maximum safe speed for the curve (24.47 ft/s), d is the distance to the apex of the
curve, and tr is the reaction time of the driver (at least 1.5s). Based on current design
practices, the reaction time was set at 2.5 seconds (AASHTO, 2001). According to these
calculations (Appendix L), the warning began 802 ft from the apex of the curve assuming
the participant was traveling at the set speed of 55 mph (Hood, 2001).
A diagram of the points used on the SR is included in Figure 3.15. These points
will be discussed in following sections pertaining to data collection.
46

Warning Onset 802’ prior to curve apex(AASHTO formula, Appendix L)
Curve Entrance200’ prior to curve apexDirection of road changes from right curve to left curve
Curve Apex
Experimenter Brake Point –Safety precaution if participant has not started braking160’ (2 seconds, if traveling 55mph)prior to Curve Entrance
Figure 3.15: Diagram of points of interest on the Smart Road curve.
Exper imenta l Procedure
Participant Screening
Participants were screened over the telephone using a health status and eligibility
questionnaire (Appendix M). Participants were ineligible if they exhibited certain health
conditions, poor driving record, had participated in a study that used the full length of the
SR within the past year, or had ever participated in a SR study with surprise events.
Upon arrival, the participants presented a valid driver’s license and were given an
Informed Consent Form (ICF). The ICF informed them of any risks associated with the
47
study and their option to withdraw freely from the study at anytime with no penalty. If
they withdrew, the participants would be compensated for their time up to that point (See
ICF in Appendix N). The participants also completed a Virginia Tech W-9 Tax Form in
the event that the accumulation of their earnings required the documentation (Appendix
O). They completed the Snellen test to assess visual acuity and to see if their vision met
the Virginia acuity criteria for driving of 20/40 (Department of Motor Vehicles, 2004).
The Ishihara Color Vision test was also administered as well as an informal hearing test
(Appendix P).
For the hearing test, a series of four tones of 1, 2, 3, and 4KHz were played from a
laptop. The participant sat 4 feet away with his or her back to the laptop, speakers at the
sides of the laptop with the back of the laptop pointing toward the participant. Original
levels for these tones were determined so that they exceeded 13dB above the masked
threshold at the frequency of that tone (Sanders & McCormick, 1993). At this level,
though, three out of the first five older participants (>60 years old) did not pass the test.
Because the measure was not meant to be a stringent test to exclude participants, this
level was adjusted so that the sound level at the tone frequency exceeded the highest
masked threshold for any frequency. This was done based on research indicating that an
upward spread of masking may have been occurring, where there is threshold elevation in
octave bands higher than the masking sound itself (Berger et al., 2000). This means that
the lower frequency room noises (in this case, fan and HVAC noise) were masking the
higher frequency test tones. The fan and HVAC sounds could not be eliminated, thus the
tones were played above the masked thresholds of lower frequencies as well as of the
frequencies of the tone. Graphs indicating the sound level for each of the tones in
comparison with room noise are included in Appendix Q. The protocol detailing all
vision and hearing testing is included in Appendix R.
Study Conditions
The study took place in nighttime hours during clear weather conditions and dry
pavement conditions to maintain safety. By conducting data collection in darkness there
was a reduction in visual cues which indicate curve location and characteristics to drivers.
Drivers’ curve detection performance is improved by road view, lighting, guardrails, and
48

signs (Hagiwara, Suzuki, Tokunaga, Yorozu, & Asano, 2001). In order to better isolate
the effectiveness of the curve warning device in alerting the driver to an upcoming curve
from the effects of these other cues, a nighttime setting with low ambient light levels was
used.
Participant Orientation
Just as visual foresight was to be limited by nighttime conditions, cognitive
expectancies were lessened by waiting to inform participants of the curve warnings being
tested until the end of each participant’s driving session. Following the initial vision and
hearing tests, the experimenter oriented the participant to the study and to the research
vehicle. Description of the study indicated that participants would be examining the
effects of cellular phone usage while driving. This deception was necessary to gain
information on how people react to warnings without prompting.
After receiving instructions and asking any questions they had, the participant was
asked to drive a short highway route. The experimenter was in the vehicle with the
participant at all times (See full experimenter protocol in Appendix S). The highway
route was chosen to help familiarize the participants to the vehicle features and handling,
and to help them become comfortable driving at 55 mph without revealing the curvature
of the SR. The route was 7.3 miles long, round trip, and consisted of a 4-lane highway
stretch at 55 mph to familiarize the participants with driving the vehicle at 55mph. The
public road route also included more rural roads with speeds ranging from 25 – 45 mph.
On one 25 mph stretch there was a curve requiring a reduction in speed from 25 mph to a
10 mph advisory speed (Table 3.3).
49
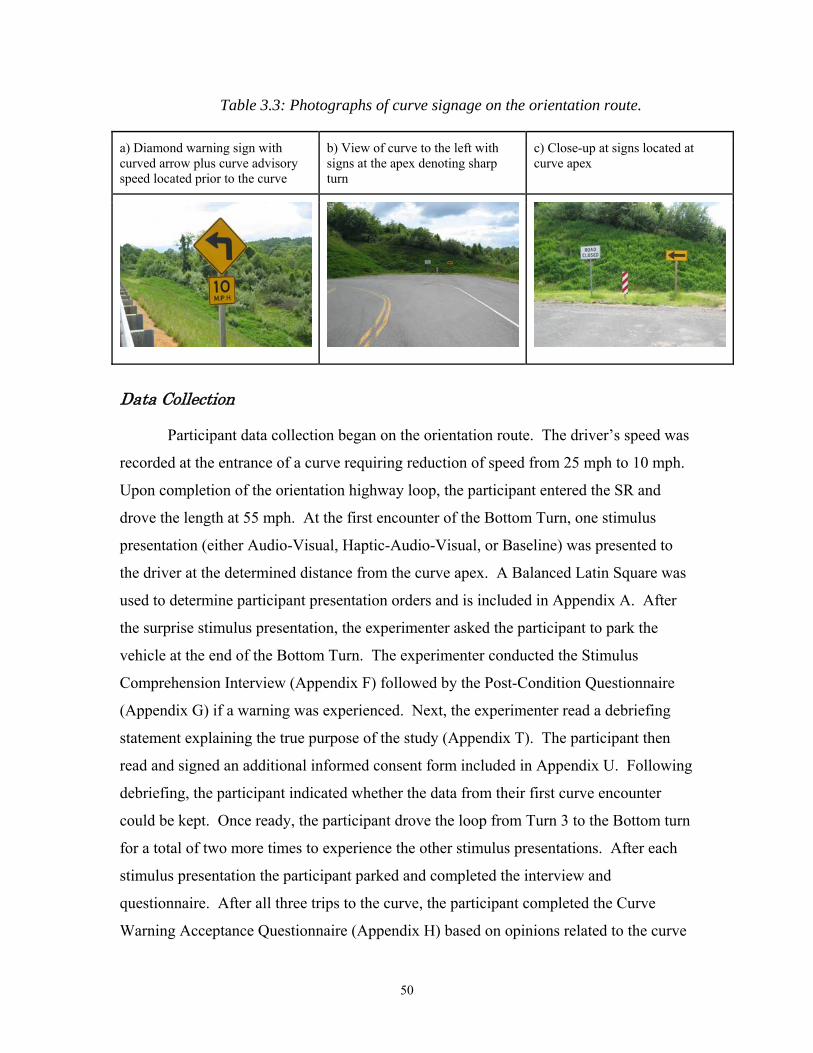
Table 3.3: Photographs of curve signage on the orientation route.
a) Diamond warning sign with curved arrow plus curve advisory speed located prior to the curve
b) View of curve to the left with signs at the apex denoting sharp turn
c) Close-up at signs located at curve apex
Data Collection
Participant data collection began on the orientation route. The driver’s speed was
recorded at the entrance of a curve requiring reduction of speed from 25 mph to 10 mph.
Upon completion of the orientation highway loop, the participant entered the SR and
drove the length at 55 mph. At the first encounter of the Bottom Turn, one stimulus
presentation (either Audio-Visual, Haptic-Audio-Visual, or Baseline) was presented to
the driver at the determined distance from the curve apex. A Balanced Latin Square was
used to determine participant presentation orders and is included in Appendix A. After
the surprise stimulus presentation, the experimenter asked the participant to park the
vehicle at the end of the Bottom Turn. The experimenter conducted the Stimulus
Comprehension Interview (Appendix F) followed by the Post-Condition Questionnaire
(Appendix G) if a warning was experienced. Next, the experimenter read a debriefing
statement explaining the true purpose of the study (Appendix T). The participant then
read and signed an additional informed consent form included in Appendix U. Following
debriefing, the participant indicated whether the data from their first curve encounter
could be kept. Once ready, the participant drove the loop from Turn 3 to the Bottom turn
for a total of two more times to experience the other stimulus presentations. After each
stimulus presentation the participant parked and completed the interview and
questionnaire. After all three trips to the curve, the participant completed the Curve
Warning Acceptance Questionnaire (Appendix H) based on opinions related to the curve
50

warnings in general. The Risk-Taking Style Questionnaire (Appendix J) was only
administered once, at the end of the night. Before participants left they received the
Debriefing and Payment Form (Appendix V) with compensation for the time they spent
participating in the study.
Data Analys i s
Methods for reducing and analyzing all objective and subjective data collected
from each participant are detailed in the following sections.
Data Reduction
Video and performance data files from each participant were downloaded from
the hard drive located in the trunk to a portable flash drive. These files were viewed
using a custom-written program that could display variables individually and in sync with
the video, and could import numerical data into Excel spreadsheets. Using the
spreadsheets in conjunction with the video, values for each participant’s dependent
variables were gathered. For consistency, only one person performed the data reduction.
TRT was the time from the warning onset (confirmed using video) to the point when the
participant lifted his or her foot off of the throttle (identified using both video and pedal
force measures). BRT was the time from warning onset to the point that the foot began to
depress the brake. Curve entry speed was the participant’s speed at a point 730 feet after
the warning onset which demarcated the point where the orientation of the road began to
turn to the left. Similarly, the Public Road curve entry speed was calculated using a sign
landmark in the video which was a measured distance from the point where the road
began to veer to the left. Speed from each of these points was recorded for each
participant.
Objective Data Analysis
Objective data collected during the study include throttle reaction time (TRT),
brake reaction times (BRT), and speed at the entrance of curve (SRspeed). The mean and
51

standard error for the dependent measures was calculated for each of the stimulus
presentations, for the first surprise stimulus presentation, as well as by age group. An
analysis of variance (ANOVA) was performed to evaluate the Stimulus Presentation and
Age differences with respect to the dependent measures. The analytical degrees of
freedom for each ANOVA are in the following tables (Table 3.4 and Table 3.5).
Table 3.4 ANOVA degrees of freedom for between-subjects design.
Source dfBetweenAGE 1SURPRISE STIMULUS PRESENTATION 2AGE X SURPRISE STIMULUS PRESENTATION 2PARTICIPANT(AGE SURPRISE STIMULUS PRESENTATION) 42
TOTAL 47
Table 3.5 ANOVA degrees of freedom for mixed factors design.
Source dfBetweenAGE 1PARTICIPANT(AGE) 46
WithinSTIMULUS PRESENTATION 2AGE X STIMULUS PRESENTATION 2STIMULUS PRESENTATION X PARTICIPANT(AGE) 92
TOTAL 143
Using α set at 0.05, the objective data analysis identified any significant main
effects of Stimulus Presentation or Age. Significant interactions between Age and
Stimulus Presentation were also identified. Significant interactions were examined
graphically to determine relationships between variables, and any instances where
Stimulus Presentation had a significant effect were examined using the Bonferonni t post
hoc test to adjust for the error rate of multiple tests. This test is often used by researchers
as a more conservative method which helps to prevent inflation of α error when making
52

multiple comparisons (Cohen, 2001). This test is also recommended when n’s are
unequal, as was true for this study. A Bonferonni correction of α = 0.0167 was used to
determine where differences occurred between the three levels of the Stimulus
Presentation main effect (α of 0.05 adjusted for a total of 3 comparisons: 0.05 / 3 =
0.0167).
In addition to TRT, BRT, and SRspeed, a comparison of driver speed on the
public road curve (PRspeed) with driver speed on the SR curve (SRspeed) was
performed. A Pearson correlation was used to determine whether a relationship existed
between the drivers’ PRspeed and their SRspeed. PRspeed was also used as an indicator
of more “naturalistic” driving and compared with participant hazard perception and risk-
taking scores, a measure discussed in the following section.
Subjective Data Analysis
The subjective data analysis consisted of evaluating the responses from the
Stimulus Comprehension Interview (Appendix F), Post-Condition Questionnaire
(Appendix G), Hazard Perception Questionnaire (Appendix I), Curve Warning
Acceptance Questionnaire (Appendix H), and Risk-Taking Style Questionnaire
(Appendix J). Content analysis was performed on the open-ended responses to code and
summarized ideas that emerged from participant statements to determine how these ideas
related to the different warning stimuli. For acceptance ratings, ANOVAs were
performed to determine any significant differences between the stimulus presentations, as
well as between age groups, in addition to determining the mean and standard deviation
for each stimulus presentation. Regression analysis was performed for the risk-taking
and hazard perception questionnaires to examine any significant relationships between
these measures and driver warning compliance. Warning compliance was approximated
using the surrogate measure SR curve entry speed (SRspeed) as well as Public Road
curve entry speed (PRspeed).
53
C H A P T E R 4 : R E S U L T S
Data Reduct ion
During the data reduction phase, some data needed to be removed from the data
set based on certain parameters. If the participant passed a safety threshold point on the
way to the SR curve without beginning to brake the vehicle, the experimenter would
either instruct him or her to “brake”, or the experimenter would apply the emergency
brake. If either of these actions occurred, the TRT, BRT, and SRspeed would be dropped
for that participant. Five participants required the verbal “brake” while one required the
application of emergency brake (Table 4.1). These participants required this intervention
for one run each; 4 occurring on their surprise stimulus presentation, 2 on the last
stimulus presentation. Five of these were Baseline, one was Audio-Visual.
Another situation necessitating the removal of data points was the participants’
foot location at warning onset. Using video in conjunction with pedal force readings,
foot locations were determined to be either 1) on the throttle, 2) on the brake, 3) neither
on the throttle or the brake. For a list of participants in the “foot on the brake” or “foot
on neither” categories, please refer to Table 4.1. Of the 144 trials (48 participants each
with 3 stimulus presentations), only 6 trials were categorized as foot on the brake (4%),
and 1 had foot on neither (1%). This means that 95% of the trials were not affected by
foot position. TRT and BRT were not examined for participants with their foot on the
brake, and TRT was not included for the participant with her foot off of both pedals, and
neither TRT nor BRT was included for one participant who applied the brake with his left
foot. Adjusted cell counts after data point removal are included in Table 4.2.
54

Table 4.1: Descriptions of removed data points.
Participant Age Gender Order Stimulus Presentation
Data Lost Reason Data Lost
1 7 Younger Female 3rd B TRT, BRT, Srspeed Verbal "Brake"
2 8 Younger Female 3rd A-V TRT Foot on neither pedal
3 9 Younger Female 2nd A-V TRT, BRT Foot on brake
4 29 Older Female 3rd H-A-V TRT, BRT Foot on brake
5 33 Older Female 2nd A-V TRT, BRT Foot on brake
6 34 Older Female 1st B TRT, BRT, Srspeed Verbal "Brake"
7 37 Older Male 1st A-V TRT, BRT, Srspeed Experimenter Brake
8 41 Older Male 1st A-V TRT, BRT Left foot braking
9 41 Older Male 2nd B TRT, BRT Left foot braking
10 41 Older Male 3rd H-A-V TRT, BRT Left foot braking
11 45 Older Male 1st B TRT, BRT, Srspeed Verbal "Brake"
12 46 Older Male 1st B TRT, BRT, Srspeed Verbal "Brake"
13 48 Older Male 3rd B TRT, BRT, Srspeed Verbal "Brake"
Table 4.2: Adjusted participant counts for each stimulus presentation and objective
dependent variable.
Throttle Reaction Time Throttle Reaction Time
Age Audio-Visual Haptic-Audio-Visual
Baseline Age Audio-Visual Haptic-Audio-Visual
Baseline
Younger 8 8 8 Younger 22 24 23
Older 6 8 5 Older 21 22 19
Brake Reaction Time Brake Reaction Time
Age Audio-Visual Haptic-Audio-Visual
Baseline Age Audio-Visual Haptic-Audio-Visual
Baseline
Younger 8 8 8 Younger 23 24 23
Older 6 8 5 Older 21 22 19
SR Curve Entry Speed SR Curve Entry Speed
Age Audio-Visual Haptic-Audio-Visual
Baseline Age Audio-Visual Haptic-Audio-Visual
Baseline
Younger 8 8 8 Younger 24 24 23
Older 7 8 5 Older 23 24 20
Overall Stimulus Presentation
Overall Stimulus Presentation
Overall Stimulus PresentationStimulus Presented First in "Surprise" Scenario
Stimulus Presented First in "Surprise" Scenario
Stimulus Presented First in "Surprise" Scenario
55
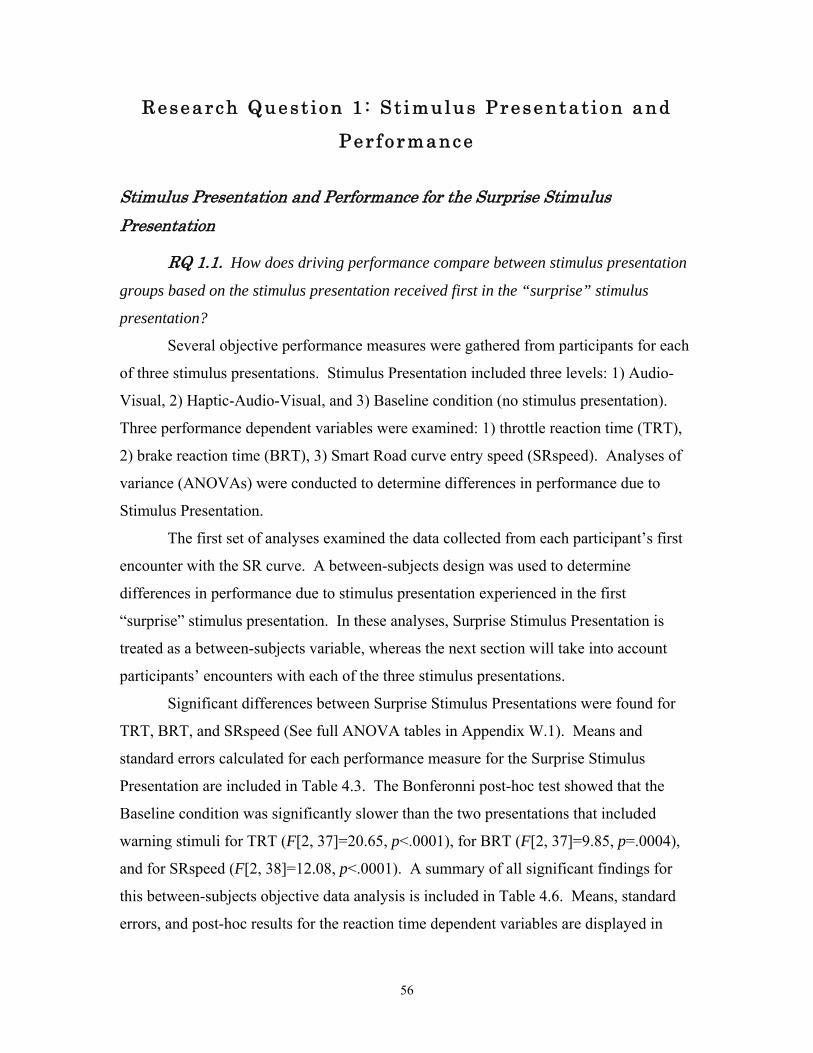
Research Quest ion 1 : St imulus Presentat ion and
Per formance
Stimulus Presentation and Performance for the Surprise Stimulus Presentation
RQ 1.1. How does driving performance compare between stimulus presentation
groups based on the stimulus presentation received first in the “surprise” stimulus
presentation?
Several objective performance measures were gathered from participants for each
of three stimulus presentations. Stimulus Presentation included three levels: 1) Audio-
Visual, 2) Haptic-Audio-Visual, and 3) Baseline condition (no stimulus presentation).
Three performance dependent variables were examined: 1) throttle reaction time (TRT),
2) brake reaction time (BRT), 3) Smart Road curve entry speed (SRspeed). Analyses of
variance (ANOVAs) were conducted to determine differences in performance due to
Stimulus Presentation.
The first set of analyses examined the data collected from each participant’s first
encounter with the SR curve. A between-subjects design was used to determine
differences in performance due to stimulus presentation experienced in the first
“surprise” stimulus presentation. In these analyses, Surprise Stimulus Presentation is
treated as a between-subjects variable, whereas the next section will take into account
participants’ encounters with each of the three stimulus presentations.
Significant differences between Surprise Stimulus Presentations were found for
TRT, BRT, and SRspeed (See full ANOVA tables in Appendix W.1). Means and
standard errors calculated for each performance measure for the Surprise Stimulus
Presentation are included in Table 4.3. The Bonferonni post-hoc test showed that the
Baseline condition was significantly slower than the two presentations that included
warning stimuli for TRT (F[2, 37]=20.65, p<.0001), for BRT (F[2, 37]=9.85, p=.0004),
and for SRspeed (F[2, 38]=12.08, p<.0001). A summary of all significant findings for
this between-subjects objective data analysis is included in Table 4.6. Means, standard
errors, and post-hoc results for the reaction time dependent variables are displayed in
56

Figure 4.1. Figure 4.2 shows the results for the SRspeed measure, highlighting the
difference between the mean speeds and the advisory speed of 15mph.
Table 4.3: Mean (M), n, and Standard Error (SE) for Surprise Stimulus Presentation
performance measures (n is the number of measurements included out of 16 possible).
M n SE M n SE M n SETRT (s) 1.7 14 0.3 1.1 16 0.3 3.8 13 0.4BRT (s) 2.9 14 0.2 2.8 16 0.2 4.4 13 0.3SRspeed (mph) 19.6 15 1.3 19.6 16 1.0 27.0 13 1.4
Audio-Visual Haptic-Audio-Visual Baseline
0.0
0.5
1.0
1.5
2.0
2.5
3.0
3.5
4.0
4.5
5.0
Throttle Reaction Time Brake Reaction Time
Seco
nds
Baseline
Audio-Visual
Haptic-Audio-Visual
A
B
B
A
B B
Figure 4.1: Bonferonni post-hoc results for Reaction Times by Surprise Stimulus
Presentation (Means with the same letter are not significantly different).
57
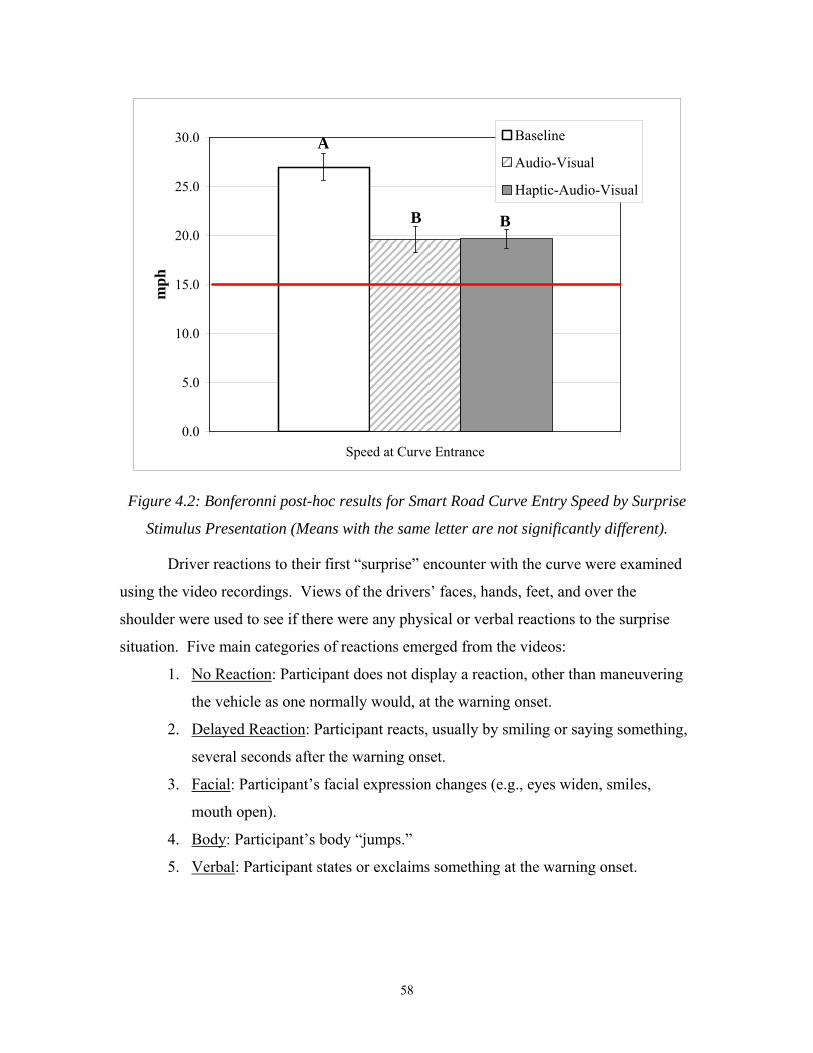
0.0
5.0
10.0
15.0
20.0
25.0
30.0
Speed at Curve Entrance
mph
Baseline
Audio-Visual
Haptic-Audio-Visual
A
B B
Figure 4.2: Bonferonni post-hoc results for Smart Road Curve Entry Speed by Surprise
Stimulus Presentation (Means with the same letter are not significantly different).
Driver reactions to their first “surprise” encounter with the curve were examined
using the video recordings. Views of the drivers’ faces, hands, feet, and over the
shoulder were used to see if there were any physical or verbal reactions to the surprise
situation. Five main categories of reactions emerged from the videos:
1. No Reaction: Participant does not display a reaction, other than maneuvering
the vehicle as one normally would, at the warning onset.
2. Delayed Reaction: Participant reacts, usually by smiling or saying something,
several seconds after the warning onset.
3. Facial: Participant’s facial expression changes (e.g., eyes widen, smiles,
mouth open).
4. Body: Participant’s body “jumps.”
5. Verbal: Participant states or exclaims something at the warning onset.
58

Reactions were tallied for each surprise encounter. Participants may have demonstrated
multiple responses. Therefore, results presented are not mutually exclusive (e.g. Facial
and Verbal response simultaneously). Table 4.4 includes the frequencies for each type of
reaction grouped by Stimulus Presentation. This table shows that the Haptic-Audio-
Visual stimulus presentation received more Facial, Body, and Verbal reactions than the
other two Stimulus Presentation conditions.
Table 4.4: Participant reactions to the “surprise” grouped by Stimulus
Presentation.
No Reaction Delayed Reaction
Facial Body Verbal
Baseline 13 0 2 1 0A-V 6 3 2 5H-A-V 3 1 5 7
24
Overall Stimulus Presentation and Performance
RQ 1.2. Overall, what changes in driving performance occur when the driver
receives different stimulus presentations?
As mentioned, a mixed-factors design was also utilized to evaluate data from
participant encounters with all three stimulus presentations. An ANOVA showed
significant differences between stimulus presentations for all three performance measures
(Appendix W.2). A summary of significant results is included at the end of all sections
discussing objective results (Table 4.7). Means, total cell counts, and standard errors of
the dependent variables are calculated for each stimulus presentation and included in
Table 4.5. Similar to the results of the between-subjects analysis, the Bonferonni post-
hoc test showed that the Baseline condition was significantly slower than the two
warning stimulus presentations for TRT (F[2, 80]=160.32, p<.0001). The Baseline
condition was also significantly slower than the two warning stimulus presentations for
BRT (F[2, 81]=104.10, p<.0001) (Figure 4.3). Finally, participants in the Baseline
condition drove significantly faster than the two warning stimulus presentations (SRspeed
F[2, 86]=54.48, p<.0001). The graph of the means for SRspeed also highlights the
advisory speed of 15 mph with the bolded line (Figure 4.4).
59
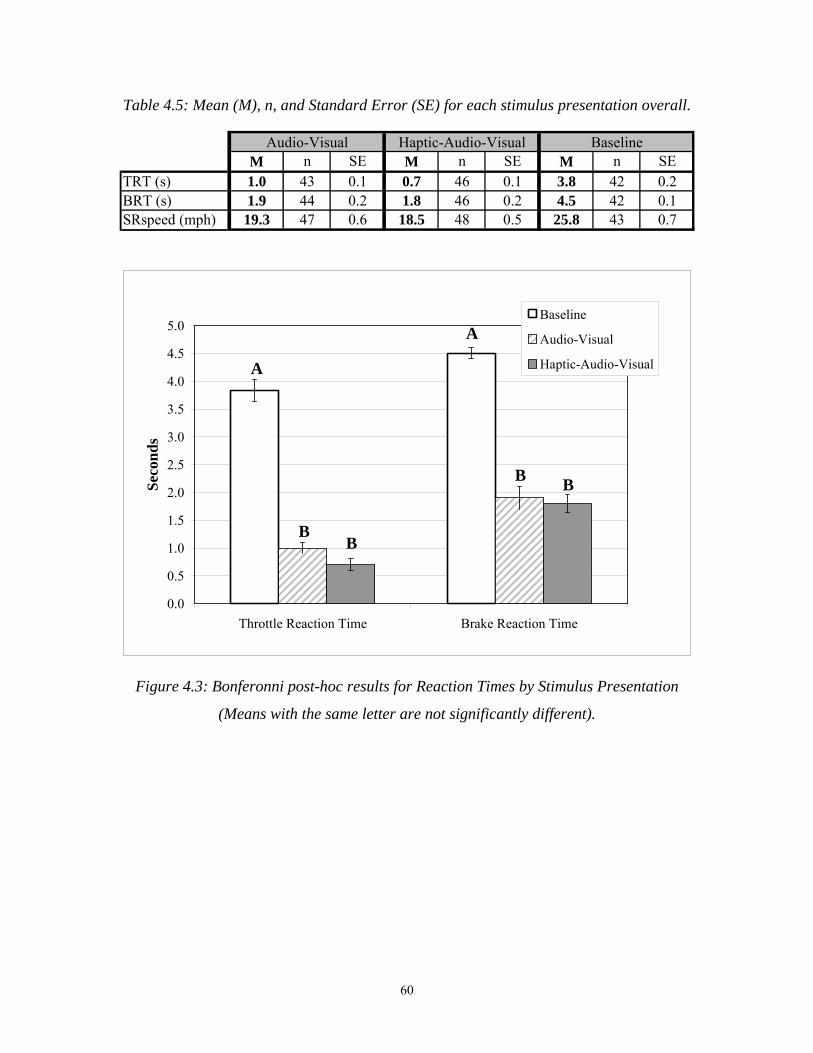
Table 4.5: Mean (M), n, and Standard Error (SE) for each stimulus presentation overall.
M n SE M n SE M n SETRT (s) 1.0 43 0.1 0.7 46 0.1 3.8 42 0.2BRT (s) 1.9 44 0.2 1.8 46 0.2 4.5 42 0.1SRspeed (mph) 19.3 47 0.6 18.5 48 0.5 25.8 43 0.7
Audio-Visual Haptic-Audio-Visual Baseline
0.0
0.5
1.0
1.5
2.0
2.5
3.0
3.5
4.0
4.5
5.0
Throttle Reaction Time Brake Reaction Time
Seco
nds
Baseline
Audio-Visual
Haptic-Audio-VisualA
BB
A
B B
Figure 4.3: Bonferonni post-hoc results for Reaction Times by Stimulus Presentation
(Means with the same letter are not significantly different).
60
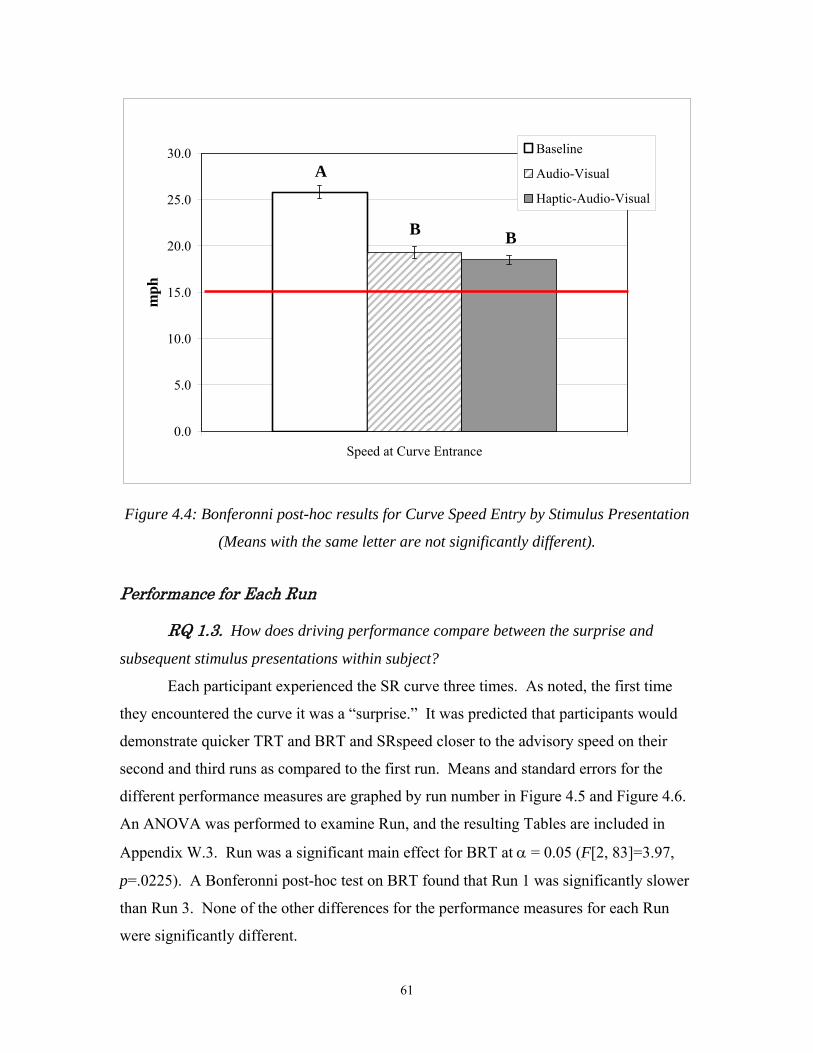
0.0
5.0
10.0
15.0
20.0
25.0
30.0
Speed at Curve Entrance
mph
Baseline
Audio-Visual
Haptic-Audio-Visual
A
B B
Figure 4.4: Bonferonni post-hoc results for Curve Speed Entry by Stimulus Presentation
(Means with the same letter are not significantly different).
Performance for Each Run
RQ 1.3. How does driving performance compare between the surprise and
subsequent stimulus presentations within subject?
Each participant experienced the SR curve three times. As noted, the first time
they encountered the curve it was a “surprise.” It was predicted that participants would
demonstrate quicker TRT and BRT and SRspeed closer to the advisory speed on their
second and third runs as compared to the first run. Means and standard errors for the
different performance measures are graphed by run number in Figure 4.5 and Figure 4.6.
An ANOVA was performed to examine Run, and the resulting Tables are included in
Appendix W.3. Run was a significant main effect for BRT at α = 0.05 (F[2, 83]=3.97,
p=.0225). A Bonferonni post-hoc test on BRT found that Run 1 was significantly slower
than Run 3. None of the other differences for the performance measures for each Run
were significantly different.
61

1.0
1.5
2.0
2.5
3.0
3.5
4.0
TRT BRT
Seco
nds
Run 1 (Surprise)Run 2Run 3
Performance Measure
A
AA
A
AB
B
Figure 4.5: Bonferonni post-hoc results for Reaction Times by Run (Means with the same
letter are not significantly different).
0.0
5.0
10.0
15.0
20.0
25.0
SRspeed
mph
Run 1 (Surprise)
Run 2
Run 3
AA A
Figure 4.6: Bonferonni post-hoc results for Curve Entry Speed by Run (Means
with the same letter are not significantly different).
62

Research Quest ion 2 : Age and Per formance
Age and Performance
RQ 2.1. How does driving performance differ between age groups?
The participant variable Age was examined using an ANOVA to determine
differences in performance between younger drivers (18-25 years old) and older drivers
(>60 years old). SRspeed was significantly different based on Age for the between-
subjects design, looking at only the stimulus presentation for each participants’ surprise
stimulus presentation (F[1, 38]=9.05, p=.0046) (Younger: M=23.9 mph, SE=0.96, Older:
M=19.3 mph, SE=1.18) (See Appendix W.1 for full ANOVA tables).
Similarly, a significant main effect of Age was found for SRspeed using the
mixed factors design including all three stimulus presentations for each participant (not
just the surprise stimulus presentation), F[1, 46]=7.42, p=.0091 (Younger: M = 22.2 mph,
SE=0.6, Older: M=19.8 mph, SE=0.6). Figure 4.7 includes means for SRspeed based on
Age for the surprise stimulus presentation and for all stimulus presentations combined.
0.0
5.0
10.0
15.0
20.0
25.0
30.0
Surprise StimulusPresentation
All Stimulus PresentationsCombined
mph
Younger Drivers
Older Drivers
Figure 4.7: Means and standard errors for SRspeed by Age for the Surprise Stimulus
Presentation and for All Stimulus Presentations Combined.
63
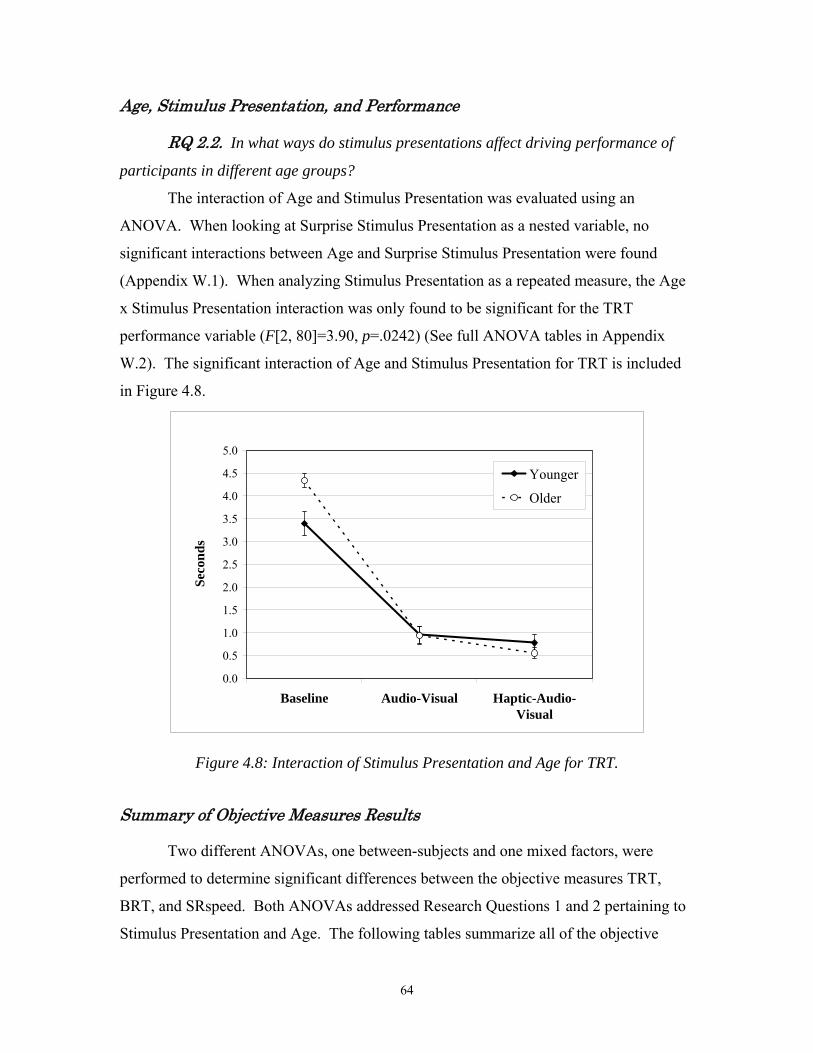
Age, Stimulus Presentation, and Performance
RQ 2.2. In what ways do stimulus presentations affect driving performance of
participants in different age groups?
The interaction of Age and Stimulus Presentation was evaluated using an
ANOVA. When looking at Surprise Stimulus Presentation as a nested variable, no
significant interactions between Age and Surprise Stimulus Presentation were found
(Appendix W.1). When analyzing Stimulus Presentation as a repeated measure, the Age
x Stimulus Presentation interaction was only found to be significant for the TRT
performance variable (F[2, 80]=3.90, p=.0242) (See full ANOVA tables in Appendix
W.2). The significant interaction of Age and Stimulus Presentation for TRT is included
in Figure 4.8.
0.0
0.5
1.0
1.5
2.0
2.5
3.0
3.5
4.0
4.5
5.0
Baseline Audio-Visual Haptic-Audio-Visual
Seco
nds
Younger
Older
Figure 4.8: Interaction of Stimulus Presentation and Age for TRT.
Summary of Objective Measures Results
Two different ANOVAs, one between-subjects and one mixed factors, were
performed to determine significant differences between the objective measures TRT,
BRT, and SRspeed. Both ANOVAs addressed Research Questions 1 and 2 pertaining to
Stimulus Presentation and Age. The following tables summarize all of the objective
64
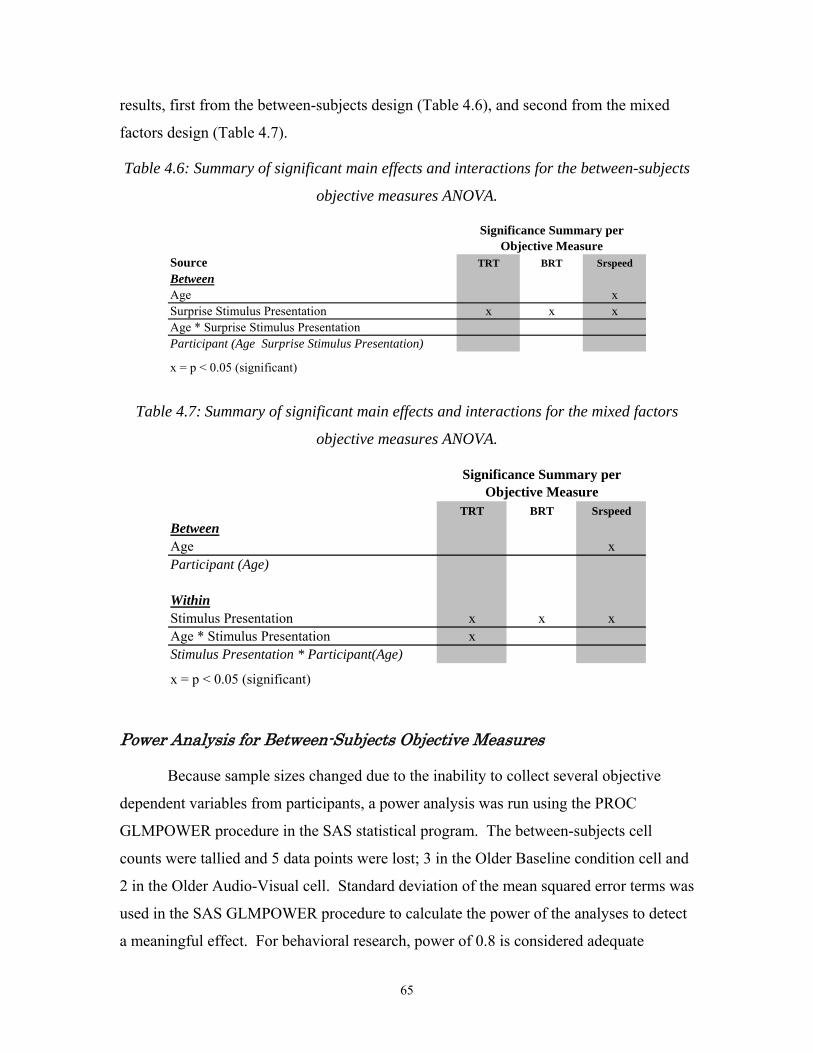
results, first from the between-subjects design (Table 4.6), and second from the mixed
factors design (Table 4.7).
Table 4.6: Summary of significant main effects and interactions for the between-subjects
objective measures ANOVA.
Source TRT BRT SrspeedBetweenAge xSurprise Stimulus Presentation x x xAge * Surprise Stimulus PresentationParticipant (Age Surprise Stimulus Presentation)
x = p < 0.05 (significant)
Significance Summary per Objective Measure
Table 4.7: Summary of significant main effects and interactions for the mixed factors
objective measures ANOVA.
TRT BRT SrspeedBetweenAge xParticipant (Age)
WithinStimulus Presentation x x xAge * Stimulus Presentation xStimulus Presentation * Participant(Age)
x = p < 0.05 (significant)
Significance Summary per Objective Measure
Power Analysis for Between-Subjects Objective Measures
Because sample sizes changed due to the inability to collect several objective
dependent variables from participants, a power analysis was run using the PROC
GLMPOWER procedure in the SAS statistical program. The between-subjects cell
counts were tallied and 5 data points were lost; 3 in the Older Baseline condition cell and
2 in the Older Audio-Visual cell. Standard deviation of the mean squared error terms was
used in the SAS GLMPOWER procedure to calculate the power of the analyses to detect
a meaningful effect. For behavioral research, power of 0.8 is considered adequate
65

(Cohen, 2001). Table 4.8 includes computed power and computed N (entire sample)
necessary to get a significant result with adequate probability (power = 0.8). The actual
N for the study was 43 and for the non-significant findings the proposed numbers of
participants to add to achieve power were too high to be feasible. Levels of power for
Surprise Stimulus Presentation as an individual source were all adequate, ranging from
0.904 to 0.999. For Age and Age x Surprise Stimulus Presentation, however, the TRT
and BRT analyses showed very low power of <0.3. Very large samples, some >1000
participants, would need to be added to detect a meaningful effect of Age or Age x
Surprise Presentation for the reaction time and curve entry speed measures.
Table 4.8: Power analysis results for the between-subjects design categorized by each
source (N Total is the whole sample size, not the n for each cell).
TRT
Source Test DF
Actual Power
N Total Necessary to Achieve 0.8
AGE 1 0.074 1548SURPRISE STIMULUS PRESENTATION 2 0.999 43
AGE X SURPRISE STIMULUS PRESENTATION 2 0.304 172
BRT
Source Test DF
Actual Power
N Total Necessary to Achieve 0.8
AGE 1 0.192 301
SURPRISE STIMULUS PRESENTATION 2 0.974 43AGE X SURPRISE STIMULUS PRESENTATION 2 0.161 301
Srspeed
Source Test DF
Actual Power
N Total Necessary to Achieve 0.8
AGE 1 0.831 44
SURPRISE STIMULUS PRESENTATION 2 0.992 44
AGE X SURPRISE STIMULUS PRESENTATION 2 0.076 1188
66

Research Quest ion 3 : Sub jec t ive Eva luat ion
RQ 3. How will subjective ratings differ between the stimulus presentations and
driver age groups?
Stimulus Comprehension Interview
This Stimulus Comprehension Interview was a series of general probing questions
administered after each encounter with the SR curve. Participant responses varied in
content and level of detail. One participant interview, for the haptic-audio-video stimulus
presentation, was lost due to interview recording equipment failure. To analyze the data,
a rating system of High, Medium, and Low Comprehension was developed to categorize
participants’ level of understanding and feedback based on their interview. These three
categories were assigned based on points tallied for responses based on three criteria: 1)
Noticed stimulus, 2) Identified all components of stimulus correctly, 3) Identified proper
response action. Participants meeting all three criteria received a score of High
Comprehension, those meeting two were assigned Medium Comprehension, and those
with one were categorized as Low Comprehension. A complete list of participant
comments and criteria tallies is included in Appendix X.
Table 4.9 shows the total number of participants receiving each comprehension
rating categorized by Stimulus Presentation. Following the Audio-Visual presentation,
26 participants (over half) received a High Comprehension score. The majority of
interviews following the Haptic-Audio-Visual presentation, 28, received a Medium
Comprehension score. Of the 28 participants who received a Medium rather than High
rating for Haptic-Audio-Visual, 16 were due to not identifying all components of the
stimulus correctly. Specifically, these participants did not mention the haptic component.
67

Table 4.9: Total number of participants receiving each stimulus comprehension
rating (Low, Medium, or High) for the two stimulus presentations.
Audio-Visual Haptic-Audio-Visualn=48 n=47
Low Comprehension 4 11
Medium Comprehension 18 28
High Comprehension 26 8
Post-Condition Questionnaire
The Post-Condition Questionnaire (Appendix G) asked participants to what
degree they agreed with statements pertaining to five aspects of the warnings. An
analysis of variance of the Likert-type ratings gathered in the Post-Condition
Questionnaire determined whether there were significant differences between Stimulus
Presentations and Age at α=0.05 (Appendix W.4). There was a significant difference in
ratings between age groups for the item, “If my car was equipped with a curve warning
device, I would want this type of warning to be presented” (F[1, 46]=4.65, p=.0364).
That same item had a significant interaction of Age by Stimulus Presentation (F[1,
46]=6.16, p=.0.0168). A summary table displaying the ANOVA sources and significance
is included in Table 4.10. Mean ratings grouped by Age are included in Figure 4.9.
Mean ratings grouped by Age and Stimulus Presentation are graphed in Figure 4.10. The
means for the significant interaction of Age and Stimulus Presentation for the “want this
type of warning” item are shown on this graph. An ANOVA of ratings for just the first
Surprise Stimulus Presentation was not possible due to lacking degrees of freedom,
however the means are graphed in Figure 4.11. Like the overall Stimulus Presentation
means, the item with the largest difference in ratings was also “If my car was equipped
with a curve warning device, I would want this type of warning to be presented.” The
direction for a few of the ratings changes between the mixed and between designs. For
some items, Older participants rate the stimulus higher than Younger participants rated it
for the surprise presentation, and then rate it lower than the Younger participants do for
the overall stimulus presentation, and vice verse.
68

Table 4.10: Summary of significant main effects and interactions for the Post-
Condition Questionnaire mixed factors ANOVA.
Source 1 2 3 4 5BetweenAge xParticipant(Age)
WithinStimulus PresentationAge*Stimulus Presentation xStimulus Presentation*Participant(Age)
x = p < 0.05 (significant)
Significance Summary per Statement
1
2
3
4
5
ConveyedUrgency
Annoying Appropriatefor a CWD
Interfered Want ThisType ofWarning
Mea
n R
atin
g
Younger DriversOlder Drivers
Questionnaire Item
Strongly Agree
Strongly Disagree
= significant at α = .05*
*
Figure 4.9: Mean ratings and standard errors for Post-Condition Questionnaire Items by
Driver Age
69
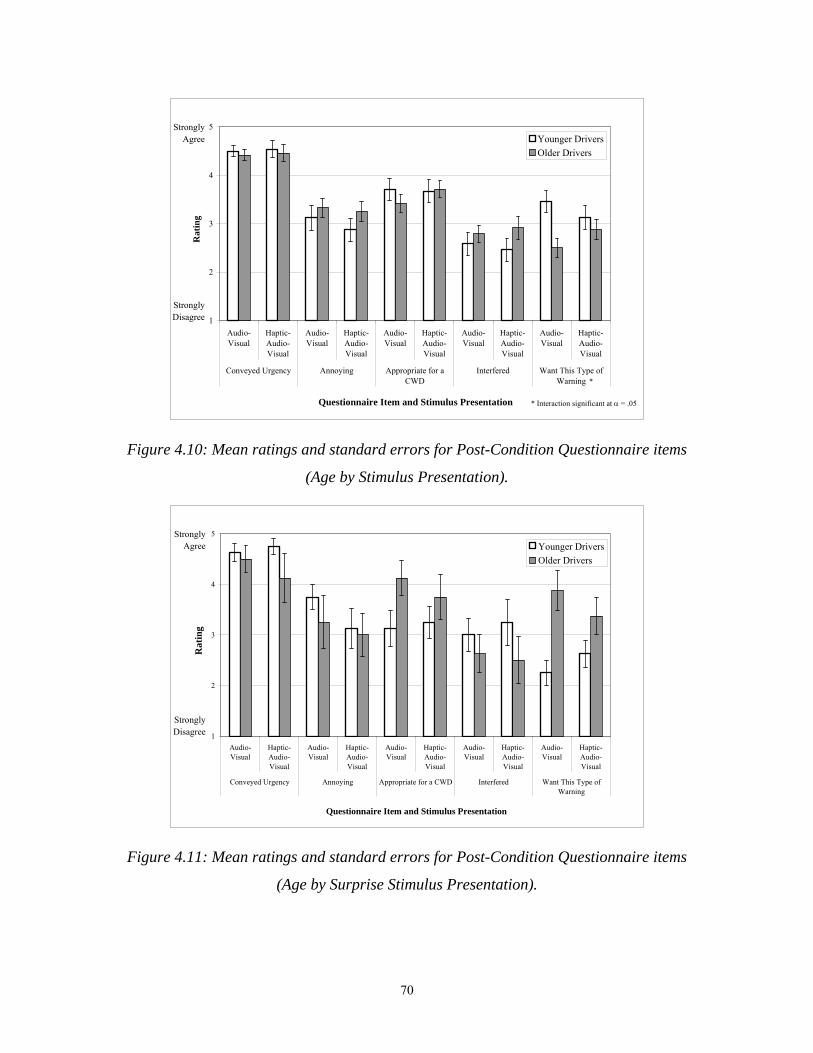
1
2
3
4
5
Audio-Visual
Haptic-Audio-Visual
Audio-Visual
Haptic-Audio-Visual
Audio-Visual
Haptic-Audio-Visual
Audio-Visual
Haptic-Audio-Visual
Audio-Visual
Haptic-Audio-Visual
Conveyed Urgency Annoying Appropriate for aCWD
Interfered Want This Type ofWarning
Questionnaire Item and Stimulus Presentation
Rat
ing
Younger DriversOlder Drivers
Strongly Agree
Strongly Disagree
* Interaction significant at α = .05
*
Figure 4.10: Mean ratings and standard errors for Post-Condition Questionnaire items
(Age by Stimulus Presentation).
1
2
3
4
5
Audio-Visual
Haptic-Audio-Visual
Audio-Visual
Haptic-Audio-Visual
Audio-Visual
Haptic-Audio-Visual
Audio-Visual
Haptic-Audio-Visual
Audio-Visual
Haptic-Audio-Visual
Conveyed Urgency Annoying Appropriate for a CWD Interfered Want This Type ofWarning
Questionnaire Item and Stimulus Presentation
Rat
ing
Younger DriversOlder Drivers
Strongly Agree
Strongly Disagree
Figure 4.11: Mean ratings and standard errors for Post-Condition Questionnaire items
(Age by Surprise Stimulus Presentation).
70
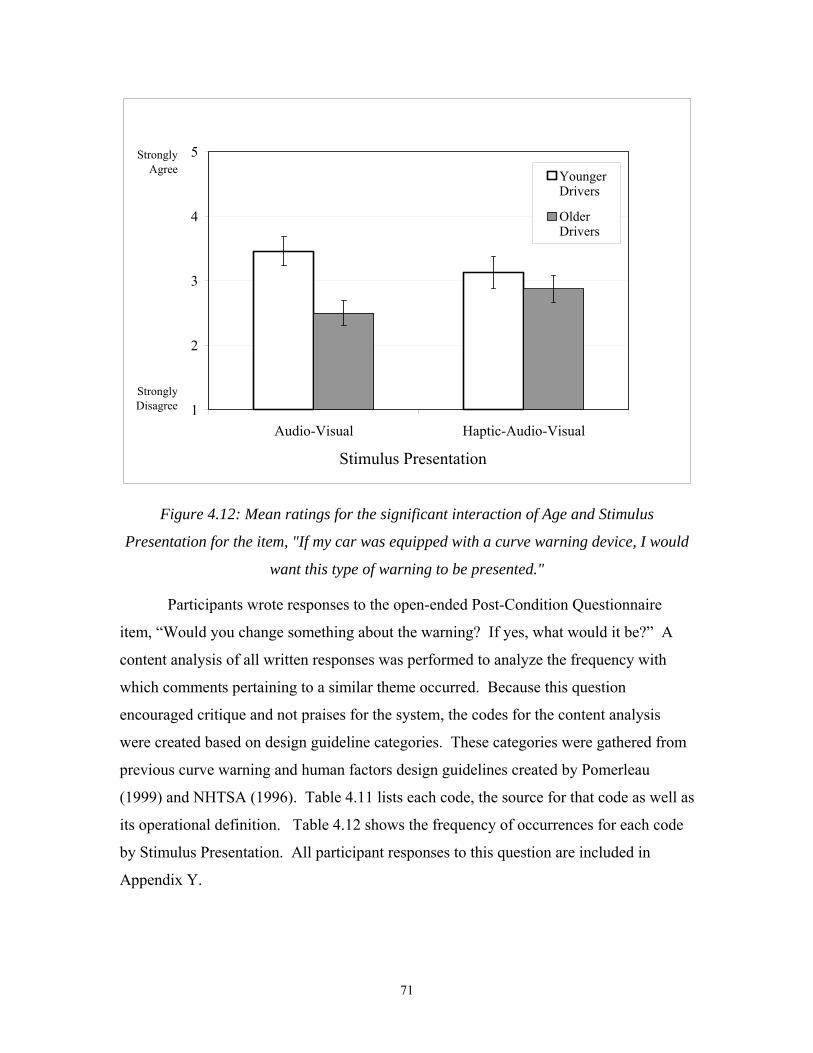
1
2
3
4
5
Audio-Visual Haptic-Audio-Visual
YoungerDrivers
OlderDrivers
Strongly Agree
Strongly Disagree
Stimulus Presentation
Figure 4.12: Mean ratings for the significant interaction of Age and Stimulus
Presentation for the item, "If my car was equipped with a curve warning device, I would
want this type of warning to be presented."
Participants wrote responses to the open-ended Post-Condition Questionnaire
item, “Would you change something about the warning? If yes, what would it be?” A
content analysis of all written responses was performed to analyze the frequency with
which comments pertaining to a similar theme occurred. Because this question
encouraged critique and not praises for the system, the codes for the content analysis
were created based on design guideline categories. These categories were gathered from
previous curve warning and human factors design guidelines created by Pomerleau
(1999) and NHTSA (1996). Table 4.11 lists each code, the source for that code as well as
its operational definition. Table 4.12 shows the frequency of occurrences for each code
by Stimulus Presentation. All participant responses to this question are included in
Appendix Y.
71

Table 4.11: Codes and code definitions developed for the Post-Condition Questionnaire
content analysis based on human factors design guidelines.
Time Correctly The curve warning device activates early enough to allow the driver to respond properly. Pomerleau [C-2]
Avoid Startling The CWD should be designed so that it is not so intense that it overloads the driver's sensing capabilities or that it evokes a startle response from the driver.
Pomerleau [C-36]
Be Detectible/ Discriminable
The CWD should be designed so that it is not masked by other stimuli present while driving. The CWD should also be distinct from other in-vehicle warnings.
Pomerleau [C-34, C-35]
Be Understandable/ Indicate Proper Action
The CWD should be interpretable and indicate the appropriate driver response without causing driver confusion.
Pomerleau [C-38]
Avoid Distracting Driver The CWD should be presented in a way that does not overload the driver's processing capabilities while engaging in the driving task.
Pomerleau [C-32]
Convey Urgency Appropriately
The modality and characteristics of the stimuli should convey the urgency of the danger. Pomerleau [C-33]
Be Adjustable The CWD should be adjustable in a range that does not compromise system effectiveness.
Pomerleau [C-41]
Train Properly Users should receive orientation to the system through documentation, video, or hands-on training.
Pomerleau [C-51]
Design Auditory Stimulus Properly
Audio level, quality, duration, and integration with other stimuli (for example, tone prior to speech) should follow human facators guidelines.
NHTSA (1996)
Design Visual Stimulus Properly
Visual stimulus size, color, intensity, symbols, and location should follow human factors guidelines
NHTSA (1996)
Remove Auditory Stimulus User desires the removal of the auditory stimulus.
Remove Visual Stimulus User desires the removal of the visual stimulus.
Remove Haptic Stimulus User desires the removal of the haptic stimulus.
Include Haptic Stimulus User desires the addition of the haptic stimulus.
Code Name Definition Source
72

Table 4.12: Frequency for each code in responses to the Post-Condition Questionnaire
open-ended item, ““Would you change something about the warning? If yes, what would
it be?”
Code Freq. Code Freq.Design Auditory Stimulus Properly
18Design Auditory Stimulus Properly
12
Avoid Startling8
Design Visual Stimulus Properly9
Time Correctly6
Time Correctly7
Remove Auditory Stimulus6
Be Understandable / Indicate Proper Action 6
Be Understandable / Indicate Proper Action 4
Avoid Startling5
Design Visual Stimulus Properly4
Remove Auditory Stimulus5
Convey Urgency Appropriately3
Be Adjustable3
Be Adjustable3
Avoid Distracting the Driver3
Be Detectible/ Discriminable2
Be Detectible/ Discriminable2
Avoid Distracting the Driver2
Convey Urgency Appropriately1
Train Properly2
Train Properly1
Remove Visual Stimulus2
Remove Visual Stimulus1
Include Haptic Stimulus1
Remove Haptic Stimulus1
Remove Haptic Stimulus0
Include Haptic Stimulus0
Audio-Visual Haptic-Audio-Visual
One more specific topic fell under the most frequently occurring code, “Design
Auditory Stimulus Properly.” Nineteen out of the 30 of these comments were that the
volume was too high or should be lowered.
Curve Warning Acceptance Questionnaire
The Curve Warning Acceptance Questionnaire (Appendix H) gathered user
ratings of the curve warnings in general, not about each stimulus presentation separately.
An ANOVA for this measure indicated a significant difference between younger and
older ratings for three of the nine questionnaire items (Appendix W.5). Figure 4.13
73
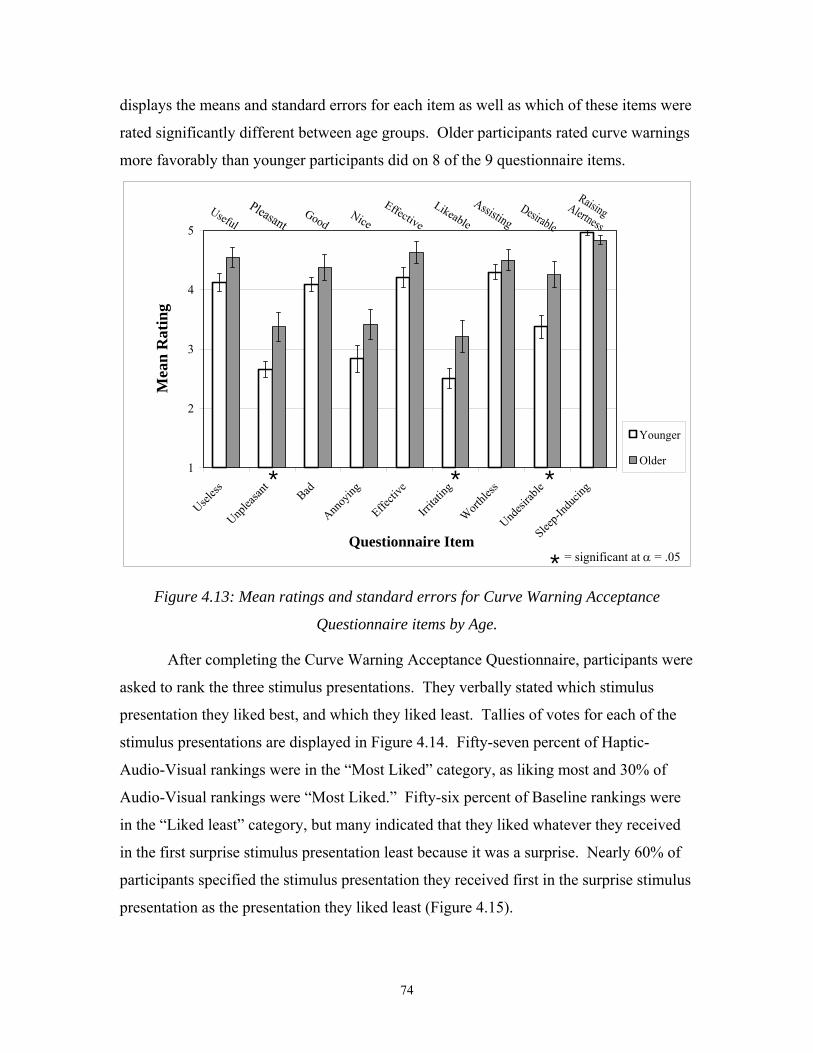
displays the means and standard errors for each item as well as which of these items were
rated significantly different between age groups. Older participants rated curve warnings
more favorably than younger participants did on 8 of the 9 questionnaire items.
1
2
3
4
5
Useless
Unplea
sant
Bad
Annoy
ing
Effecti
ve
Irrita
ting
Wort
hless
Undesi
rable
Sleep-I
nduc
ing
Mea
n R
atin
g
Younger
Older
Questionnaire Item
* **
= significant at α = .05*
Figure 4.13: Mean ratings and standard errors for Curve Warning Acceptance
Questionnaire items by Age.
After completing the Curve Warning Acceptance Questionnaire, participants were
asked to rank the three stimulus presentations. They verbally stated which stimulus
presentation they liked best, and which they liked least. Tallies of votes for each of the
stimulus presentations are displayed in Figure 4.14. Fifty-seven percent of Haptic-
Audio-Visual rankings were in the “Most Liked” category, as liking most and 30% of
Audio-Visual rankings were “Most Liked.” Fifty-six percent of Baseline rankings were
in the “Liked least” category, but many indicated that they liked whatever they received
in the first surprise stimulus presentation least because it was a surprise. Nearly 60% of
participants specified the stimulus presentation they received first in the surprise stimulus
presentation as the presentation they liked least (Figure 4.15).
74

0
5
10
15
20
25
30
Baseline Audio-Visual Haptic-Audio-Visual
Tot
al P
artic
ipan
t Res
pons
es
ConditionMost Liked
ConditionLeast Liked
Figure 4.14: Total participant responses categorizing stimulus presentations as “most
liked” and “least liked.”
Run 225%
Run 1 (Surprise)
58%
Run 317%
Figure 4.15: Percentages in which the stimulus presentation chosen as least liked
was presented in each Run.
75

Research Quest ion 4 : Hazard Percept ion and Risk -
Taking Sty le
Hazard Perception
The Hazard Perception Questionnaire (Appendix I), which included five items
pertaining to driver perceptions of hazards ranked on a Likert-type scale, was completed
by each participant. Participants reported to what degree they agreed with statements on
a scale from 1 (Strongly Disagree) to 5 (Strongly Agree). Mean ratings for each item by
age group are displayed in Figure 4.16. ANOVAs were performed to see whether
differences in mean ratings were significant based on Age and all ANOVA tables are
presented in Appendix W.6. None of the items of the questionnaire had mean ratings that
were significantly different based on Age.
1
2
3
4
5
Often Driveon TightCurves
SR CurveCould Be
Dangerous
Usually Speedon Curves
RoadwayCurves areHazardous
Posted Speedsare Too Slow
Mea
n R
atin
g
Younger Drivers
Older Drivers
Questionnaire Item
Strongly Agree
Strongly Disagree
Figure 4.16: Mean ratings and standard error bars for Hazard Perception Questionnaire
items by Age.
76

Also as part of the Hazard Perception Questionnaire, drivers who experienced a
stimulus presentation in their first run down the road verbally asked, “Would you say that
you first became aware of the sharp curve (turnaround loop) at the end of the SR prior to
the warning, during the warning, or after the warning?” The majority of participants said
that they noticed the curve during the warning Figure 4.17.
After the Warning
41%
Prior to the Warning
6%
During the Warning
53%
Figure 4.17: Response percentages for the Hazard Perception Questionnaire
Item, "When did you first become aware of the sharp curve (turnaround loop) at the end
of the Smart Road?"
Driver performance was compared between participants’ responses to when they
first noticed the curve on the SR. The two participants reporting that they saw the curve
prior to the warning did reach lower curve entrance speeds, though their speed was not
significantly different than participants who noticed the curve during and after the
warning. Means and standard errors are graphed in Figure 4.18.
77
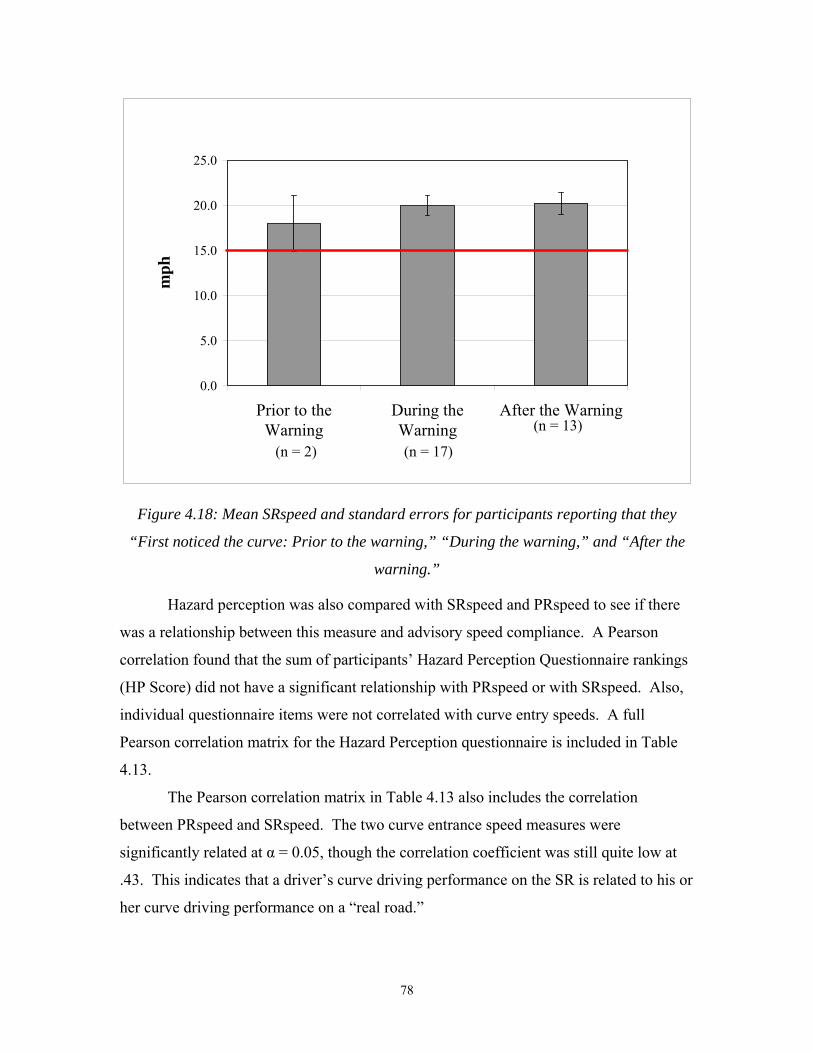
0.0
5.0
10.0
15.0
20.0
25.0
Prior to theWarning
During theWarning
After the Warning
mph
(n = 2) (n = 17)
(n = 13)
Figure 4.18: Mean SRspeed and standard errors for participants reporting that they
“First noticed the curve: Prior to the warning,” “During the warning,” and “After the
warning.”
Hazard perception was also compared with SRspeed and PRspeed to see if there
was a relationship between this measure and advisory speed compliance. A Pearson
correlation found that the sum of participants’ Hazard Perception Questionnaire rankings
(HP Score) did not have a significant relationship with PRspeed or with SRspeed. Also,
individual questionnaire items were not correlated with curve entry speeds. A full
Pearson correlation matrix for the Hazard Perception questionnaire is included in Table
4.13.
The Pearson correlation matrix in Table 4.13 also includes the correlation
between PRspeed and SRspeed. The two curve entrance speed measures were
significantly related at α = 0.05, though the correlation coefficient was still quite low at
.43. This indicates that a driver’s curve driving performance on the SR is related to his or
her curve driving performance on a “real road.”
78
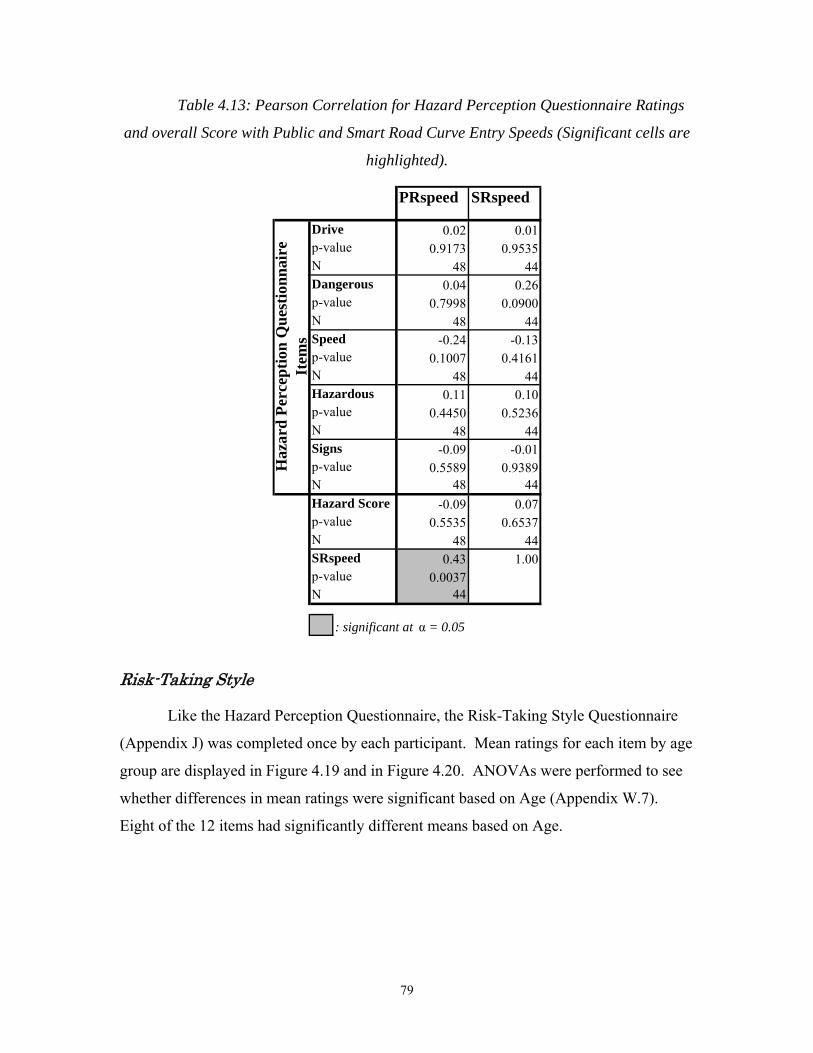
Table 4.13: Pearson Correlation for Hazard Perception Questionnaire Ratings
and overall Score with Public and Smart Road Curve Entry Speeds (Significant cells are
highlighted).
PRspeed SRspeed
0.02 0.010.9173 0.9535
48 440.04 0.26
0.7998 0.090048 44
-0.24 -0.130.1007 0.4161
48 440.11 0.10
0.4450 0.523648 44
-0.09 -0.010.5589 0.9389
48 44-0.09 0.07
0.5535 0.653748 44
0.43 1.000.0037
44
: significant at α = 0.05
p-valueN
SRspeed
Haz
ard
Perc
eptio
n Q
uest
ionn
aire
It
ems
Hazard Scorep-valueN
p-valueN
Drive
Dangerous
Speed
Hazardous
Signs
p-valueN
p-valueN
p-valueN
p-valueN
Risk-Taking Style
Like the Hazard Perception Questionnaire, the Risk-Taking Style Questionnaire
(Appendix J) was completed once by each participant. Mean ratings for each item by age
group are displayed in Figure 4.19 and in Figure 4.20. ANOVAs were performed to see
whether differences in mean ratings were significant based on Age (Appendix W.7).
Eight of the 12 items had significantly different means based on Age.
79
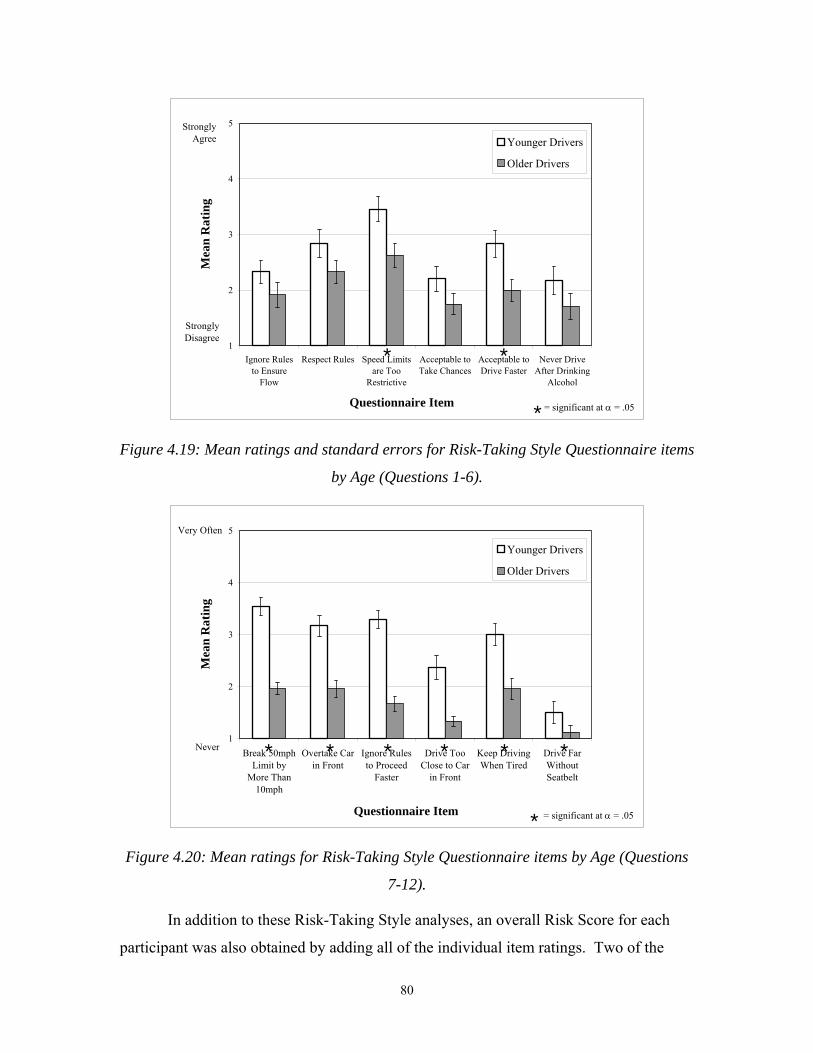
1
2
3
4
5
Ignore Rulesto Ensure
Flow
Respect Rules Speed Limitsare Too
Restrictive
Acceptable toTake Chances
Acceptable toDrive Faster
Never DriveAfter Drinking
Alcohol
Mea
n R
atin
g
Younger Drivers
Older Drivers
Questionnaire Item = significant at α = .05*
*
Strongly Agree
Strongly Disagree
*
Figure 4.19: Mean ratings and standard errors for Risk-Taking Style Questionnaire items
by Age (Questions 1-6).
1
2
3
4
5
Break 50mphLimit by
More Than10mph
Overtake Carin Front
Ignore Rulesto Proceed
Faster
Drive TooClose to Car
in Front
Keep DrivingWhen Tired
Drive FarWithoutSeatbelt
Mea
n R
atin
g
Younger Drivers
Older Drivers
Questionnaire Item = significant at α = .05*
* *
Very Often
Never * * **
Figure 4.20: Mean ratings for Risk-Taking Style Questionnaire items by Age (Questions
7-12).
In addition to these Risk-Taking Style analyses, an overall Risk Score for each
participant was also obtained by adding all of the individual item ratings. Two of the
80

questionnaire items were flipped so that the “riskier” behavior was at the higher end of
the scale and the “less risky” behavior was at the lower end of the scale, so that a higher
Risk Score indicated participants with a higher propensity for risk-taking. The maximum
possible Risk Score was 60, the minimum possible was 12. Mean Risk Scores for
younger and older participants are graphed in Figure 4.21.
10
15
20
25
30
35
40
45
50
55
60
Age Group
Mea
n R
isk
Scor
e
Younger DriversOlder Drivers
Figure 4.21: Mean Risk Scores by Age.
Risk-taking style questionnaire items were also compared with SR curve entry
speed (SRspeed) and public road curve entry speed (PRspeed) to see if there was a
relationship between risk-taking style and advisory speed compliance. A Pearson
correlation indicated several significant relationships at α = 0.05 (Table 4.14). Seven out
of the 12 items correlated in a positive direction with PRspeed, thus ratings toward the
“riskier” end of the scale corresponded with higher Public Road curve entry speeds.
Only the item, “If you are a good driver it is acceptable to drive a little faster” correlated
with the SR curve entry speed, though the Pearson coefficient was low at 0.36. Finally,
Risk Score was weakly but significantly correlated with SRspeed, and Risk Score was
positively correlated with PRspeed.
81
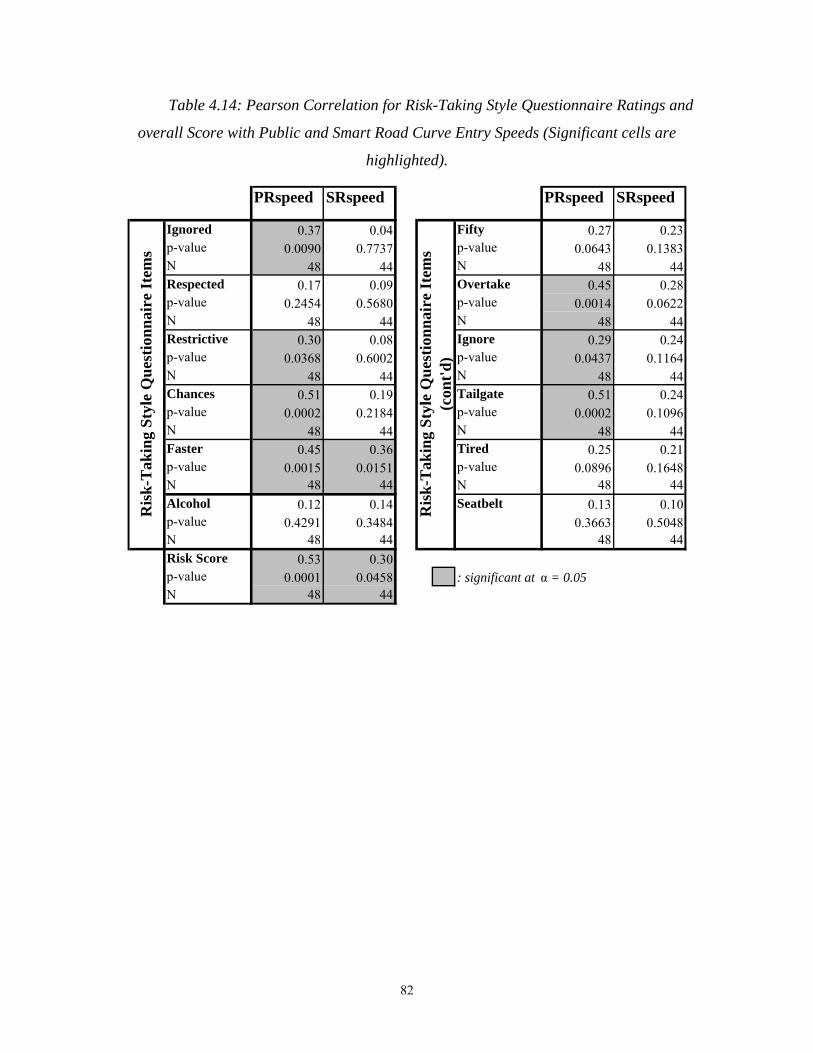
Table 4.14: Pearson Correlation for Risk-Taking Style Questionnaire Ratings and
overall Score with Public and Smart Road Curve Entry Speeds (Significant cells are
highlighted).
PRspeed SRspeed PRspeed SRspeed
0.37 0.04 0.27 0.230.0090 0.7737 0.0643 0.1383
48 44 48 440.17 0.09 0.45 0.28
0.2454 0.5680 0.0014 0.062248 44 48 44
0.30 0.08 0.29 0.240.0368 0.6002 0.0437 0.1164
48 44 48 440.51 0.19 0.51 0.24
0.0002 0.2184 0.0002 0.109648 44 48 44
0.45 0.36 0.25 0.210.0015 0.0151 0.0896 0.1648
48 44 48 440.12 0.14 0.13 0.10
0.4291 0.3484 0.3663 0.504848 44 48 44
0.53 0.300.0001 0.0458 : significant at α = 0.05
48 44
Ris
k-T
akin
g St
yle
Que
stio
nnai
re It
ems
SeatbeltRis
k-T
akin
g St
yle
Que
stio
nnai
re It
ems
(con
t'd)
Alcoholp-valueN
Tiredp-valueN
NTailgatep-valueN
p-valueNIgnorep-value
Fiftyp-valueNOvertake
p-valueN
Risk Scorep-value
Chancesp-valueNFaster
Ignoredp-valueNRespectedp-valueNRestrictivep-valueN
N
82

C H A P T E R 5 : D I S C U S S I O N
Research Quest ions Rev is i ted
Research Question 1: Stimulus Presentation and Performance
H1.1. Participants presented with a curve warning stimulus will have quicker
throttle and brake reaction times and greater speed compliance than those not receiving
a warning.
Not surprisingly, participants demonstrated significantly quicker reaction times
and more appropriate curve entry speeds when presented with the curve warning stimuli
(Audio-Visual and Haptic-Audio-Visual) than when receiving no stimuli (Baseline
condition). This finding was consistent with previous literature showing improved
performance with the presence of in-vehicle warnings (Comte & Jamson, 2000; Dingus et
al., 1997; Hanowski et al., 1999; Neurauter, 2004; Uno & Hiramatsu, 2001).
Interestingly, this was true when the measures were taken in the surprise stimulus
presentation and when they were repeated within subjects after participants had previous
experience with the curve. Participants, even when already aware of the curve, had
quicker reaction times as well as more appropriate curve entry speed when presented with
a warning. This may indicate that participants benefited from the warnings’ explicit
indication of the advisory speed. The results from Neurauter (2004) also showed that
participants performed better as well as preferred stimuli that indicated the desired speed
than those stimuli that did not provide instructions as per advisory speed. Additionally,
the visual component of the warnings indicated the desired speed and the stimulus did not
terminate until the driver reached the desired speed. Some participants expressed their
awareness of this feature and the incentive it created to slow down to the advisory speed.
Lee, Gore, and Campbell (1999) found that explicit command messages resulted in
higher compliance than notifications, and warning design guidelines include the
recommendation that warnings should indicate the desired response action (Wogalter et
al., 2002).
83

Even though participants who received a stimulus had more appropriate curve
entry speeds than those in the Baseline condition, their speeds remained higher than the
advisory speed of 15 mph. Neurauter (2004) found this as well, where 75% were within
5 mph of the advisory, and 100% were within 10 mph, but most were above the advisory
speed. In the current study, speed was only taken from one point, the curve entrance,
rather than several points along the curve. Neurauter (2004) found that speeds for the
curve apex and curve exit reflected the speed for curve entry. The formula used to
calculate the advisory speed warning onset point utilizes the curve apex as the point of
interest (Appendix L). By examining curve entrance speed rather than apex, the measure
may not indicate the lowest speed the driver reached. The curve entrance measure,
however, may point to the drivers’ readiness to comply with the warning rather than
abiding by physical necessity of the curve.
Another consideration in looking at these results is whether the difference
between curve entrance speed for drivers who received a warning and drivers who did
not, though significant, is a meaningful difference. The difference between the mean
speeds for Baseline versus the warning presentation conditions was about 5 mph.
Though this does not seem like a drastic change in curve entrance speed there are several
issues to consider before deciding whether it is meaningful. First, as mentioned in
previous sections, six of the participants required experimenter intervention to ensure a
safe driving maneuver. Data from these participants were then removed from analyses,
and thus the “poorest” driver performance responses were not included in the results. If
the data from poorer drivers were able to be examined, a larger effect of warning
presence may be seen, but because of the safety constraints of the project this hypothesis
could not be proven.
Secondly, 5 mph is the difference between mean curve entrance speeds, not
reflecting more extreme differences that resulted for individual drivers. For 16 out of 42
participants, or 38%, there was a difference of more than 10 mph between their Baseline
condition and warning presentation, the most extreme being 34 mph in the baseline
condition and then 12 mph in the warning condition. Using AASHTO calculations for
curve characteristics and curve advisory speeds (AASHTO, 2001), 10 mph can mean the
difference between being able to maneuver a curve and running off the road.
84

H1.1. (cont’d). Participants receiving the Haptic-Audio-Visual stimulus in the
first “Surprise” stimulus presentation will not perform as well as those receiving the
Audio-Visual stimulus.
Contrary to the hypothesis, TRT and BRT were slightly slower for the Audio-
Visual presentation, though differences between this presentation and the Haptic-Audio-
Visual one were not significant. This hypothesis specifically referred to the results from
the surprise stimulus presentation, and so the between-subjects analysis was used.
Results also showed no significant differences between the two stimulus presentations in
terms of SR curve entry speed.
Although some participants expressed surprise at the onset of the Haptic-Audio-
Visual stimulus when the pedal moved, no participant expressed confusion in its meaning
as predicted based on the results of Neurauter (2004) or Lloyd et al. (1999). This may be
due to the presence of the auditory and visual modes in conjunction with the haptic
stimulus, each providing more details pertaining to the proper driver response. No
measurements were used to examine the driver interpretations of the haptic component
when isolated.
H1.2. Overall, participants will demonstrate quicker reaction times and closer
curve advisory speed compliance when receiving the Haptic-Audio-Visual stimulus than
they will when receiving the Audio-Visual and Baseline conditions.
Participant reaction times were slightly quicker and curve entrance speeds were
closer to the advisory speed for the stimulus including the haptic mode; however these
differences were not found to be significant as predicted based on Manser (2004) and
Neurauter (2004). Part of the explanation for this may be the lack of detection of the
stimulus by many of the drivers. A number of participants reported that they did not feel
the haptic stimulus. Without noticing the push-back, the two warnings would be
perceived as identical, and the results seem to indicate that interpretation. Though the
pedal force was double that of previous simulator studies (Janssen & Nilsson, 1993;
Neurauter, 2004), this design still may not be salient enough for application in a bumpy,
on-road setting with many competing stimuli. Also, this form of haptic display may not
be the most appropriate display for conveying curve warning information, and other
85

haptic feedback designs such as pulses in the pedal or seat shakers should be considered
for testing.
H1.3. Participant performance will improve with each subsequent encounter
with the curve and Stimulus Presentation.
This hypothesis was only found to be true for the BRT measure. The first
“surprise” stimulus presentation had slower mean BRT than the third stimulus
presentations by about 1 second. Improved BRT may have been due to increased
experience and comfort with the driving and warning situations. The lack of significant
difference between SRspeed for the first and last runs, however, may mean that the
change in BRT did not affect overall performance. Drivers were still able to comply with
the warning on the first trip as well as they did on the last.
One interesting finding relating to subsequent runs was that even though the audio
and visual components of the stimulus presentations were identical each time they were
presented, a number of participants expressed the opinion that something about the
warning had changed from their first surprise encounter with the stimulus. Fourteen of
the possible 48 comments pertaining to the second experience of a warning, or 29%,
indicated that something about the stimuli had changed. Specific comments included that
the audio did not seem as loud, the visual did not seem as bright, or the warning was
activated sooner the second time they experienced these stimuli as compared to the first
time they experienced them. Though the stimuli were presented the same way each time,
the surprise element associated with the first encounter may have amplified the sensation
of the stimuli to the participants. As participants adapted to the presence of the warning
and its display features, they may have found the display to be less harsh.
Research Question 2: Age and Performance
H2.1. Older drivers will have slower reaction times but higher compliance with
curve entry speed.
Surprisingly, older participants did not have significantly slower reaction times
than younger participants as shown in Neurauter (2004) and Warshawsky-Livne and
Shinar (2002). Younger participants, who have been shown to exhibit lower compliance
86
with warnings (Neurauter, 2004; Uno & Hiramatsu, 2001), may have been less inclined
to follow warning instructions thus influencing their reaction times at stimulus onset as
well.
Another difference in performance by age occurred in the experimenter safety
controls executed in the participant sessions. Five of the 6 participants who received
either a verbal “brake” or experimenter brake application to slow down were older
participants. The necessity of this safety measure may have occurred because of slow
reaction time, confusion, or a combination of both. Though the data for these participants
were not included in analyses, the count of these occurrences suggests an age difference
in performance. By removing these data, poorer drivers may have been deselected, and
these drivers may be the ones who would benefit the most from a CWD. Due to the
safety considerations involved with performing an on-road project, though, the
interventions were necessary. By performing the study in a driving simulator, more
dangerous scenarios could be allowed to examine the benefits of the device in close-call
situations for poorer drivers.
As hypothesized, though, older drivers had significantly slower curve entry
speeds than younger drivers. This may relate to some “person variables,” such as risk-
taking style, which will be discussed in following sections.
H2.2. Performance between stimulus presentations will stay consistent for both
age groups, though younger participants may perform better with Haptic-Audio-Visual
than older ones.
Age and stimulus interactions were not found to be significant except for TRT
when examining Stimulus Presentation as a repeated measure. For this measure, older
participants had a slower mean TRT than younger participants for the Baseline condition
and then quicker mean TRT than younger drivers for the Haptic-Audio-Visual stimulus
presentation. This may suggest that this curve warning stimulus was more of an aid to
older drivers than younger drivers. As mentioned in the literature review, Uno and
Hiramatsu (2001) previously found older drivers to benefit more than younger drivers
when presented with early intersection warnings.
87

Research Question 3: Subjective Evaluation
H3.1. The Audio-Visual stimulus will be rated more favorable than Haptic-
Audio-Visual, especially in the area of “annoyance.”
For the subjective variable stimulus comprehension, Audio-Visual outperformed
the Haptic-Audio-Visual stimulus. Participants had higher comprehension scores with
the stimulus lacking the haptic mode; however this measure may not be isolating
comprehension but instead including noticeability as well. Interestingly, older
participants reported noticing the haptic stimulus less often than younger participants
reported noticing the haptic stimulus; however older participants had better overall TRT
with the haptic stimulus included than they did without it. The performance evaluation
showed a significant interaction of Age and Stimulus Presentation, with older drivers
exhibiting quicker TRT when presented with the H-A-V Stimulus Presentation than the
A-V presentation. Also, older drivers had quicker TRT than the younger drivers when
each group was presented with H-A-V. It may be that the haptic component physically
influenced the driving performance somewhat as the distance the device pushed the
throttle back was enough to begin to physically decrease acceleration. This possibility
may help to explain the difference between the H-A-V and A-V Stimulus Presentations,
but not the finding that older participants performed better with H-A-V than younger
participants. Differences in reaction times between the stimulus presentations and age
groups, though, were less than 0.5 seconds, and thus may not prove to be meaningful in
the analysis and development of CWDs.
Contrary to the hypothesis, the Post-Condition Questionnaire item ratings for
annoyance were not significantly different between the stimulus presentations. For this
questionnaire, the only significant difference was that younger participants reportedly
would “want” the Haptic-Audio-Visual stimulus more than their older counterparts if
such a warning were installed in their car. As mentioned, older participants reported
feeling the haptic stimulus less often than the younger participants did. At the end of the
participant session, each component of the stimulus presentations were explained to
them. Once they knew that a haptic stimulus was present, older participants’ missing of
the haptic component may have signified to them that such a faint component is
unnecessary. Still, older drivers performed better in terms of TRT when the haptic
88

component was present, though it was unlikely that the participants were aware of their
improved performance in the presentations including haptic.
Open-ended responses for the Post-Condition Questionnaire were analyzed in
terms of design guidelines. One interesting finding was the frequent occurrence of
comments indicating that the speech component was too loud. Seventeen percent of the
older participants and 23% of younger participants said that the warning was “too loud.”
The stimulus was designed to meet human factors criteria of auditory warning design,
with all 1/3 octave bands 13 dbA above the masked threshold (Berger et al., 2000). The
warning also met ISO criteria for in-vehicle message displays stating that the signal
should stay in the range of 50 dBA to 90 dBA (International Organization for
Standardization, 2003a). The perception that it was too loud may have been influenced
by the “surprise” nature of the study.
The Curve Warning Acceptance Questionnaire resulted in a number of significant
differences in rankings based on Age. Older participants ranked the CWD significantly
more favorably than younger participants. Older participants may have seen the added
benefit of such a system more than the younger participants. The more favorable opinion
may be related to the concepts included in the following section, hazard perception and
risk-taking style.
Research Question 4: Hazard Perception and Risk-Taking Style
H4.1. Individuals with higher hazard perception scores will comply with curve
advisory speeds more than individuals with low hazard perceptions.
Interestingly, younger drivers did not have significantly different hazard
perception ratings on individual Hazard Perception Questionnaire items from the ratings
of older drivers. The mean HP Score for younger drivers was not significantly different
than the mean HP Score for older drivers as well. In previous research, individuals with
higher levels of hazard perception have been found to comply with warnings more than
individuals with low hazard perceptions (Friedmann, 1988; Vredenburgh, 1995). When
comparing hazard perception scores with performance measures using a Pearson
correlation, no significant relationships existed between Hazard Score and PRspeed or
SRspeed. This may mean that the hazard perception tool used for this study needs to be
89

revised and validated. The lack of difference between the hazard perception scores for
younger and older participants may also suggest that this population of participants
shared other characteristics due to self-selection as they all chose to participate in this
study. Individuals included in the study needed to be willing to have their driving
behavior observed, drive after dark, and to drive at speeds of up to 55mph.
H4.2. Individuals with higher risk-taking style scores will comply with curve
advisory speeds less than individuals with low risk-taking style scores.
In relating reported risk-taking styles to actual performance, a Pearson correlation
found several significant relationships between questionnaire items and PRspeed and
SRspeed. A sum of all of the items, to create a Risk-Taking Style Score, also
significantly related to PRspeed and SRspeed. The “riskier” the tool found participants to
be, the faster they drove on the curves. This speaks well for the validity of the risk-taking
style tool previously tested by Iversen (2004) as it was found to relate to actual driver
acts.
Limitat ions
Loss of Data Points
As discussed in the data reduction section, several performance measure data
points were lost due to criteria set for the study. These criteria required that if
experimenter guidance was provided, the data would be thrown away, and if the foot was
not in the right position then some measures would be lost as well. Many “good” data
points were collected, and a power analysis showed that the results were not substantially
affected by the missing data. The main limitation comes from the possibility of non-
random loss of data; in this case, five of the six missing points were from older
participants, and the reduced representation of the older age group in this study may
affect the ability of the data to accurately represent the older driving population.
90
Brief Study Duration
Participants in this study only experienced one exposure each of two different
curve warning stimuli. Driver reactions, attitudes, and compliance with the warning may
change if given the chance to experience the warning over a longer period. While the
initial exposure is valuable in examining how drivers may react to the warning if they
were unfamiliar with the warning, had not experienced the warning for a long time, or
were distracted while driving, information on how drivers react to such a warning over
time is necessary to further develop the design of this technology.
Test Highway
There are many “pros” to closed test highway studies, including real driving feel
and feedback, and ability to exert control over many variables, such as traffic on the road,
allowing a safe environment for driving tests. The SR provided these benefits, but also
presented some challenges. Challenges included road architecture, such as the downhill
slope of the approach to the curve, the size and shape of the curve, as well as the presence
of only one curve suited to the experimental procedure. Performing the study with an
experimenter on the SR also may have created demand effects for the participants. The
presence of an experimenter may influence driving behavior so that the participant was
more cautious, more compliant, or more eager to perform well than if the data were
collected without an experimenter present.
91

C H A P T E R 6 : C O N C L U S I O N S
Summary o f F ind ings
The goal of this research was to determine effective attributes of curve warning
stimulus presentation combinations to make recommendations toward design guidelines.
In determining effective attributes, objective performance and subjective preference were
examined. Individual differences such as age, hazard perception, and risk-taking style
were also considered. Objective results indicated that there was a significant
improvement in performance when drivers were presented with a warning than when they
received no warning. Whether the warning included a haptic stimulus, though, did not
significantly affect driver performance. From the subjective results, participants ranked
the presentation including the haptic component more favorably than the one without the
haptic mode.
Resul ts and the Warning Process Mode l
A model of the warning process (Rogers et al., 2000) was adapted in an earlier
chapter to describe the variables examined in this research and their influence on the
warning process (Figure 6.1). Previous research indicated that the warning process is
affected by various person variables as well as warning variables. For this study, Age
was predicted to influence each step of the warning process, however results indicated
otherwise. Although not predicted, Age was a significant factor in whether the
participant noticed all of the components of the stimulus. The striped arrow added from
Age to Notice represents this finding (Figure 6.2). Age was also a significant main effect
for Curve Warning Acceptance, and so the connection remained in the diagram for this
relationship. Contrary to what was predicted, Age was not a significant main effect for
TRT or BRT. Stimulus Presentation did not have a significant relationship with TRT or
BRT either, and so TRT and BRT were removed from the model. One other component
of the model to be removed was Stimulus Presentation as a Warning Variable that affects
92

Compliance. In this study, no significant differences were found between the two
warning stimulus presentations in terms of curve entry speed. It is important to keep in
mind, though, that the two stimulus presentations used for this study were very similar,
differing only by the presence of a haptic display. A study comparing more diverse
stimuli may have increased the likelihood of seeing an effect of Stimulus Presentation, as
demonstrated in Neurauter (2004). Stimulus Presentation, specifically the haptic
modality, was significantly related to whether the warning was noticed, though, as
represented by the striped arrow from Stimulus Presentation to Notice.
The other components of the model remained intact. These include Age as a
variable significantly related to compliance, as older drivers had significantly lower curve
entry speeds than younger drivers. Also, Risk-Taking Style measures were significantly
linked with curve entrance speed. The original proposed model is included in Figure 6.1
to allow comparison with the modified concept map included in Figure 6.2.
93

Notice Encode Comprehend Comply
* Age ~ Hazard Perception ~ Risk-Taking Style
Person Variables
Warning Variables !
o Curve Entry Speed
~ Stimulus Comprehension
* Age
o Throttle RT o Brake RT
* Stimulus Presentation (Modalities)
* Age * Age
* = Independent Variables o = Objective Dependent Variables ~ = Subjective Dependent Variables
~ Curve Warning Acceptance
* Stimulus Presentation (Modalities)
* Stimulus Presentation (Modalities)
* Stimulus Presentation (Modalities)
Figure 6.1: Original Warning Process Model developed for the current study (changes
based on results of this study are highlighted).
Notice Encode Comprehend Comply
* Age ~ Risk-Taking Style
Person Variables
Warning Variables !
o Curve Entry Speed
~ Stimulus Comprehension
* Age
* Stimulus Presentation (Modalities)
* = Independent Variables o = Objective Dependent Variables ~ = Subjective Dependent Variables
~ Curve Warning Acceptance
* Stimulus Presentation (Modalities)
* Age
Figure 6.2: Warning Process Model modified to reflect results from the current study.
94

Recommendat ions toward Des ign Guide l ines
The following recommendations were developed based on previous research as
well as performance and ratings gathered from the current study:
1. Design the physical aspects of the auditory, visual, and haptic components
properly.
- Proper sound level, length, and possible precursor tone for the auditory
- Brightness, flash rate, and location for visual
- Force, direction, duration for haptic
2. Avoid startling the driver by properly designing the intensity and onset of the
warning so that it does not overload the driver’s sensing capabilities or evoke
a startle response from the driver.
3. The CWD should be understandable and indicate the appropriate driver
response to the situation.
4. The CWD should be adjustable to meet the individual demands of drivers
without compromising system effectiveness.
5. Time the warning so that the device activates early enough to allow the driver
to respond properly, but not so early that it produces many false alarms.
Future Research
Stimuli Design
The stimuli used in this study were designed following tested design
specifications; however these specifications had not been tested as a curve warning
device on-road. The focus of the current research was broader than fine-tuning stimuli
specifications, but such work is necessary. Most notably, the haptic throttle push-back is
a very new form for an in-vehicle warning system and needs dedicated research to
produce proper design specifications. In this study, even though the haptic force was
raised to double that used in simulator studies, many participants still did not perceive the
stimulus. Also, even though visual and auditory stimuli have been present in vehicles for
95

many years, the specific purpose and combination of these in a curve warning device
requires dedicated testing as well.
Findings from this study suggest incorporating adjustability into the design of the
stimuli. Further testing is needed to verify the adjustability ranges for the stimuli for
dimensions such as luminance and size, sound level, and haptic force. Settings may then
be adjustable, within determined parameters, for different driving assistance needs such
as drivers’ psychomotor and sensory abilities, age, experience, and driving environment
(for example, urban vs. rural).
Naturalistic Study
Once CWD interface components have been developed, the device needs to be
tested in a natural driving situation. Field studies examining everyday driving in vehicles
equipped with this device would help to examine changes in annoyance, effectiveness,
and preference. For example, participants preferred a speech auditory stimulus to a tone
in the Neurauter (2004) simulator study, however driver opinions about speech stimuli
may change if experienced in a real driving setting including passengers, multiple
exposures, and possible false alarms.
In future studies, it would be beneficial to lengthen the study duration to increase
driver exposures to the warning and to gather more data from these encounters over time.
Lengthening the experimental session would also help to lessen the demand effects on the
participants as they would increasingly drive as they normally would and become less
aware of their participation in data collection. Another way to lessen demand effects is
automating or removing the experimenter from the vehicle, for example using a virtual
experimenter through recordings (Martin, 2000). Drivers may perform more naturally
without the presence of an experimenter.
Variables to examine in future studies could include the number of times the
warning is presented and what events preceded and followed the presentation. Driver
performance measures would then be gathered in the seconds following warning
presentation, including measures such as throttle and brake reaction times as well as
curve entrance speed. Vehicle and video data similar to that collected in this study would
be beneficial in a naturalistic one as well. Also, to examine changes in driver preference
96

or annoyance over time, the naturalistic study could utilize a computerized rating prompt
in the vehicle linked to warning activation with simple button inputs for the driver. This
device would collect a database of drivers’ reactions immediately following their
experience of the warning. Further questioning and interviews could be used to gather
driver evaluations of the warning as it performed for them in a natural setting over time.
The Potent ia l f or Mult i -Modal i ty Curve Warnings
One main question of interest for this research was the added value of the haptic
component in a curve warning device as well as the effects of age. Using objective and
subjective measures, the added benefit of this mode is not strongly convincing. A
foundation for methods of testing this mode in an on-road environment was developed
through this research. Potential exists for development of this type of technology to be
used by drivers of different ages with varying personal traits, but more testing of the
modalities in a naturalistic setting is necessary.
97

R E F E R E N C E S
Allin, S., Matsuoka, Y., and Klatzky, R. (2002). Measuring just noticeable differences for haptic force feedback: Implications for rehabilitation. Proceedings of the 10th Sumposium on Haptic Interfaces for Virtual Environments and Teleoperator Systems (IEEE).
American Association of State Highway Transportation Officials. (2001). A policy on geometric design of highways and streets (Fourth ed.). Washington, D.C.: AASHTO.
Belz, S. M., Robinson, G.S., and Casali, J.G. (1999). A new class of auditory warning signals for complex systems: Auditory icons. Human Factors, 41(4), 608-618.
Berger, E. H., Royster, L.H., Royster, J.D., Driscoll, D.P., and Layne, M. (2000). The noise manual (5th ed.). Fairfax, VA: American Industrial Hygiene Association.
Bhullar, J., Moore, R., and Cutler, C.D. (1993). Curve warning sign study (No. FHWA/CAL/TO-91-4). Sacramento: California Department of Transportation.
Bliss, J. P., and Acton, S.A. (2002). Alarm mistrust in automobiles: How collision alarm reliability affects driving. Applied Ergonomics, 34(6), 499-509.
Campbell, J. L., Carney, C., and Kantowitz, B.H. (1998). Human factors design guidelines for advanced traveler information systems (ATIS) and commercial vehicle operations (CVO) (No. FHWA-RD-98-057). McLean, VA: Office of Safety and Traffic Operations R&D, Federal Highway Administration.
Charlton, S. G. (2004). Perceptual and attentional effects on drivers' speed selection at curves. Accident Analysis and Prevention, 36(5), 877-884.
Chowdhury, M. A., Warren, D.L., Bissell, H., and Taori, S. (1998). Are the criteria for setting advisory speeds on curves still relevant? ITE Journal, 68(2), 32-45.
Cohen, B. H. (2001). Explaining psychological statistics (Second ed.). New York: John Wiley & Sons, Inc.
Comte, S. L., and Jamson, A.H. (2000). Traditional and innovative speed-reducing measures for curves: An investigation of driver behavior using a driving simulator. Safety Science, 36, 137-150.
98

Department of Motor Vehicles. (2004). Medical information: Vision screening (Vol. 2004): Virginia DMV.
Dingus, T. A., McGehee, N.M., Jahns, S.K., Carney, C., and Hankey, J.M. (1997). Human factors field evaluation of automotive headway maintenance/collision warning devices. Human Factors, 39(2), 216-229.
Donald, D. (1997). Be warned! A review of curve warning signs and curve advisory speeds. Vermont South, Australia: ARRB Transport Research.
Edworthy, J. (1994). The design and implementation of non-verbal auditory warnings. Applied Ergonomics, 25(4), 202-210.
Farmer, C. M., and Lund, A.K. (2002). Rollover risk of cars and light trucks after accounting for driver and environmental factors. Accident Analysis and Prevention, 34, 163-173.
Federal Highway Administration. (2003). Manual on uniform traffic control devices: Revision 1. Washington, D.C.: U.S. Department of Transportation, FHWA.
Fleming, S. (2004). Driving out death. Retrieved August 29, 2004, from http://americancityandcounty.com/mag/government_driving_death/
Friedmann, K. (1988). The effect of adding symbols to written warning labels on user behavior and recall. Human Factors, 30(4), 507-515.
Graham, R. (1999). Use of auditory icons as emergency warnings: Evaluation within a vehicle collision avoidance application. Ergonomics, 42(9), 1233-1248.
Gray, R., Tan, H. Z., & Young, J. J. (2002). Do multimodal signals need to come from the same place? Paper presented at the Fourth IEEE International Conference on Multimodal Interfaces (ICMI 2002), Pittsburgh, PA.
Green, P., Levison, W., Paelke, G., and Serafin, C. (1995). Preliminary human factors design guidelines for driver information systems (No. FHWA-RD-94-087). McLean, VA: Federal Highway Administration.
Hagiwara, T., Suzuki, K., Tokunaga, R.A., Yorozu, N., and Asano, M. (2001). Field study of driver's curve-detection performance in daytime and nighttime. Transportation Research Record No. 1779, 75-85.
99
Hanowski, R. J., Dingus, T.A., Gallagher, J.P., Kieliszewski, C.A., and Neale, V.L. (1999). Driver response to in-vehicle warnings. Transportation Human Factors, 1(1), 91-106.
Herrtwich, R. G. (2002). Digital roadmaps reveal the telematic horizon. Vol. 12, No. 8. Retrieved August 29, 2004, from http://www.itsa.org/mn.nsf/0/555c680957630f7785256c090061866d?OpenDocument.
Hoffman, J., Lee, J.D., and Hayes, E.M. (2003). Driver preference of collision warning strategy and modality. Paper presented at the Second International Driving Symposium on Human Factors in Driver Assessment, Park City, UT.
Hood, M. (2001). Advanced warning signs for turns and curves. Harrisburg, PA: LTAP, The Pennsylvania Local Roads Program.
International Organization for Standardization. (2003a). Road vehicles - ergonomic aspects of transport information and control systems - specifications and compliance procedures for in vehicle auditory presentation (No. ISO/TC 22/SC 13/WG 8 N). Geneva, Switzerland: ISO.
International Organization for Standardization. (2003b). Road vehicles: Ergonomic aspects of transport information and control systems - procedures for determining priority of on-board messages presented to drivers (No. ISO/TS 16951:2003(E)). Geneva, Switzerland: ISO.
Iversen, H. (2004). Risk-taking attitudes and risky driving behaviour. Transportation Research Part F, 7, 135-150.
Janssen, W., and Nilsson, L. (1993). Behavioral effects of driver support. In A. M. Parkes, Franzen, S. (Ed.), Driving future vehicles. 147-155: Taylor & Francis.
Labiale, G. (1990). In-car road information: Comparisons of auditory and visual presentations. Proceedings of the Human Factors Society 34th Annual Meeting, 623-627.
Laughery, K. R., and Hammond, A. (1999). Overview. In M. S. Wogalter, Dejoy, D.M., and Laughery, K.R. (Ed.), Warnings and risk communication. London: Taylor & Francis.
Lee, J. D., Gore, B.F., and Campbell, J.L. (1999). Display alternatives for in-vehicle warning and sign information: Message style, location, and modality. Transportation Human Factors, 1(4), 347-375.
100

Lerner, N., & Rabinovich, B. A. (1997). Risk perception in young male drivers: What makes them different? Paper presented at the The Human Factors and Ergonomics Society 41st Annual Meeting.
Lerner, N. D., Dekker, D.K., Steinberg, G.V., and Huey, R.W. (1996). Inappropriate alarm rates and driver annoyance (No. DOT HS 808 533). Washington, D.C.: U.S. Department of Transportation.
Liu, Y.-C. (2001). Comparative study of the effects of auditory, visual and multimodality displays on drivers' performance in advanced traveler information systems. Ergonomics, 44(4), 425-442.
Lloyd, M. M., Wilson, G.D., Nowak, C.J., and Bittner, A.C., Jr. (1999). Brake pulsing as a haptic warning for an intersection collision avoidance (ica) countermeasure (No. 1694). Washington, D.C.: Transportation Research Board.
Maltz, M., and Shinar, D. (2004). Imperfect in-vehicle collision avoidance warning systems can aid drivers. Human Factors, 46(2), 357-366.
Manser, M. P., Ward, N.J., Kuge, N., and Boer, E.R. (2004). Influence of a driver support system on situation awareness and information processing in response to lead vehicle braking. Proceedings of the Human Factors and Ergonomics Society 48th Annual Meeting, 2359-2363.
Martin, D. W. (2000). Doing psychology experiments (Fifth ed.). Belmont, CA: Wadsworth/Thomson Learning.
Mitta, D., and Folds, D. (1997). Incident detection system design: The effects of high false alarm rate on operator performance. Proceedings of the 4th World Congress on Intelligent Transport Systems.
National Highway Traffic Safety Administration. (1993). Addressing the safety issues related to younger and older drivers: U.S. Department of Transportation.
National Highway Traffic Safety Administration. (1996). Preliminary human factors guidelines for crash avoidance warning devices (No. NHTSA Project No. DTNH22-91-C-07004). Washington, D.C.: U.S. Department of Transportation, NHTSA.
National Highway Traffic Safety Administration. (2003). Traffic safety facts 2003: A compilation of motor vehicle crash data from the fatality analysis reporting system and the general estimates system (No. DOT HS 809 775). Washington,
101

DC: National Highway Traffic Safety Administration, National Center for Statistics and Analysis, and U.S. Department of Transportation.
National Highway Traffic Safety Administration. (2004a). Fatality analysis reporting system web-based encyclopedia. Retrieved July 6, 2004, from http://www-fars.nhtsa.dot.gov/
National Highway Traffic Safety Administration. (2004b). Older drivers: What you should know. Retrieved August 30, 2004, from http://www.nhtsa.dot.gov/nhtsa/whatis/regions/Region03/03older.html
Neurauter, M. L. (2004). Multidimensional warnings: Determining an appropriate combination for a curve warning device. Unpublished Master's Thesis, Virginia Polytechnic Institute and State University, Blacksburg, VA.
O'Connor, T. (2004). Collision avoidance: Lateral avoidance. Retrieved August 29, 2004, from http://www.calccit.org/itsdecision/serv_and_tech/Collision_avoidance/lateral.html
Ohio State Center for Mapping. (n.d.). Intelligent transportation system curve warning project. Retrieved October 3, 2004, from http://www.cfm.ohio-state.edu/research/itscurve.php
Owens, J. M., and Lehman, R. (2001). The effects of age and distraction on reaction time in a driving simulator. Paper presented at the International Driving Symposium on Human Factors in Driver Assessment, Training and Vehicle Design, Aspen, Colorado.
Persaud, B., Retting, R.A., and Lyon, C. (2000). Guidelines for identification of hazardous highway curves (No. Transportation Research Record 1717). Toronto, Ont.: Department of Civil Engineering Ryerson Polytechnic University.
Pomerleau, D., Jochem, T., Thorpe, C., Batavia, P., Pape, D., Hadden, J., McMillian, N., Brown, N., and Everson, J. (1999). Run-off-road collision avoidance using IVHS countermeasures (No. DOT HS 809 170). Washington, D.C.: National Highway Traffic Safety Administration.
Preston, H., and Schoenecker, T. (1999). Potential safety effects of dynamic signing at rural horizontal curves. Minneapolis, MN: BRW, Inc.
Purswell, J. L., Schlegel, R.E., and Kejriwal, S.K. (1986). A prediction model for consumer behavior regarding product safety. Proceedings of the Human Factors Society 30th Annual Meeting, 1202-1205.
102

Rogers, W. A., Lamson, N., and Rousseau, G.K. (2000). Warning research: An integrative process. Human Factors, 42(1), 102-139.
Sanders, M. S., and McCormick, E.J. (1993). Human factors in engineering and design (Seventh ed.). New York: McGraw-Hill, Inc.
Silver, N. C., and Braun, C.C. (1999). Behavior. In M. S. Wogalter, Dejoy, D.M., and Laughery, K.R. (Ed.), Warnings and risk communication (pp. 245-262). Philadelphia: Taylor & Francis.
Sprenger, A. (1993). In-vehicle displays: Heads-up display field tests. Vision In Vehicles, IV, 301-309.
Suzuki, K., and Jansson, H. (2003). An analysis of driver's steering behaviour during auditory or haptic warnings for the designing of lane departure warning system. JSAE Review, 24, 65-70.
Tan, A. K., and Lerner, N.D. (1995). Multiple attribute evaluation of auditory warning signals for in-vehicle crash avoidance warning systems (No. DOT HS 808 535). Silver Springs, MD: COMSIS Corporation.
Tijerina, L. (2001). Preliminary studies of mono-pulse braking haptic displays for rear-end collision warning. Paper presented at the International Driving Symposium on Human Factors in Driver Assessment, Training, and Vehicle Design, Aspen, Colorado.
Tijerina, L., Johnston, S., Parmer, E., Pham, H. A., & Winterbottom, M. D. (2000). Preliminary studies in haptic displays for rear-end collision avoidance system and adaptive cruise control system applications (No. DOT HS 808 TBD). Washington, D.C.: National Highway Traffic Safety Administration and U.S. Department of Transportation.
Torbic, D. J., Harwood, D.W., Gilmore, D.K., Pfefer, R., Neuman, T.R., Slack, K.L., and Hardy, K.K. (2004). Guidance for implementation of the aashto strategic highway safety plan volume 7: A guide for reducing collisions on horizontal curves (No. NCHRP Report 500). Washington, D.C.: Transportation Research Board.
Uno, H., and Hiramatsu, K. (2001). Collision avoidance capabilities of older drivers and improvement by warning presentation. Proceedings of the 17th International Technical Conference on the Enhanced Safety of Vehicles, Paper Number 185.
103
Van Der Laan, J. D., Heino, A., and De Waard, D. (1997). A simple procedure for the assessment of acceptance of advanced transport telematics. Transportation Research Part C: Emerging Technologies, 5(1), 1-10.
Vredenburgh, A. G., and Cohen, H.H. (1995). High-risk recreational activities: Skiing and scuba - what predicts compliance with warnings. International Journal of Industrial Ergonomics, 15, 123-128.
Warshawsky-Livne, L., and Shinar, D. (2002). Effects of uncertainty, transmission type, driver age and gender on brake reaction and movement time. Journal of Safety Research, 33(1), 117-128.
Wenham, R. (2000). The caltrans advanced curve warning and traffic monitoring system. ITS Quarterly, 8, 27-30.
Wickens, C. D., and Hollands, J.G. (2000). Engineering psychology and human performance (Third ed.). London: Prentice-Hall International (UK) Limited.
Wiese, E. E., and Lee, J.D. (2004). Auditory alerts for in-vehicle information systems: The effects of temporal conflict and sound parameters on driver attitudes and performance. Ergonomics, 47(9), 965-986.
Wogalter, M. S., Conzola, V.C., and Smith-Jackson, T.L. (2002). Research-based guidelines for warning design and evaluation. Applied Ergonomics, 33, 219-230.
Wogalter, M. S., Dejoy, D.M., and Laughery, K.R. (1999). Warnings and risk communication. London: Taylor & Francis.
Wogalter, M. S., Kalsher, M.J., and Racicot, B.M. (1993). Behavioral compliance with warnings: Effects of voice, context, and location. Safety Science, 16, 637-654.
Wood, J. M. (1998). How do visual status and age impact on driving performance as measured on a closed circuit driving track. Ophthalmic and Physiological Optics, 19(1), 34-40.
104

A P P E N D I C E S
105
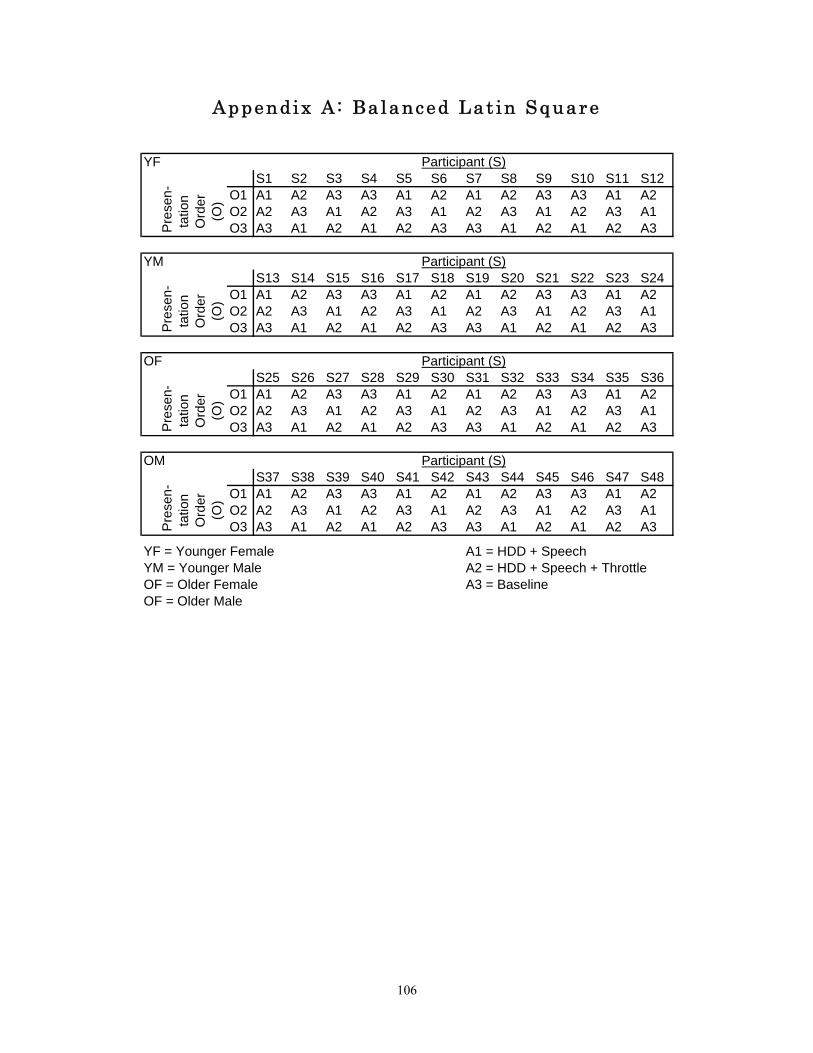
Appendix A : Balanced Lat in Square
YFS1 S2 S3 S4 S5 S6 S7 S8 S9 S10 S11 S12
O1 A1 A2 A3 A3 A1 A2 A1 A2 A3 A3 A1 A2O2 A2 A3 A1 A2 A3 A1 A2 A3 A1 A2 A3 A1O3 A3 A1 A2 A1 A2 A3 A3 A1 A2 A1 A2 A3
YMS13 S14 S15 S16 S17 S18 S19 S20 S21 S22 S23 S24
O1 A1 A2 A3 A3 A1 A2 A1 A2 A3 A3 A1 A2O2 A2 A3 A1 A2 A3 A1 A2 A3 A1 A2 A3 A1O3 A3 A1 A2 A1 A2 A3 A3 A1 A2 A1 A2 A3
OFS25 S26 S27 S28 S29 S30 S31 S32 S33 S34 S35 S36
O1 A1 A2 A3 A3 A1 A2 A1 A2 A3 A3 A1 A2O2 A2 A3 A1 A2 A3 A1 A2 A3 A1 A2 A3 A1O3 A3 A1 A2 A1 A2 A3 A3 A1 A2 A1 A2 A3
OMS37 S38 S39 S40 S41 S42 S43 S44 S45 S46 S47 S48
O1 A1 A2 A3 A3 A1 A2 A1 A2 A3 A3 A1 A2O2 A2 A3 A1 A2 A3 A1 A2 A3 A1 A2 A3 A1O3 A3 A1 A2 A1 A2 A3 A3 A1 A2 A1 A2 A3
A1 = HDD + SpeechA2 = HDD + Speech + ThrottleA3 = Baseline
YF = Younger FemaleYM = Younger MaleOF = Older FemaleOF = Older Male
Pre
sen-
tatio
n O
rder
(O
)
Pre
sen -
tatio
n O
rder
(O
)
Participant (S)
Participant (S)
Participant (S)
Pre
sen-
tatio
n O
rder
(O
)
Participant (S)
Pre
sen-
tatio
n O
rder
(O
)
106

Appendix B : Part i c ipant Recru i tment F lyer
Virginia Tech Transportation Institute
PARTICIPANTS NEEDED FOR DRIVING STUDY
$20.00 PER HOUR FOR UP TO 2 HOURS
Are you 18-25 or 60+ years old?
Do you have a valid driver’s license? If you answer yes to both of these questions,
please call Melinda McElheny @ 231-1557
or e-mail: [email protected]
107

Appendix C : IRB
Request for Expedited Approval of Research Involving Human Subjects [please print or type responses below]
Investigator(s): Myra Blanco, Tonya Smith-Jackson, Melinda McElheny Department(s): Virginia Tech Transportation Institute_ Mail Code: 0536 E-mail: [email protected] Project Title: Multidimensional Warnings: Evaluating Curve Warning Stimuli in an On-Road Environment. Source of Funding Support: ____ Departmental Research X Sponsored Research (OSP No.: 447053 ) [ X] All investigators of this project are qualified through completion of the formal training program or videotape program provided by the Virginia Tech Office of Research Compliance. Note:To qualify for Expedited Approval, the research activities must: (a) present not more than minimal risk to the subjects, (b) not involve any of the special classes of subjects, except children as noted, and (c) involve only procedures listed in one or more of the following categories. The full description may be found in the Expedited Review section of the instructions: “Application for Approval of Research Involving Human Subjects” or 45 CFR 46.110 (http://grants.nih.gov/grants/oprr/humansubjects/45cfr46.htm#46.110) Please mark/check the appropriate category below which qualifies the project for expedited review:
[ ] 1. Clinical studies of drugs and medical devices when proscribed conditions are met [see item (1), page ___].
[ ] 2. Collection of blood samples by finger, heel or ear stick, or venipuncture subject to proscribed
limitations [see item (2), page ___]. [ ] 3. Prospective collection of biological specimens for research purposes by noninvasive means.
Examples: hair and nail clippings, deciduous teeth, permanent teeth, excreta and external secretions, uncannulated saliva, placenta, amniotic fluid, dental plaque, muscosal and skin cells and sputum [see item (3), page ___].
[ ] 4. Collection of data through noninvasive procedures routinely employed in clinical practice,
excluding procedures involving x-rays or microwaves [see item (4), page ___]. [ ] 5. Research involving materials (data, documents, records or specimens) that have been collected or
will be collected solely for non-research purposes (such as medical treatment or diagnosis [see item (5), page ___].
[ X ] 6. Collection of data from voice, video, digital, or image recordings made for research purposes [see
item (6), page ___]. [ X ] 7. Research on individual or group characteristics or behavior (including, but not limited to, research
on perception, cognition, motivation, identity, language communication, cultural beliefs or practices, social behavior), or research employing survey, interview, oral history, focus group, program evaluation, human factors evaluation, or quality assurance methodologies [see item (7), page ___].
Myra Blanco, Tonya Smith-Jackson, Melinda McElheny 9/7/04 . Investigator(s)Date ______________________________________________________________________________________ Departmental ReviewerDate ______________________________________________________________________________________ Chair, Institutional Review BoardDate
This project is approved for ____ months from the approval date of the IRB Chair.
108
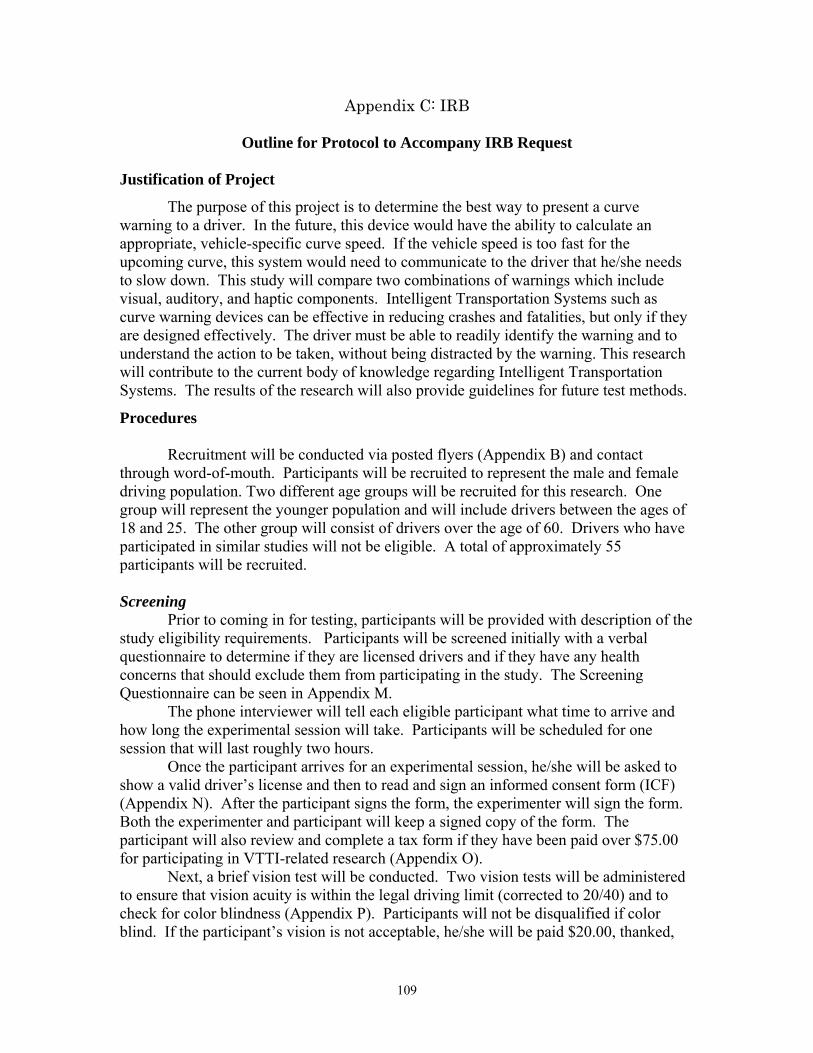
Appendix C: IRB
Outline for Protocol to Accompany IRB Request Justification of Project
The purpose of this project is to determine the best way to present a curve warning to a driver. In the future, this device would have the ability to calculate an appropriate, vehicle-specific curve speed. If the vehicle speed is too fast for the upcoming curve, this system would need to communicate to the driver that he/she needs to slow down. This study will compare two combinations of warnings which include visual, auditory, and haptic components. Intelligent Transportation Systems such as curve warning devices can be effective in reducing crashes and fatalities, but only if they are designed effectively. The driver must be able to readily identify the warning and to understand the action to be taken, without being distracted by the warning. This research will contribute to the current body of knowledge regarding Intelligent Transportation Systems. The results of the research will also provide guidelines for future test methods.
Procedures
Recruitment will be conducted via posted flyers (Appendix B) and contact through word-of-mouth. Participants will be recruited to represent the male and female driving population. Two different age groups will be recruited for this research. One group will represent the younger population and will include drivers between the ages of 18 and 25. The other group will consist of drivers over the age of 60. Drivers who have participated in similar studies will not be eligible. A total of approximately 55 participants will be recruited. Screening
Prior to coming in for testing, participants will be provided with description of the study eligibility requirements. Participants will be screened initially with a verbal questionnaire to determine if they are licensed drivers and if they have any health concerns that should exclude them from participating in the study. The Screening Questionnaire can be seen in Appendix M.
The phone interviewer will tell each eligible participant what time to arrive and how long the experimental session will take. Participants will be scheduled for one session that will last roughly two hours.
Once the participant arrives for an experimental session, he/she will be asked to show a valid driver’s license and then to read and sign an informed consent form (ICF) (Appendix N). After the participant signs the form, the experimenter will sign the form. Both the experimenter and participant will keep a signed copy of the form. The participant will also review and complete a tax form if they have been paid over $75.00 for participating in VTTI-related research (Appendix O).
Next, a brief vision test will be conducted. Two vision tests will be administered to ensure that vision acuity is within the legal driving limit (corrected to 20/40) and to check for color blindness (Appendix P). Participants will not be disqualified if color blind. If the participant’s vision is not acceptable, he/she will be paid $20.00, thanked,
109

Appendix C: IRB and dismissed. Finally, an informal hearing test will be administered during which four tones at 1KHz, 2KHz, 3KHz, and 4KHz will be presented (Appendix P). If the participant is unable to detect any of the tones, he/she will be paid $20.00, thanked, and dismissed.
Data Collection
Following the initial vision and hearing tests, the experimenter will orient the participant to the study and to the research vehicle. Description of the study will be concise and will not reveal that the participant will be presented with curve warning displays. Instead, the experimenter will indicate that the participant will be testing the use of cellular phones while driving. This deception is necessary to gain information on how people initially react to warnings. Participants will not, however, perform any cellular phone tasks.
After receiving instructions and asking any questions they may have, the participant will be asked to drive a short public highway route. The experimenter will be in the vehicle with the participant at all times. The highway route is chosen to help familiarize the participants with the vehicle features and handling, and to help them become comfortable driving at 55 mph without revealing the curvature of the Smart Road. Participants will be told that they will not be asked to perform any cellular phone tasks while on public roads.
Upon completion of the highway loop used for orientation, the participant will enter the Smart Road and drive the length at 55 mph. The road is straight for approximately 2 miles and designed for speeds of 100 km/h or about 62 mph. At the end of the road is a 92 ft diameter turnaround loop. Participant vehicle headlights will meet SAE standards and illuminate the curve prior to reaching it. At the first encounter of the Bottom Turn, curve warning presentation Stimulus 1, Stimulus 2, or a Baseline condition with no stimulus, will be presented to the driver at the determined distance from the curve entrance. Stimulus 1 consists of a flashing visual icon on the dash, or Heads Down Display (HDD), plus an auditory warning of a female voice saying, “Curve ahead. Reduce speed to 20 mph”. Stimulus 2 is the same HDD and speech warning, plus a haptic throttle push-back display.
Following the surprise stimulus presentation, the experimenter will ask the participant to park the vehicle at the end of the Bottom Turn. She will then administer a debriefing statement (Appendix T) and ask if the participant consents to keeping the data from the first trial and would like to continue in the study. She will administer a second informed consent form (Appendix U) and several questionnaires pertaining to the stimulus presentation just encountered (Appendices E, F, and H). Once ready, the participant will drive the loop from the Bridge Turn to the Bottom Turn for a total of two more times to experience the other stimulus presentations. After each stimulus presentation the participant will park and complete the questionnaires. Following all data collection, the experimenter will escort the participant back to the VTTI building; administer several more questionnaires (Appendices G and E), and a short debriefing as well as payment (Debriefing form and payment receipt are in Appendix W).
110

Appendix C: IRB Risks and Benefits There are risks or discomforts to which test participants are exposed to in volunteering for this research. They include the following: 1. The risk of an accident normally associated with driving an unfamiliar automobile
after dark at speeds of up to 55 miles per hour without other traffic present, and with low traffic flow on a rural highway route.
2. Possible fatigue due to the length of the experiment. However, they will be given rest breaks during the experimental session.
3. Participants who have had previous eye injuries and/or surgeries are at an increased risk of further eye injury by participating in this study where risks, although minimal, include the possibility of collision and airbag deployment.
The following precautions will be taken to minimize the risks listed above:
1. Participants may take breaks or decide not to participate at any time. 2. If participants decide to discontinue participation, the experimenter will drive the
participant back to VTTI. 3. The experimenter will be in the vehicle with participants at all times. 4. The vehicle is equipped with a driver's side and passenger's side airbag supplemental
restraint system, fire extinguisher and first-aid kit. 5. All data collection equipment is mounted such that, to the greatest extent possible, it
does not pose a hazard to the participant in any foreseeable case. 6. The experiment will not be run during severe weather conditions. 7. Participants are required to wear the lap and shoulder belt restraint system while in
the car. 8. In the event of a medical emergency, or at the participant’s request, VTTI staff will
arrange medical transportation to a nearby hospital emergency room. 9. Participants will not have any medical condition that would put them at a greater risk,
including but not restricted to epilepsy, balance disorders, and lingering effects of head injuries and stroke.
There are no direct benefits to the participant from this research other than
payment for participation. No promise or guarantee of benefits will be made to encourage participants to participate. Participant participation will provide additional data related to the field of Intelligent Transportation Systems and In-Vehicle Warnings. Confidentiality/Anonymity
The data gathered in this experiment will be treated with confidentiality, and data collected will be used for research purposes only. Shortly after participants have participated, their name will be separated from their data. A coding scheme will be employed to identify the data by participant number only (e.g., Participant No. 3). Participants will be allowed to
111

Appendix C: IRB withdraw their data from the study if they so desire. Participants must inform the experimenter immediately of this decision, as the data will be difficult (if not impossible) to track once the session is over.
While the participant is driving the vehicle, cameras will videotape the participants and video views will include the participant’s face, throttle and brake pedals, an over-the-shoulder view of the steering wheel and dash, and a forward road view. The purpose of the video recordings is to provide backup and verification methods for the in-vehicle data collection system. Videotapes will be stored in a locked room at the Virginia Tech Transportation Institute. Video tapes will be converted to digital video and stored on a password protected server. Access to video will be under the supervision of Dr. Myra Blanco, an investigator for the project. Participants will be asked for their permission to allow VTTI to turn over the videotape including their data and image to the client. Participants may refuse to allow the videotape of their image to be given to the client, and still be eligible to participate in the study.
Informed Consent
Please see attached appendices labeled VIRGINIA POLYTECHNIC INSTITUTE
AND STATE UNIVERSITY: Informed Consent for Participants of Investigative Projects (two separate consent forms). (For this document, Informed Consent Forms are in Appendix M and Appendix U).
112
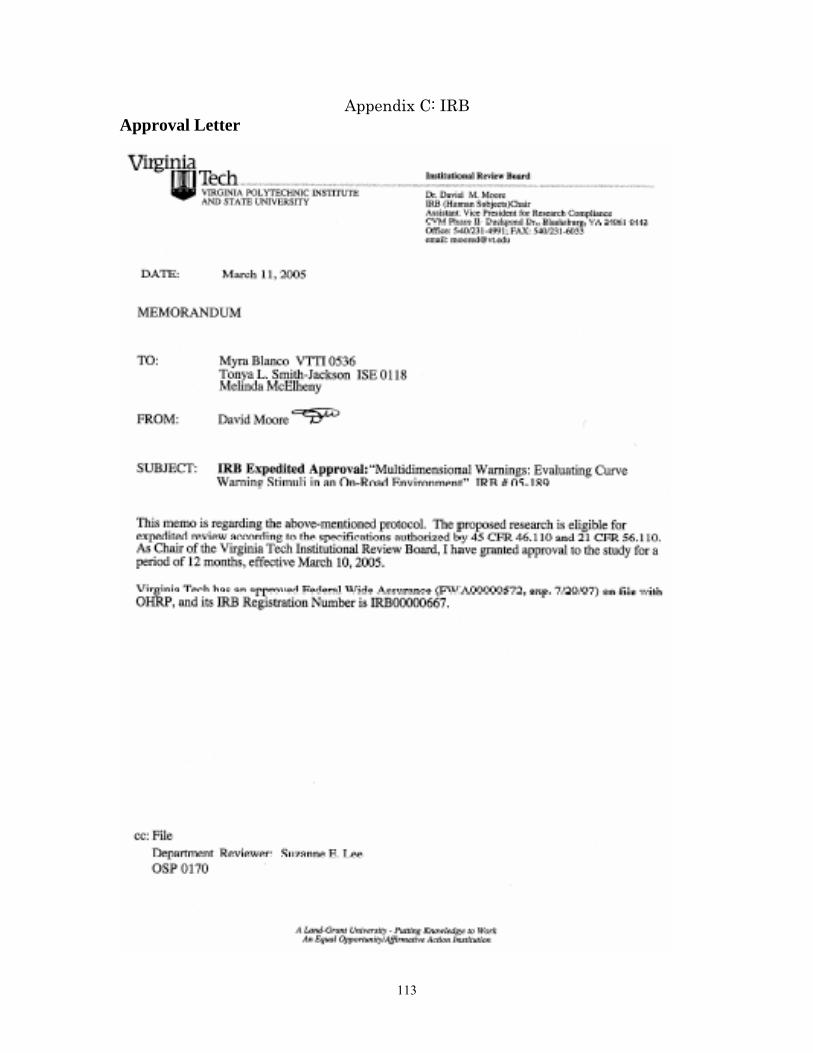
Appendix C: IRB Approval Letter
113

Appendix D : Sound Measurements o f the Speech
St imulus
Auditory Stimuli: Speech
0
10
20
30
40
50
60
70
80
315 400 500 630 800 1000 1250 1600 2000 2500 3150
1/3 Octave Band Center Frequency (Hz)
Soun
d L
evel
(dB
)
In-Vehicle Noise @ 55mph (dB) Masked Threshold (dB) Masked Threshold + 13dB Speech Warning (dB)
114

Appendix E : Hapt i c Peda l Maintenance Protoco l
VIRGINIA TECH TRANSPORTATION INSTITUTE Testing Haptic Force and Maintaining Nitrogen Cylinder
1. Measure throttle push-back force
• Hold straight end of metal rod into center line of accelerator pedal and push down until can place bent end of metal rod to the middle of the duct tape square on center console
• Hold green portion strong and steady up against the car • Take starting reading (should be around 2 lbs) • Type “w” to forcewarn and continue to hold green portion tightly while pedal
pushes back • Take ending reading (should be around 14 lbs) • Subtract start reading from end reading and force should be 6 lbs.
2. In right side of trunk, large gauge is for Emergency Brake
• Open valve by turning to the left (as if looking at from above) • Hear short hiss, gauge should read 200 psi
- If hiss continues, close valve again by turning all the way to the right - Try activating emergency brake once while parked, push handle forward
• Green light should go on indicating tank is open and filled and brake is ready to go - If red light stays on:
(1) Check that valve has been opened all the way by turning more to the left (valve can be opened half-way or all the way, does not matter)
(2) Check if level is 200 psi (3) If neither check works, change tank (see below)
• Do not adjust the nut on side of large tank (knob has been removed so cannot adjust)
• Close the valve (all the way to right) at the end of each night
2. Small gauge is for Haptic Pedal • Gauge should read 100 psi (or level decided upon)
- If gauge does not read 100 psi, pull black knob out to rotate - Rotate to the left to increase psi - If increase level too much, rotate back to the right and must manually decrease
by activating pedal several times (see warning system test procedures in Experimenter and Greeter protocols)
3. Changing the large tank: • Close valve (turn all the way to right) completely
115

• Use wrench to loosen nut below valve (lefty loosey) - If hear continuous hissing, tighten nut back up, and tighten valve to the right
completely • Unscrew nut rest of the way by hand • Loosen strap on cylinder and pull old cylinder out • Erase chalk on cylinder and write, “Empty” • Replace with cylinder located in Simbay entrance in blue steel holding rack
- Make sure same size as one replacing • Slide new tank into strap and tighten • Replace valve and screw in nut by hand • Give a couple tightening twists of nut with wrench, but do not force too much • Open valve to left and green light should go on
If red light remains on, repeat previous steps and make sure valves have been tightened/loosened appropriately
116

Appendix F : St imulus Comprehens ion Interv iew
Sample Probes:
(The stimulus comprehension interview will not be administered after the Baseline
condition)
1. “Did you notice anything just now?”
If Yes:
2. “Can you describe what you noticed?”
3. “What did it mean to you?”
117
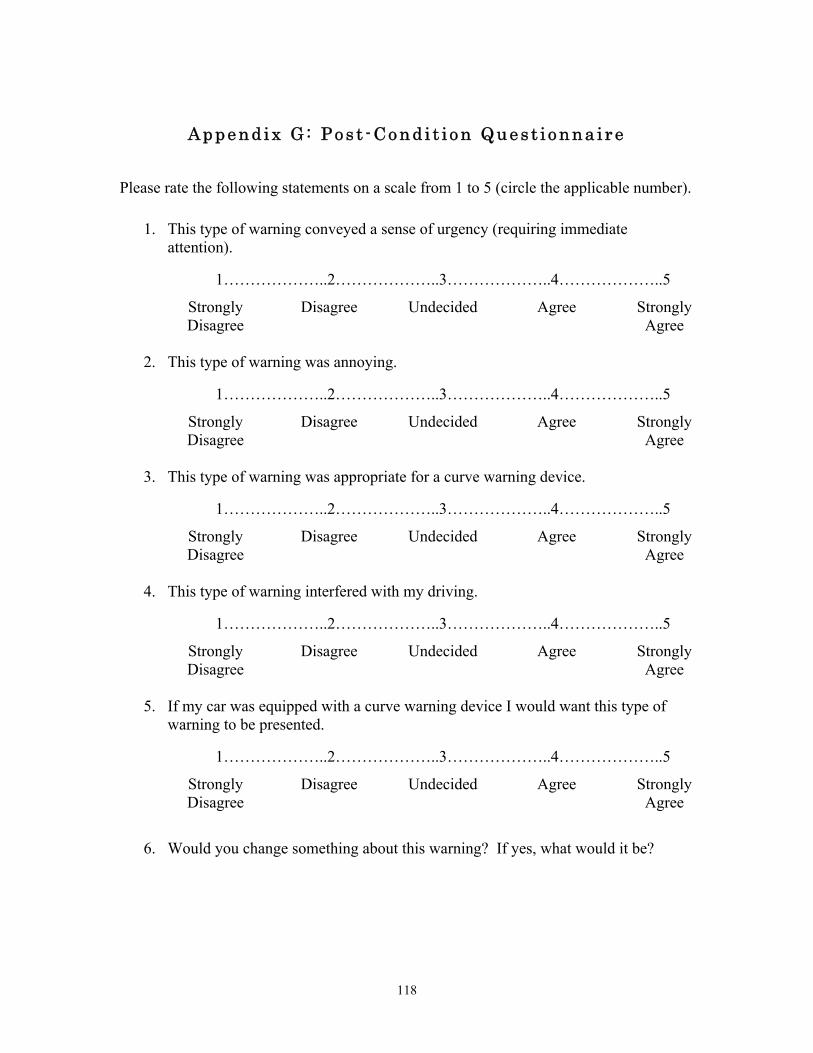
Append ix G : Pos t -Cond i t i on Ques t i onna i re
Please rate the following statements on a scale from 1 to 5 (circle the applicable number).
1. This type of warning conveyed a sense of urgency (requiring immediate attention).
1………………..2………………..3………………..4………………..5
Strongly Disagree Undecided Agree Strongly Disagree Agree
2. This type of warning was annoying.
1………………..2………………..3………………..4………………..5
Strongly Disagree Undecided Agree Strongly Disagree Agree
3. This type of warning was appropriate for a curve warning device.
1………………..2………………..3………………..4………………..5
Strongly Disagree Undecided Agree Strongly Disagree Agree
4. This type of warning interfered with my driving.
1………………..2………………..3………………..4………………..5
Strongly Disagree Undecided Agree Strongly Disagree Agree
5. If my car was equipped with a curve warning device I would want this type of warning to be presented.
1………………..2………………..3………………..4………………..5
Strongly Disagree Undecided Agree Strongly Disagree Agree
6. Would you change something about this warning? If yes, what would it be?
118
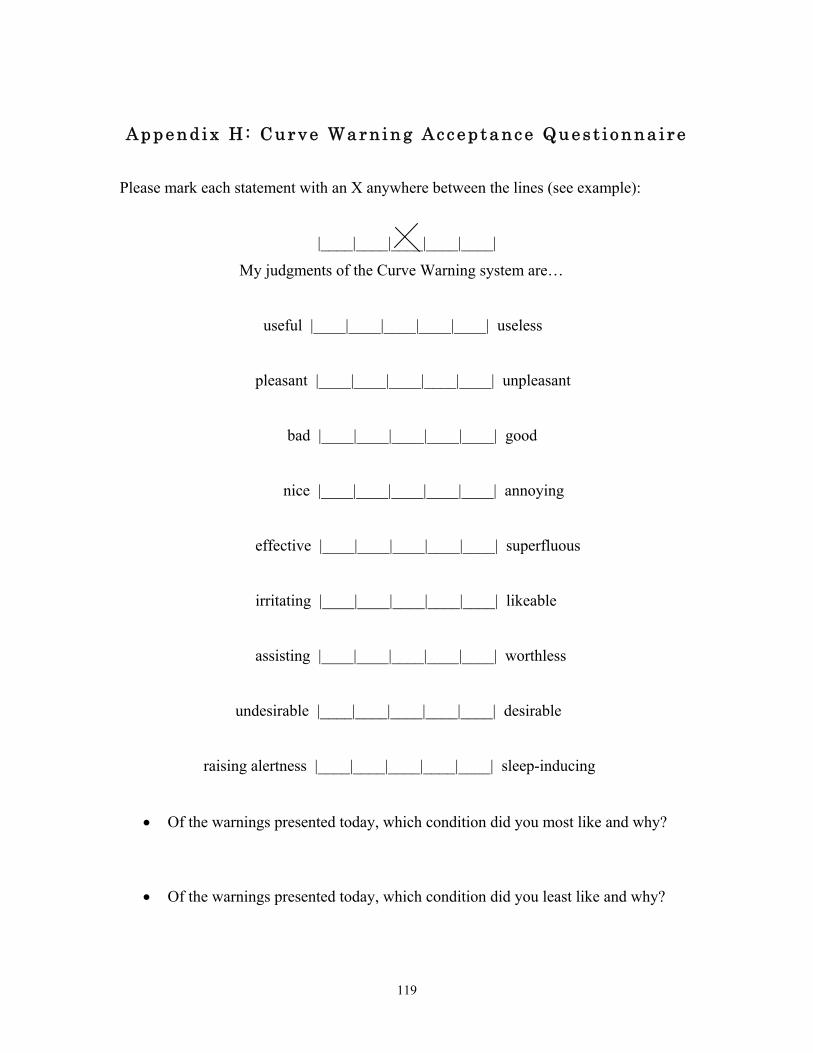
Append ix H : Curve Wa rn ing Accep tance Ques t i onna i re
Please mark each statement with an X anywhere between the lines (see example):
|____|____|____|____|____|
My judgments of the Curve Warning system are…
useful |____|____|____|____|____| useless
pleasant |____|____|____|____|____| unpleasant
bad |____|____|____|____|____| good
nice |____|____|____|____|____| annoying
effective |____|____|____|____|____| superfluous
irritating |____|____|____|____|____| likeable
assisting |____|____|____|____|____| worthless
undesirable |____|____|____|____|____| desirable
raising alertness |____|____|____|____|____| sleep-inducing
• Of the warnings presented today, which condition did you most like and why?
• Of the warnings presented today, which condition did you least like and why?
119

Appendix I : Hazard Percept ion Quest ionnaire
Page 1: To be administered verbally.
Please answer the following to the best of your knowledge:
- On my first drive down the Smart Road, I first became aware of the sharp curve
(turnaround loop) at the end of the Smart Road (circle one):
1 Prior to the warning 2 During the warning 3 After the warning
120

For each of the following statements, please circle the number above the rating that best matches your opinion.
1. I often (at least several times per month) drive on roads with two or more tight curves.
1………………..2………………..3………………..4………………..5
Strongly Disagree Undecided Agree Strongly Disagree Agree 2. Once I noticed a curve at the end of the Smart Road, the curve seemed like it
could be a dangerous driving maneuver.
1………………..2………………..3………………..4………………..5
Strongly Disagree Undecided Agree Strongly Disagree Agree
3. I usually drive above the speed limit posted on curves.
1………………..2………………..3………………..4………………..5
Strongly Disagree Undecided Agree Strongly Disagree Agree
4. Roadway curves are hazardous.
1………………..2………………..3………………..4………………..5
Strongly Disagree Undecided Agree Strongly Disagree Agree
5. Posted advisory speeds for curves are usually much slower than they need to be.
1………………..2………………..3………………..4………………..5
Strongly Disagree Undecided Agree Strongly Disagree Agree
121

Appendix J : R isk -Taking Sty le Quest ionnaire
For each of the following statements, please circle the number next to the rating that best matches your opinion.
1. Many traffic rules must be ignored to ensure traffic flow.
1………………..2………………..3………………..4………………..5
Strongly Disagree Undecided Agree Strongly Disagree Agree
2. Traffic rules must be respected regardless of road and weather conditions.
1………………..2………………..3………………..4………………..5
Strongly Disagree Undecided Agree Strongly Disagree Agree
3. Speed limits are exceeded because they are too restrictive.
1………………..2………………..3………………..4………………..5
Strongly Disagree Undecided Agree Strongly Disagree Agree
4. It is acceptable to take chances when no other people are involved.
1………………..2………………..3………………..4………………..5
Strongly Disagree Undecided Agree Strongly Disagree Agree
5. If you are a good driver it is acceptable to drive a little faster.
1………………..2………………..3………………..4………………..5
Strongly Disagree Undecided Agree Strongly Disagree Agree
6. I would never drive after drinking alcohol.
1………………..2………………..3………………..4………………..5
Strongly Disagree Undecided Agree Strongly Disagree Agree
122

Appendix J: Risk-Taking Style Questionnaire (continued)
For each of the following statements, please circle the number that best describes your driving behavior (from 1 - Never– to 5 – Very Often).
7. Break 50 mph speed limits by more than 10 mph.
1………………..2………………..3………………..4………………..5
Never Very Often
8. Overtake the car in front even when it keeps the appropriate speed.
1………………..2………………..3………………..4………………..5
Never Very Often
9. Ignore traffic rules to proceed faster.
1………………..2………………..3………………..4………………..5
Never Very Often
10. Drive too close to the car in front to be able to stop if it should brake.
1………………..2………………..3………………..4………………..5
Never Very Often
11. Keep driving when I am tired and actually need a break.
1………………..2………………..3………………..4………………..5
Never Very Often
12. Drive long distances in a car without wearing a seatbelt.
1………………..2………………..3………………..4………………..5
Never Very Often
123
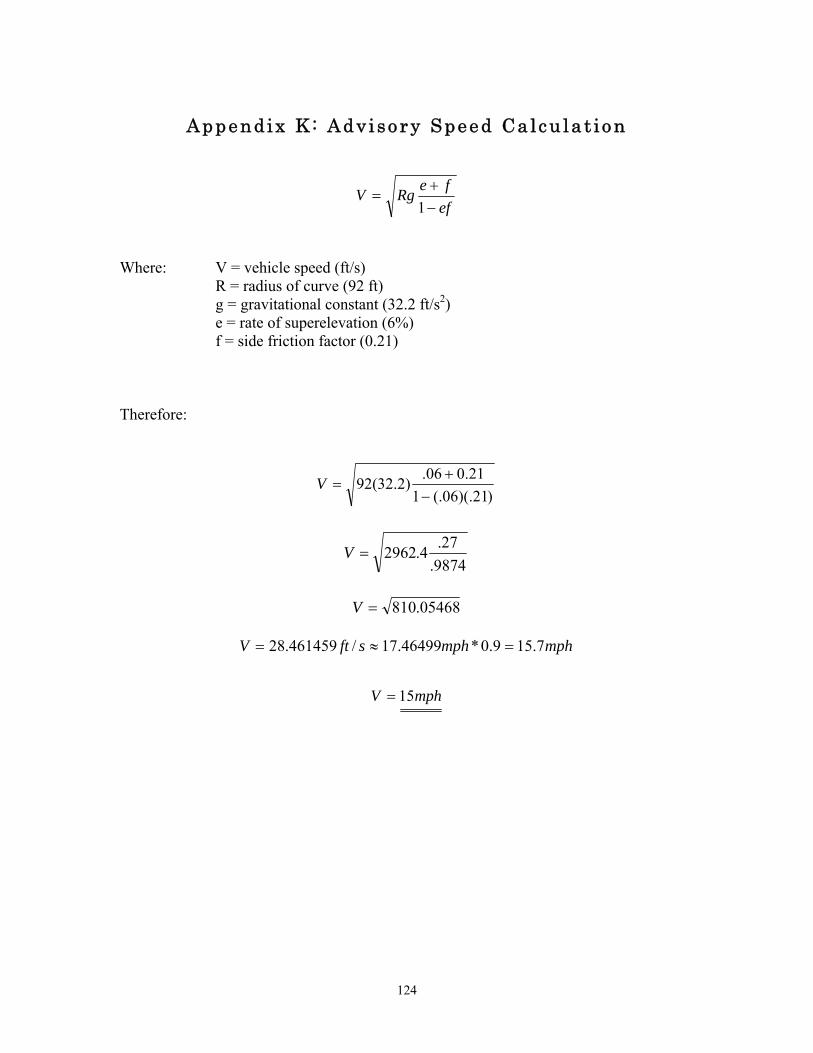
Appendix K : Adv isory Speed Ca lcu lat ion
effeRgV
−+
=1
Where: V = vehicle speed (ft/s) R = radius of curve (92 ft) g = gravitational constant (32.2 ft/s2) e = rate of superelevation (6%) f = side friction factor (0.21)
Therefore:
)21)(.06(.121.006.)2.32(92
−+
=V
9874.27.4.2962=V
05468.810=V
mphmphsftV 7.159.0*17.46499/461459.28 =≈=
mphV 15=
124

Appendix L : Warning Dis tance Onset Ca lcu lat ions
)(2
22
VtdVVa
r
c
−−
=
Where: a = deceleration (4.92 ft/s2) V = vehicle speed (55 mph or *1.468 = 80.67 ft/s) Vc = maximum safe speed for curve (16.67 mph or *1.468 = 24.47 ft/s) d = distance to curve apex (ft) tr = reaction time (2.5s)
VtaVV
d rc +
−=
2
22
Therefore:
VtaVVd
VtdVVa r
c
r
c +−
=⇔−−
=2)(2
2222
)67.80(5.2)92.4(2
)47.24()67.80( 22
+−
=d
68.20184.9
78.59865.6507+
−=d
2.80268.20149.600 =+=d
ftd 802≈
125

Appendix M: Part i c ipant Screen ing Quest ionnaire
Individual’s Name: _________________________ Gender: M or F Age: ___________ Phone #: (H) ___________________ (W) ___________________ Note to Researcher: Initial contact between participants and researchers may take place over the phone. If this is the case, read the following Introductory Statement, followed by the questionnaire. Regardless of how contact is made, this questionnaire must be administered verbally before a decision is made regarding suitability for this study. Introductory Statement: After prospective participant calls or you call them, use the following script as a guideline in the screening interview. Hello. My name is _______________ and I'm a re’earcher with the Virginia Tech Transportation Institute in Blacksburg, VA. We are currently running a study to examine cellular phone usage while driving. The majority of this study will take place after dark on the Smart Road, with about 15 minutes of driving on public Blacksburg roads. The study will take approximately 2 hours of your time. You will be paid $20.00 per hour. Does this sound like something you may want to do? 1. Do you have a valid driver’s license? [Exclude if ‘NO’]
Yes ____No _____ Expiration Date:_______________
2. How long have you held your driver's lice’se?_________________ 3. How old are you? ______ (stop if not 18-25 or 60+ years old.) 4. Are you eligible for employment in the United States? [Exclude if ‘NO’] Yes ____No _____
5. Are you able to drive an automatic transmission without assistive devices or special
equipment? Yes ____No _____ [Exclude if ‘NO’]
6. How often do you drive per week? _____________ [Exclude if less than 2] 7. Have you participated in any experiments at the Virginia Tech Transportation
Institute? If "yes," “leas” briefly describe the study, including when it occurred. No ____Yes ______________________________________________________
126

Appendix M: Participant Screening Script 8. Have you had any moving violations in the past 3 years? If so, please explain.
[Exclude if more than 3] No ____Yes ______________________________________________________
9. Have you been involved in any accidents within the past 3 years? If so, please explain. No ____Yes ______________________________________________________
10. Do you have a history of any of the following? If yes, please explain.
Heart ondition No____ Yes________________________________
Stroke No____ Yes________________________________ Brain tumor No____ Yes________________________________ Head injury No____ Yes________________________________ Epileptic seizures No____ Yes________________________________ Respiratory disorders No____ Yes________________________________ Motion sickness No____ Yes________________________________ Inner ear problems No____ Yes________________________________ Dizziness, vertigo, or other balance problems No____ Yes________________________________ Diabetes No____ Yes________________________________ Migraine, tension headaches No____ Yes________________________________
11. (Females only) Are you currently pregnant? [Exclude if ‘YES’]
12. Are you currently taking any medications on a regular basis? If yes, please list them. No ___
_Yes ______________________________________________________
13. Do you have normal or corrected to normal hearing and vision? If no, please explain. Yes ____No ______________________________________________________
[If participant wears glasses, please ask him/her to bring them, even if they are only reading glasses.]
If the participant is eligible, schedule him/her for the study.
Give directions to VTTI and indicate where to park. Say, “We ask that all participants refrain from drinking alcohol and taking any substances that will impair their ability to drive prior to participating in our study.”
127

Appendix M: Participant Screening Script
Criteria for Participation:
1. Must hold a valid drivers license. 2. Must be 18-25 or >60 years old. 3. Must be eligible for employment in the U.S. 4. Must be able to drive an automatic transmission without special equipment. 5. Must drive at least 2 times a week. 6. Must not have participated in a similar study within the last year (driving
stretch of Smart Road) 7. Must not have more than two driving violations in the past three years. 8. Must not have caused an injurious accident in the past two years. 9. Cannot have lingering effects of heart condition, brain damage from stroke,
tumor, head injury, recent concussion, or infection. Cannot have had epileptic seizures within 12 months, current respiratory disorders, motion sickness, inner ear problems, dizziness, vertigo, balance problems, diabetes for which insulin is required, chronic migraine or tension headaches.
10. Cannot be pregnant. 11. Cannot currently be taking any substances that may interfere with driving
ability (cause drowsiness or impair motor abilities). 12. Must have normal (or corrected to normal) hearing and vision.
If a volunteer is
And Proceed by
Eligible ------ Scheduling a study session. NOT Eligible
Exclusion is TEMPORARY
Saying “I am not able to schedule you at this time, however, if you are interested you can volunteer again when _______ (fill in the restriction). We will be glad to reconsider you in a study at that time. We appreciate your interest and hope to hear from you in the future.”
NOT Eligible
Exclusion is PERMANENT
“I am not able to schedule you for this study because of _________ (i.e., susceptibility to motion sickness). Understand that we do this with your best interest in mind. We appreciate your willingness to volunteer.”
Scheduled day and time: _____________________________ Notes:
128
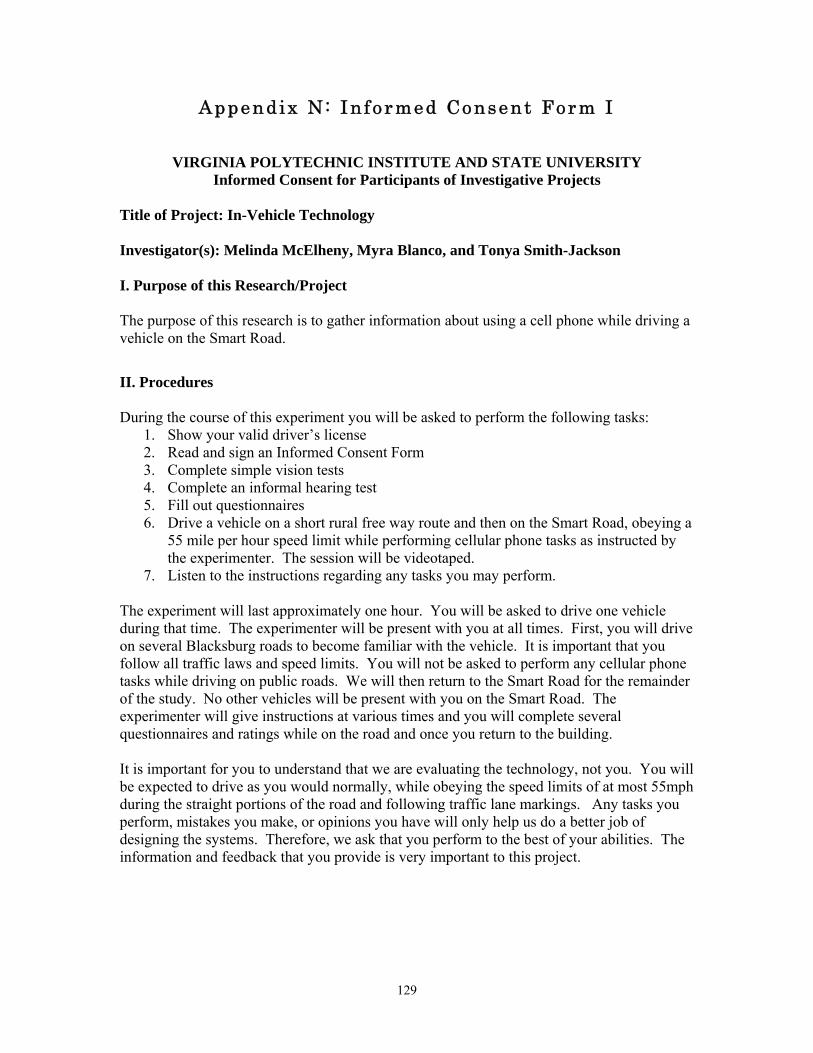
Appendix N: In fo rmed Consent Form I
VIRGINIA POLYTECHNIC INSTITUTE AND STATE UNIVERSITY Informed Consent for Participants of Investigative Projects
Title of Project: In-Vehicle Technology Investigator(s): Melinda McElheny, Myra Blanco, and Tonya Smith-Jackson I. Purpose of this Research/Project The purpose of this research is to gather information about using a cell phone while driving a vehicle on the Smart Road.
II. Procedures During the course of this experiment you will be asked to perform the following tasks:
1. Show your valid driver’s license 2. Read and sign an Informed Consent Form 3. Complete simple vision tests 4. Complete an informal hearing test 5. Fill out questionnaires 6. Drive a vehicle on a short rural free way route and then on the Smart Road, obeying a
55 mile per hour speed limit while performing cellular phone tasks as instructed by the experimenter. The session will be videotaped.
7. Listen to the instructions regarding any tasks you may perform. The experiment will last approximately one hour. You will be asked to drive one vehicle during that time. The experimenter will be present with you at all times. First, you will drive on several Blacksburg roads to become familiar with the vehicle. It is important that you follow all traffic laws and speed limits. You will not be asked to perform any cellular phone tasks while driving on public roads. We will then return to the Smart Road for the remainder of the study. No other vehicles will be present with you on the Smart Road. The experimenter will give instructions at various times and you will complete several questionnaires and ratings while on the road and once you return to the building. It is important for you to understand that we are evaluating the technology, not you. You will be expected to drive as you would normally, while obeying the speed limits of at most 55mph during the straight portions of the road and following traffic lane markings. Any tasks you perform, mistakes you make, or opinions you have will only help us do a better job of designing the systems. Therefore, we ask that you perform to the best of your abilities. The information and feedback that you provide is very important to this project.
129

Appendix N: Informed Consent Form I III. Risks There are risks or discomforts to which test participants are exposed to in volunteering for this research. They include the following: 1. The risk of an accident normally associated with driving an unfamiliar automobile after
dark at speeds of up to 55 miles per hour without other traffic present, and with low traffic flow on a rural highway route.
2. Possible fatigue due to the length of the experiment. However, you will be given rest breaks during the experimental session.
3. Participants who have had previous eye injuries and/or surgeries are at an increased risk of further eye injury by participating in this study where risks, although minimal, include the possibility of collision and airbag deployment.
The following precautions will be taken to minimize the risks listed above:
1. You may take breaks or decide not to participate at any time. 2. The experimenter will be in the vehicle with you at all times. 3. The vehicle is equipped with a driver's side’and passenger's side’airbag supplemental
restraint system, fire extinguisher and first-aid kit. 4. All data collection equipment is mounted such that, to the greatest extent possible, it does
not pose a hazard to you in any foreseeable case. 5. The experiment will not be run during severe weather conditions. 6. You are required to wear the lap and shoulder belt restraint system while in the car. 7. In the event of a medical emergency, or at your request, VTTI staff will arrange medical
transportation to a nearby hospital emergency room. 8. You do not have any medical condition that would put you at a greater risk, including but
not restricted to epilepsy, balance disorders, and lingering effects of head injuries and stroke.
Please remember that you are free to withdraw if you feel uncomfortable at any time.
In the event of an accident or injury in an automobile, the automobile liability coverage for property damage and personal injury is provided. The total policy amount per occurrence is $2,000,000. This coverage (unless the other party was at fault, which would mean all expense would go to the insurer of the other party’s vehicle) would apply in case of an accident for all volunteers and would cover medical expenses up to the policy limit.
Participants in a study are considered volunteers, regardless of whether they receive payment for their participation; under Commonwealth of Virginia law, workers compensation does not apply to volunteers; therefore, if not in an automobile, the participants are responsible for their own medical insurance for bodily injury. Appropriate health insurance is strongly recommended to cover these types of expenses.
IV. Benefits While there are no direct benefits to you from this research, you may find the experiment interesting. No promise or guarantee of benefits is made to encourage you to participate. Participation in this study will contribute to the improvement of advanced vehicle systems.
130

Appendix N: Informed Consent Form I
V. Extent of Anonymity and Confidentiality The data gathered in this experiment will be treated with confidentiality. Shortly after participation, your name will be separated from your data. A coding scheme will be employed to identify the data by participant number only (e.g., Participant No. 1). You will be allowed to see your data and withdraw the data from the study if you so desire, but you must inform the experimenters immediately of this decision so that the data may be promptly removed. At no time will the researchers release data identifiable to an individual to anyone other than VTTI staff working on the project without your written consent. VTTI will not turn over the video of your image to the client without your permission.
VI. Compensation You will receive $20.00 per hour for your participation in this study. This payment will be made to you in cash at the end of your voluntary participation in this study. VII. Freedom to Withdraw As a participant in this research, you are free to withdraw at any time without penalty. The experimenter will drive you back to VTTI. If you choose to withdraw, you will be compensated for the portion of time of the study for which you participated. Furthermore, you are free not to answer any question or respond to experimental situations without penalty.
VIII.Approval of Research Before data can be collected, the research must be approved, as required, by the Institutional Review Board for Research Involving Human Subjects at Virginia Polytechnic Institute and State University and by the Virginia Tech Transportation Institute. You should know that this approval has been obtained.
IX. Parpant’s Responsibilities
If you voluntarily agree to participate in this study, you will have the following responsibilities:
1. To follow the experimental procedures as well as you can. 2. To inform the experimenter if you have difficulties of any type. 3. To wear your seat and lap belt. 4. To abide by the 55 mph speed limit and traffic laws. 5. To abstain from any substances that will impair your ability to drive. 6. To drive the test vehicle in a safe and responsible manner.
131

Appendix N: Informed Consent Form I
X. Papant’s Acknowledgments
Check one of the following:
I have not had an eye injury/eye surgery (including, but not limited to, LASIK, Radial Keratotomy, and cataract surgery.)
I have had an eye injury/eye surgery and I've hav’ been informed of the possible risks to participants who have had eye surgery. I choose to accept this possible risk to participate in this study.
Check one of the following:
VTTI has my permission to give the videotape including my image to the client who has sponsored this research. I understand that the client will only use the videotape for research purposes.
VTTI does not have my permission to give the videotape including my image to the client who has sponsored this research. I understand that VTTI will maintain possession of the videotape, and that it will only be used for research purposes.
XI. Participant’s Permission I have read and understand the Informed Consent and conditions of this project. I have had all my questions answered. I hereby acknowledge the above and give my voluntary consent for participation in this project. If I participate, I may withdraw at any time without penalty. I agree to abide by the rules of this project.
Participant Signature Date
Experimenter Signature Date
Should I have any questions about this research or its conduct, I may contact: Melinda McElheny (540) 231-1557 Myra Blanco (540) 231-1500 Tonya Smith-Jackson (540) 231-4119 David Moore, Chair, IRB (540) 231-4991
132

Appendix O : V irg in ia Tech W-9 Tax Form
Please check one:
I am a U S citizen, or
I have been granted permanent residency (green card holder), or
I am a Resident Alien for tax purposes and have contacted Martha Mullen at 540-231-3754 or [email protected] to discuss the additional documentation that is required by federal law. 1. Name
First:________________________Middle:________________Last: _______________________________
2. U.S. taxpayer identification number (required)
_______ess (number, street, and apt. or suite no.)
_______tate and ZIP code
_______cation:
Under the penalties of perjury, I declare that to the best of my knowledge and belief, the above statements are true, correct, and complete and that: 1. The number shown on this form is my correct taxpayer identification number, and 2. I am not subject to backup withholding because: (a) I am exempt from backup
withholding, or (b) I have not been notified by the Internal Revenue Service (IRS) that I am subject to backup withholding as a result of a failure to report all interest or dividends, or (c) the IRS has notified me that I am no longer subject to backup withholding, and
3. I am a U.S. person (including a U. S. resident alien). Certification Instructions. You must cross out item 2 above if you have been notified by the IRS that you are currently subject to backup withholding because you have failed to report all interest and dividends on your tax return.
Signed:__________________________________________ Date: __________________ Revised 8/01
133

134
VIRGINIA POLYTECHNIC INSTITUTE & STATE UNIVERSITY EMPLOYEE/INDEPENDENT CONTRACTOR EVALUATION FORM
Vendor Name: Research Participant. Not a contractor
Work to be performed: Participate in a research experiment
If the University already employs the person you are considering, stop now. (He/she cannot be paid as a contractor.) Otherwise, answer each of the following questions. If the question is not applicable, mark it as "n/a." University, as used below, refers to the office/department/principal investigator who has responsibility for the activity which requires this work to be performed. “Yes” answers generally designate workers to be employees under IRS rules. YES No N/A 1. Work substantially full-time for the University. X 2. ply with the University's instructions about where, when and
how the work is to be performed. X Must com
3. Receive training from or at the direction of the University. X 4. Provide services that are integrated into the regular activities of
the University. X
5. Provide services that must be rendered personally. X 6. Do not hire, supervise and pay their own assistants. X 7. Have a continuing relationship with the University. X 8. Must follow hours of work set by the University. X
9. Do their work on the premises of the University. X 10. Must do their work in a sequence set by the University. X 11. Must submit regular reports to the University. X 12. Receive payments of regular amounts at set intervals. X 13. Receive payments for business and/or traveling expenses. X 14. Rely on the University to furnish tools and materials. X
15. Lack a major investment in facilities used to perform the service. X 16. Cannot make a profit or suffer a loss from their services. X 17. Work for one employer at a time. X 18. Do not offer their services to the general public on a regular and continuing basis.
X
19. Can be fired by the University. X 20. May quit work any time without incurring liability for nonperformance. X
Evaluation: The questions above are intended to measure the extent of control which the University may exercise over the worker. Generally, if there is a good deal of control over what the worker does and how the worker does the work, there should be an employee relationship established. If there are few elements of control, a contractor (consultant) relationship may be appropriate. CERTIFICATION: Based on the above, it is my determination that the proper classification of this individual is employee or contractor (circle one). Note: A misclassification may result in taxes, interest, and penalties being assessed by the IRS. If this happens, departments will be billed for their proportional taxes, interest, and penalties. ____________________________________________________________ _____________________________________ Printed Name Date ____________________________________________________________ ____________________________________ Signature Phone ____________________________________________________________ ____________________________________ Title Department Name & Number Submit completed form with Accounting Voucher to Controller’s Office for payment.

Appendix P : V is ion and Hear ing Tests Form
Participant Number: __________
Vision & Hearing Tests I – Acuity Test Acuity Score:________ II – Ishihara Test for Color Blindness 1._____4._____7.____ 2._____5._____ 3._____6._____ III – Hearing Test During this informal hearing test, the participant will have his/her back turned to
the experimenter while four tones are presented; 1) 1KHz, 2) 2KHz, 3), 3KHz, and 4) 4KHz. The participant will be told to raise his/her hand when a tone is heard, which will be presented at 10 dB(A) above the masked threshold in one or more of the octave bands based on the room where this will be performed. If a participant is unable to hear any of the tones, he/she will be excluded.
1KHz ______ 2KHz ______ 3KHz ______ 4KHz ______
135

Appendix Q : Sound Leve l Measurements f or Each
Hear ing Test Tone
Informal Hearing Test1KHz tone
0
10
20
30
40
50
60
70
200 250 315 400 500 630 800 1000 1250 1600 2000 2500 3150 4000 5000
1/3 Octave Band Center Frequency (Hz)
Soun
d L
evel
(dB
)
Room Noise Masked Threshold Masked Threshold + 13dB 1KHz
Informal Hearing Test2KHz tone
0
10
20
30
40
50
60
70
200 250 315 400 500 630 800 1000 1250 1600 2000 2500 3150 4000 5000
1/3 Octave Band Center Frequency (Hz)
Soun
d L
evel
(dB
)
Room Noise Masked Threshold Masked Threshold + 13dB 2KHz
136

Informal Hearing Test3KHz tone
0
10
20
30
40
50
60
70
200 250 315 400 500 630 800 1000 1250 1600 2000 2500 3150 4000 5000
1/3 Octave Band Center Frequency (Hz)
Soun
d L
evel
(dB
)Room Noise Masked Threshold Masked Threshold + 13dB 3KHz
Informal Hearing Test4KHz tone
0
10
20
30
40
50
60
70
200 250 315 400 500 630 800 1000 1250 1600 2000 2500 3150 4000 5000
1/3 Octave Band Center Frequency (Hz)
Soun
d L
evel
(dB
)
Room Noise Masked Threshold Masked Threshold + 13dB 4KHz
137

Appendix R : Greeter Protoco l
1. Get headset and two radios - set to Channel 1. 2. Vehicle Setup
• Check that fuel tank is full. • Clean windshield, mirrors, and back window. • Set fan speed to low. • Set tape player volume to 4 bars (go to 5 bars, then set back 1 as there are 2 levels
under 4 bars – set to upper level. • Make sure night-vision is OFF (sliding button to bottom left of steering wheel) • Check tire pressure – fill to 35 lbs. • Check that illuminance meter, 2 red flashlights, 1 regular flashlight, green force
gauge, and voice recorder are in the back seat pockets. • Turn on power by flipping second toggle switch UP on electrical housing in trunk • Check brake cylinder pressure in trunk (should be 200 on big gauge, 100 on small
gauge). • Green light (not red light) near cylinders in trunk should be on.
- If red light is on, see “Brake Cylinder Protocol.” 3. System checks (Experimenter and Greeter together):
• Software Category Command Function RUN LOKI? y/n, Enter Runs Loki program SUBJECT_ID +/- Scrolls up or down to participant number RUN_NUM u/d Sets run number for 3 Smart Road runs TRIP_TYPE t Smart_Road / Public_Road (need to stop recording the file
(‘f’) to switch between the two trip types) NUMBER_COLUMN 0-9 Flags data with a number WARN_MODE m Baseline / Audio_Visual / Haptic_Audio_Visual RECORD_FILE s / x s = starts recording, x = stops recording MDW_LASER_STATE r Standby / Ready (stays on ready until tripped by laser) FORCE_WARN w Off / On (will activate whichever Warn_Mode is selected Headings (“MDW,” “Main,” “Streams,” etc)
< , > (“Shift - ,” and “Shift - .”) Check status.
Quit Shift – q Quits program (do after typing ‘x’ to stop recording data)
• Warnings (while parked) - Keep vehicle off but plug in generator
Command Function Type “m” Set to “Baseline” Type “w” Activates all warnings (while parked)
* While driving, warnings are only activated using ‘w’ to forcewarn if the vehicle is traveling above 15mph
138
• Measure throttle push-back force o Hold straight end of metal rod into center line of accelerator pedal
and push down until can place bent end of metal rod to the middle of the duct tape square on center console
o Hold green portion strong and steady up against the car o Take starting reading (should be around 2 lbs) o Type “w” to forcewarn and continue to hold green portion tightly
while pedal pushes back o Take ending reading (should be around 8 lbs) o Subtract start reading from end reading and force should be 6 lbs.
• Secondary Brake - Greeter drives vehicle (with Experimenter in the back seat, passenger side)
to the Smart Road and radios Dispatch that MDW has one vehicle entering the road.
- Greeter drives at 55mph and Experimenter applies secondary brake to test stopping.
- *Once get out of car to set up laser, pop trunk and check cylinder tank levels again*
• Laser on Road - Set up laser
(a) Take gray case out to location (just at end of Wilson Creek Bridge, on the left when facing the bottom turn)
(b) Set two prongs of laser into stationary base (c) Plug cord into outlet on ground near road (d) Put gray case on the ground and tuck remaining cord into it for
protection (e) Check for 2 lights to be lit on laser (while nothing in path of laser), if
not, check the plug (f) Check receptor in back windshield of car to make sure light is on as
well Command Function Type “m” Set to “Haptic_Audio_Visual” Type “r” Set laser state to “Ready”
- Make sure all warnings are activated once drive past laser.
• Smart Road Cone setup: During laser checks will also place cones. - 1 orange cone with reflector just on other side of top turnaround. - 1 orange cone with reflector next to bridge turnaround. - 3 cones in turnaround 3 (2 at either opening of turnaround, one with purple
arrow flag, 1 at exit of turnaround) - 3 gray cones at the bottom turn around (set to indicate orientation of the
curve) - 1 cone at warning onset point past bridge (outside of guard rail) - 1 cone at emergency brake point before curve (outside of guard rail) - RPM bump at curve entrance
139

4. Set up the greeting room. • Turn on all overhead lights. • Close the shades. • Turn off the halogen lights. • Put stationary chair (not rolling chair with adjustments) for seated eye height
measurements against wall by the tape measure. • Bring out Participant Payment Log from CASS cabinet. • Set up laptop for hearing test.
- Type “win” into Dos command to start Windows. - Double click the speaker icon in the task bar and set to the following levels:
“Volume Control”: 5 notches up, “Wave”: 3.5 notches up, “SW Synth”: highest notch, “CD Player”: highest notch.
- Open Sound Recorder from accessories - Place laptop with screen and speakers facing middle of table centered above
the right table leg. Place chair on opposite side of table facing away from laptop.
5. Greet participant, record time that the participant arrived on the Debriefing (Payment) Form. [If 10 minutes have passed from the time they were supposed to arrive and you have not heard from them re-check the phone in the CASS lab for any messages. If none, go into the Participants folder in MDW2 to find their contact information, or use printed version in MDW2 Participant Binder. Call the numbers listed.
6. Check the participant’s driver’s license.
140
• Must be a valid driver’s license to proceed with the study. Out of state is fine. Make sure it has not expired.
7. Give the participant two copies of the Informed Consent. • Encourage him/her to read it. • Answer questions (see Notes at end). • Make sure they check a box regarding history of eye injury. • Make sure they check a box regarding consent to release the tape. • Regardless of which box a participant checks, he/she may still participate in
study. • Have participant sign and date the form. • Give the participant a copy of the informed consent (also signed).
8. Have participant complete front of Tax Form and initial two statements at top back of form.
9. Conduct Hearing Test. • Check that volume is set as described in #4; • Procedure: Please sit in this chair with your back toward me. I will now play a
series of sounds, please notify me when you hear a tone by raising your hand. • Play each tone in succession, but make sure volume setting is correct (*make sure no clicks are heard, use the finger pad to ‘double-click’ so that participant cannot hear when the tone is about to play*):
o 1Khz – 5 notches up (should already be set) o 2Khz – 3 notches up o 3Khz – 1.5 notches up (half way between 1 and 2) o 4Khz – 1.5 notches up (half way between 1 and 2)
• Participant must be able to hear all four tones presented to participate in the study.
10. Vision Test (Snellen eye chart test) • Take the participant over to the eye chart test area. • Line up their toes to the line on the floor (20 feet). • Participants can leave on their glasses if they wear them for driving.
Procedure: Look at the wall and read aloud the smallest line you can comfortably read.
• If the participant gets every letter correct on the first line they try, ask him or her
to try the next smaller line. Continue until they miss a letter. At that time, record the one that they were able to read in full (line above) on the Vision/Hearing/Measurement Form.
141
• If they get the first line they attempt incorrect, have them read the previous line. Repeat as needed until they get one line completely correct. Record this acuity on the Vision/Hearing/Measurement Form.
• If participants do not have 20/40 vision or better, pay them $20.00 and explain that they do not qualify for this research project.
11. Contrast Sensitivity Test • Take the participant over to the eye chart test area.
Line up their toes to the line on the floor (10 feet). Participants can leave on their glasses if they wear them for driving.
• Procedure: It is VERY IMPORTANT you do not squint or lean forward while you are taking the test.
• Point out the sample patches at the bottom of the chart with the three possible responses (left, right, or straight).
• Cover one eye with an occluder. (DO NOT let the participant use his/her hand to cover the eye since pressure on the eye may cause erroneous contrast sensitivity test results).
• Instruct the participant to begin with Row A and look across from left to right. Ask the participant to identify the last patch in which lines can be seen and tell you which direction they tilt. If the response is incorrect, have the patient describe the preceding patch.
• Use the Vision Test Key in the binder to determine if participant’s answers are correct.
• Each vertical column of numbers on the second part of the Vision Test form corresponds to a horizontal row on the chart. Record the last patch the participant correctly identifies in each row by marking the corresponding dot on the form.
• Cover the other eye and repeat all the steps above.
12. Vision Test for Color Blindness. • Take the participant back to his/her desk. • Place the book containing the plates on the testing apparatus
Procedure: Please hold the red end of this handle to your nose and read the number on the following plates.
• Record the participants answers on the Vision/Hearing Form • Participants will not be disqualified based on the results of this test.
13. Record participants vision correction description on the Vision/Hearing Form.
14. Take standing height and seated eye height measurement. • Ask participant to stand with his/her back to the tape measure on the wall and
record the standing height on the Vision/Hearing Form.
142

• Ask participant to sit in the chair (non-adjustable stationary chair), back up against backrest, facing the counter and sink in the conference room, and record their seated eye height on the Vision/Hearing Form.
15. Bring participant out front and orient him/her to the vehicle (point out restrooms and drinking fountains). • Make sure buckle seat belt and are not wearing a hat. • Power seat: when sitting in seat controls are on the left side of the seat. • Steering wheel: can be positioned forward, backward, up, and down using knob
on the left side of the steering wheel column. • Power mirrors: controls are on the arm rest of the door. • Point out the location of the gear shift and tell him/her the experimenter will ask
him/her to drive in 3rd gear at certain times. • Point out the cell phone in between the seats, but let them know they won’t need
to use it until later on. • Point out the dome light and how to push on and off. • Explain to participant that they will not need nor should they use the cruise
control.
At no time will you be using the cruise control, and at no time during the study should you turn off the vehicle.
16. Enter any data already gathered (see Data Entry Protocol) while waiting for the next participant.
17. Keep radio with you, make note of the time Melinda radios Dispatch that they are heading for the familiarization route. • If more than 30 minutes go by before returning and radioing the Smart Road,
please call Melinda’s cell phone (250-2486) to verify the location (and safety) of the experimenter and participant.
18. Assemble all forms in packet for participant, have Risk-Taking Style (rt) Questionnaire and Debriefing (Payment) Form ready when return from road. • Administer the Risk-Taking Style Questionnaire (2 pages)
19. Pay participant and thank them for their time! • Experimenter will retrieve payment • Ask participant to fill out payment log • Give payment and debriefing form to participant
20. After last participant, collect items from road. • Purple arrow flag from turnaround 3 (can leave cones)
143
• Laser (put in trunk) • Take Illuminance Measure
i) Illuminance meter and flash light should be in back seat. ii) Turn on meter and cover so that calibrates to dark iii) Set meter up at specified point on bottom turn (middle of road at curve
entrance point, near RPM), place on pavement and press side button to freeze reading
iv) Record reading on MDW2 Order Sheet
21. Vehicle shut-down • Fuel Silvia • Park and lock the vehicle in the Simbay; put the keys in the lockbox
22. Shut-down and clean up (along with Lead Experimenter): • Illuminance meter, pedal force gauge, and flashlights stay in seat pockets. • Voice recorder, and red data stick, and hearing test laptop go back into CASS
cabinet. • Organize Main Conference Room and VDOT Conference Room • Close and lock all doors (Simbay, preprooms, CASS lab, front door) • Put all packets and forms in the “In” box in the CASS cabinet
NOTES:
• This is a surprise study. It is VERY important that details about the true nature of the study (testing curve warnings) are not revealed to the participant. Participants are told that they will be testing cell phone usage while driving. Please do not mention any of the following to the participant: - The short length of the Smart Road - The turnaround loop at the end of the Smart Road - Warning devices in the vehicle
• Please read through the MDW2 Informed Consent Form II to understand what the study is about.
• If the participant asks a question that you don’t know how to answer without potentially biasing him or her, for example, “How long is the Smart Road?,” you can answer by saying, “I’m not sure.” - Other responses to “How long is the road,” or “What’s at the end,” etc.:
(1) Well, you may have heard, eventually it will meet highway 81. (2) You will be driving a pretty good section of the road. (3) (Pretend that you have been radioed over headphones) “What’s that
Melinda/Miguel? Oh, ok, right, good.”
144
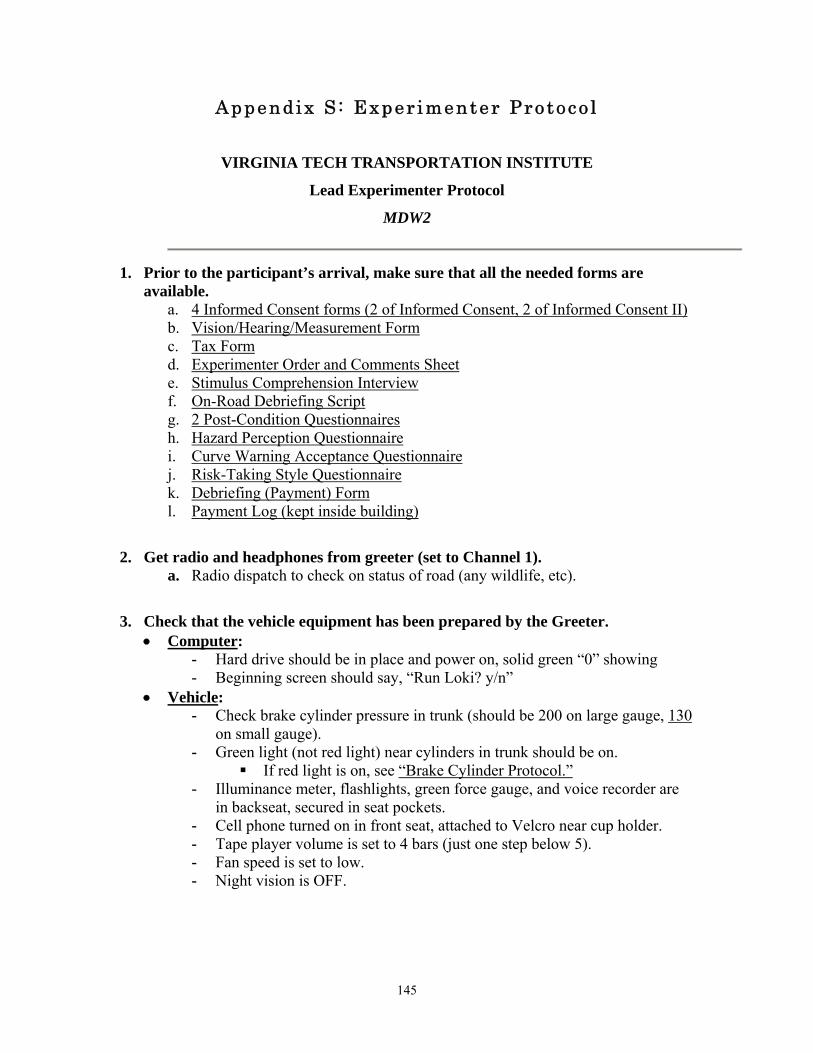
Appendix S : Exper imenter Protoco l
VIRGINIA TECH TRANSPORTATION INSTITUTE
Lead Experimenter Protocol
MDW2
1. Prior to the participant’s arrival, make sure that all the needed forms are
available. a. 4 Informed Consent forms (2 of Informed Consent, 2 of Informed Consent II) b. Vision/Hearing/Measurement Form c. Tax Form d. Experimenter Order and Comments Sheet e. Stimulus Comprehension Interview f. On-Road Debriefing Script g. 2 Post-Condition Questionnaires h. Hazard Perception Questionnaire i. Curve Warning Acceptance Questionnaire j. Risk-Taking Style Questionnaire k. Debriefing (Payment) Form l. Payment Log (kept inside building)
2. Get radio and headphones from greeter (set to Channel 1). a. Radio dispatch to check on status of road (any wildlife, etc).
3. Check that the vehicle equipment has been prepared by the Greeter. • Computer:
- Hard drive should be in place and power on, solid green “0” showing - Beginning screen should say, “Run Loki? y/n”
• Vehicle: - Check brake cylinder pressure in trunk (should be 200 on large gauge, 130
on small gauge). - Green light (not red light) near cylinders in trunk should be on.
If red light is on, see “Brake Cylinder Protocol.” - Illuminance meter, flashlights, green force gauge, and voice recorder are
in backseat, secured in seat pockets. - Cell phone turned on in front seat, attached to Velcro near cup holder. - Tape player volume is set to 4 bars (just one step below 5). - Fan speed is set to low. - Night vision is OFF.
145
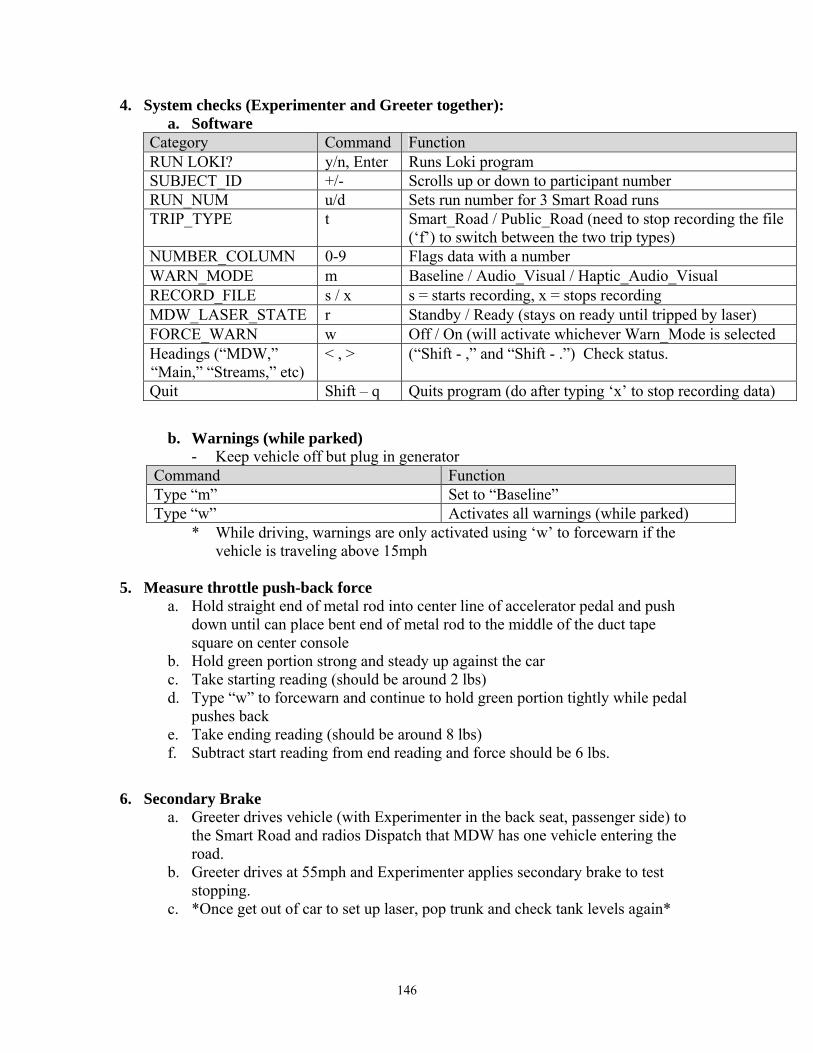
4. System checks (Experimenter and Greeter together): a. Software
Category Command Function RUN LOKI? y/n, Enter Runs Loki program SUBJECT_ID +/- Scrolls up or down to participant number RUN_NUM u/d Sets run number for 3 Smart Road runs TRIP_TYPE t Smart_Road / Public_Road (need to stop recording the file
(‘f’) to switch between the two trip types) NUMBER_COLUMN 0-9 Flags data with a number WARN_MODE m Baseline / Audio_Visual / Haptic_Audio_Visual RECORD_FILE s / x s = starts recording, x = stops recording MDW_LASER_STATE r Standby / Ready (stays on ready until tripped by laser) FORCE_WARN w Off / On (will activate whichever Warn_Mode is selected Headings (“MDW,” “Main,” “Streams,” etc)
< , > (“Shift - ,” and “Shift - .”) Check status.
Quit Shift – q Quits program (do after typing ‘x’ to stop recording data)
b. Warnings (while parked) - Keep vehicle off but plug in generator
Command Function Type “m” Set to “Baseline” Type “w” Activates all warnings (while parked)
* While driving, warnings are only activated using ‘w’ to forcewarn if the vehicle is traveling above 15mph
5. Measure throttle push-back force
a. Hold straight end of metal rod into center line of accelerator pedal and push down until can place bent end of metal rod to the middle of the duct tape square on center console
b. Hold green portion strong and steady up against the car c. Take starting reading (should be around 2 lbs) d. Type “w” to forcewarn and continue to hold green portion tightly while pedal
pushes back e. Take ending reading (should be around 8 lbs) f. Subtract start reading from end reading and force should be 6 lbs.
6. Secondary Brake a. Greeter drives vehicle (with Experimenter in the back seat, passenger side) to
the Smart Road and radios Dispatch that MDW has one vehicle entering the road.
b. Greeter drives at 55mph and Experimenter applies secondary brake to test stopping.
c. *Once get out of car to set up laser, pop trunk and check tank levels again*
146

7. Laser on Road a. Set up laser
i. Take gray case out to location (just at end of Wilson Creek Bridge, on the left when facing the bottom turn)
ii. Set two prongs of laser into stationary base iii. Plug cord into outlet on ground near road iv. Put gray case on the ground and tuck remaining cord into it for
protection v. Check for 2 lights to be lit on laser (with nothing in path of laser), if
not, check the plug vi. Check receptor in back windshield of car to make sure light is on as
well Command Function Type “m” Set to “Haptic_Audio_Visual” Type “r” Set laser state to “Ready”
b. Make sure all warnings are activated once drive past laser.
8. Smart Road Cone setup: During laser checks will also place cones. - 1 orange cone with reflector just on other side of top turnaround. - 1 orange cone with reflector next to bridge turnaround. - 3 cones in turnaround 3 (2 at either opening of turnaround, one with purple
arrow flag, 1 at exit of turnaround) - 1 cone at warning onset point past bridge (outside of guard rail) - 1 cone at emergency brake point before curve (outside of guard rail) - RPM bump at curve entrance
9. After participant arrives and has completed all forms/tests with Greeter, Greeter will orient the participant to the vehicle.
a. Make sure buckle seat belt and are not wearing a hat. a. Power seat: when sitting in seat controls are on the left side of the seat. b. Steering wheel: can be positioned forward, backward, up, and down using
knob on the left side of the steering wheel column. c. Power mirrors: controls are on the arm rest of the door. d. Point out the location of the gear shift and tell him/her the experimenter will
ask him/her to drive in 3rd gear at certain times. e. Point out the cell phone in between the seats, but let them know they won’t
need to use it until later on. f. Point out the dome light and how to push on and off. g. Explain to participant that they will not need nor should they use the cruise
control.
147

10. Begin computer program
Category Command Function RUN LOKI? y, Enter Runs Loki program SUBJECT_ID +/- Set to participant number RUN-NUM u/d Will set for Smart Road runs TRIP_TYPE t Set to Public_Road WARN_MODE m Baseline RECORD_FILE s Begins recording Headings (“MDW,” “Main,” “Streams,” etc)
> Scroll to “Streams” MPEG_STREAM[ ON] is displayed at the top
11. Orient the participant to the study (while parked). The experiment will last approximately one hour. You will only be driving
this vehicle during that time. I will be present with you at all times. First, you will drive on several Blacksburg roads to become familiar with the vehicle. It is important that you follow all traffic laws and speed limits. You will not be asked to perform any cellular phone tasks while driving on public roads. We will then return to the Smart Road for the remainder of the study. I will give instructions at various times and you will complete several questionnaires and ratings while on the road and once you return to the building.
It is important for you to understand that we are evaluating the technology,
not you. You will be expected to drive as you would normally, while following all traffic markings and obeying the speed limits of at most 55mph. Any tasks you perform, mistakes you make, or opinions you have will only help us do a better job evaluating cell phone usage while driving. Therefore, we ask that you perform to the best of your abilities. The information and feedback that you provide is very important to this project.
If at any time you feel uncomfortable you can let me know that you wish to
stop and I will drive us back to the VTTI building. Please remember that cell phone usage is being evaluated, not you or your performance.
Do you have any questions before we head out to the road?
12. Radio Dispatch for safety – notify going to begin orientation drive. I am going to radio the Control Center dispatch to let them know that we are
leaving for the public roads and so that they can monitor our location. -Dispatch, this is Melinda with the Cell Phone Study. We are heading out to the familiarization part of the study. I’ll keep you posted on our location.
13. Inform participant that he/she will not need to use the cell phone for this local road drive.
148

14. Ask participant to drive orientation route, making sure that the windows are rolled up, the participant is not wearing a hat, and that all passengers have their seat belts buckled.
I will let you know where to turn as we go along the route. Please follow all
traffic rules, signs, and speed limits.
15. Orientation Route Directions: i. Left on Industrial Park Dr.
ii. Straight through light crossing 460 Business iii. Left at light onto 460 Bypass East iv. Right onto Pepper’s Ferry exit v. Right at Stop sign
vi. Right at light, left into DMV – park. Do you have any questions about how the vehicle handles in highway driving? Turn ON file at this point (record).
vii. Go back out to light and take a left. viii. Straight and follow left curve to stay on service road
ix. Right at Stop Sign onto Cinnabar Rd. Speed limit for this road is 35mph. x. Left onto Yellow Sulfur Spring Rd. (just over hill at bottom of a valley)
Please put the vehicle in 3rd gear. Speed limit for this road is 35mph. xi. Right onto 460 Business
xii. Right onto Industrial Park Dr.
• Flag data once on sharp left curve to service road – Press 1. Command Function
Type “1” Flags data with this number
• Document any unexpected events. Make a note if the computer needed to be restarted, if there are events that might influence data (e.g. wildlife on the road), etc.
16. Return to the Smart Road, radio dispatch and enter the road. • Set beams to either high or low.
17. Set up computer. Command Function Type “t” Set to Smart_Road Type “u” Set to Run_Num 1 Type “m” Set to warning mode for Condition 1 Type “r” Set laser state to Ready
149

18. Ask participant to park near orange cone (facing down the road.)
Now we’re going to drive down the Smart Road so that you can get used to driving on this road. Please maintain a speed limit of 55 mph. You will not perform any cell phone tasks until we park and I give you more instructions, but I will ask you to stop at one point so that I can show you the training area for the cell phone tasks. Once we are driving I will not be able to talk to you. Please put the car into 3rd gear, and you may start down the road when you’re ready. Please try to stay as close to 55 mph as possible.
- Check that participant is set in 3rd gear on dash
• Once vehicle reaches the start of the small bridge prior to the Willow Creek Bridge, ask the participant to slow down and then stop once they reach the flagged cone near the Bridge Turn on the right.
Please begin to slow the vehicle; I’m going to ask you to come to a complete stop when you reach an orange cone with a reflector located on the right side of the road. This is the training area we will use to learn different cell phone tasks. OK, please leave the vehicle in 3rd gear and continue down the road at 55mph.
- Check that participant is set in 3rd gear on dash
19. * Watch the data and if the laser is not triggered, • And Warn_Mode is Baseline:
Command Function
Type “1” at 1st cone Flags data when reach warning onset Say “brake” and apply brake at 2nd cone if no sign of slowing
Slows vehicle
Type “2” at rpm bump on curve Flags data when reach curve entrance
• And Warn_Mode 1 or 2 is set: Command Function
Type “w” at 1st cone Activates warning manually Say “brake” and apply brake at 2nd cone if no sign of slowing
Slows vehicle
Type “2” at rpm bump on curve Flags data when reach curve entrance
20. * If laser is triggered, but no warning goes off once “DISTANCE_TO_CURB” reaches 0.0000:
Command Function
Type “w” Activates warning manually
150

21. * If the participant does not apply the brake once the safety point on the road is reached, say, “Brake!” If participant does not begin braking, apply the secondary brake. *
Command Function Say “brake” and apply brake if no sign of slowing once Distance_to_curb = -414 (2nd cone along the road)
Slows vehicle
• If the participant seems shaken up, explain what happened and offer to drive him or her back to the building. After participant has passed apex of loop:
What you just experienced is part of the study, I will explain more once we park. Please stop the car and put it in park once we get to the other side of the loop and are facing back up the road.
22. Park and perform debriefing. • Conduct Stimulus Comprehension Interview. (Did you notice anything just now?
Can you describe what you noticed? What did it mean to you?) o Record participant’s responses with Olympus Voice Recorder DS-330
Command on Recorder Function Slide “Hold” to down position Turns recorder on Switch microphone cord mounted on back of seat rest to “On”
Turns microphone on
Press side “Folder/Menu” button Will save file in desired folder Press Rec. on side Records Press Stop on front Stops recording Press New on side whenever want to start a new file
Starts new file
• Administer Post-Condition Questionnaire if participant received a warning.
• Administer Hazard Perception Questionnaire (1st page verbal, second in q binder). - Before the written portion, ask the following:
- For participants who did receive a warning: (1) Would you say that you first became aware of the sharp curve (turnaround
loop) at the end of the Smart Road: (a) Prior to the warning (b) During the warning (c) After the warning
• Read on-road debriefing script (plastic sheet in Experimenter Binder). • Ask the participant to read over and sign the Informed Consent Form II and ask
for any questions they have.
151
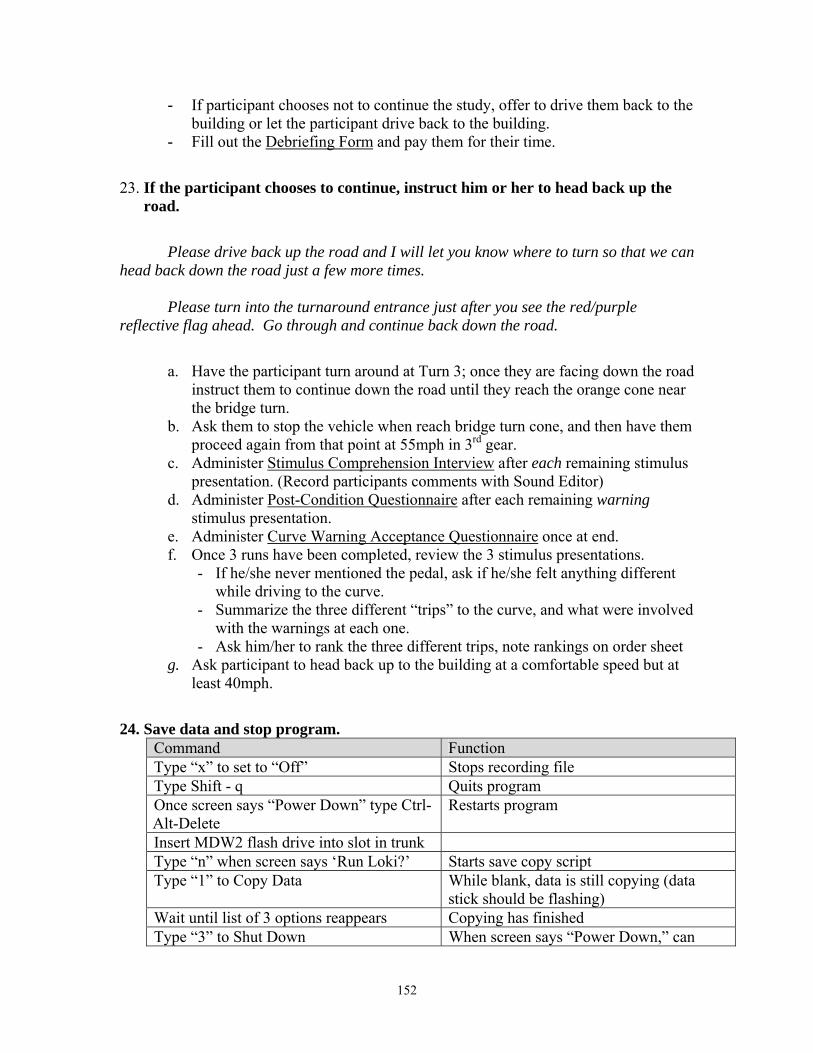
- If participant chooses not to continue the study, offer to drive them back to the building or let the participant drive back to the building.
- Fill out the Debriefing Form and pay them for their time.
23. If the participant chooses to continue, instruct him or her to head back up the road.
Please drive back up the road and I will let you know where to turn so that we can head back down the road just a few more times.
Please turn into the turnaround entrance just after you see the red/purple
reflective flag ahead. Go through and continue back down the road.
a. Have the participant turn around at Turn 3; once they are facing down the road instruct them to continue down the road until they reach the orange cone near the bridge turn.
b. Ask them to stop the vehicle when reach bridge turn cone, and then have them proceed again from that point at 55mph in 3rd gear.
c. Administer Stimulus Comprehension Interview after each remaining stimulus presentation. (Record participants comments with Sound Editor)
d. Administer Post-Condition Questionnaire after each remaining warning stimulus presentation.
e. Administer Curve Warning Acceptance Questionnaire once at end. f. Once 3 runs have been completed, review the 3 stimulus presentations.
- If he/she never mentioned the pedal, ask if he/she felt anything different while driving to the curve.
- Summarize the three different “trips” to the curve, and what were involved with the warnings at each one.
- Ask him/her to rank the three different trips, note rankings on order sheet g. Ask participant to head back up to the building at a comfortable speed but at
least 40mph.
24. Save data and stop program. Command Function Type “x” to set to “Off” Stops recording file Type Shift - q Quits program Once screen says “Power Down” type Ctrl-Alt-Delete
Restarts program
Insert MDW2 flash drive into slot in trunk Type “n” when screen says ‘Run Loki?’ Starts save copy script Type “1” to Copy Data While blank, data is still copying (data
stick should be flashing) Wait until list of 3 options reappears Copying has finished Type “3” to Shut Down When screen says “Power Down,” can
152

remove flash drive After remove flash drive, type Ctrl-Alt-Delete
Restarts program
Type “y” when screen says ‘Run Loki?’ Sets up for next participant
25. Once back at the building, greeter will administer Risk-Taking Style Questionnaire.
26. Payment and debriefing. At the end of the study pay the participant ($20.00 per hour, rounding up to the nearest ½ hour). Complete the Debriefing (Payment) Form and give to the participant. Have the participant sign the Payment Log, and thank them for their participation!
27. Save data from data stick onto the server under “CASS - MDW2 – Data-Raw” folder. Put files into individual participant folders.
- Check the data with Peeping Tom – look at the video, speed, accel, and brake views to makes sure data was recorded properly.
28. Shut-down and clean up (along with Greeter): • Park and lock the vehicle in the Simbay; put the keys in the lockbox • Voice recorder, red data stick, and hearing test laptop go back into CASS
cabinet • Download voice recorder files • Organize Main Conference Room and VDOT Conference Room • Close and lock all doors (Simbay, preprooms, CASS lab, front door)
NOTES:
• This is a surprise study. It is VERY important that details about the true nature of the study (testing curve warnings) are not revealed to the participant. Participants are told that they will be testing cell phone usage while driving. Please do not mention any of the following to the participant: - The short length of the Smart Road - The turnaround loop at the end of the Smart Road - Warning devices in the vehicle
• Please read through the MDW2 Informed Consent Form II to understand what the study is about.
• If the participant asks a question that you don’t know how to answer without potentially biasing him or her, for example, “How long is the Smart Road?,” you can answer by saying, “I’m not sure.” - Other responses to “How long is the road,” or “What’s at the end,” etc.:
(1) Well, you may have heard, eventually it will meet highway 81. (2) You will be driving a pretty good section of the road. (3) (Pretend that you have been radioed over headphones) “What’s that
Melinda/Miguel? Oh, ok, right, good.”
153

Appendix T : On-Road Part i c ipant Debr ie f ing Scr ipt
The following is to be read after the FIRST stimulus presentation in which a warning stimulus is presented:
1. Stimulus Comprehension Interview (general examples of probe questions)
Did you notice anything just now? Can you describe what you noticed? What did it mean to you?
2. Debriefing Statement
“Now I would like to tell you that the purpose of this study is to gather drivers’
reactions to a curve warning device. There will be no cell phone tasks for you to perform.
You will be asked to drive a short portion of the Smart Road several more times and to
give your opinions about the driving task and the warning. The reason we do not inform
participants of the warning before driving on the Smart Road is so that we can see how
the warning performs for drivers that are not expecting the situation. There will be no
more surprises; would you like to continue with the study?
3. Administer Second Informed Consent Form
4. Permission to Keep Data from Trial 1 Now that you are aware of the purpose of this study, is it all right for us to keep
the data collected from the first trial?
Yes or No
Do you have any questions before we continue?
154

Appendix U: In fo rmed Consent Form I I
VIRGINIA POLYTECHNIC INSTITUTE AND STATE UNIVERSITY Informed Consent for Participants of Investigative Projects
Debriefing and Informed Consent for Participants of Investigative Projects Title of Project: Multidimensional Warnings Investigators: Melinda McElheny, Myra Blanco, and Tonya Smith-Jackson THE PURPOSE OF THIS RESEARCH The true purpose of this research is to gather driver reactions to and opinions about in-vehicle curve warnings. This device would have the ability to calculate an appropriate, vehicle-specific curve speed. If the vehicle speed is too fast for the upcoming curve, this system would communicate to the driver that he/she needs to slow down. This research will contribute to the current body of knowledge regarding Intelligent Transportation Systems. The results of the research will also provide guidelines for future test methods. One aspect of the research project deals with how people might respond to such a warning the first time they encounter it. To do this, we needed to create a situation where you were presented with the warning without expecting it. If you had anticipated the warning, the data would not have been as useful. There was no “correct” or “incorrect” information in the data that you provided. We needed to compare your response to others who were presented with the same situation. All known precautions were taken to ensure your complete safety throughout this session and during the presentation of the scenario. We would like to thank you for your participation in this study, as the results may contribute to future development of in-vehicle warning devices. We would also like to ask that you do not talk about the details of this study to others for at least 3 months after your participation as this may invalidate future data that may be collected.
We again assure you that all data will be treated with complete anonymity. Shortly after participating, your name will be separated from the data. A coding scheme will be employed to identify the data by subject number only (for example, Subject No. 3).
We will continue running the experiment, and you will be presented with additional curve warning displays. You will also complete a few more questionnaires.
All other aspects of the earlier informed consent you signed, including risks, benefits, safety precautions, and your responsibilities, continue to apply to the remainder of this experiment.
I hereby acknowledge the above and give my voluntary consent for my data to be used in this project.
_____________________________________________________________________________
Participant's SignatureDate
Should I have any questions about this research or its conduct, I may contact: Melinda McElheny(540) 231-1557 Myra Blanco(540) 231-1500 Tonya Smith-Jackson (540) 231-4119 David Moore, Chair, IRB(540) 231-4991
155

Appendix V : Part i c ipant Debr ie f ing and Payment
Form
NAME:_______________________________
Thank you for your collaboration and interest in this study. The time that you have taken to evaluate these new technologies is greatly appreciated. The results of this evaluation process will help refine the design of in-vehicle warning systems. We appreciate your cooperation to keep the details of this study including the displays confidential.
If you have any questions please do not hesitate to contact us. Melinda McElheny and Myra Blanco will be glad to answer all your questions related to this evaluation process.
Date: ___/__/__ Time In: ____:____ Time Out: ____:____ Time ____:___
TOTAL TIME:___________________
TOTAL PAYMENT*:_______________
VTTI Staff Signature:_______________
*Please note that payments you receive in accordance with this research are considered taxable income. If payment exceeds $600.00 in any one calendar year, Virginia Tech is required to file a 1099 form with the IRS. For amounts less than $600.00, you are responsible for reporting additional income, but no 1099 tax forms will be filed with the IRS.
Virginia Tech Transportation Institute 3500 Transportation Research Plaza (0536)
Blacksburg, Virginia 24061 Phone: (540) 231-1500 Fax: (540) 231-1555
156

157
W.1. Between-Subjects Design
Appendix W: ANOVA Tables
Throttle Reaction Time
Source DF SS MS F value P valueBetweenAGE 1 0.3 0.3 0.20 0.6585SURPRISE STIMULUS PRESENTATION 2 57.5 28.8 20.65 <.0001 *AGE X SURPRISE STIMULUS PRESENTATION 2 4.3 2.1 1.53 0.2303PARTICIPANT(AGE SURPRISE STIMULUS PRESENTATION) 37 51.5 1.4TOTAL 42 113.6
Brak
SourceBetween
e Reaction Time
DF SS MS F value P value
AGE
AGE X SURPRIPARTICITOTAL
Smart Ro
SourceBetweenAGE
AGE X SURPRIPARTICITOTAL
* p < 0.05
1 1.3 1.3 1.22 0.2761SURPRISE STIMULUS PRESENTATION 2 21.2 10.6 9.85 0.0004 *
SE STIMULUS PRESENTATION 2 1.5 0.8 0.71 0.4971PANT(AGE SURPRISE STIMULUS PRESENTATION) 37 39.8 1.1
42 63.8
ad Curve Entry Speed
DF SS MS F value P value
1 166.5 166.5 9.05 0.0046 *SURPRISE STIMULUS PRESENTATION 2 444.2 222.1 12.08 <.0001 *
SE STIMULUS PRESENTATION 2 6.6 3.3 0.18 0.8356PANT(AGE SURPRISE STIMULUS PRESENTATION) 38 698.8 18.4
43 1316.1
(significant)

158
W.2. Mixed Factors Design
Throttle Reaction Time
Source DF SS MS F value P valueBetweenAGE 1 1.9 1.9 2.46 0.1238PARTICIPANT(AGE) 45 35.6 0.8
WithinSTIMULUS PRESENTATION 2 262.1 131.1 160.32 <.0001 *AGE X STIMULUS PRESENTATION 2 6.4 3.2 3.90 0.0242 *STIMULUS PRESENTATION X PARTICIPANT(AGE) 80 65.4 0.8TOTAL 130 371.4
S
Brake Reaction Time
ource DF SS MS F value P valueBetweenAGE 1 3.4 3.4 3.29 0.0763PARTICIPANT(AGE) 45 46.0 1.0
WithinSTIMULUS PRESENTATION 2 206.8 103.4 104.10 <.0001 *AGE X STIMULUS PRESENTATION 2 1.2 0.6 0.61 0.5442STIMULUS PRESENTATION X PARTICIPANT(AGE) 81 80.4 1.0TOTAL 131 337.8
mart Road Curve Entry Speed
ource DF SS MS F value P valueBetween
S
S
AGE 1 176.0 176.0 7.42 0.0091 *PARTICIPANT(AGE) 46 1091.0 23.7
WithinSTIMULUS PRESENTATION 2 1327.5 663.7 54.48 <.0001 *AGE X STIMULUS PRESENTATION 2 22.5 11.2 0.92 0.4016STIMULUS PRESENTATION X PARTICIPANT(AGE) 86 1047.7 12.2TOTAL 137 3664.7
p < 0.05 (significant)*

159
W.3. Run Number Within-Subject Design
Source DF SS MS F value P valueBetweenPARTICIPANT 46 43.7 1.0
WithinRUN 2 9.8 4.9 1.26 0.2881RUN XPARTICIPANT 82 318.7 3.9TOTAL 130 372.2
SourceBe
DF SS MS F value P valuetween
PA
Within
RTICIPANT 46 53.7 1.2
RURUTO
SourceBe
N 2 25.1 12.6 3.97 0.0225 *
N XPARTICIPANT 83 262.5 3.2
TAL 131 341.3
DF SS MS F value P valuetween
PA
Within
RTICIPANT 47 1320.3 28.1
RURUTO
*
TRT
BR
SRspe
N 2 24.1 12.1 0.45 0.642
N XPARTICIPANT 88 2383.0 27.1
TAL 137 3727.4
p < 0.05 (significant)
T
ed
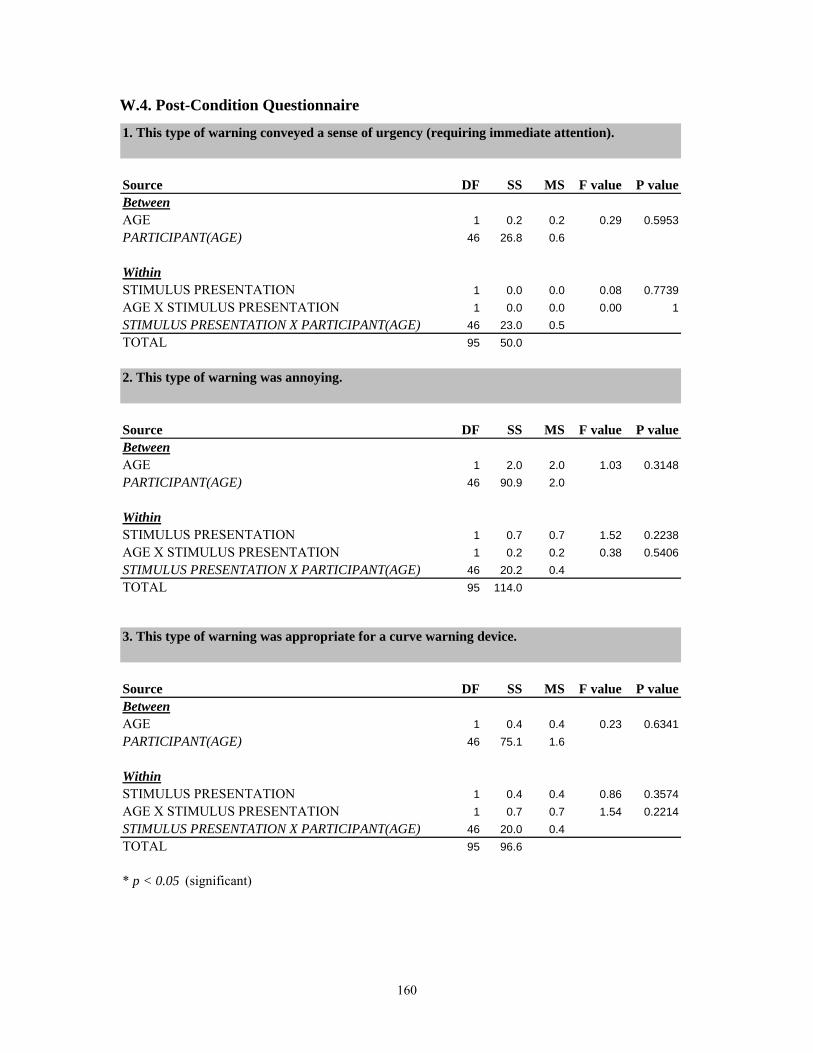
160
W.4. Post-Condition Questionnaire
Source DF SS MS F value P valueBetweenAGE 1 2.0 2.0 1.03 0.3148PARTICIPANT(AGE) 46 90.9 2.0
WithinSTIMULUS PRESENTATION 1 0.7 0.7 1.52 0.2238AGE X STIMULUS PRESENTATION 1 0.2 0.2 0.38 0.5406STIMULUS PRESENTATION X PARTICIPANT(AGE) 46 20.2 0.4TOTAL 95 114.0
Source DF SS MS F value P valueBetweenAGE 1 0.4 0.4 0.23 0.6341PARTICIPANT(AGE) 46 75.1 1.6
WithinSTIMULUS PRESENTATION 1 0.4 0.4 0.86 0.3574AGE X STIMULUS PRESENTATION 1 0.7 0.7 1.54 0.2214STIMULUS PRESENTATION X PARTICIPANT(AGE) 46 20.0 0.4TOTAL 95 96.6
* p < 0.05 (significant)
2. This type of warning was annoying.
3. This type of warning was appropriate for a curve warning device.
Source DF SS MS F value P valueBetweenAGE 1 0.2 0.2 0.29 0.5953PARTICIPANT(AGE) 46 26.8 0.6
WithinSTIMULUS PRESENTATION 1 0.0 0.0 0.08 0.7739AGE X STIMULUS PRESENTATION 1 0.0 0.0 0.00 1STIMULUS PRESENTATION X PARTICIPANT(AGE) 46 23.0 0.5TOTAL 95 50.0
1. This type of warning conveyed a sense of urgency (requiring immediate attention).
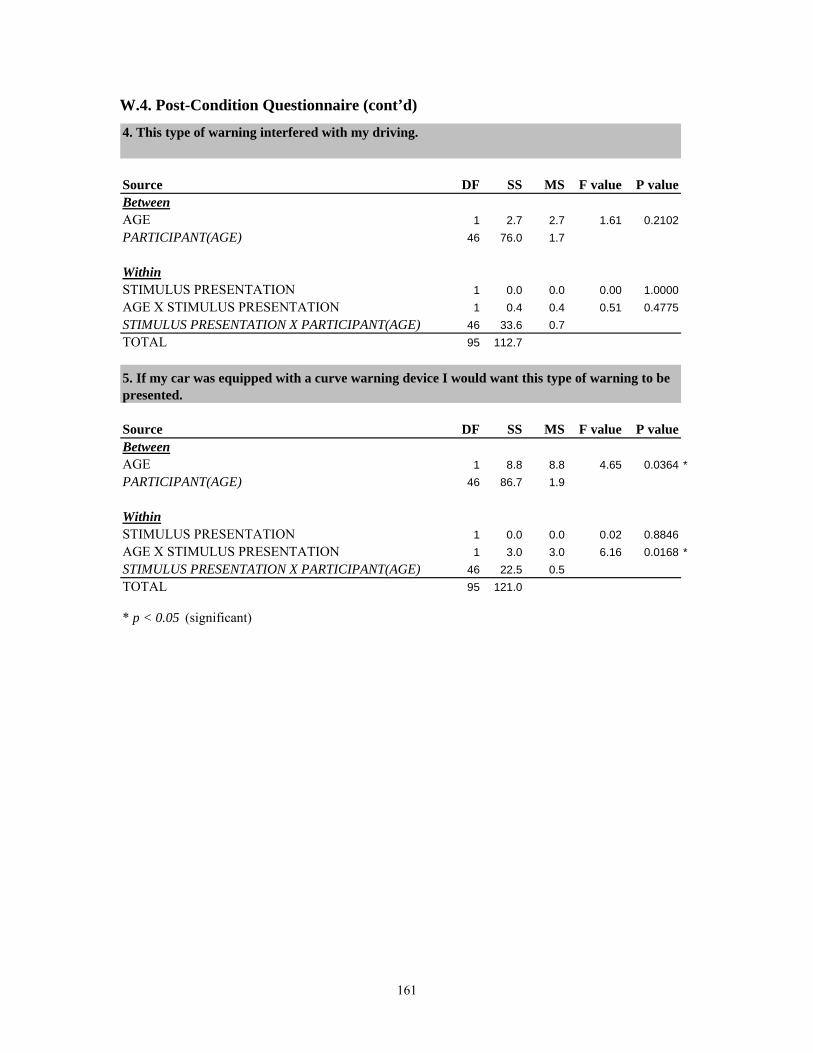
W.4. Post-Condition Questionnaire (cont’d)
Source DF SS MS F value P valueBetweenAGE 1 2.7 2.7 1.61 0.2102PARTICIPANT(AGE) 46 76.0 1.7
WithinSTIMULUS PRESENTATION 1 0.0 0.0 0.00 1.0000AGE X STIMULUS PRESENTATION 1 0.4 0.4 0.51 0.4775STIMULUS PRESENTATION X PARTICIPANT(AGE) 46 33.6 0.7TOTAL 95 112.7
Source DF SS MS F value P valueBetweenAGE 1 8.8 8.8 4.65 0.0364 *PARTICIPANT(AGE) 46 86.7 1.9
WithinSTIMULUS PRESENTATION 1 0.0 0.0 0.02 0.8846AGE X STIMULUS PRESENTATION 1 3.0 3.0 6.16 0.0168 *STIMULUS PRESENTATION X PARTICIPANT(AGE) 46 22.5 0.5TOTAL 95 121.0
* p < 0.05 (significant)
5. If my car was equipped with a curve warning device I would want this type of warning to be presented.
4. This type of warning interfered with my driving.
161

W.5. Curve Warning Acceptance Questionnaire 1. Useful - Useless
Source DF SS MS F value P valueBetweenAGE 1 2.1 2.1 3.35 0.0736PARTICIPANT(AGE) 46 28.6 0.6TOTAL 47 30.7
Source DF SS MS F value P valueBetweenAGE 1 6.1 6.1 6.45 0.0147 *PARTICIPANT(AGE) 46 42.8 1.0TOTAL 47 48.9
3. Bad - Good
Source DF SS MS F value P valueBetweenAGE 1 1.0 1.0 1.4 0.2422PARTICIPANT(AGE) 46 33.5 0.7TOTAL 47 34.5
4. Nice - Annoying
Source DF SS MS F value P valueBetweenAGE 1 4.1 4.1 2.88 0.0963PARTICIPANT(AGE) 46 65.2 1.4TOTAL 47 69.3
5. Effective - Superfluous
Source DF SS MS F value P valueBetweenAGE 1 2.1 2.1 2.69 0.1076PARTICIPANT(AGE) 46 35.6 0.8TOTAL 47 37.7
* p < 0.05 (significant)
2. Pleasant - Unpleasant
162

W.5. Curve Warning Acceptance Questionnaire (cont’d) 6. Irritating - Likeable
Source DF SS MS F value P valueBetweenAGE 1 6.0 6.0 4.95 0.031 *PARTICIPANT(AGE) 46 56.0 1.2TOTAL 47 62.0
Source DF SS MS F value P valueBetweenAGE 1 0.5 0.5 0.96 0.3323PARTICIPANT(AGE) 46 25.0 0.5TOTAL 47 25.5
8. Undesirable - Desirable
Source DF SS MS F value P valueBetweenAGE 1 9.2 9.2 8.78 0.0048 *PARTICIPANT(AGE) 46 48.1 1.0TOTAL 47 57.3
9. Raising Alertness - Sleep-Inducing
Source DF SS MS F value P valueBetweenAGE 1 0.2 0.2 2.01 0.163PARTICIPANT(AGE) 46 4.3 0.1TOTAL 47 4.5
* p < 0.05 (significant)
7. Assisting - Worthless
163

W.6. Hazard Perception Questionnaire
Source DF SS MS F value P valueBetweenAGE 1 0.1 0.1 0.07 0.7975PARTICIPANT(AGE) 46 57.6 1.3TOTAL 47 57.7
Source DF SS MS F value P valueBetweenAGE 1 1.0 1.0 1.48 0.2304PARTICIPANT(AGE) 46 31.2 0.7TOTAL 47 32.2
3. I usually drive above the speed limit posted on curves.
Source DF SS MS F value P valueBetweenAGE 1 2.5 2.5 2.25 0.1402PARTICIPANT(AGE) 46 51.5 1.1TOTAL 47 54.0
4. Roadway curves are hazardous.
Source DF SS MS F value P valueBetweenAGE 1 1.7 1.7 2.31 0.1355PARTICIPANT(AGE) 46 33.6 0.7TOTAL 47 35.3
Source DF SS MS F value P valueBetweenAGE 1 0.0 0.0 0.05 0.8329PARTICIPANT(AGE) 46 48.0 1.0TOTAL 47 48.0
* p < 0.05 (significant)
2. Once I noticed a curve at the end of the Smart Road, the curve seemed like it could be a dangerous driving maneuver.
1. I often (at least several times per month) drive on roads with two or more tight curves.
5. Posted advisory speeds for curves are usually much slower than they need to be.
164

W.7. Risk-Taking Style Questionnaire 1. Many traffic rules must be ignored to ensure traffic flow.
Source DF SS MS F value P valueBetweenAGE 1 2.1 2.1 1.87 0.1778PARTICIPANT(AGE) 46 51.2 1.1TOTAL 47 53.3
Source DF SS MS F value P valueBetweenAGE 1 3.0 3.0 2.35 0.132PARTICIPANT(AGE) 46 58.7 1.3TOTAL 47 61.7
3. Speed limits are exceeded because they are too restrictive.
Source DF SS MS F value P valueBetweenAGE 1 8.3 8.3 7.15 0.0103 *PARTICIPANT(AGE) 46 53.6 1.2TOTAL 47 61.9
4. It is acceptable to take chances when no other people are involved.
Source DF SS MS F value P valueBetweenAGE 1 2.5 2.5 2.5 0.121PARTICIPANT(AGE) 46 46.5 1.0TOTAL 47 49.0
5. If you are a good driver it is acceptable to drive a little faster.
Source DF SS MS F value P valueBetweenAGE 1 8.3 8.3 7.19 0.0102 *PARTICIPANT(AGE) 46 53.3 1.2TOTAL 47 61.6
6. I would never drive after drinking alcohol.
Source DF SS MS F value P valueBetweenAGE 1 2.5 2.5 1.8 0.1859PARTICIPANT(AGE) 46 64.3 1.4TOTAL 47 66.8
* p < 0.05 (significant)
2. Traffic rules must be respected regardless of road and weather conditions.
165
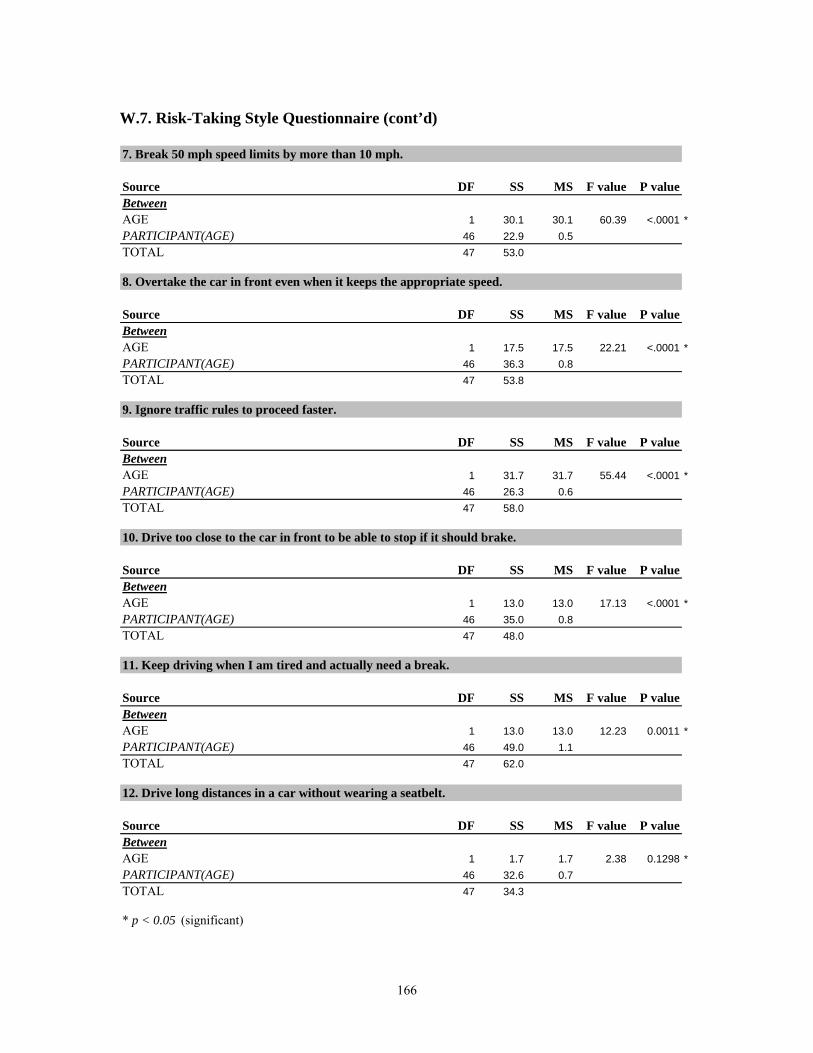
W.7. Risk-Taking Style Questionnaire (cont’d)
Source DF SS MS F value P valueBetweenAGE 1 30.1 30.1 60.39 <.0001 *PARTICIPANT(AGE) 46 22.9 0.5TOTAL 47 53.0
8. Overtake the car in front even when it keeps the appropriate speed.
Source DF SS MS F value P valueBetweenAGE 1 17.5 17.5 22.21 <.0001 *PARTICIPANT(AGE) 46 36.3 0.8TOTAL 47 53.8
9. Ignore traffic rules to proceed faster.
Source DF SS MS F value P valueBetweenAGE 1 31.7 31.7 55.44 <.0001 *PARTICIPANT(AGE) 46 26.3 0.6TOTAL 47 58.0
10. Drive too close to the car in front to be able to stop if it should brake.
Source DF SS MS F value P valueBetweenAGE 1 13.0 13.0 17.13 <.0001 *PARTICIPANT(AGE) 46 35.0 0.8TOTAL 47 48.0
11. Keep driving when I am tired and actually need a break.
Source DF SS MS F value P valueBetweenAGE 1 13.0 13.0 12.23 0.0011 *PARTICIPANT(AGE) 46 49.0 1.1TOTAL 47 62.0
12. Drive long distances in a car without wearing a seatbelt.
Source DF SS MS F value P valueBetweenAGE 1 1.7 1.7 2.38 0.1298 *PARTICIPANT(AGE) 46 32.6 0.7TOTAL 47 34.3
* p < 0.05 (significant)
7. Break 50 mph speed limits by more than 10 mph.
166

W.7. Risk-Taking Style Questionnaire (cont’d) Risk-Taking Style Score
Source DF SS MS F value P valueBetweenAGE 1 1291.7 1291.7 38.23 <.0001 *PARTICIPANT(AGE) 46 1554.3 33.8TOTAL 47 2846.0
* p < 0.05 (significant)
167

Appendix X : St imulus Comprehens ion Interv iew
Part i c ipant Comments and SC Score
# Stimulus Run Comments Noticed Warning
ID all components
correctly
ID proper response
action
SC Score
Parti-cipant Num-
ber
1=A.V., 2=H.A.V.
Number of run down road
Participant comments recorded during interview
1 1 1 I noticed anything…the thing (pointed to visual) came on? It talked to me. I mean, it was just shocking, I don't know. Oh ok, it was just kind of all of a sudden out of no where, so, kind of like had to react to it I guess. Is that good, I don't know what you want?
1 1 2
1 2 2 I think it was more before the turn, and the I guess the accelerator pedal, it popped, like when the warning went off. I noticed the gray cones you were talking about. I think that’s…it didn't startle me at all, because I was looking forward to it I guess.
1 1 2
2 1 3 Um, there was a yellow light, black arrow, and 15 miles per hour and the voice that told me to reduce it to 15.
1 1 1 3
2 2 1 That light. It's orangish yellow. And black arrow. Said 15 miles an hour I think. That voice. Um, meant to slow down.
1 1 2
3 1 2 Yes, the car alerted me that there was a curve a head and to slow down to 15 mph. Um, it's kind of loud. The announcement.
1 1 2
3 2 3 Um, the gas turned off. And the audible warning again, and visual. Um, the audible and visual was the same as last time, but the gas coming up really caught me off-guard.
1 1 2
4 1 3 Um, well it seemed like it was a little different than the first time but I don’t know if that was because I was more expecting it. But the same thing with the flashing light and the voice telling me to slow down.
1 1 1 3
4 2 2 Um, there was a flashing light, and um, the voice or whatever said to slow down to 15. And the flashing light wouldn't go off until I got down to 15.
1 1 2
5 1 1 Uh, yeah. The terrible light and voice. I don't know [what they meant], they just scared me, I thought something was wrong with the car.
1 1 2
5 2 3 Blinking light, and the gas pedal, like, let off itself or something. I needed to slow down.
1 1 2
6 1 2 OK, definitely noticed obviously the sound again, um as ironic as it seems it didn't seem as loud this time as the first time. I did see the orange background I did see the black arrow and the black 15, but this time I saw the curve as the warning was going on, not after.
1 1 1 3
6 2 1 Ha, yeah, um, I actually heard the sound before I saw the orange flash. There was an orange flash somewhere near the speedometer. It was an orange flash but there was a curve symbol and I think the number 15 in black, so it was black on an orange background. Um, I heard the sound and saw the whatever was going on in here in orange and black.
1 1 2
7 1 1 um the flashing light and the sound, um I was pretty surprised and I guess it meant that there was something coming up
1 1 1 3
7 2 2 Um flashing light again, and sound again, and like the pedal came up I guess 1 1 2
8 1 3 Well, I'm not sure if this messes with it, but I did look down and see that I was going 60, so I was already braking a little bit to slow my pace down because I was going to fast, so I don't know if that screwed it up at all. But I liked it better because I didn't feel a jolt at my foot. I just saw the light and the voice and I think the foot thing is what, maybe also because I knew what was going to happen, but the first time the foot thing really freaked me out more. If you changed the order I might have a different opinion, but I liked it better without the feet. The light was good and the voice was good too, although I still think I might turn that off. If this was my car and I knew what this light warning thing was, and I knew that that light meant "curve ahead" but I guess this could be used for more than one thing so the voice might be good. Anyway, it was better.
1 1 1 3
168
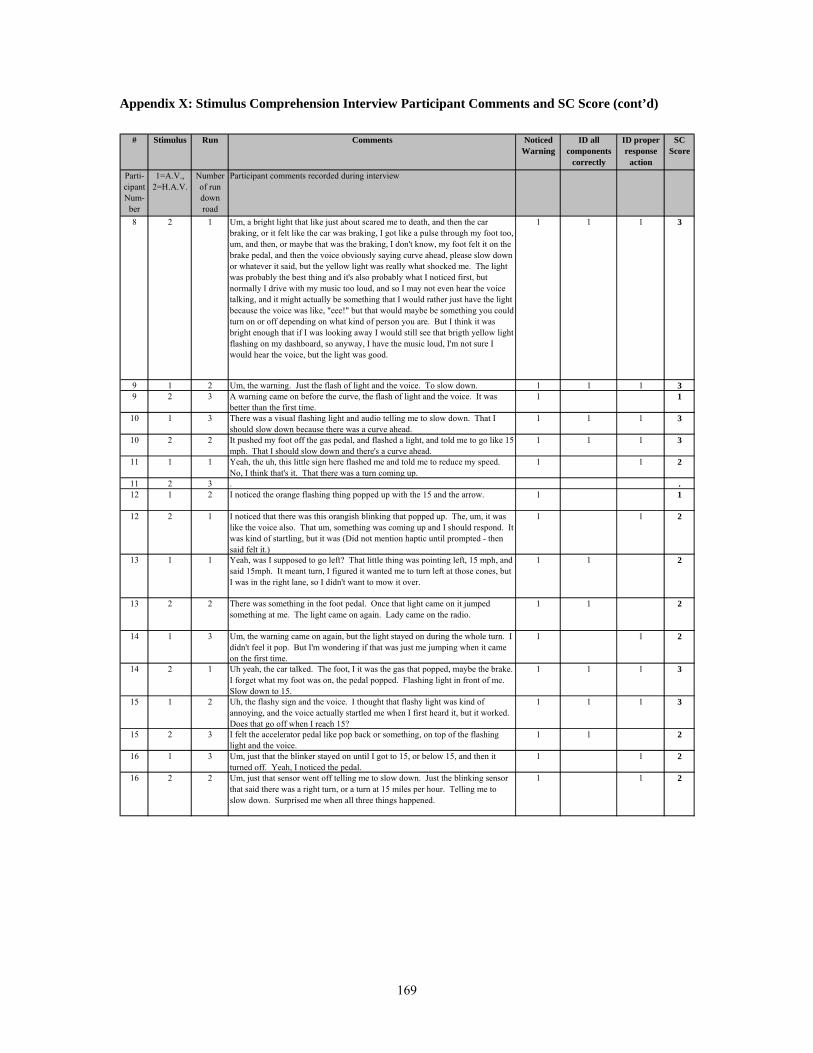
Appendix X: Stimulus Comprehension Interview Participant Comments and SC Score (cont’d)
# Stimulus Run Comments Noticed
WarningID all
components correctly
ID proper response
action
SC Score
Parti-cipant Num-
ber
1=A.V., 2=H.A.V.
Number of run down road
Participant comments recorded during interview
8 2 1 Um, a bright light that like just about scared me to death, and then the car braking, or it felt like the car was braking, I got like a pulse through my foot too, um, and then, or maybe that was the braking, I don't know, my foot felt it on the brake pedal, and then the voice obviously saying curve ahead, please slow down or whatever it said, but the yellow light was really what shocked me. The light was probably the best thing and it's also probably what I noticed first, but normally I drive with my music too loud, and so I may not even hear the voice talking, and it might actually be something that I would rather just have the light because the voice was like, "eee!" but that would maybe be something you could turn on or off depending on what kind of person you are. But I think it was bright enough that if I was looking away I would still see that brigth yellow light flashing on my dashboard, so anyway, I have the music loud, I'm not sure I would hear the voice, but the light was good.
1 1 1 3
9 1 2 Um, the warning. Just the flash of light and the voice. To slow down. 1 1 1 39 2 3 A warning came on before the curve, the flash of light and the voice. It was
better than the first time.1 1
10 1 3 There was a visual flashing light and audio telling me to slow down. That I should slow down because there was a curve ahead.
1 1 1 3
10 2 2 It pushed my foot off the gas pedal, and flashed a light, and told me to go like 15 mph. That I should slow down and there's a curve ahead.
1 1 1 3
11 1 1 Yeah, the uh, this little sign here flashed me and told me to reduce my speed. No, I think that's it. That there was a turn coming up.
1 1 2
11 2 3 . .12 1 2 I noticed the orange flashing thing popped up with the 15 and the arrow. 1 1
12 2 1 I noticed that there was this orangish blinking that popped up. The, um, it was like the voice also. That um, something was coming up and I should respond. It was kind of startling, but it was (Did not mention haptic until prompted - then said felt it.)
1 1 2
13 1 1 Yeah, was I supposed to go left? That little thing was pointing left, 15 mph, and said 15mph. It meant turn, I figured it wanted me to turn left at those cones, but I was in the right lane, so I didn't want to mow it over.
1 1 2
13 2 2 There was something in the foot pedal. Once that light came on it jumped something at me. The light came on again. Lady came on the radio.
1 1 2
14 1 3 Um, the warning came on again, but the light stayed on during the whole turn. I didn't feel it pop. But I'm wondering if that was just me jumping when it came on the first time.
1 1 2
14 2 1 Uh yeah, the car talked. The foot, I it was the gas that popped, maybe the brake. I forget what my foot was on, the pedal popped. Flashing light in front of me. Slow down to 15.
1 1 1 3
15 1 2 Uh, the flashy sign and the voice. I thought that flashy light was kind of annoying, and the voice actually startled me when I first heard it, but it worked. Does that go off when I reach 15?
1 1 1 3
15 2 3 I felt the accelerator pedal like pop back or something, on top of the flashing light and the voice.
1 1 2
16 1 3 Um, just that the blinker stayed on until I got to 15, or below 15, and then it turned off. Yeah, I noticed the pedal.
1 1 2
16 2 2 Um, just that sensor went off telling me to slow down. Just the blinking sensor that said there was a right turn, or a turn at 15 miles per hour. Telling me to slow down. Surprised me when all three things happened.
1 1 2
169
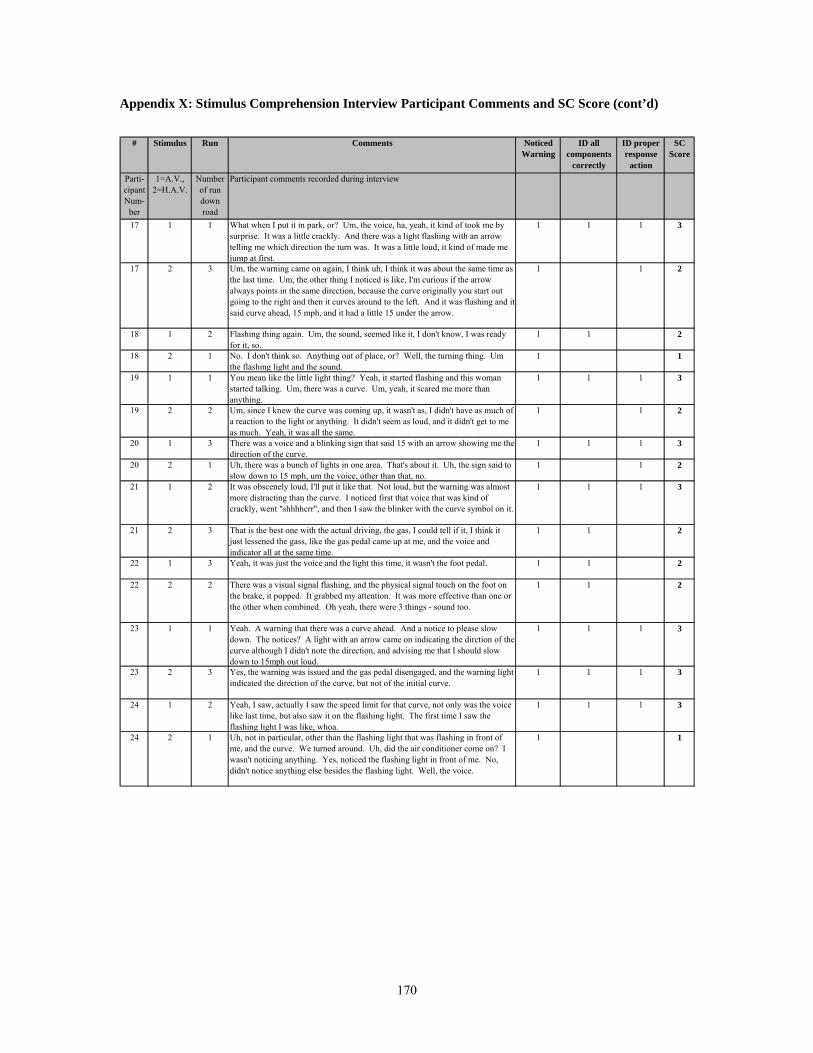
Appendix X: Stimulus Comprehension Interview Participant Comments and SC Score (cont’d)
# Stimulus Run Comments Noticed
WarningID all
components correctly
ID proper response
action
SC Score
Parti-cipant Num-
ber
1=A.V., 2=H.A.V.
Number of run down road
Participant comments recorded during interview
17 1 1 What when I put it in park, or? Um, the voice, ha, yeah, it kind of took me by surprise. It was a little crackly. And there was a light flashing with an arrow telling me which direction the turn was. It was a little loud, it kind of made me jump at first.
1 1 1 3
17 2 3 Um, the warning came on again, I think uh, I think it was about the same time as the last time. Um, the other thing I noticed is like, I'm curious if the arrow always points in the same direction, because the curve originally you start out going to the right and then it curves around to the left. And it was flashing and it said curve ahead, 15 mph, and it had a little 15 under the arrow.
1 1 2
18 1 2 Flashing thing again. Um, the sound, seemed like it, I don't know, I was ready for it, so.
1 1 2
18 2 1 No. I don't think so. Anything out of place, or? Well, the turning thing. Um the flashing light and the sound.
1 1
19 1 1 You mean like the little light thing? Yeah, it started flashing and this woman started talking. Um, there was a curve. Um, yeah, it scared me more than anything.
1 1 1 3
19 2 2 Um, since I knew the curve was coming up, it wasn't as, I didn't have as much of a reaction to the light or anything. It didn't seem as loud, and it didn't get to me as much. Yeah, it was all the same.
1 1 2
20 1 3 There was a voice and a blinking sign that said 15 with an arrow showing me the direction of the curve.
1 1 1 3
20 2 1 Uh, there was a bunch of lights in one area. That's about it. Uh, the sign said to slow down to 15 mph, um the voice, other than that, no.
1 1 2
21 1 2 It was obscenely loud, I'll put it like that. Not loud, but the warning was almost more distracting than the curve. I noticed first that voice that was kind of crackly, went "shhhhcrr", and then I saw the blinker with the curve symbol on it.
1 1 1 3
21 2 3 That is the best one with the actual driving, the gas, I could tell if it, I think it just lessened the gass, like the gas pedal came up at me, and the voice and indicator all at the same time.
1 1 2
22 1 3 Yeah, it was just the voice and the light this time, it wasn't the foot pedal. 1 1 2
22 2 2 There was a visual signal flashing, and the physical signal touch on the foot on the brake, it popped. It grabbed my attention. It was more effective than one or the other when combined. Oh yeah, there were 3 things - sound too.
1 1 2
23 1 1 Yeah. A warning that there was a curve ahead. And a notice to please slow down. The notices? A light with an arrow came on indicating the dirction of the curve although I didn't note the direction, and advising me that I should slow down to 15mph out loud.
1 1 1 3
23 2 3 Yes, the warning was issued and the gas pedal disengaged, and the warning light indicated the direction of the curve, but not of the initial curve.
1 1 1 3
24 1 2 Yeah, I saw, actually I saw the speed limit for that curve, not only was the voice like last time, but also saw it on the flashing light. The first time I saw the flashing light I was like, whoa.
1 1 1 3
24 2 1 Uh, not in particular, other than the flashing light that was flashing in front of me, and the curve. We turned around. Uh, did the air conditioner come on? I wasn't noticing anything. Yes, noticed the flashing light in front of me. No, didn't notice anything else besides the flashing light. Well, the voice.
1 1
170

Appendix X: Stimulus Comprehension Interview Participant Comments and SC Score (cont’d)
# Stimulus Run Comments Noticed
WarningID all
components correctly
ID proper response
action
SC Score
Parti-cipant Num-
ber
1=A.V., 2=H.A.V.
Number of run down road
Participant comments recorded during interview
25 1 1 No. No, not particularly. (about questionnaire, "By the warning, they're referring to the light and the voice, right?")
1 1 2
25 2 2 The light inside with the curve on it. (Anything else?) No. 1 126 1 3 Well, the light came on and said there was a curve ahead. I was familiar with
the road by this time, so I expected that curve ahead. And I'm assuming putting it in the third is what set off that alarm signal. That's about it, and the light on the dash board going off and saying, you know, that there was a curve ahead.
1 1 1 3
26 2 1 Well this light flashed on and said 15 mph, and it scared the wits out of me when it first came on. But that's it, and I slowed down and made the turn. I was mainly watching the road because it was really hard to see in that curve.
1 1 2
27 1 2 The light flashed that there was a curve. And I think the speed did say 15 mph. It meant slow down.
1 1 1 3
27 2 3 The light came on, arrow to the left and 15mph. I guess I was a little more prepared for it. And what I noticed, this is a blind spot here. This is blinding out when you turn the curve. The mirror and this. I guess I was expecting it to come on, it didn't frighten me as much as it did when you're not expecting it.
1 1 2
28 1 3 A voice came on, and a light flashed, and it didn't startle me so much because I'd heard it once before. It didn't seem as loud as the first time. It may be because I was kind of expecting it, you know.
1 1 2
28 2 2 Yes, the speaker came on and the light flashed and it said sharp curve, slow down to 15mph. Well, just that there was a sharp curve there.
1 1 2
29 1 1 Yeah, um, the voice came on and said 15mph, well that startled me. It was a very sharp turn. Other than that, no (very staticky, hard to hear)
1 1 1 3
29 2 3 The warning was not as startling. It said 15. Took me longer to get down to 15 the first time, but this time I knew what to do.
1 1 2
30 1 2 The light, the orange light started blinking in the front. And I heard the announcement that we were approaching the sharp curve.
1 1 1 3
30 2 1 Yeah, I noticed that the car slowed down very quickly. And, um, it was an abrupt change in the curve in the road. It came up quickly. A light blinking. And I heard the clicking of the vehicle when it slowed down.
1 1
31 1 1 Did I notice anything? Outside, inside? Inside, when it came on and told me about the curve? Slow down, 15mph. It meant slow down! Ha, be careful.
1 1 2
31 2 2 That scares you! It startles you when it comes onbut if I had it in my own car I would know it's there - I don't think it would be as startling.
1 1
32 1 3 It startled me again. The flashing light. And the voice of course, at the same time.
1 1 2
32 2 1 I'm not sure what I was supposed to be looking for. When they said slow down, ahah, that really caught my attention. It was just, you know, this, somebody saying slow down and the light came on.
1 1
33 1 2 Yeah, there was something up here blinking that said 15mph. And there was a voice that said something about 15mph. It kickstarted my heart when it came on.
1 1 2
171

Appendix X: Stimulus Comprehension Interview Participant Comments and SC Score (cont’d)
# Stimulus Run Comments Noticed
WarningID all
components correctly
ID proper response
action
SC Score
Parti-cipant Num-
ber
1=A.V., 2=H.A.V.
Number of run down road
Participant comments recorded during interview
33 2 3 There was a flashing light and arrow with 15. That one was less annoying and frightening.
1 1
34 1 3 Well I noticed that the warning came on. It seemed more pleasant than the last one. Not quite as loud.
1 1
34 2 2 Oh, that thing that came on! I noticed it all right! Well, there's a light with something written in it but I don't know what. And it said slow to 15, so I did. It scared me.
1 1
35 1 1 In the vehicle? Not really. A flash, ok, Just that it was a light of some sort. That's all. And then I realized it was a curve. The cones were there.
1 1 2
35 2 3 The voice, was different, course I was more aware of the reflectors. I did see a light somewhere.
1 1
36 1 2 Well, we had the warning again. The dash lighting up and telling me that there was a sharp curve ahead, that's about it I guess. It was a kind of loud sound, I can't describe what it was. I was concentrating again too much I guess.
1 1 1 3
36 2 1 Must not have been paying attention. No, I guess I wasn't paying attention. I was being so careful of the road that I wasn't paying attention to anything in here. No. Yes, I did notice a flash and voice and it meant I should be alert.
1 1 2
37 1 1 That it would stay one speed all the way through. Once I got it up to 55, or 54 I think it was, it would stay that all the way through down. That was the main thing I noticed. The road seemed rougher. Yeah, the flashing light, am I supposed to obey it or you? Well it came on and said to slow down to 15. I noticed I was coming into a curve so I slowed down. It told me to slow down to 15.
1 1 2
37 2 2 When it came on I knew to slow down that time, and to come around reasonable, and it gave me enough time to slow down to maneuver properly. The flashing thing about the curve and the speed. I didn't notice anything else. It did have a speed limit in there. (when asked abou the haptic said) Yes, I did notice that.
1 1 2
38 1 3 Other than the sign that had me slow down? (anything else?) Nope. 1 138 2 1 What I noticed? Not a whole lot other than the road, than the road markers and
the lane markers. Well, yeah, it gave me a signal that it was going to be a slight left turn and to slow down to 15mph.
1 1 2
39 1 2 Yeah, I mean I got the notice that it was a curve ahead which was good. I really liked that, it scared me the first time, I wasn't expecting it. It was pretty abrupt going 55 with the low beams on. So that would be good. Yeah, I saw the flashing light which showed which way the curve was too the left. I don't know whether it first flashed to the right or not, I didn't notice that, but actually the curve first went to the right and then.
1 1 1 3
39 2 3 Well yeah, I think it actually warned me earlier. Because I reacted I Think about the same rate, but it seemed to have more time to get ready for the curve. Yeah, I haven't been able to tell whether this is always the same, always points left or not, I'm too busy to notice, I see a blinking but I'm too busy to look at it until I get it slowed down and into the curve. I don't even remember what the words said either, except slow down there's a curve ahead, but I don't know whether they said right or left. I think the visual workload is pretty high, so you really depend on the audio, or maybe it would be nice if it were a heads up or something, I don't know if that would distract from driving. It would be nice to know which way the curve was. I don't know if the audio message said that. Did notice haptic - took foot off right away, but didn't know car, so not sure if it registered.
1 1 2
172

Appendix X: Stimulus Comprehension Interview Participant Comments and SC Score (cont’d)
# Stimulus Run Comments Noticed
WarningID all
components correctly
ID proper response
action
SC Score
Parti-cipant Num-
ber
1=A.V., 2=H.A.V.
Number of run down road
Participant comments recorded during interview
40 1 3 Well, it didn't look like the gas pedal kicked out, and it looked like it wasn't as shrill a warning as it was the first time. The first time, maybe because I sort of expeced it the second time, but the first time it really seemed shrill. The second time it seemed more gental. And it looked like it came earlier.
1 1
40 2 2 Well, it looked like the gas pedal kicked up on me just before the sound and the 15mph speed limit thing popped up. And I never expected that, so that was a surprise. Well, it certainly meant that it wanted me to slow down. I think 15mph was probably a little slow, but I'm not sure about where it happened, probably based on the speed I was going and where it happened it was giving me enough time to slow down to get into the curve, but I was hoping that I could have slowed down a little further along before I got into the curve.
1 1 1 3
41 1 1 There was the light coming on up here blinking and the voice. The yellow light said I better slow down, and then it said something about turn to the right, 15mph.
1 1 1 3
41 2 3 Ok, it came on sooner that time, and I guess I understood the message that time, but it may not have been any different. But I guess I was expecting a voice this time and I wasn't before, but it seemed like it came on sooner.
1 1 2
42 1 2 Same thing, the light went on, curve went on, probably about the same distance from the curve. Wasn't as sharp this time. I reacted I think a little better. The first time I was surprised by the yellow light. I was a little more familiar to the curve, and since I knew the curve now, I knew the speed that I wanted to get down to and how to negotiate the curve better. I think that the warning light again was an asset - to me, I'm driving an unfamiliar road, driving at night without too many lights on. I think although you drove me down the same road and I knew the curve was coming again, I'm concentrating on getting it up to 55 in third gear, and getting it up to 55 means I've got to take my eyes off the road slightly to observe the speedometer and makes sure I don't go over 55. When the light went on, curve ahead, lower your speed, safely negotiate the road, I didn't have the anxiety I had the first time I heard it. Much lower level of anxiety. Once again, if I had this kind of device on my own car, on an area in which the road was unfamiliar to me, and it could tell me that a curve was ahead a
1 1 1 3
42 2 1 When the light went on and asked me to slow down for the sharp curve? A yellow light went on and I think it said slow down. Verbally it said, 'sharp curve ahead, slow down to 15mph' to in effect negotiate the curve safely. I was surprised, I didn't know whether I was going to have that kind of surprise. Testing for reaction time obviously, I imagine that was a reaction time test. The car handled well. No problem. I was watching the light when I would have seen the curve. ON a dark country road, I would not be doing 55 with low beams. I did not find the pushback obvious. Had I felt it, it would have been useful.
1 1 2
173

Appendix X: Stimulus Comprehension Interview Participant Comments and SC Score (cont’d)
# Stimulus Run Comments Noticed
WarningID all
components correctly
ID proper response
action
SC Score
Parti-cipant Num-
ber
1=A.V., 2=H.A.V.
Number of run down road
Participant comments recorded during interview
43 1 1 Yes I did, that thing right there came on and about scared me out of my pants? I saw a thing come on in here that had a curve, had an orange light, and had an arrow pointing to the left. And it said to brake to 15 mph.
1 1 1 3
43 2 2 Yeah, I noticed the light came on and the person said there's a curve up above, reduce your speed to 15mph, and also the acclerator, I guess you might say it cut off. I felt it under my foot, I felt the accelerator cut off. I think it's a good advice, I think that all cars ought to have it.
1 1 1 3
44 1 3 This time I noticed that the flashing light had a left turn arrow and a 15mph speed indicating on it. Well, the audible, the voice telling me slow speed ahead.
1 1 1 3
44 2 1 You mean about the car acceleration? The only thing was the car decelerated on its own. And of course the light came on telling me to slow down to 15. The light was like an orangish light, I forgot what it said. It had writing on it, I was listening to the voice and it told me to slow down. I can't say that I recall anything else.
1 1 1 3
45 1 2 I noticed this indicator saying there's a curve ahead, but I was surprised that the arrow points to the left when in fact this curve turns to the right. I could have turned to the left, haha, but I don't think I was supposed to do that. Well, that was the speed, said 15mph. No, I think it's ...
1 1 1 3
45 2 3 Well, I noticed it seemed like to me the same thing, the warning indicator. I think I responded a little quicker to it. I think the warning works fine, other than the fact the arrow would lead you to believe you turn left here, but I don't think I'm supposed to be doing that. Oh, I heard, of course, I heard the talk that said curve ahead, reduce your speed. The blinking light, the audio was good and clear. I think it works fine.
1 1 2
46 1 3 That time I didn't sense the accelerator backing off. This time, I didn't notice it the first time because I was so annoyed by the light, but this time I saw that there was a 15 in the light. And whether that was there last time or not I don't know. I noticed that as I reached 15 visually, it stopped flashing.
1 1 2
46 2 2 Well, the accelerator released in some way. It pulsed and started to back the gas off, and then a light system started to flash and a voice instructed us to slow for a curve. It meant that that was the warning system kicking in, and I didn't know what it was going to be, and it meant that there was a curve. It didn't tell me which direction it was going to be in, but it warned me of the scenario coming up.
1 1 1 3
47 1 1 Yeah, this signal came on. Haha, caught me as a surprise. I first saw the cones just about the time it said "15mph"
1 1 2
47 2 3 The yellow sign came on, something jumped on the brake pedal! Is that normal? Then I was in the curve by then. There was a reflector that disappeared, I thought there was one up there on the right, I started out from up there, but then it…
1 1
48 1 2 Yeah, it was still a left arrow and a warning for 15mph, except the arrow was a lot smaller. The voice might have been a little, not quite as high.
1 1 1 3
48 2 1 Just now? Well the only thing I noticed I guess was the voice that came on. It was recorded voice which said curve up ahead, and it did have an arrow, a left hand arrow, and it said slow down 15mph. It meant obviously that there was a pretty sharp curve coming up ahead.
1 1 2
174
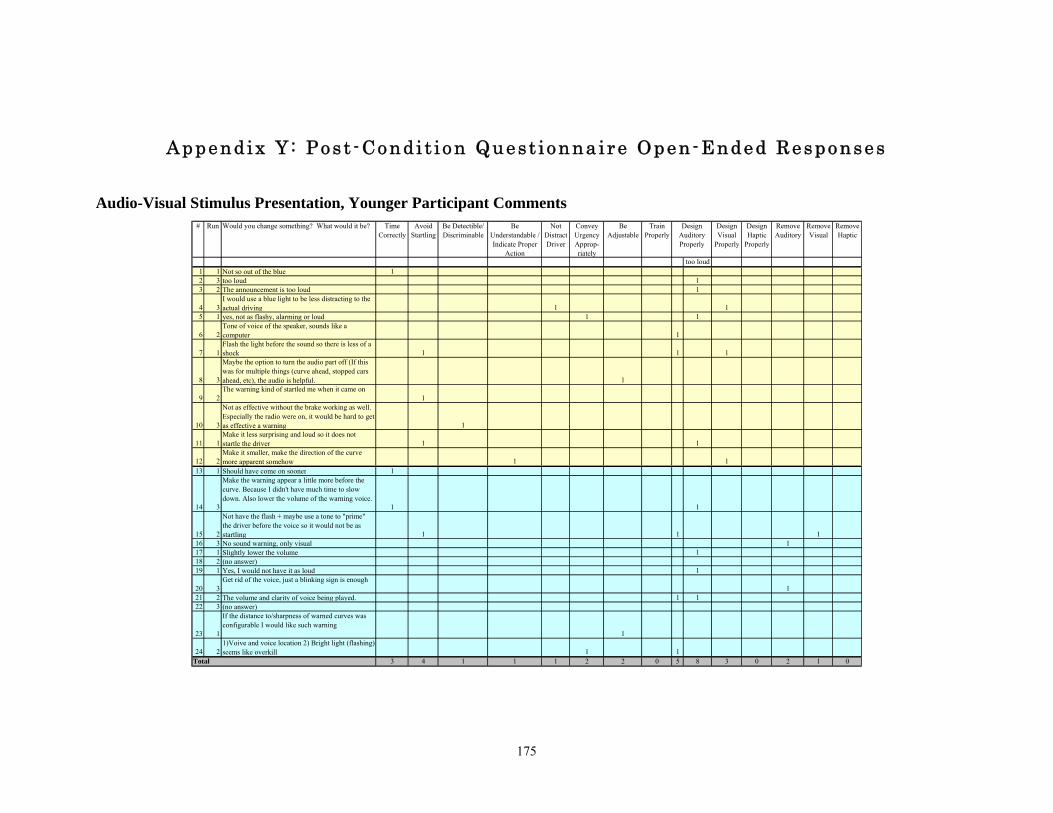
175
# Run Would you change something? What would it be? Time Correctly
Avoid Startling
Be Detectible/ Discriminable
Be Understandable / Indicate Proper
Action
Not Distract Driver
Convey Urgency Approp-riately
Be Adjustable
Train Properly
Design Visual
Properly
Design Haptic
Properly
Remove Auditory
Remove Visual
Remove Haptic
too loud1 1 Not so out of the blue 12 3 too loud 13 2 The announcement is too loud 1
4 3I would use a blue light to be less distracting to the actual driving 1 1
5 1 yes, not as flashy, alarming or loud 1 1
6 2Tone of voice of the speaker, sounds like a computer 1
7 1Flash the light before the sound so there is less of a shock 1 1 1
8 3
Maybe the option to turn the audio part off (If this was for multiple things (curve ahead, stopped cars ahead, etc), the audio is helpful. 1
9 2The warning kind of startled me when it came on
1
10 3
Not as effective without the brake working as well. Especially the radio were on, it would be hard to get as effective a warning 1
11 1Make it less surprising and loud so it does not startle the driver 1 1
12 2Make it smaller, make the direction of the curve more apparent somehow 1 1
13 1 Should have come on sooner 1
14 3
Make the warning appear a little more before the curve. Because I didn't have much time to slow down. Also lower the volume of the warning voice.
1 1
15 2
Not have the flash + maybe use a tone to "prime" the driver before the voice so it would not be as startling 1 1 1
16 3 No sound warning, only visual 117 1 Slightly lower the volume 118 2 (no answer)19 1 Yes, I would not have it as loud 1
20 3Get rid of the voice, just a blinking sign is enough
121 2 The volume and clarity of voice being played. 1 122 3 (no answer)
23 1
If the distance to/sharpness of warned curves was configurable I would like such warning
1
24 21)Voive and voice location 2) Bright light (flashing) seems like overkill 1 1
3 4 1 1 1 2 2 0 5 8 3 0 2 1 0
Design Auditory Properly
Total
Appendix Y : Post -Condi t i on Quest ionnaire Open-Ended Responses
Audio-Visual Stimulus Presentation, Younger Participant Comments
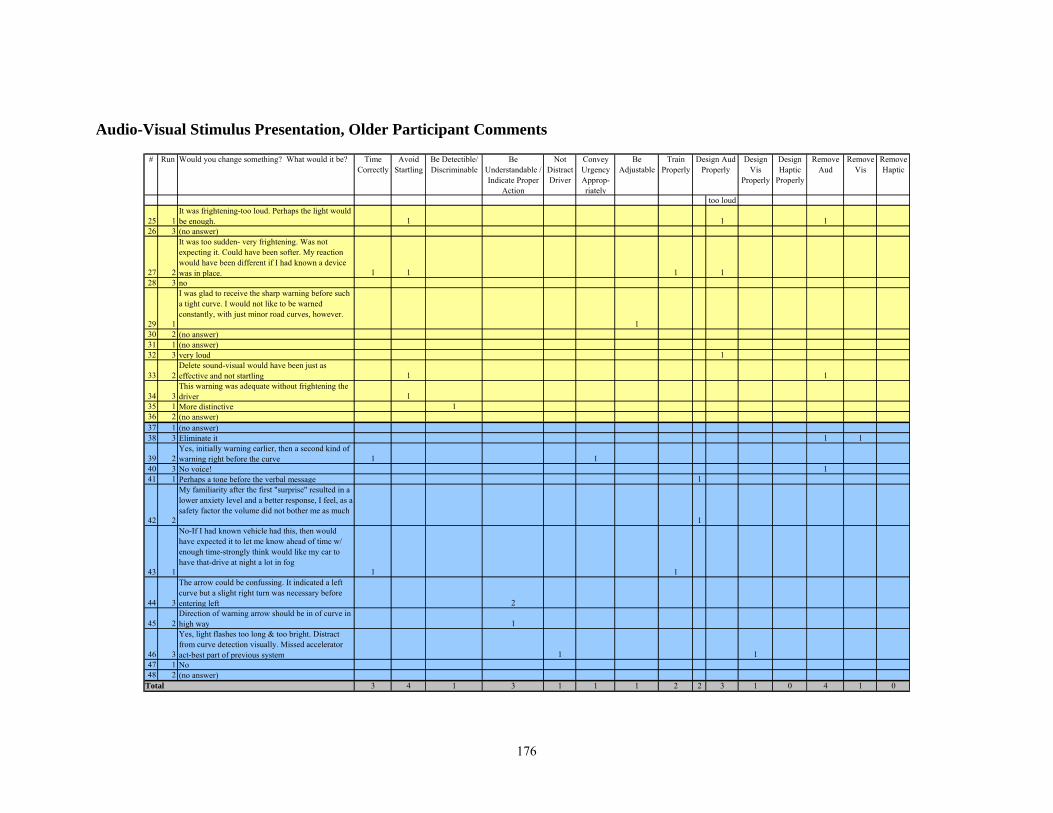
176
# Run Would you change something? What would it be? Time Correctly
Avoid Startling
Be Detectible/ Discriminable
Be Understandable / Indicate Proper
Action
Not Distract Driver
Convey Urgency Approp-riately
Be Adjustable
Train Properly
Design Vis
Properly
Design Haptic
Properly
Remove Aud
Remove Vis
Remove Haptic
too loud
25 1It was frightening-too loud. Perhaps the light would be enough. 1 1 1
26 3 (no answer)
27 2
It was too sudden- very frightening. Was not expecting it. Could have been softer. My reaction would have been different if I had known a device was in place. 1 1 1 1
28 3 no
29 1
I was glad to receive the sharp warning before such a tight curve. I would not like to be warned constantly, with just minor road curves, however.
130 2 (no answer)31 1 (no answer)32 3 very loud 1
33 2Delete sound-visual would have been just as effective and not startling 1 1
34 3This warning was adequate without frightening the driver 1
35 1 More distinctive 136 2 (no answer)37 1 (no answer)38 3 Eliminate it 1 1
39 2Yes, initially warning earlier, then a second kind of warning right before the curve 1 1
40 3 No voice! 141 1 Perhaps a tone before the verbal message 1
42 2
My familiarity after the first "surprise" resulted in a lower anxiety level and a better response, I feel, as a safety factor the volume did not bother me as much
1
43 1
No-If I had known vehicle had this, then would have expected it to let me know ahead of time w/ enough time-strongly think would like my car to have that-drive at night a lot in fog
1 1
44 3
The arrow could be confussing. It indicated a left curve but a slight right turn was necessary before entering left 2
45 2Direction of warning arrow should be in of curve in high way 1
46 3
Yes, light flashes too long & too bright. Distract from curve detection visually. Missed accelerator act-best part of previous system 1 1
47 1 No48 2 (no answer)
3 4 1 3 1 1 1 2 2 3 1 0 4 1 0
Design Aud Properly
Total
Audio-Visual Stimulus Presentation, Older Participant Comments
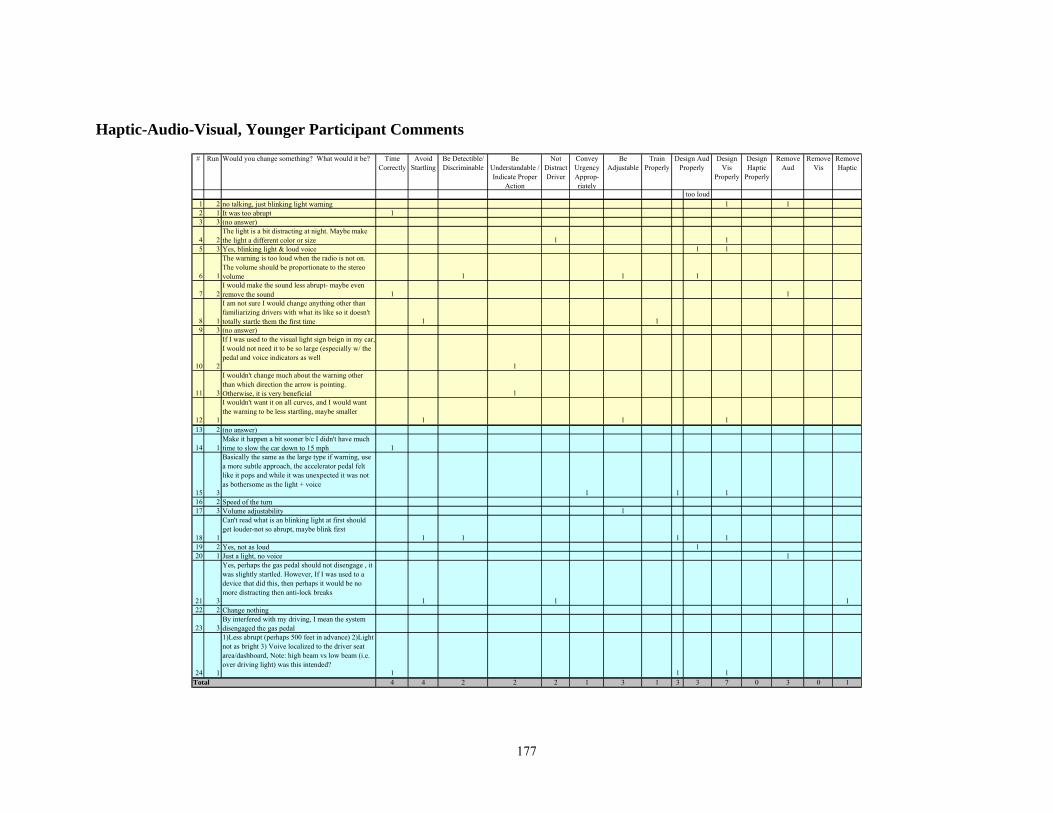
177
# Run Would you change something? What would it be? Time
CorrectlyAvoid
StartlingBe Detectible/ Discriminable
Be Understandable / Indicate Proper
Action
Not Distract Driver
Convey Urgency Approp-riately
Be Adjustable
Train Properly
Design Vis
Properly
Design Haptic
Properly
Remove Aud
Remove Vis
Remove Haptic
too loud1 2 no talking, just blinking light warning 1 12 1 It was too abrupt 13 3 (no answer)
4 2The light is a bit distracting at night. Maybe make the light a different color or size 1 1
5 3 Yes, blinking light & loud voice 1 1
6 1
The warning is too loud when the radio is not on. The volume should be proportionate to the stereo volume 1 1 1
7 2I would make the sound less abrupt- maybe even remove the sound 1 1
8 1
I am not sure I would change anything other than familiarizing drivers with what its like so it doesn't totally startle them the first time 1 1
9 3 (no answer)
10 2
If I was used to the visual light sign beign in my car, I would not need it to be so large (especially w/ the pedal and voice indicators as well
1
11 3
I wouldn't change much about the warning other than which direction the arrow is pointing. Otherwise, it is very beneficial 1
12 1
I wouldn't want it on all curves, and I would want the warning to be less startling, maybe smaller
1 1 113 2 (no answer)
14 1Make it happen a bit sooner b/c I didn't have much time to slow the car down to 15 mph 1
15 3
Basically the same as the large type if warning, use a more subtle approach, the accelerator pedal felt like it pops and while it was unexpected it was not as bothersome as the light + voice
1 1 116 2 Speed of the turn17 3 Volume adjustability 1
18 1
Can't read what is an blinking light at first should get louder-not so abrupt, maybe blink first
1 1 1 119 2 Yes, not as loud 120 1 Just a light, no voice 1
21 3
Yes, perhaps the gas pedal should not disengage , it was slightly startled. However, If I was used to a device that did this, then perhaps it would be no more distracting then anti-lock breaks
1 1 122 2 Change nothing
23 3By interfered with my driving, I mean the system disengaged the gas pedal
24 1
1)Less abrupt (perhaps 500 feet in advance) 2)Light not as bright 3) Voive localized to the driver seat area/dashboard, Note: high beam vs low beam (i.e. over driving light) was this intended?
1 1 14 4 2 2 2 1 3 1 3 3 7 0 3 0 1
Design Aud Properly
Total
Haptic-Audio-Visual, Younger Participant Comments

178
Haptic-Audio-Visual, Older Participant Comments
# Run Would you change something? What would it be? Time Correctly
Avoid Startling
Be Detectible/ Discriminable
Be Understandable / Indicate Proper
Action
Not Distract Driver
Convey Urgency Approp-riately
Be Adjustable
Train Properly
Design Vis
Properly
Design Haptic
Properly
Remove Aud
Remove Vis
Remove Haptic
too loud25 2 Light is ok, but too loud 1
26 1
Found it distracting, but it were more familiar, maybe wouldn't be as distracting may have noticed pedal-said yeah, didn't feel right 1
27 3Probably just the light w/ the speed limit, no sound.
1 128 2 not so loud 129 3 I reacted in a much more calm manner this time30 1 (no answer)31 2 (no answer)32 1 Not quite so loud 133 3 Sound still anoying but not as startling 1
34 2A warning system not so loud and sudden be better
1 135 3 Maybe a few feet sooner 136 1 (no answer)37 2 no38 1 Less size 1
39 3
More information early about which direction the curve was going (at least the initial direction)
1 140 2 No voice, 15 mph indication only 1 141 3 (no answer)42 1 Slightly lower volume_the flashing was good 143 2 NO
44 1Perhaps a "beep" or audible tone just ahead of verbal warning 1
45 3If a warning system was installedit would show detection of the incoming curve 1
46 2
Get rid of flashing light-continous flashing--light off scale for my point of view-was in way of seeing curve-wanted to say, "stop this crap" voice + pedal were fine 1
47 3 No48 1 Would make the turn arrow smaller 1
3 1 0 4 1 0 0 0 1 5 2 0 2 1 0
Design Aud Properly
Total

Mel inda McElheny Curr i cu lum Vi ta
EDUCATION Virginia Polytechnic Institute and State University Blacsksburg, VA 2002 – 2005 Master of Science, Industrial and Systems Engineering Human Factors Engineering and Ergonomics Cornell University, College of Human Ecology Ithaca, NY 1998 - 2002 Bachelor of Science with Honors, Design and Environmental Analysis, Concentration in Human Factors and Ergonomics
WORK EXPERIENCE Senior Research Specialist
Virginia Tech Transportation Institute Aug 2003-present Center for Automotive Safety Research -Designed usability testing -Developed experimenter protocols -Lead in-vehicle experimenter -Conducted literature reviews -Authored reports -Delivered presentations to colleagues and clients Research Assistant University of Regina, Regina, Saskatchewan, Canada Jun 2002-Aug 2002 Under the direction of Daryl Hepting, Ph.D., Department of Computer Science -Developed computer-aided visualization questionnaire -Produced user-friendly tutorial for Avid® software -Examined eyewitness facial composites techniques Human Factors Intern Naval Air Warfare Center, China Lake, CA Jun 2001-Jun 2002 -Participated in developmental testing of helmet-mounted display as well as other cockpit displays for the F-A/18 program -Secret Clearance status -Surveyed aircrew -Compiled data -Authored official reports to Boeing and NAVAIR
179

Administrative Assistant College of Human Ecology, Cornell University, Ithaca, NY Jan 2001-May 2002 Human Ecology Office of Alumni Affairs and Development -Participated in general office operations -Performed research -Maintained databases -Completed special projects including event planning and publication design Research Assistant Cornell University, Ithaca, NY Jan 2001-Dec 2001 Under the direction of Dr. Gary Evans -Studied effects of living environment on elderly of Tompkins County -Designed criteria -Collected data from over 100 sites -Trained new assistants
AWARDS -2004 Federal Highway Administration Eisenhower
Graduate Transportation Fellowship -2004 American Society of Safety Engineers (ASSE) Deurmier Safety Scholarship -2003 HFES Outstanding Student Chapter Award while serving as Vice President -2002 National Institute of Occupational Safety and Health (NIOSH) Fellowship, year’s tuition and stipend -Cornell University Dean’s List, each semester 1999 to 2002 -Honors program in The College of Human Ecology, Cornell University
ACTIVITIES AND -Active member, past President of the VT American COMMUNITY Society of Safety Engineers SERVICE -Active member, past Vice President of the VT Human Factors and Ergonomics Society
-Member, Virginia Tech Society of Women Engineers -Past President, Cornell Human Factors and Ergonomics Society -Volunteer for the Montgomery County Christmas Store and Blacksburg Food Pantry -Certified in scuba diving, first aid, and CPR
180


![10-1 Lesson 10 Objectives Chapter 4 [1,2,3,6]: Multidimensional discrete ordinates Chapter 4 [1,2,3,6]: Multidimensional discrete ordinates Multidimensional.](https://static.fdocuments.in/doc/165x107/5697bff81a28abf838cbf777/10-1-lesson-10-objectives-chapter-4-1236-multidimensional-discrete-ordinates.jpg)