Multidimensional SAR Data Analysis Based on …...Multidimensional SAR Data Analysis Based on Binary...
6
Multidimensional SAR Data Analysis Based on Binary Partition Trees and the Covariance Matrix Geometry Alberto Alonso-Gonz´ alez Carlos L´ opez-Mart´ ınez Philippe Salembier Signal Theory and Comms. Dept. (TSC) Universitat Polit` ecnica de Catalunya (UPC) Barcelona, Spain Email: {carlos.lopez,alberto.alonso,philippe} @tsc.upc.edu Silvia Valero CESBIO - CNES CNRS (UMR 5126), IRD Universite de Toulouse, France Email: [email protected] Jocelyn Chanussot Grenoble Institute of Technology Grenoble Images sPeech Signals and Automatics Lab (GIPSA-Lab) Grenoble, France Email: jocelyn.chanussot @gipsa-lab.grenoble-inp.fr Abstract—In this paper, we propose the use of the Binary Partition Tree (BPT) as a region-based and multi-scale image representation to process multidimensional SAR data, with spe- cial emphasis on polarimetric SAR data. We also show that this approach could be extended to other types of remote sensing imaging technologies, such as hyperspatial imagery. The Binary Partition Tree contains a lot of information about the image structure at different detail levels. At the same time, this structure represents a convenient vehicle to exploit both the statistical properties, as well as the geometric properties of the multidimensional SAR data given by the covariance matrix. The BPT construction process and its exploitation for PolSAR and temporal data information estimation is analyzed in this work. In particular, this work focuses on the speckle noise filtering problem and the temporal characterization of the image dynamics. Results with real data are presented to illustrate the capabilities of the BPT processing approach, specially to maintain the spatial resolution and the small details of the image. Keywords—SAR, PolSAR, speckle filtering, Binary Partition Tree. I. I NTRODUCTION Polarimetric SAR (PolSAR) and multitemporal SAR data have demonstrated their significance for the analysis and the characterization of the Earth surface, as well as for the quantitative retrieval of biophysical and geophysical parame- ters. A set of complex radar scattered echoes are coherently processed in order to achieve high spatial resolution. As a consequence of this coherent processing and the fact that each resolution cell is a combination of a certain number of elementary echoes, the received signal is affected by the speckle term. Despite speckle is determined by the scattering process itself, its complexity makes it necessary to consider it from a stochastic point of view and then, to assume the speckle term as a noise component. The speckle is a handicap in SAR imagery processing and consequently some speckle filtering process is needed. Under the assumption that multidimensional SAR data are distributed according to the zero-mean, complex Gaussian distribution, the objective of this filtering process is to obtain, i.e., to estimate the covariance matrix characterizing the multidimensional data. Multidimensional SAR data are non stationary as they reflect the complexity of the environment. Assuming that all the stochastic processes involved in the filtering process are ergodic, multidimensional SAR data filters must adapt to this non stationarity [1], as well as to the geometry of the covari- ance matrix. Most recent state-of-the-art filtering techniques [2], [3] are based on this approach, tending to define a different homogeneity neighbourhood for each image pixel. In this paper, we propose to tackle this issue by relying on an image region-based multi-scale representation by means of a Binary Partition Tree (BPT) [4] and to perform the image processing, in terms of filtering or segmentation tasks, directly by pruning the BPT. Since the BPT operates in the space defined by the covariance matrix, this processing approach may take into account the matrix geometry by defining a proper metric. In this work, we focus into two central applications: PolSAR data speckle filtering and the temporal characterization of temporal series of PolSAR data. Finally, we also demonstrate that this approach can be also applied in the case of hyperspectral data. II. STATISTICAL CHARACTERIZATION OF MULTIDIMENSIONAL SAR DATA A multidimensional SAR system records a set of m SAR images, represented by the target vector k =[S 1 ,S 2 ,...,S m ] T (1) where S k , for k =1, 2,...,m, represents each one of the complex SAR images and T denotes the vector transposition. The gain which can be achieved by a multidimensional SAR system, respect to a one-dimensional one, results from the fact that the same scattering mechanism is sampled m times under some type of diversity. One of the best examples of multi- dimensional SAR data corresponds to PolSAR data, where the diversity is achieved by changing the polarization of the transmitted field and the receiving antenna. Another example of multidimensional SAR data is the acquisition of temporal series of data over the same ares of observation. As it may be 2014 International Radar Conference 978-1-4799-4195-7/14/$31.00©2014IEEE 1
Transcript of Multidimensional SAR Data Analysis Based on …...Multidimensional SAR Data Analysis Based on Binary...
Multidimensional SAR Data Analysis Based onBinary Partition Trees and the Covariance Matrix
Geometry
Alberto Alonso-GonzalezCarlos Lopez-Martınez
Philippe SalembierSignal Theory and Comms. Dept. (TSC)
Universitat Politecnica de Catalunya (UPC)Barcelona, Spain
Email: carlos.lopez,alberto.alonso,[email protected]
Silvia ValeroCESBIO - CNES
CNRS (UMR 5126), IRDUniversite de Toulouse, France
Email: [email protected]
Jocelyn ChanussotGrenoble Institute of Technology
Grenoble Images sPeechSignals and Automatics Lab (GIPSA-Lab)
Grenoble, FranceEmail: jocelyn.chanussot
@gipsa-lab.grenoble-inp.fr
Abstract—In this paper, we propose the use of the BinaryPartition Tree (BPT) as a region-based and multi-scale imagerepresentation to process multidimensional SAR data, with spe-cial emphasis on polarimetric SAR data. We also show thatthis approach could be extended to other types of remotesensing imaging technologies, such as hyperspatial imagery. TheBinary Partition Tree contains a lot of information about theimage structure at different detail levels. At the same time, thisstructure represents a convenient vehicle to exploit both thestatistical properties, as well as the geometric properties of themultidimensional SAR data given by the covariance matrix. TheBPT construction process and its exploitation for PolSAR andtemporal data information estimation is analyzed in this work. Inparticular, this work focuses on the speckle noise filtering problemand the temporal characterization of the image dynamics. Resultswith real data are presented to illustrate the capabilities ofthe BPT processing approach, specially to maintain the spatialresolution and the small details of the image.
Keywords—SAR, PolSAR, speckle filtering, Binary PartitionTree.
I. INTRODUCTION
Polarimetric SAR (PolSAR) and multitemporal SAR datahave demonstrated their significance for the analysis andthe characterization of the Earth surface, as well as for thequantitative retrieval of biophysical and geophysical parame-ters. A set of complex radar scattered echoes are coherentlyprocessed in order to achieve high spatial resolution. As aconsequence of this coherent processing and the fact thateach resolution cell is a combination of a certain numberof elementary echoes, the received signal is affected by thespeckle term. Despite speckle is determined by the scatteringprocess itself, its complexity makes it necessary to consider itfrom a stochastic point of view and then, to assume the speckleterm as a noise component. The speckle is a handicap in SARimagery processing and consequently some speckle filteringprocess is needed. Under the assumption that multidimensionalSAR data are distributed according to the zero-mean, complexGaussian distribution, the objective of this filtering process is
to obtain, i.e., to estimate the covariance matrix characterizingthe multidimensional data.
Multidimensional SAR data are non stationary as theyreflect the complexity of the environment. Assuming that allthe stochastic processes involved in the filtering process areergodic, multidimensional SAR data filters must adapt to thisnon stationarity [1], as well as to the geometry of the covari-ance matrix. Most recent state-of-the-art filtering techniques[2], [3] are based on this approach, tending to define a differenthomogeneity neighbourhood for each image pixel. In thispaper, we propose to tackle this issue by relying on an imageregion-based multi-scale representation by means of a BinaryPartition Tree (BPT) [4] and to perform the image processing,in terms of filtering or segmentation tasks, directly by pruningthe BPT. Since the BPT operates in the space defined bythe covariance matrix, this processing approach may take intoaccount the matrix geometry by defining a proper metric. Inthis work, we focus into two central applications: PolSAR dataspeckle filtering and the temporal characterization of temporalseries of PolSAR data. Finally, we also demonstrate that thisapproach can be also applied in the case of hyperspectral data.
II. STATISTICAL CHARACTERIZATION OFMULTIDIMENSIONAL SAR DATA
A multidimensional SAR system records a set of m SARimages, represented by the target vector
k = [S1, S2, . . . , Sm]T (1)
where Sk, for k = 1, 2, . . . ,m, represents each one of thecomplex SAR images and T denotes the vector transposition.The gain which can be achieved by a multidimensional SARsystem, respect to a one-dimensional one, results from the factthat the same scattering mechanism is sampled m times undersome type of diversity. One of the best examples of multi-dimensional SAR data corresponds to PolSAR data, wherethe diversity is achieved by changing the polarization of thetransmitted field and the receiving antenna. Another exampleof multidimensional SAR data is the acquisition of temporalseries of data over the same ares of observation. As it may be
2014 International Radar Conference
978-1-4799-4195-7/14/$31.00©2014IEEE 1

observed, both sources of diversity may be combined together.Most of the PolSAR systems alternate between horizontaland vertical polarization states. Under the hypothesis that thedifferent SAR images are able to be described by means ofzero-mean, complex, Gaussian distributions, the target vectork has the following distribution
pk(k) =1
πm|C|exp(−kHC−1k) (2)
where H refers to the transpose complex conjugation and C isthe positive definite, Hermitian covariance matrix
C = EkkH
=
ES1S
∗1 ES1S
∗2 · · · ES1S
∗m
ES2S∗1 ES2S
∗2 · · · ES2S
∗m
......
. . ....
ESmS∗1 ESmS
∗2 · · · ESmS
∗m
. (3)
Since Ek = 0, the information of interest about the areailluminated by the radar is contained in the matrix C. Hence,this matrix needs to be estimated from the original data (1). Asobserved in (3), the information is not only contained in theSAR images intensities, but also on the correlation structuregiven by the off-diagonal complex elements of (3).
The process to estimate C is referred to as the multidimen-sional speckle reduction process. The estimation is performedfrom the so-called one-look, sample covariance matrix Z.The most standard approach to estimate C is the multilooktechnique
Zn =1
n
n∑i=1
Zi =1
n
n∑i=1
kikHi (4)
where Zi and ki correspond, respectively, to the single-looksample covariance matrix and the target vector of the i-th pixel,out of n, employed to estimate C from the total number ofsamples n. The main drawback of (4) is that C is estimated atthe expense of spatial resolution and spatial details. In order toovercome this problem, other approaches have been presentedin the literature to estimate C. Considering (4), and under thehypothesis that n > m, the matrix Zn is described by meansof a Wishart distribution W(C, n) [5][6]
pZ(Z) =n3n|Z|n−3
|C|nπ3∏3
i=1 Γ(n− i+ 1)etr(−nC−1Z) (5)
where etr(X) is the exponential of the matrix trace and n ≥ 3.
III. BINARY PARTITION TREE
The Binary Partition Tree (BPT) was introduced in [4]as a region-based and multi-scale image representation. Itcontains information of the image structure at different detaillevels within a tree. In this hierarchical structure, each noderepresents a connected region of the image. The tree leavesrepresent single pixels and all the other nodes represent theregion composed by merging its two child nodes. Finally, theroot node represents the whole image. Thus, the tree edgesdescribe the inclusion relationship between nodes. Betweenthe leafs and the root there are a wide number of nodesrepresenting image regions with different detail level. Thismulti-scale representation contains a lot of useful information
about the image structure that can be exploited for differentapplications.
In order to be able to exploit the information providedby the Wishart distribution in (5), one must account forthe limitation that n ≥ 3. When the covariance matrix isconstructed in a pixel basis, as the hermitian product kikH
i ,the resulting matrix is of rank one which prevents the use ofthe Wishart distributuon. In order to solve it, the covariancematrices at pixel level need to be regularized to assure rankthree matrices. This regularization may be obtained by meansof a 3/times3 multilook filter. In order to reduce the loss ofspatial resolution, a bilateral filter may be also considered [7].
To construct the BPT representation from an image, aniterative algorithm is employed in a bottom-up approach [4].In the initial state, every pixel of the image becomes a one-pixel region. At every step, the two most similar regions aremerged and this process is repeated until the root of the tree,containing the whole image, is generated. In order to applythis algorithm, two important concepts need to be determined[8]:
1) A region model: Traditionally, under the complexGaussian model, the estimated covariance matrixZ is employed to measure the region polarimetricinformation, see (4). Additionally, since during theBPT construction process regions of different sizescoexist, the region size information should be takeninto account and will be included in the region model.
2) A similarity measure on the region model spaceto compare two neighboring regions d(X,Y ). Twotypes of measures will be analyzed in this work.On the one hand measures based on the statisticaldistribution and on the other hand measures based onthe covariance matrix subspace geometry.The revised Wishart measure [9] dw is based ona statistical test assuming Wishart distributions andthat one region statistics are known. However, sincethis measure is not symmetric, a modified symmetricversion will be applied
dsw(X,Y ) =(tr(Z−1
X ZY ) + tr(Z−1Y ZX)
)·
·(nx + ny) (6)
where tr(.) represents the matrix trace, ZX and ZY
represent the estimated covariance matrices for re-gions X and Y , respectively, and nx and ny representtheir number of pixels.For comparison purposes a new version of the sym-metric revised Wishart dissimilarity will be used, onlytaking into account the diagonal elements of the Zmatrix and assuming all off-diagonal values equal tozero
ddw(X,Y ) =
(3∑
i=1
(ZX
2ii + ZY
2ii
ZXiiZY ii
))· (nx + ny)
(7)where ZXij and ZY ij represent the (i,j)-th elementof the estimated covariance matrices ZX and ZY ,respectively. It is interesting to note that since thisdistance only considers the information provided onlyby the diagonal elements of the covariance matrix,that is, by construction it assumes diagonal matrices
2014 International Radar Conference
978-1-4799-4195-7/14/$31.00©2014IEEE 2
of rank three, an initial regularization process is notnecessary.Another family of dissimilarities that is analyzed arebased on the positive definite matrix cone geometry[10]
dsg(X,Y ) = ‖log(Z
−1/2X ZY Z
−1/2X
)‖F +
+ln
(2nxnynx + ny
)(8)
where ‖.‖F represents the Frobenius matrix norm,log(.) represents the matrix logarithm and ln(.) rep-resents the natural logarithm.As for the Wishart dissimilarities, a new version isdefined employing only the information contained inthe diagonal elements of the covariance matrix
ddg(X,Y ) =
√√√√ 3∑i=1
ln2(ZXii
ZY ii
)+ ln
(2nxnynx + ny
)(9)
Again in this case, no initial regularization is needed as thethe distance, by constructions, assumes ranks three matrices.
IV. BPT PRUNING
The BPT is a hierarchical representation of the imagestructure at different details levels. Thus, it depends onlyon the image and consequently it is application independent.One possible approach to develop BPT-based applications isto select a set of meaningful regions within the tree. Asmentioned in [4], an image segmentation could be obtainedby tree pruning.
The BPT punning process policy depends of the final appli-cation. For the PolSAR speckle noise filtering application, themain objective is to obtain the biggest possible homogeneousregions of the image. The BPT and its multi-scale nature canbe exploited for this application. Then, an homogeneity-basedtree pruning can be performed. A region homogeneity measureφ has to be defined to be able to define a pruning process. In[11], the following criterion based on the Frobenius matrixnorm is proposed
φR(X) =1
nx
nx∑i=1
‖Xi − ZX‖2F‖ZX‖2F
(10)
where Xi is the estimated covariance matrix for the i-th pixelwithin region X .
Note that this measure depends on all the pixel valueswithin the X region and not only on its model, as thedissimilarity measure. Additionally, φR is independent of theregion size, since it is an average over all the region pixels.This is an important property of the homogeneity measure inorder to define the region homogeneity independently of itssize. The measure (10) can be seen as the mean informationloss when modeling all the pixels within a region with itsestimated covariance matrix. Finally, to determine if a region ishomogeneous or not, a maximum value δp for the homogeneitymeasure has to be defined, called pruning threshold. Then, thenodes of the tree are scanned from the top to the leaves and thepunning is done at the first node, that represents the region Xi,
having φR(Xi) < δp. Consequently, this punning selects thebiggest homogeneous regions from the tree. In this paper δpwill be expressed in dB scale, corresponding to 10 · log10(φR).
V. POLSAR SPECKLE FILTERING RESULTS
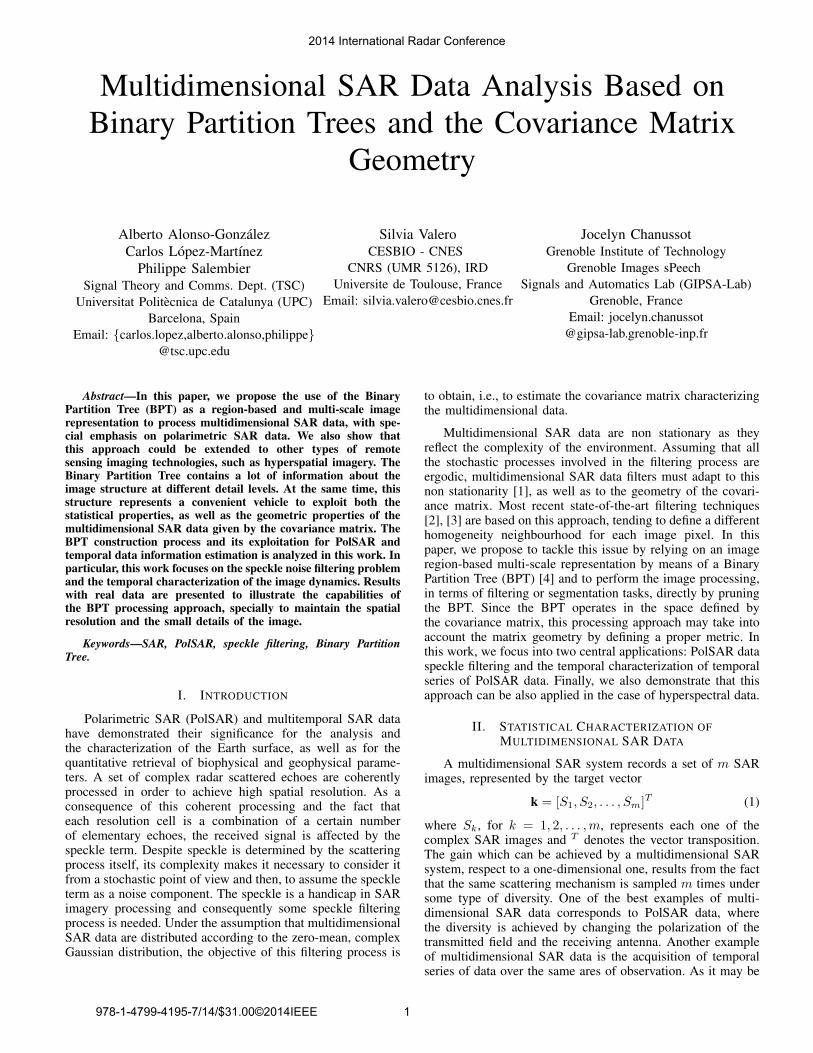
The described homogeneity based BPT pruning for Pol-SAR speckle noise filtering has been tested with a real PolSARdataset. Fig. 1 shows the image corresponding to PolSARdata that was acquired in a measurement campaign conductedby the DLR in 1999 with its experimental SAR system, E-SAR, over the Oberpfaffenhofen test-site, southern Germany.Data were collected at L-band, with a spatial resolution of1.5m× 1.5m in fully linear polarimetric mode.
Fig. 1: Pauli RGB (R: Double bounce, G: Volume, B: Singlebounce) coding of the original E-SAR image.
On Fig. 5, different pruning results are shown over the sameBPT constructed with the dsw dissimilarity (6). Increasing thepruning threshold δp results into bigger regions of the prunedtree, as less homogeneous regions are accepted.
It is worth to notice that in the same image there are regionswith very different sizes. Large homogeneous areas, as theagricultural fields in the left part of the image, whereas pointscatterers or details from the urban area in the center of theimage are preserved as very small regions.
A 512x512 pixels area of the original data is selected tosee a more detailed view of the results. The 7x7 multilookis shown in Fig. 3b for comparison purposes. In Figs. 3c-3f different results are shown corresponding to the sametree pruning process over different BPTs constructed withthe different similarity measures proposed in the previoussection. If compared with the 7x7 multilook, the BPT basedfiltering preserves much better original image spatial resolutionand spatial details. Comparing the results obtained with thedifferent similarity measures presented in the previous sectionone may observe that there are very subtle differences betweenthe results. This similarity of results allows to demonstratethat the BPT representation tool is very robust respect tothe similarity measure employed for the BPT constructionprocess. In addition, is is important to notice that the coloursof the regions, which depends on the physical scatteringprocess, does not change respect to the original image. Thismaintenance of the physical information indicates that a partof the robustness, the BPT representation approach does notdegrades the physical information content of the data.
2014 International Radar Conference
978-1-4799-4195-7/14/$31.00©2014IEEE 3

(a) δp = −2dB
(b) δp = −1dB
(c) δp = 0dB
Fig. 2: Pauli RGB (R: Double bounce, G: Volume, B: Singlebounce) processed images.
VI. TEMPORAL INFORMATION ESTIMATION
In the previous sections, the BPT has been employedto represent PolSAR data for a single temporal acquisition.Nevertheless, a SAR system can also image the same area ofobservation at different times, being able to provide a temporalseries of data. Every single acquisition may contain m complexSAR images, see (1), so each of the acquisitions can alsopresent polarimetric diversity. Consequently, if we considerPolSAR data, the incorporation of temporal diversity adds anadditional dimension to every pixel consisting on time.
In the previous scenario of increased dimensionality, theBPT can be also considered as a tool to represent the data ina hierarchical structure. Nevertheless, the regions will be no
(a) Original (b) 7x7 multilook
(c) ddw, δp = −1dB (d) dsw, δp = −1dB
(e) ddg , δp = −1dB (f) dsg , δp = −1dB
Fig. 3: Detail Pauli RGB (R: Double bounce, G: Volume,B: Single bounce) original and BPT processed images withδp = −1dB over different trees constructed employing varioussimilarity criteria.
longer two dimensional spatial regions, but three dimensionalspace-time regions. Consequently, it is necessary to adapt theBPT structure to include the temporal dimension informationby adapting: the region model, the similarity measure and thehomogeneity criteria. Regarding the region model, there exittwo options to include temporal information.
A first option to include temporal information is to maintainthe regions models as the 3x3 estimated covariance matrixZ [12].Thus, the temporal dimension represents an additionaldata dimension. Hence, the BPT contains connected regionsof the data in the space-time domain having similar estimatedcovariance matrix Z. A second approach that may be con-sidered is to consider the time information within the regionmodel. This different point of view allows to assume thevariation of the polarimetric information, i.e., the temporal
2014 International Radar Conference
978-1-4799-4195-7/14/$31.00©2014IEEE 4
signature of the target, as an intrinsic characteristic or propertyof the target itself. In order to include the time informationin the characterization of the target results in the augmentedcovariance matrix ZN
ZN =
Z11 Ω12 · · · Ω1N
ΩH12 Z22 · · · Ω2N
......
. . ....
ΩH1N ΩH
2N · · · ZNN
(11)
where N represents the number of temporal acquisitions, Zii
is a 3 by 3 covariance matrix representing the polarimetricinformation of the i-th acquisition and Ωij is a 3 by 3complex matrix representing the interferometric informationamong the acquisitions i and j. This approach generates a treecontaining spatial connected regions of the data set and willproduce region contours constant along time. In conclusion, byassuming this extended model a node will represent a groupof pixels presenting similar temporal evolution.
In order to adapt the different distances to consider theregion model introduced in (11), we propose to consideronly the information provided by the polarimetric covariancematrices Zii. We do not consider the information providedby the off-diagonal matrices Zij as this matrices containinterferometric information that may produce irregular regionsnot adapted tho the signal spatial morphology. In the case ofthe geodesic distance proposed in (8), the extension is assumedas
dg(X,Y ) =N∑i=1
dsg(ZXii,ZYii
). (12)
Finally, the homogeneity criteria presented in (10) can bealso consider temporal information by assuming the previousextension of the similarity criteria, i.e.,
φM (X) =1
nx
nx∑i=1
∑Nj=1 ‖Zi
jj − ZXjj‖2F∑N
j=1 ‖ZXjj‖2F
< δp. (13)
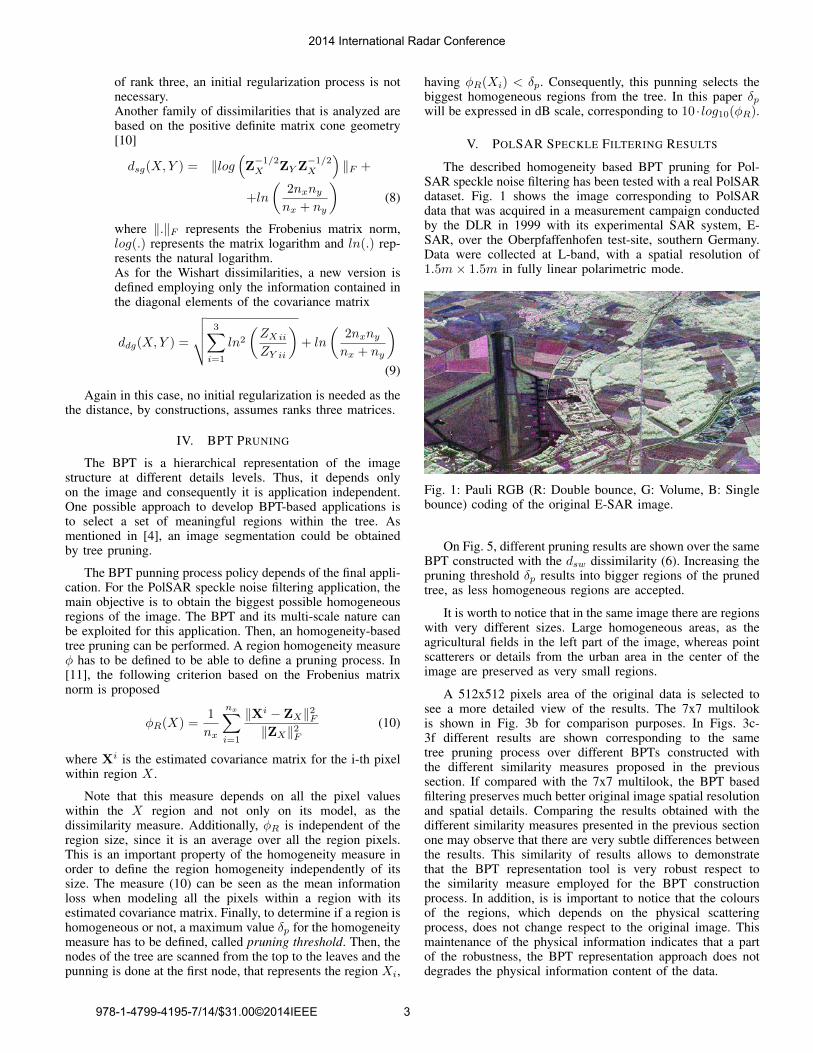
To demonstrate the validity of this extension, a RADARSAT-2Fine Quad-Pol (FQ13 ascending pass) dataset over Flevoland,the Netherlands is considered. The scene is composed by anarea of agricultural fields with some sea surface and urbanareas. The dataset contains 8 images from April 4th, 2009 toSeptember 29th, 2009 with an acquisition every 24 days, seeFig. 4.
The extension of the BPT into the temporal dimension hasbeen employed to process the previous dataset, see Fig. 4, asit can be observed in Fig.
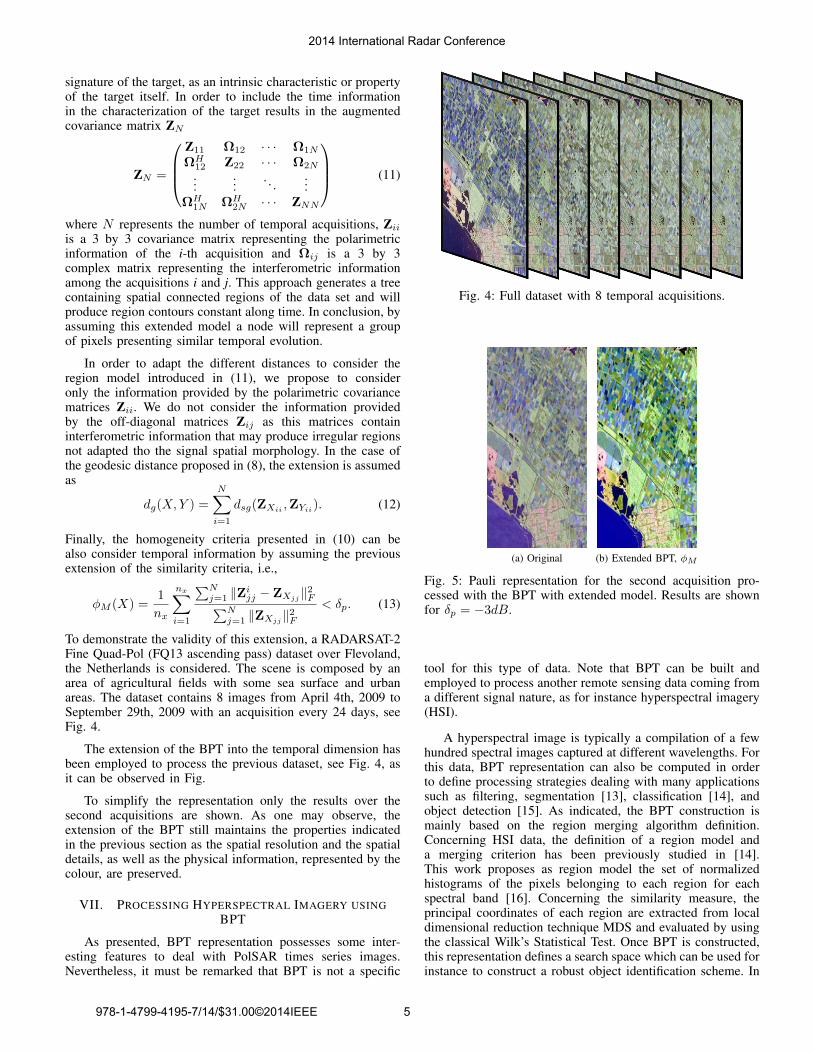
To simplify the representation only the results over thesecond acquisitions are shown. As one may observe, theextension of the BPT still maintains the properties indicatedin the previous section as the spatial resolution and the spatialdetails, as well as the physical information, represented by thecolour, are preserved.
VII. PROCESSING HYPERSPECTRAL IMAGERY USINGBPT
As presented, BPT representation possesses some inter-esting features to deal with PolSAR times series images.Nevertheless, it must be remarked that BPT is not a specific
Fig. 4: Full dataset with 8 temporal acquisitions.
(a) Original (b) Extended BPT, φM
Fig. 5: Pauli representation for the second acquisition pro-cessed with the BPT with extended model. Results are shownfor δp = −3dB.
tool for this type of data. Note that BPT can be built andemployed to process another remote sensing data coming froma different signal nature, as for instance hyperspectral imagery(HSI).
A hyperspectral image is typically a compilation of a fewhundred spectral images captured at different wavelengths. Forthis data, BPT representation can also be computed in orderto define processing strategies dealing with many applicationssuch as filtering, segmentation [13], classification [14], andobject detection [15]. As indicated, the BPT construction ismainly based on the region merging algorithm definition.Concerning HSI data, the definition of a region model anda merging criterion has been previously studied in [14].This work proposes as region model the set of normalizedhistograms of the pixels belonging to each region for eachspectral band [16]. Concerning the similarity measure, theprincipal coordinates of each region are extracted from localdimensional reduction technique MDS and evaluated by usingthe classical Wilk’s Statistical Test. Once BPT is constructed,this representation defines a search space which can be used forinstance to construct a robust object identification scheme. In
2014 International Radar Conference
978-1-4799-4195-7/14/$31.00©2014IEEE 5
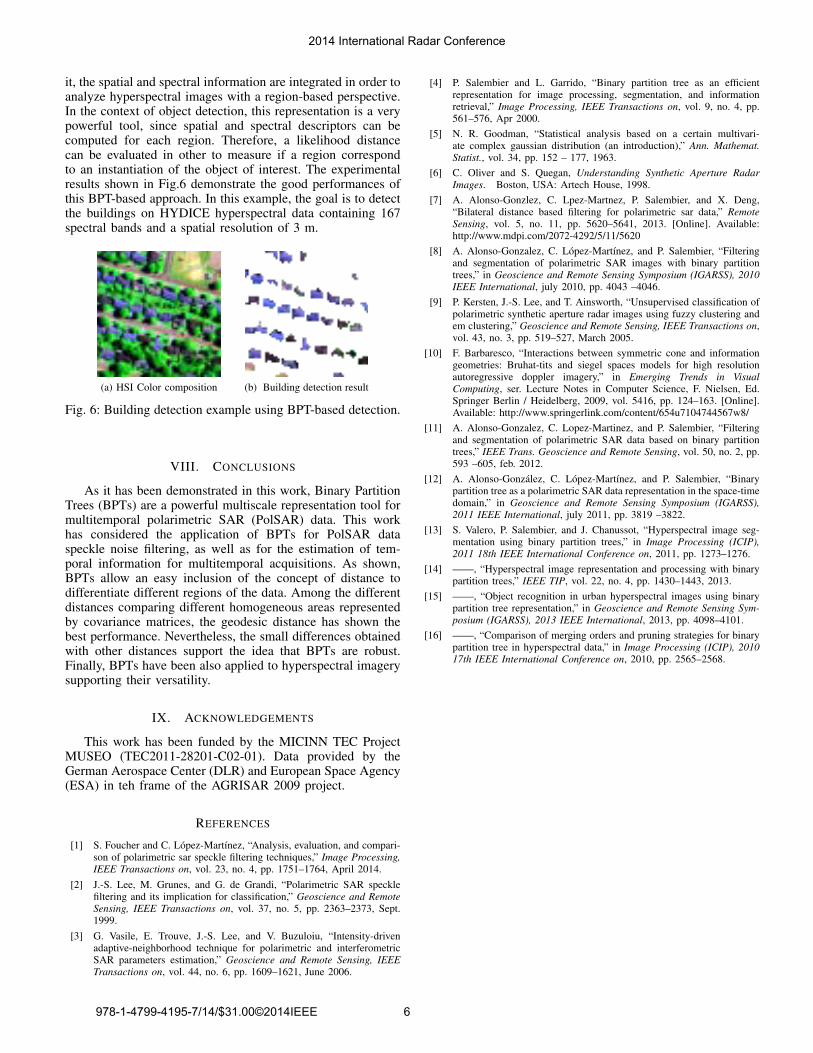
it, the spatial and spectral information are integrated in order toanalyze hyperspectral images with a region-based perspective.In the context of object detection, this representation is a verypowerful tool, since spatial and spectral descriptors can becomputed for each region. Therefore, a likelihood distancecan be evaluated in other to measure if a region correspondto an instantiation of the object of interest. The experimentalresults shown in Fig.6 demonstrate the good performances ofthis BPT-based approach. In this example, the goal is to detectthe buildings on HYDICE hyperspectral data containing 167spectral bands and a spatial resolution of 3 m.
(a) HSI Color composition (b) Building detection result
Fig. 6: Building detection example using BPT-based detection.
VIII. CONCLUSIONS
As it has been demonstrated in this work, Binary PartitionTrees (BPTs) are a powerful multiscale representation tool formultitemporal polarimetric SAR (PolSAR) data. This workhas considered the application of BPTs for PolSAR dataspeckle noise filtering, as well as for the estimation of tem-poral information for multitemporal acquisitions. As shown,BPTs allow an easy inclusion of the concept of distance todifferentiate different regions of the data. Among the differentdistances comparing different homogeneous areas representedby covariance matrices, the geodesic distance has shown thebest performance. Nevertheless, the small differences obtainedwith other distances support the idea that BPTs are robust.Finally, BPTs have been also applied to hyperspectral imagerysupporting their versatility.
IX. ACKNOWLEDGEMENTS
This work has been funded by the MICINN TEC ProjectMUSEO (TEC2011-28201-C02-01). Data provided by theGerman Aerospace Center (DLR) and European Space Agency(ESA) in teh frame of the AGRISAR 2009 project.
REFERENCES
[1] S. Foucher and C. Lopez-Martınez, “Analysis, evaluation, and compari-son of polarimetric sar speckle filtering techniques,” Image Processing,IEEE Transactions on, vol. 23, no. 4, pp. 1751–1764, April 2014.
[2] J.-S. Lee, M. Grunes, and G. de Grandi, “Polarimetric SAR specklefiltering and its implication for classification,” Geoscience and RemoteSensing, IEEE Transactions on, vol. 37, no. 5, pp. 2363–2373, Sept.1999.
[3] G. Vasile, E. Trouve, J.-S. Lee, and V. Buzuloiu, “Intensity-drivenadaptive-neighborhood technique for polarimetric and interferometricSAR parameters estimation,” Geoscience and Remote Sensing, IEEETransactions on, vol. 44, no. 6, pp. 1609–1621, June 2006.
[4] P. Salembier and L. Garrido, “Binary partition tree as an efficientrepresentation for image processing, segmentation, and informationretrieval,” Image Processing, IEEE Transactions on, vol. 9, no. 4, pp.561–576, Apr 2000.
[5] N. R. Goodman, “Statistical analysis based on a certain multivari-ate complex gaussian distribution (an introduction),” Ann. Mathemat.Statist., vol. 34, pp. 152 – 177, 1963.
[6] C. Oliver and S. Quegan, Understanding Synthetic Aperture RadarImages. Boston, USA: Artech House, 1998.
[7] A. Alonso-Gonzlez, C. Lpez-Martnez, P. Salembier, and X. Deng,“Bilateral distance based filtering for polarimetric sar data,” RemoteSensing, vol. 5, no. 11, pp. 5620–5641, 2013. [Online]. Available:http://www.mdpi.com/2072-4292/5/11/5620
[8] A. Alonso-Gonzalez, C. Lopez-Martınez, and P. Salembier, “Filteringand segmentation of polarimetric SAR images with binary partitiontrees,” in Geoscience and Remote Sensing Symposium (IGARSS), 2010IEEE International, july 2010, pp. 4043 –4046.
[9] P. Kersten, J.-S. Lee, and T. Ainsworth, “Unsupervised classification ofpolarimetric synthetic aperture radar images using fuzzy clustering andem clustering,” Geoscience and Remote Sensing, IEEE Transactions on,vol. 43, no. 3, pp. 519–527, March 2005.
[10] F. Barbaresco, “Interactions between symmetric cone and informationgeometries: Bruhat-tits and siegel spaces models for high resolutionautoregressive doppler imagery,” in Emerging Trends in VisualComputing, ser. Lecture Notes in Computer Science, F. Nielsen, Ed.Springer Berlin / Heidelberg, 2009, vol. 5416, pp. 124–163. [Online].Available: http://www.springerlink.com/content/654u7104744567w8/
[11] A. Alonso-Gonzalez, C. Lopez-Martinez, and P. Salembier, “Filteringand segmentation of polarimetric SAR data based on binary partitiontrees,” IEEE Trans. Geoscience and Remote Sensing, vol. 50, no. 2, pp.593 –605, feb. 2012.
[12] A. Alonso-Gonzalez, C. Lopez-Martınez, and P. Salembier, “Binarypartition tree as a polarimetric SAR data representation in the space-timedomain,” in Geoscience and Remote Sensing Symposium (IGARSS),2011 IEEE International, july 2011, pp. 3819 –3822.
[13] S. Valero, P. Salembier, and J. Chanussot, “Hyperspectral image seg-mentation using binary partition trees,” in Image Processing (ICIP),2011 18th IEEE International Conference on, 2011, pp. 1273–1276.
[14] ——, “Hyperspectral image representation and processing with binarypartition trees,” IEEE TIP, vol. 22, no. 4, pp. 1430–1443, 2013.
[15] ——, “Object recognition in urban hyperspectral images using binarypartition tree representation,” in Geoscience and Remote Sensing Sym-posium (IGARSS), 2013 IEEE International, 2013, pp. 4098–4101.
[16] ——, “Comparison of merging orders and pruning strategies for binarypartition tree in hyperspectral data,” in Image Processing (ICIP), 201017th IEEE International Conference on, 2010, pp. 2565–2568.
2014 International Radar Conference
978-1-4799-4195-7/14/$31.00©2014IEEE 6
![10-1 Lesson 10 Objectives Chapter 4 [1,2,3,6]: Multidimensional discrete ordinates Chapter 4 [1,2,3,6]: Multidimensional discrete ordinates Multidimensional.](https://static.fdocuments.in/doc/165x107/5697bff81a28abf838cbf777/10-1-lesson-10-objectives-chapter-4-1236-multidimensional-discrete-ordinates.jpg)