MULTIDIMENSIONAL POVERTY IN VIET NAM · 4 Multidimensional poverty in Viet Nam Foreword Viet...
108
MULTIDIMENSIONAL POVERTY IN VIET NAM Ministry of Labour, Invalids and Social Affairs Reducing poverty in all its dimensions to ensure a good quality life for all
Transcript of MULTIDIMENSIONAL POVERTY IN VIET NAM · 4 Multidimensional poverty in Viet Nam Foreword Viet...

MULTIDIMENSIONAL POVERTY IN VIET NAM
Ministry of Labour, Invalids and Social Affairs
Reducing poverty in all its dimensions toensure a good quality life for all

MULTIDIMENSIONAL POVERTY IN VIET NAMReducing poverty in all its dimensions to
ensure a good quality life for all

4 Multidimensional poverty in Viet Nam
Foreword
Viet Nam’s remarkable achievement in poverty reduction is internationally recognized: the poverty headcount rate (measured in monetary expenditure) was massively reduced from 57% in the early 1990s to 13.5% in 2014. Cognizant that the quality of people’s lives involves many more aspects than income, the Government of Viet Nam in November 2015 promulgated national multidimensional poverty (MDP) measurements for application during 2016-2020, marking an important step in Viet Nam’s transition from an income-based to a MDP approach. Viet Nam - one of the pioneering countries in the Asia and Pacific region to adopt the MDP approach to eliminate poverty in all its dimensions – set a national average MDP reduction target of 1.5% per annum and 2-4% in mountainous ethnic minority areas in the country’s five-year Socio-Economic Development Plan (2016-2020). The MDP measurements, including income and non-monetary dimensions such as housing, access to water and sanitation, education and health services, social and health insurance, were used to design the National Target Programme for Sustainable Poverty Reduction (NTP-SPR, 2016-2020) and identify poor households eligible for programme support, poverty reduction and social assistance policies.
This report is a joint research product by the Ministry of Labour, Invalids and Social Affairs (MOLISA), Viet Nam Academy of Social Sciences (VASS), General Statistics Office (GSO), Mekong Development Research Institute (MDRI) and the United Nations Development Programme in Viet Nam (UNDP Viet Nam). Using data from various sources (Viet Nam Household Living Standard Surveys (VHLSS), Population and Housing Census, survey on the socio-economic situation of 53 ethnic minority groups, National Survey on People with Disabilities in Viet Nam), this report paints a broad picture of MDP reduction in Viet Nam with an analyses of poverty trends among disadvantaged groups of ethnic minority areas and people with disabilities. This report suggests recommendations for further refinement of NTPSPR and poverty reduction policies towards ensuring good quality lives for all, leaving no one behind and achieving the Sustainable Development Goal (SDG) “eliminating poverty in all its dimensions and everywhere”.
We recommend this report to policy-makers, researchers, development actors and other stakeholders who wish to gain an insight into the poverty situation in Viet Nam and vulnerable groups. This report will also be an important contributor to stakeholders’ work assessing poverty reduction policies and programmes as well as monitoring progress towards achieving Viet Nam’s SDGs.
Nguyen Quang ThuanPresident
Viet Nam Academy of Social Sciences
Caitlin WiesenResident Representative a.i
UNDP Viet Nam
Le Tan DungVice Minister
Ministry of Labour, Invalids and Social Affairs

Reducing poverty in all its dimensions to ensure a good quality life for all 5
Acknowledgements
This report is a joint research product of MOLISA, Centre for Analyses and Forecast (CAF)-VASS, GSO, MDRI and UNDP Viet Nam. The research team comprised Mr. Nguyen Thang (CAF-VASS), Mr. Nguyen Viet Cuong (National Economics University), Ms. Lo Thi Duc (GSO), Ms. Pham Minh Thu (Institute for Labour Sciences and Social Affairs/MOLISA) and Mr. Phung Duc Tung (MDRI). The report also utilized data analysis by Nguyen Thi Thu Phuong (CAF-VASS) and MDRI experts.
During preparation of the report, the research team received technical guidance from Mr. Nguyen Tien Phong and Ms. Nguyen Thi Ngoc Han (UNDP Viet Nam), with support from Ms. Tran Thi Minh Tien (UNDP Viet Nam) and Ms. Vo Hoang Nga (UNDP Consultant).
The research team received valuable inputs from Mr. Ngo Truong Thi (Director General, Head of the Poverty Reduction Coordination Office, MOLISA), Mr. Ha Viet Quan (Director General a.i., International Cooperation Department, Committee for Ethnic Minority Affairs), Mr. Pham Trong Cuong (Deputy Director, Department of Social Affairs, National Assembly Office) and Mr. Doan Huu Minh (Head of Division for Social Work, Department of Social Assistance, MOLISA).
The report received invaluable support from the GSO, with data from the 2016 Viet Nam Household Living Standards Survey and 2016 National Survey on People with Disabilities in Viet Nam.

Contents
Acknowledgements ...............................................................................................................................................5
Executive summary ............................................................................................................................................. 10
Part 1: Multidimensional poverty in Viet Nam: An overview .................................................................20
Chapter 1.1. Multidimensional poverty in Viet Nam: Measurement, current status and trends ...............20
1.1.1. From unidimensional to multidimensional: improving poverty measurement method .............20
1.1.2 Impressive poverty reduction rate regardless of the measure in use ............................................22
1.1.3 Deprivation by dimensions and indicators of well-being .................................................................25
1.1.4 Multidimensional poverty among population groups.........................................................................33
1.1.5 Analysis of poverty dynamics ..................................................................................................................42
Part 2 . Disadvantaged groups experienced significant progress, yet continue to lag behind 46
Chapter 2.1. Poverty and poverty reduction among ethnic minority groups: Outstanding issues ..........46
2.1.1 Gaps in expenditure and income between the Kinh and ethnic minority groups increased ......46
2.1.2 Factors influencing the living standards gap between ethnic minority and Kinh/Hoa groups 54
2.1.3 Multidimensional poverty in selected ethnic minority groups .......................................................56
Chapter 2.2. Multidimensional poverty among people with disabilities .......................................................79
2.2.1. People with disabilities in multidimensionally poor households by region and some demograph-ic characteristics ..............................................................................................................................................80
2.2.2. People with disabilities in multidimensionally poor households and types of disabilities ......82
2.2.3. People with disabilities in multidimensionally poor households, deprivations by dimension .83
2.2.4. People with disabilities in multidimensionally poor households and employment ...................84
2.2.5. People with disabilities in multidimensionally poor households and social assistance ..........85
Part3. Poverty reduction programmes and policies in Viet Nam: Assessment and recommendations ........................................................................................................ 88
3.1 National Target Programme for Sustainable Poverty Reduction during 2016-2020 ............................88
3.2 Support policies for the poor and near-poor ..............................................................................................90
3.2.1 Policies to support income improvements .........................................................................................90
3.2.2. Policies on improvement of access to basic social services .........................................................92
3.3. Assessment of poverty reduction programmes and policies in Viet Nam...........................................96
3.4. Policy recommendations ................................................................................................................................96
3.4.1 Promoting productive employment to increase income for all workers ........................................97
3.4.2 Expanding the coverage and improving the quality of basic social services .............................. 97
3.4.3. Improving the effectiveness of poverty reduction programmes and policies ............................98
References ............................................................................................................................................................100
Annexes ..................................................................................................................................................................101

List of figures
Figure 1.1. 1. Average income and expenditure (thousand VND/per/month) ................................................23
Figure 1.1. 2. Poverty rate by different poverty measures (%) ..........................................................................23
Figure 1.1.3. Differences between MDP and monetary poverty, by region, 2016 ..........................................24
Figure 1.1. 4. Overlaps among poverty measures ...............................................................................................24
Figure 1.1. 5. Income poverty and MDP rates, by expenditure quintile ..........................................................25
Figure 1.1.6. Proportion of population deprived in national MDP indicators (%) ..........................................26
Figure 1.1.7: Proportions of multidimensionally poor households, by deprivation dimension and geo-graphical region, 2016 ............................................................................................................................................26
Figure 1.1.8: Proportion of multidimensionally poor households, by deprivation dimension and expendi-ture quintile 2016 .....................................................................................................................................................27
Box 1.1.2. Development of the internet in Viet Nam ......................................................................................... 27
Figure 1.1. 9. Proportions of people deprived in global MDP indicators ........................................................28
Figure 1.1. 10. Distribution by number of deprivation indicators (%) ..............................................................30
Figure 1.1. 11. Deprivation and MPI (%) .................................................................................................................. 31
Figure 1.1. 12. Contribution of indicators to MPI .................................................................................................32
Figure 1.1. 13. Contribution of poverty indicators to MPI ..................................................................................32
Figure 1.1. 14. Poverty rate by sex of household head (%) ................................................................................34
Figure 1.1.15. MDP rate by age, 2012-2016 ...........................................................................................................34
Figure 1.1.16. Income poverty rate, expenditure poverty rate and MDP rate by age, 2016 .........................35
Figure 1.1. 17. Income poverty rate by ethnic group (%) ....................................................................................36
Figure 1.1. 18. MDP rate by ethnic group ..............................................................................................................36
Figure 1.1. 19. Number of deprivation indicators by ethnic group .................................................................. 37
Figure 1.1. 20. Deprivation score and MPI by ethnic group ............................................................................. 37
Figure 1.1. 21. Contributions of ethnic groups to the national MPI (%)...........................................................38
Figure 1.1. 22. Poverty rate by geographical region (%) ....................................................................................38
Figure 1.1. 23: Expenditure poverty rate and income poverty rate, 2016 (%) ................................................39
Figure 1.1. 24. Contribution of geographic regions to the overall MPI (%).....................................................39
Figure 1.1. 25: Provinces with moderate and high per capita expenditures with concentrated MDP .....40
Figure 1.1. 26. Poverty rate by education level of household head (%) ..........................................................40
Figure 1.1. 27. Poverty rate by main occupation of household head .............................................................. 41
Figure 1.1. 28. MDP status transition 2012-2016 (%) .........................................................................................42
Figure 1.1. 29. MDP status transition by ethnic group (2012-2016) ...............................................................42
Figure 2.1. 1: Poverty map ......................................................................................................................................46
Figure 2.1.2: Expenditure gap between Kinh and ethnic minority groups ....................................................47
Figure 2.1.3: Education of household head (%) ..................................................................................................50
Figure 2.1. 4: Gap in average expenditure per capita by education of household head ............................ 51
Figure 2.1. 5: Access to basic services ................................................................................................................52

Figure 2.1. 6: Distribution of average expenditure gap by group with access to basic services and without ...53
Figure 2.1. 7: Population of the same ethnic group in district by average expenditure decile (thousand people) ...................................................................................................................................................54
Figure 2.1.8: Factors relating to gap between ethnic minorities and Kinh/Hoa .........................................55
Figure 2.1. 9: Poverty map of ethnic groups .......................................................................................................56
Figure 2.1. 10: Poverty rates 2016 and poverty rate changes 2011-2016 of EM............................................57
Figure 2.1. 11: MDP rates of the Hmong and Kinh ...............................................................................................58
Figure 2.1. 12: MDP rate of the Hmong ...............................................................................................................58
Figure 2.1. 13: Illiteracy and school attendance rates of Hmong females .....................................................60
Figure 2.1. 14: Other indicators for the Hmong ...................................................................................................60
Figure 2.1. 15: Indicators related to reproductive health of the Hmong ........................................................ 61
Figure 2.1. 16. Income structure of Hmong in 2016 (%) .....................................................................................62
Figure 2.1. 17: MDP of the Tay and Kinh, 2009-2015 ..........................................................................................63
Figure 2.1. 18: MDP indicators of the Tay and Kinh/Hoa ...................................................................................64
Figure 2.1. 19: Distance from home to school and health clinic for Tay and Hoa, 2015 ..............................65
Figure 2.1. 20: MDP indicator of Tay and Kinh/Hoa ............................................................................................65
Figure 2.1. 21: Income structure of the Tay in 2016 (%) .....................................................................................66
Figure 2.1. 22: MDP of the Thai and Kinh, 2009-2015 ........................................................................................67
Figure 2.1. 23: MDP indicators of the Thai and Kinh, 2009-2015 .....................................................................67
Figure 2.1. 25: Income structure of the Thai in 2016 (%) ...................................................................................69
Figure 2.1. 26: MDP of Muong and Kinh, 2009-2015 ..........................................................................................70
Figure 2.1. 27: MDP indicators of Muong and Kinh, 2009-2015 .......................................................................70
Figure 2.1. 28: Indicators for years of schooling and trained workers of Muong and Kinh/Hoa ................71
Figure 2.1. 29: Illiteracy and education of female Muong and Kinh ................................................................ 72
Figure 2.1. 30: Distance to markets, schools and health clinics for Muong and Hoa, 2015 ....................... 72
Figure 2.1.31: Reproductive health of the Muong and Hoa, 2015 ....................................................................73
Figure 2.1. 32: Income structure of the Muong 2016 (%) ..................................................................................73
Figure 2.1.33: MDP rate of the Xo Dang and Kinh, 2009-2015 ......................................................................... 74
Figure 2.1.34: MDP indicators of the Xo Dang and Kinh, 2009-2015 .............................................................. 74
Figure 2.1.35: Education of the Xo Dang and Kinh, 2009-2015 .......................................................................75
Figure 2.1.36: Female illiteracy rate of the Xo Dang and Kinh/Hoa, 2009-2015 ...........................................75
Figure 2.1. 37: Distance to market, school and health clinic of the Xo Dang and Kinh ...............................76
Figure 2.1. 38: MDP rate of the Gia Rai and Kinh, 2009-2015 ........................................................................... 77
Figure 2.1.39: MDP indicators of the Gia Rai and Kinh/Hoa, 2009-2015 ........................................................ 77
Figure 2.1.40: Education of the Gia Rai and Kinh................................................................................................78
Figure 2.1.41: Reproductive health of Gia Rai and Hoa, 2015 ...........................................................................78
Figure 2.2.1: Proportion of people with disabilities in multidimensionally poor households by area, region and ethnic group .........................................................................................................................................80
Figure 2.2.2: Distribution of people with disabilities in multidimensionally poor households across regions .......................................................................................................................................................... 81
Figure 2.2.3: Proportion of people with disabilities living in multidimensionally poor households, by age group ............................................................................................................................................................. 81
Figure 2.2.4: Proportions of people with disabilities aged 16 years or older living in multidimensionally poor households, by type of disabilities ............................................82
Figure 2.2.5: Proportions of children aged 2-15 in multidimensionally poor households by type of disability ....... 83
Figure 2.2.6: Deprivations in basic social services of people with disabilities in 2016 .............................84
Figure 2.2.7: Proportions of people with disabilities in multidimensionally poor households with income-generating jobs ...............................................................................................................................84
Figure 2.2.8: Proportions of people with disabilities living in multidimensionally poorhouseholds willing to work if conditions were met ..........................................................................................85
Figure 2.2.9: Proportions of people with disabilities in multidimensionally poor households benefiting from at least one social assistance policy/programme ..............................................................86
Figure 2.2. 10: Proportions of people with disabilities in multidimensionally poor households benefiting from monthly cash transfers .............................................................................................................86
List of tables
Table 1.1.2: Comparison results between Baseline Survey and Monitoring and Evaluation Report ........30
Table 1.1. Error! Bookmark not defined.: Population distribution by income group (USD PPP 2011) .......43
Table 1.1. 4. Population transition among economic groups, 2012-2016 ......................................................44
Table 2.1. 1: Income and income structure of ethnic minority groups and Kinh/Hoa group .....................49
Table 2.1. 2: Economic group structure of the Hmong, 2011-2016 .................................................................59
Table 2.1. 3: Economic group structure of the Tay, 2011-2016 ........................................................................64
Table 2.1. 4: Economic group structure of the Thai, 2011-2016 .......................................................................68
Table 2.1.5: Economic group structure of Muong, 2011-2016 ...........................................................................71
Table 2.1.6: Economic group structure of Xo Dang, 2011-2016 .......................................................................76
Table 2.1.7: Economic group structure of the Gia Rai, 2011-2016 ...................................................................79
Table 3.2. 1: Summary of poverty reduction policies of Viet Nam during 2016-2020 ................................95

10 Multidimensional poverty in Viet Nam
Executive summary
Part 1. Multidimensional Poverty in Viet Nam: An overview
From unidimensional to multidimensional: improving poverty measurement method
In Viet Nam, the government promulgates National Target Programmes on Sustainable Poverty Reduction for five-year periods based on the issuance of poverty lines to measure changes in poverty within the respective period. Before 2015, Viet Nam used the unidimensional poverty measure of income poverty. Besides, the World Bank and GSO also estimated the poverty rate in line with the average expenditure poverty line.
To promote a change in poverty reduction policies towards sustainability in the context of reforming the growth model, the National Assembly in 2014 directed the government to develop a new poverty line applying the multidimensional approach from 2016 to ensure minimum living standards and access to basic social services. On this basis, in 2015, the Government of Viet Nam adopted the multidimensional approach to poverty measurement. Accordingly, MDP is measured by the level of deprivation in access to five basic social services (healthcare, education, housing, water and sanitation as well as access to information), represented by 10 indicators. A household is considered “poor” if deprived in a third or more of these 10 indicators.
Impressive poverty reduction rate regardless of the measure in use
The data analysis results of the Viet Nam Household Living Standards Survey shows the poverty rate, regardless of the measurement method in use, declined during 2012-2016. Expenditure poverty, income poverty as well as MDP experienced a strong reduction. The MDP rate fell from 18.1% to 10.9% over this period. The expenditure and income poverty rates declined from 17.2% to 9.8%, and 12.6% to 7.0%, respectively.
Despite the correlation among poverty rates measured by different methodologies, there were considerable differences among poverty measures. To illustrate, income and expenditure poverty rates of the Northern Midlands and Mountains were the highest, but the MDP rate for this region was lower than those of the Central Highlands and Mekong River Delta. Many households with MDP were neither “income poor” nor “expenditure poor”, and vice versa. Approximately only 2.7% of the population was “poor” according to all three measures of income, expenditure and MDP.
With the exception of adult education, deprivation rates in all national MDP indicators fell during 2012-2016. The access to healthcare indicator improved significantly thanks to the strengthened universal health insurance policy. Deprivation in access to information dramatically dropped due to growth in mobile phones and internet. Housing and sanitation conditions also improved, but at a rather slow pace. Currently, the most severe deprivation is in the indicators for hygienic latrines and adult education.
Considering the entire population, 18% was not deprived in any of the 10 MDP indicators in 2012. This proportion grew significantly in 2016, standing at 36.1%. No household was deprived in eight or more indicators. Only 37.6% of the population suffered from one type of deprivation, and 15.5% faced two types of deprivation in 2016. “Severe deprivation” is defined as deprivation in five to seven indicators, which accounted for 1.3% of the population in 2016.
Changes in the contribution of indicators to the Multidimensional Poverty Index
The national Multidimensional Poverty Index (MPI) (calculated using the Alkire-Foster method) fell sharply during 2012-2016. The Alkire-Foster method (2011) allows us to analyze how the deprivation intensity of the indicators and components contribute to the overall MPI. This decomposition analysis looks into the causes of MDP, highlighting how improvements to certain indicators and dimensions will lead to greater

Reducing poverty in all its dimensions to ensure a good quality life for all 11
poverty reduction. The indicators on schooling, access to healthcare, communication and information reduced their contributions to overall MDP in this period, while the other indicators increased. In 2016, adult education contributed 16% to the overall MPI, while access to hygienic latrines made the highest contribution (22%). The dimensions of healthcare service access and school attendance had the lowest contribution levels.
Education and occupation of the household head influences poverty status
Education and occupation have a direct impact on the employment and income of a household and thus affect its poverty status. The MDP rate strongly correlated with the education level of the household head. The MDP rate of households headed by college or university graduates was just under 1%, while those whose heads did not complete primary education was 26.6% by 2016. During 2012-2016, the poverty rate fell for households whose heads had different educational levels. For households whose heads graduated from college or university, the MDP rate was very low and unchanged.
The MDP rate fell among household groups by occupation of household head. Households whose heads worked in agriculture had the highest MDP rate, followed by unskilled labour. These groups also achieved poverty reduction during 2012-2016, but the rate of poverty reduction was lower than other groups. Households whose heads were clerks, office workers, and skilled workers experienced the fastest MDP reduction rates.
Rate of escaping poverty significantly higher than falling into poverty
Although the poverty rate declined over the past period, the situation of falling back into poverty or vulnerable households falling into poverty persisted. As per the MPI, during 2012-2016, 6.7% of the population was “poor” in both, 2.6% fell into poverty and 9.4% escaped poverty in 2016. The remainder were “non-poor” households in 2012 and 2016. In other words, the proportion of the population who escaped poverty was considerably greater than that falling into poverty, and the long-term poverty rate was low. The poverty transition trends were relatively similar for households in expenditure poverty, national and global MDP. Relatively, the rate of escaping income poverty was higher than escaping expenditure poverty and MDP.
One of the key causes of relapsing into poverty and falling into poverty was the increasing severity of natural disasters, especially in 2013 (total damage valued at VND19,601 billion, 6,518 houses collapsed or were swept away and 114,844ha of rice and 155,708ha of other crops were lost) and in 2016 (total damage valued at VND39,726 billion, 5,431 houses collapsed and 134,517ha of rice and 130,678ha of other crops were lost).
Part 2. Disadvantaged groups experienced significant progress, yet still lag behind
Poverty and poverty reduction among ethnic minority groups1
Gaps in expenditure and income between the Kinh and ethnic minority groups increased
The expenditure gap between the Kinh/Hoa and ethnic minorities tended to increase between 2004 and 2016. In 2004, the expenditure of ethnic minorities was 59% of that of Kinh/Hoa and by 2016, it stood at only 52%.
The income gap also follows a similar trend. In 2004, the income of the ethnic minority population was equal to 68% of the Kinh and by 2016, it had fallen to 52% - a decrease of 16%. The widened income gap is mainly due to the high growth rate of non-agricultural and wage-earning activities (and the resulting doubling of income) of Kinh/Hoa households, while ethnic minority households did not experience the same level of growth in these activities.
1 The focus of the analyses in this section is on the long-term trends of poverty and poverty reduction among ethnic minority groups. Therefore, data from multiple Household Living Standards Surveys from 2004 to 2016 was used.

12 Multidimensional poverty in Viet Nam
Considerable education gap
The difference in education between the Kinh/Hoa and ethnic minority groups was also significant. In 2016, the proportion of ethnic minority people without qualifications was 43.8%, double that of the Kinh/Hoa. The proportion of people with high school education in the ethnic groups was 7.8%, only half that of the Kinh/Hoa.
The gap in access to electricity and safe water narrowed, yet widened in access to hygienic latrines
Although access to basic social services such as electricity, safe water and hygienic latrines improved significantly for Kinh/Hoa and ethnic minority groups, the extent of improvement varied. From 2004 to 2016, gaps between the two groups in access to electricity (94.5% to 98.4% for the Kinh/Hoa and 72.5% to 90% for ethnic minority groups) and clean water (84.6% to 94.8% for the Kinh/Hoa and 51.5% to 70.6%) narrowed, but the gap in access to hygienic latrines increased. The proportion of the population with access to hygienic latrines grew considerably for the Kinh/Hoa by 28% (46.8% to 75.1%) during 2004-2016, while this figure for ethnic minorities was only 17% (9.9% to 27.2%).
Relationships among the dimensions
One of the important policy questions related to the MDP approach concerns interactions among the dimensions of poverty, i.e., whether improving one deprivation can also improve other deprivation(s). The analysis shows that people from ethnic minority groups with higher education (upper secondary or higher) and at a high expenditure quintile in 2004 considerably narrowed the expenditure gap with Kinh/Hoa counterparts with similar characteristics. This affirms the important role of education in narrowing the development gap for ethnic minority groups.
Regarding access to electricity, clean water and hygienic latrines, in the expenditure spectrum for 2004 and 2016, ethnic minorities without access to these public utilities had a higher expenditure gap with the Kinh/Hoa than those with access.
Factors influencing the living standards gap between Kinh/Hoa and ethnic minority groups
Geographic distance and remoteness2 were the biggest barriers to improving the well-being of ethnic minorities to catch up with Kinh/Hoa groups. The magnitude of geographic distance on widening the expenditure gap increased from 3.2% in 2004 to 15% in 2016.
In contrast, infrastructure improvements helped to close the expenditure gap between the Kinh/Hoa and ethnic minority groups, by 14% in 2004 and 6.4% in 2016. Regarding other contributing factors explaining the expenditure gap among ethnic groups, household size and educational attainment made the same 12% contribution to the increased expenditure gap in 2004. However, during 2004-2016, the impact of education on the gap halved and that of household size on the gap declined by about a quarter.
Significant differences in poverty rates and poverty reduction rates among ethnic minority groups
During 2011-20163, the MDP rate of all ethnic minority groups in Viet Nam declined. Nevertheless, the overall reduction rate as well as the dimension-specific reduction rates were very different among ethnic groups. Specifically, while some ethnic minority groups (such as Muong, Tay and Thai) had low poverty rates and fast poverty reduction, other ethnic groups like Hmong, Gia Rai and Xo Dang had high poverty rates and slow poverty reduction.
2 Information on whether a commune is considered to belong to remote and disadvantaged areas was extracted from Household Living Standards Survey data.
3 To calculate the poverty rates of ethnic groups with small populations, data from the Rural, Agricultural and Fishery Census waves conducted in 2011 and 2016 was used for the analyses.
Reducing poverty in all its dimensions to ensure a good quality life for all 13
Several influencing factors and explanations for such differences include economic as well as other factors related to the views and customs of each ethnic group. In general, ethnic minority groups with high poverty rates and sluggish poverty reduction are concentrated in the Central Highlands, with long distances from home to markets, schools and medical facilities, the high prevalence of consanguineous marriage, the high prevalence of child marriage, the low number of schooling years, the low proportion of trained workers and limited reproductive healthcare for women. In addition, the household income structure was also an important factor explaining the differences in poverty rates and MDP reduction among ethnic groups. Ethnic groups with a large income share from farming and livestock, such as the Hmong people, had higher poverty rates and slower poverty reduction. In contrast, ethnic groups with a large income share from wages or non-agricultural activities, such as Tay and Thai, had lower poverty rates and faster poverty reduction than the Kinh and the national rate.
Multidimensional poverty among people with disabilities
Disability greatly affects the quality of life in ways beyond the control of people with disabilities and of households whose members have disabilities. In addition, difficulties due to lack of access to basic social services exacerbate the situation of people with disabilities and of households with members with disabilities. Disability and MDP are interrelated, a cause and consequence of MDP.
People with disabilities in multidimensionally poor households were unevenly distributed
In 2016, Viet Nam had 17.8% of people with disabilities living in multidimensionally poor households as per the government’s MDP line for 2016-2020. For every 10 persons with disabilities, more than four lived in multidimensionally poor households if they were ethnic minorities.
By region, about three-in-10 persons with disabilities lived in multidimensionally poor households if in the Northern Midlands and Mountains, Central Highlands or Mekong River Delta, while two-in-10 persons with disabilities lived in multidimensionally poor households if in rural areas.
People with disabilities living in multidimensionally poor households were most concentrated in the Mekong River Delta, accounting for nearly one-third of the total number of people with disabilities in the country. For every 10 multidimensionally poor people with disabilities, four were from 65 years old and above and one was 2-14 years old.
Large gap in access to education between people with disabilities in multidimensionally poor households and people without disabilities
Schooling opportunities for children, aged 5-14 years, with disabilities in multidimensionally poor households were less than for those without disabilities by about 21%. Only 66.6% of children aged 5-14 with disabilities in MDP attended school.
The proportion of people with disabilities aged 15-30 years in multidimensionally poor households who completed lower secondary education or were currently attending school was only 17.2%, some 25% less than for counterparts without disabilities.
Limited employment opportunities for people with disabilities in multidimensionally poor households
Nationwide, 35.9% of people with disabilities aged 15 and over who lived in multidimensionally poor households worked to generate income for themselves or their families. This rate was 42% lower than the national employment rate of the population aged 15 and over. In reality, elderly people account for a large proportion of people with disabilities. Apart from several limitations in terms of hearing, vision, communication, cognitive and neurological functions, their education is usually low and limits employment opportunities.

14 Multidimensional poverty in Viet Nam
Varying levels of social assistance for people with disabilities in multidimensionally poor households
The proportion of people with disabilities in multidimensionally poor households nationwide benefiting from at least one social assistance policy in 2016 reached 74.2%, with a large gap between urban and rural households (23%), and between Kinh/Hoa and other ethnic groups (25%). This also reflects the government’s common prioritization and dedicated policies for rural areas and ethnic minorities in disadvantaged areas.
Part 3. Poverty Reduction Programmes and Policies in Viet Nam: Assessment and Recommendations
3.1. Assessment of the poverty reduction Programmes and policies in Viet Nam
Although Viet Nam only recently changed its poverty measurement method from unidimensional to multidimensional, the system of poverty reduction policies has been assessed to be comprehensive and multidimensional, covering most needs and deprivations of the poor. The system includes general poverty reduction policies4 and distinct poverty reduction policies5. Most policies spanning 2016-2020 are not new and carried over from the previous period with appropriate adjustments. Accompanying inclusive growth, these programmes and policies have contributed to Viet Nam’s remarkable poverty reduction achievements as analyzed in Section 1.
However, several shortcomings exist in current poverty reduction policies:
Overlaps and fragmentation in policy design and implementation persist
In the past, the system of poverty reduction programmes and policies was assessed to have many overlaps. It was characterized by a lack of linkages and coordination between poverty reduction programmes and policies and those on social assistance, prevention and management of lifecycle risks (social insurance) and development of basic social services and care covering the poor. The system has been under review and policy consolidation was adopted in the “Plan to review and integrate poverty reduction policies - period 2017-2018” (Decision No.1259/QD-TTg, dated 22 August 2017). Nevertheless, the results have been limited.
More effective use of multidimensional approach in policy design is needed
The multidimensional approach to poverty was formally implemented since 2016 to identify beneficiary households of poverty reduction and social protection policies, as well as to measure and monitor poverty. So far, the list of national socio-economic development indicators includes two related to MDP: (1) MDP reduction and (2) Proportion of population participating in health insurance schemes. Local governments have only included the two indicators in their local socio-economic development plans, but yet to apply MDP dimensions and indicators.
Thus, when poverty is identified and measured in the multidimensional approach, the development of poverty reduction policies and programmes and socio-economic development plans related to component indicators of MDP also demand research and innovations to respond to the new approach, with a view to improving the effectiveness of poverty reduction and holistic socio-economic development.
3.2. Policy recommendations
Impressive poverty reduction achievements in recent years attributed to the growth and development in Viet Nam over the past three decades have been widely regarded as inclusive, with the vast majority
4 Covering seven groups of basic poverty reduction policies: credit; production support, production land and forest planting; voca-tional training and employment; housing and water; education and training; healthcare; legal aid and information support.
5 These policies are implemented as part of the National Target Programme on Sustainable Poverty Reduction (NTP-SPR) and a number of programmes and policies exclusive for ethnic minority areas.
Reducing poverty in all its dimensions to ensure a good quality life for all 15
of people involved in this growth process having benefitted. In the future, to sustain poverty reduction and curb the rise in inequalities, the inclusive growth model should be constantly strengthened on the basis of four main pillars: (i) job creation to increase productivity for all workers, (ii) expand coverage towards the universalization of basic social services, (iii) strengthen the social protection system for disadvantaged groups to ensure no one is left behind and (iv) take economic, cultural, social and geographic differences among ethnic minority groups as the focus for research and recommendations of appropriate and effective policies.
These orientations should be implemented with the new global and national contexts in mind. Although globalization is still a dominant trend internationally, protectionism in some major economies and trade wars are new challenges for the global economy. The Fourth Industrial Revolution, with the digital revolution at its core, is having a powerful and comprehensive impact on the contemporary world, posing new opportunities and challenges. Ageing populations in many countries, climate change and non-traditional security are also major trends with a significant impact on Viet Nam’s economy in general and on poverty and inequality reduction in particular. In Viet Nam, the national economy has flourished and macroeconomic stability is secured. However, structural reforms such as to State-owned enterprises, the banking system and public investment still face many hurdles. Other challenges, such as high public debt and population passing its “golden” stage, also create constraints for growth and poverty reduction.
Based on the aforementioned assessment, a policy framework to promote poverty reduction based on inclusive growth is proposed as follows:
3.2.1. Promoting productive employment to increase income for all workers
Continuing to strengthen the fundamentals of the economy
Viet Nam must further strengthen its economic fundamentals by maintaining macroeconomic stability, continuing active international integration and accelerating the currently sluggish structural reforms to ensure national resources - human, financial and natural - are allocated and used effectively, with the promotion of administrative reforms, increased transparency and an intensified fight against corruption to have more resources for development in general and for poverty reduction and curbing inequality in particular.
Promoting agricultural development
As agriculture is still the main source of livelihoods for many low-skilled labourers and the poor in rural areas, many of whom are ethnic minority people, it should be revitalized. Solutions including implementation of the Land Law, taxation policies, agricultural, forestry and fishery extension activities should be directed towards agricultural sector restructuring to increase productivity through transitions to higher value products and strengthened value chains for farmers’ products. At the same time, Viet Nam must make the most of increasingly cheaper digital technologies to improve the efficiency of agricultural production. Some examples of specific applications include the use of these technologies to trace the origins of products and input materials, receive information on agricultural prices, access digitalized extension services and receive pest warnings.
Promoting productivity and efficiency of small and medium-sized enterprises and household businesses
Small and medium-sized enterprises (SMEs) and household businesses play a key role in restructuring as they help draw labour, many of whom have few skills, out of agriculture to work in manufacturing and services industry with higher productivity and income, thereby supporting sustainable poverty reduction and effectively curbing rising inequality. Therefore, it is necessary to promote productivity and efficiency of SMEs and household businesses. This can be achieved through the effective implementation of the Small and Medium Enterprise Support Law, approved by the National Assembly in 2017.
It is recommended a digitization process is facilitated for the development of Vietnamese enterprises in general and SMEs in particular in the digital era. It is also necessary to raise awareness and encourage

16 Multidimensional poverty in Viet Nam
SMEs to use cloud-computing services to slash costs, and to use e-commerce platforms to enhance connections to the market6. Special assistance should be provided to business households and people in ethnic minority areas to strengthen their links with international and domestic markets, particularly in urban areas, through digital technologies and platforms for e-commerce, tourism, thereby promoting the sale of local products and services with potential.
3.2.2. Expanding the coverage and improving the quality of basic social services
It is recommended coverage of basic social services is continually expanded, accompanied by improved efficiency and quality. A thorough assessment of the impact of basic social service privatization is needed. While the privatization of basic social services has been deeply rooted in the system and mobilized substantial resources, its current activity in the context of regulatory pitfalls has raised concerns about equity and efficiency. The privatization of basic social services has led to under-utilization of services, especially for poor and low-income households.
In the education sector, the impact of school fees on poor and low-income households should be assessed and the most efficient use of resources considered before further expansion of the privatization of basic social services. In the health sector, the way healthcare services are financed and managed has led to concerns about effectiveness, such as the overuse of high-end services and expensive medical technologies. Other issues including inadequate attention to preventive medicine and primary healthcare, rapidly increasing medicine prices in the context of high out-of-pocket payments, ambiguous boundaries between public and private healthcare services also need to be assessed and improved. Comprehensive investment in facilities and human resources should be emphasized to strengthen local healthcare systems in rural, ethnic minority and mountainous areas. Regarding sanitation and health, many poor households do not have access to sanitary latrines, which should also be prioritized.
In the context of accelerating technological advances, the education sector needs to promote life-long learning and cyber-learning, including provision of online courses for all. There should be support for ethnic minority groups to participate in these increasingly common forms of education. In the health sector, it is important to encourage the application of affordable technologies to healthcare, including the expansion of health checks and counselling through online forms, given the constantly improving coverage and speed of internet access.
3.2.3 Improving the effectiveness of poverty reduction programmes and policies
Continuing to improve the quality of multidimensional poverty measurement
MDP measurement is a new method, globally and nationally. Therefore, to become an effective instrument to measure poverty, the MDP approach in Viet Nam should be enhanced towards the global methodology, while better reflecting the context in Viet Nam. In this direction, several recommendations:
• It is necessary to assess the results of MDP measurement approach in Viet Nam according to the set objectives and actual implementation, specifying accomplishments as well as limitations
• Output-based indicators should be developed and completed to replace input-based indicators, and supplemented with additional indicators such as participation in social insurance
• Several indicators should be improved such as adult education, which should be measured in a dynamic manner to reflect the demand for life-long learning or access to information, which should be changed to accommodate the accelerating digital revolution.
• MDP measurement should be linked to climate change responses. For example, the safe housing indicator should be considered in place of existing indicators for deprivation in housing.
6 Currently many “digital traders” sell local specialities from mountainous provinces, such as Dien Bien and Lao Cai, on social net-works like Facebook to connect agricultural production to the nationwide market..
Reducing poverty in all its dimensions to ensure a good quality life for all 17
Promoting the use of digital technology in monitoring the implementation of poverty reduction programmes and policies
On the basis of dimensions and indicators of deprivation approved by competent authorities, programme management agencies could develop an application software for access to basic social services used on smart phones, and instruct beneficiaries to fill in information using the app (if people do not know how to use the app, poverty reduction officers could provide instructions). In that way, sufficient data on deprivation levels nationwide could be actively obtained.
Improving programme/policy effectiveness through design and implementation
Emphasis should be given to the review and consolidation of poverty reduction policies to minimize gaps and overlaps, reducing management and compliance costs.
It is necessary to change ways of thinking and approaches to developing poverty reduction policies and the poverty reduction policy system, in which poverty reduction policies should be linked to distinct social assistance policies (with the consensual view that investment in poverty reduction and social assistance is an investment in humans and sustainable development) and policies that promote economic growth, applying inclusive growth approach.
A long-term vision of poverty reduction in ethnic minority and mountainous areas should be developed for a comprehensive socio-economic development strategy for these areas, laying the foundation for re-directing investments under the national target programme to be more focused and effective.
There should be an emphasis on the design of endogenous capacity-building policies, together with communication approaches to facilitate access to policies for the poor. At the same time, awareness should be raised among the poor to actively work with government to achieve poverty reduction goals, avoiding the situation of passively benefiting from policies and falling back into poverty without support from the government.
Viet Nam should scale-up effective poverty reduction models, promote community-based poverty reduction initiatives, create jobs associated with infrastructure construction investments in the area, promote cooperation models to link poor households with enterprises in production, product distribution and consumption, attracting poor labourers to secured employment in enterprises.
The country should also promote grassroots democracy and participation in the development, implementation and monitoring of programmes/policies. The use of digital technology in the implementation of poverty reduction programmes should be promoted to help improve efficiency and transparency, quickly receive feedback from beneficiaries and stimulate broader public participation. Through using digital platforms, relevant management agencies can collect and analyze the data, as well as prepare timely reports towards real-time reporting, in line with the orientation of the government towards e-government in Viet Nam.
Extending the coverage of programmes/policies in breadth and depth, focusing on vulnerable groups
Social security should be ensured for all. In the future, the design of policies should be changed, so the lowest level ensures that all people have minimum essential security regardless of the level of contribution and participation.
It is necessary to continue to expand beneficiaries, policies and conditions to implement social protection, giving priority to disadvantaged groups and those affected by natural and social events, as well as poor and ethnic minority areas. There should be a gradual shift from supporting poor households to helping easily identified vulnerable people, such as children, the elderly, people with disabilities, people living in disadvantaged areas in the north west, central north and Central Highlands, certain ethnic minorities with high poverty rates and slow poverty reduction, such as the Gia Rai, Hmong and Xo Dang.

18 Multidimensional poverty in Viet Nam
Abbreviations
BISP Benazir Income Support Programme BLSCPI
Baseline SurveyConsumer Price Index
CRPD Convention on the Rights of Persons with DisabilitiesED Extremely disadvantagedEM Ethnic minoritiesFAO Food and Agriculture Organization (of the United Nations)GDP Gross Domestic Product GSO General Statistics OfficeGSO-WB General Statistics Office and World BankHAICT
HectaresInformation Technologies and Communications
IoT Internet of Things IR 4.0 Fourth Industrial RevolutionKgM&EMDCP
KilogrammeMonitoring and EvaluationMultidimensional Child Poverty
MDP Multidimensional Poverty MOLISA Ministry of Labour, Invalids and Social AffairsMPI Multidimensional Poverty Index NTP-PR National Target Programme for Poverty ReductionOPHI Oxford Poverty and Human Development InitiativeSDGs Sustainable Development GoalsSMEsUNDP
Small and Medium-sized EnterprisesUnited Nations Development Programme
UNICEF United Nations Children’s FundUSD United States DollarUSD PPP/day United States Dollar Purchasing Power Parity/dayVDS Viet Nam National Survey on Persons with DisabilitiesVECOM Viet Nam E-Commerce Association VHLSS Viet Nam Household Living Standards Survey VNDVNEN
Viet Nam DongViet Nam Escuela Nueva
WG Washington Group (on Disability Statistics)VECOM Hiệp hội Thương mại Điện tử Việt Nam VHLSS Điều tra mức sống dân cưVNEN Dự án Mô hình trường học mới WG Nhóm Washington về Thống kê khuyết tật

Reducing poverty in all its dimensions to ensure a good quality life for all 19

20 Multidimensional poverty in Viet Nam
Part 1. Multidimensional poverty in Viet Nam: An overview
Chapter 1.1. Multidimensional poverty in Viet Nam: Measurement, current status and trends
1.1.1. From unidimensional to multidimensional: improving poverty measurement method
In Viet Nam, the government promulgates National Target Programmes on Sustainable Poverty Reduction for five-year periods based on the issuance of poverty lines to measure changes in poverty within the respective period. Before 2015, Viet Nam applied the unidimensional poverty measure of income poverty. The income poverty line set by the government is the per capita monthly income of the household, that ensured an estimated food intake of 2,100-2,300 Kcal/person/day and some additional essential non-food consumption (Table 1.1.1). Based on this poverty line, the MOLISA identified and listed poor households at commune level and calculated the poverty rate from the National Census on Poverty it administered prior to every National Poverty Reduction Programme, with the lists updated annually during implementation.
Table 1.1. 1. Viet Nam poverty line over periods
Area 1993-1995 1996-1997 1998-2000 2001-2005 2006-2010 2011-2015
Urban 20 kg of rice/ person/month
25 kg rice/ person/month
25 kg rice/ person/month (90,000 VND)
150,000 VND/ person/month
260,000 VND/ person/
month
500,000 VND/
person/month
Rural 15 kg rice/ person/month
200,000 VND/ person/
month
400,000 VND/ person/
month
Rural – mountainous areas and islands
15 kg rice/ person/month
15 kg rice/ person/month(55,000 VND)
80,000 VND/ person/month
Rural – deltas and midlands
20 rice/ person/month
20 kg rice/ person/month(75,000 VND)
100,000 VND/ person/month
Source: Consolidated from legal documents
Based on this poverty line, the GSO used the Consumer Price Index (CPI) to adjust the poverty line of the respective year in line with the VHLSS to calculate the poverty rate based on the average income calculated from this data, yet without identifying poor households. Besides, since the VHLSS was conducted from 1993, the GSO and World Bank (WB) have also estimated poverty rates based on per capita expenditure and the GSO-WB poverty line. Accordingly, the “poor” are defined as those with lower expenditure than the GSO-WB poverty line estimates. The GSO-WB poverty line is updated approximately every 10 years and adjusted for the year corresponding to the VHLSS with the CPI for food and non-

Reducing poverty in all its dimensions to ensure a good quality life for all 21
food items. The latest WB-GSO poverty line, updated in 2010 and adjusted for January 2016 prices, was VND969,167 per person/month and the government-set poverty line for 2016-2020 was VND700,000 and VND900,000 per person/month for rural and urban areas, respectively.
However, poverty measured by income or expenditure could not comprehensively reflect quality of life aspects. In reality, many households whose income or expenditure were above the poverty line still did not have access to clean water, hygienic latrines, schooling and healthcare. Therefore, the Government of Viet Nam resolved to adopt a national measure of MDP in 2015 (Decision No.1614/QD-TTg, dated 15 September 2015). Accordingly, Viet Nam became one of the pioneering nations to apply the multidimensional approach to poverty measurement (see Annex 1).
The MDP approach is not only used for monitoring poverty, but also identifying beneficiaries of social protection programmes. The 2016-2020 poverty line combines income poverty lines and 10 indicators of deprived access to five basic social services (healthcare, education, housing, water and sanitation as well as access to information). A household is considered “poor” if it meets one of two criteria:
• A household whose per capita income is lower than VND700,000 per month in rural areas or lower than VND900,000 per month in urban areas.
• A household whose per capita income is between VND700,000 and VND1,000,000 per month in rural areas or between VND900,000 and VND1,300,000 per month in urban areas, and is deprived in a third or more of 10 indicators of basic services.
The use of the national poverty line is necessary not only for the development of poverty reduction policies and programmes along with poverty monitoring in Viet Nam, but also for monitoring progress in implementing the United Nations’ SDGs, with its first goal to end poverty in all its forms (SDG 1), target 1.2: “By 2030, at least half of all men, women and children of all ages live in poverty in all respects according to national definitions”, indicator 1.2.1: “Proportion of population living below national poverty line” and indicator 1.2.2: “Proportion of men, women and children of all ages living in poverty in all its dimensions according to national definitions”.
This report also uses other poverty estimates for comparison as follows:
• Multidimensional poverty: Five dimensions (education, healthcare, housing, living conditions and access to information) with 10 indicators. It also used VHLSS data to determine the deprivation levels of households. A household is multidimensionally poor if it is deprived in at least three indicators. As such, members of multidimensionally poor households are also considered multidimensionally poor people.
• Poverty determined at local levels: In the VHLSS, there is a question on whether the household is categorized as “poor” according to the poverty review and listings conducted by local authorities. Hence, based on this information, the estimated poverty rate is practically determined at local levels. Such an estimate covers households officially recognized as “poor” by local authorities in accordance with the national poverty line (as per regulations of MOLISA). These poor households are eligible to benefit from government social assistance policies.
• Global multidimensional poverty (Alkire and Robles, 2017): To compare the MDP rate of Viet Nam with other countries, the report estimated the global measure of MDP determined by three dimensions (health, education and living conditions) and 10 indicators. Accordingly, a household is considered “poor” if its total deprivation score exceeds one-third of total deprivations in 10 indicators.
22 Multidimensional poverty in Viet Nam
Box 1.1.1. Poverty measurement: poverty monitoring and beneficiary identification
Poverty indicators are measured to evaluate and monitor changes in poverty status of a pop-ulation over time as well as across geographic variations. Poverty rate is the most important and common measure of poverty measurement indicators. It indicates the proportion of the population living below the poverty line. The poverty line can be either absolute, such as income or expenditure poverty line, multidimensional or relative, such as 10% or 20% of the population with the lowest living standards. In a household, poverty status can be different among house-hold members, which reflects welfare inequity within a household. For example, in countries where gender inequality exists, women in the household will have lower incomes and spending on themselves than men, with the poverty rate of women likely to be higher than men’s. How-ever, the individual welfare measure is complex as there are welfare variables such as income, expenditure or assets, whose measurement and use are shared among household members. Therefore, poverty measurements often use individualized measures and norms such as per-sonal income and expenditure. Individuals in the same household have equal income or expen-diture. The method to adjust the average consumption of household members to adult-equiv-alent consumption will take into account the age and sex structure of the household members and reflects somewhat more accurately the level of household expenditure (e.g., Lanjouw and Ravallion, 1995). Nevertheless, in poverty analysis reports, the average expenditure or income is usually calculated as the total expenditure or income of the household divided by the number of household members. The poverty rate is calculated as the proportion of households with an expenditure or income below the poverty line.
In Viet Nam, poor households are identified by MOLISA for coverage by social assistance and poverty reduction programmes. The management of poor households is easier to implement than that of poor individuals. Poor households benefit from assistance programmes such as preferential credit, health insurance, tuition exemptions and production support programmes. Therefore, the poverty line is defined not only by welfare measures, but also by the government funding capacity. Poverty rates of localities will be determined by the percentage of poor house-holds and total number of households in that locality. Because a poor household usually has more members than a non-poor one, household poverty rates are lower than the individual pov-erty rate for the same measure of welfare and poverty line. Therefore, the rate of poor house-holds will not accurately reflect the proportion of the poor population, especially when there is a demographic change that alters the size of the household.
1.1.2 Impressive poverty reduction rate regardless of the measure in use
This section of the report uses data from the 2012 VHLSS for the analysis of household well-being and poverty. This report calculated the share of poor individuals rather than poor households. MOLISA identify poor households not only to monitor poverty, but also to determine beneficiaries and allocate budgets. Since target beneficiaries are defined by households, the official poverty rate annually announced by the MOLISA is the percentage of poor households. International reports, however, mainly measure the proportion of poor individuals as it accurately reflects the actual number of poor people. Hence, this report presents the share of poor individuals, rather than poor households.
Economic growth is a precondition for sustainable poverty reduction7. Economic growth helps households increase their incomes and expenditures, which potentially reduces monetary poverty and MDP. Before analyzing changes in poverty within Viet Nam, this report looked at how household incomes and expenditures changed in the recent period. To compare living standards over time and exclude the effect of price fluctuations, income and expenditure were calculated on a monthly average per person basis in January 2016 (adjusted for price index). The findings show that per capita income increased from
7 Source: Dollar, D., and A. Kraay. 2002; Bourguignon, F. (2003); Ram, R. (2007)

Reducing poverty in all its dimensions to ensure a good quality life for all 23
2,380 to 2,911 thousand VND during 2012-2016, about 5.16% per year. Average expenditure increased from 2,218 to 2,712 thousand VND over the same period, with an average growth rate of 5.15% per year, which approximates to the growth rate of per capita income. As such, increasing income and expenditure are necessary for household poverty reduction.
Figure 1.1. 1. Average income and expenditure (thousand VND/per/month)
2380
2911
2218
2712
0
500
1000
1500
2000
2500
3000
3500
2012 2016 2012 2016
Average income
Average expenditure
Source: Calculation by research team using VHLSS data
Figure 1.1. 2. Poverty rate by different poverty measures (%)
17.2
12.6
18.115.9
11.8
4.8
9.8
7.0
10.9
9.1
10.5
4.2
0
5
10
15
20
30
2012 2016
Source: Calculation by research team using VHLSS data
The figure shows the poverty rate, regardless of the measurement method in use, declined during 2012-20168. In 2016, the expenditure poverty rate was higher than income poverty rate, but both were lower than the MDP rate. The poverty rate under the new method covers income poor households and part of the multidimensionally poor households with average income below the near poverty line. Therefore, the poverty rate as per the 2016-2020 scheme was higher than the income poverty rate, but lower than the MDP rate. The global MDP rate was only about half of the national MDP rate.
During 2012-2016, the poverty rates fell significantly for income poverty, expenditure poverty as well as MDP. The locally determined poverty rate did not experience a significant decline, mostly due to changes to the national poverty line and local method of identifying poor households. In 2012, poor households
8 The expenditure poverty line by the World Bank and GSO in 2010 (when the methodology for expenditure poverty measurement by the two organizations was updated) was 20.8%, but in 2014 the rate would be 13.5% (Source: World Bank, 2018). Thus, for 2010-2016, the poverty rate under the expenditure poverty line fell by about 11% - an impressive decline in the context of an economy faced with many challenges that led to slower economic growth.
24 Multidimensional poverty in Viet Nam
were identified based on income poverty, while in 2016 it was based on income poverty line and MDP criteria. Therefore, the poverty rates determined by local authorities cannot be compared over time. The global MDP rate fell only slightly, as the criteria are very low compared to Vietnamese living standards and the impacts of policies and programmes did not help reduce this group of indicators.
Considerable differences exist among poverty measures
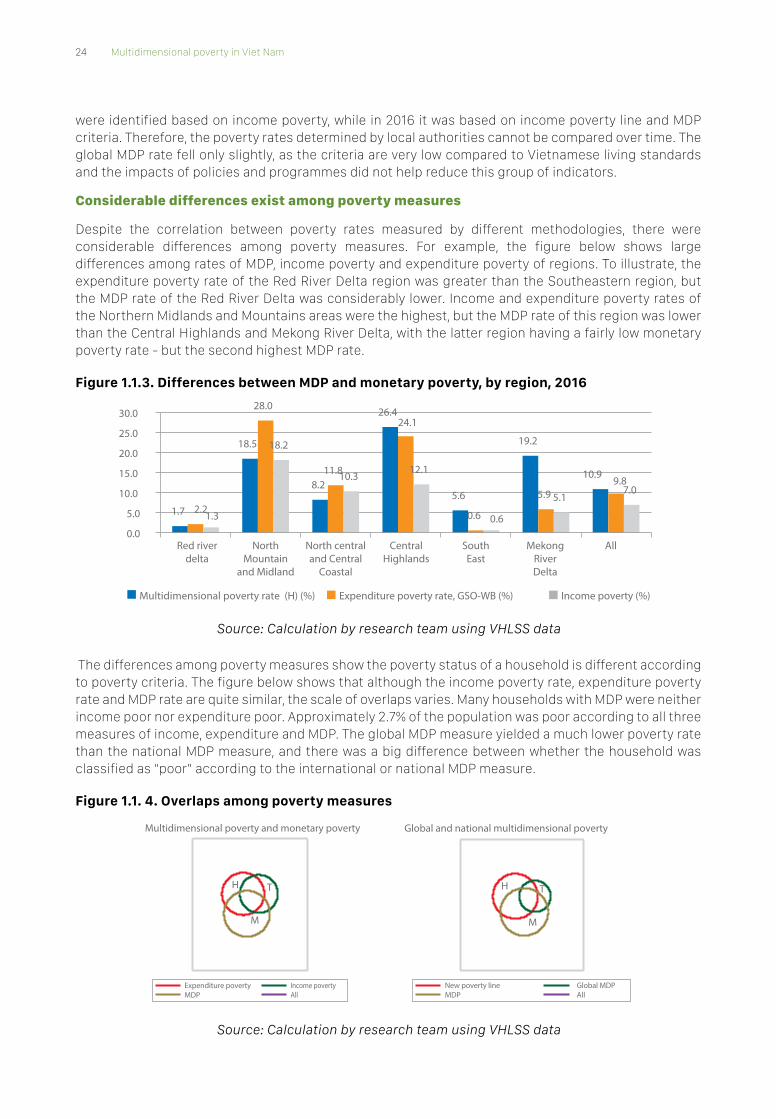
Despite the correlation between poverty rates measured by different methodologies, there were considerable differences among poverty measures. For example, the figure below shows large differences among rates of MDP, income poverty and expenditure poverty of regions. To illustrate, the expenditure poverty rate of the Red River Delta region was greater than the Southeastern region, but the MDP rate of the Red River Delta was considerably lower. Income and expenditure poverty rates of the Northern Midlands and Mountains areas were the highest, but the MDP rate of this region was lower than the Central Highlands and Mekong River Delta, with the latter region having a fairly low monetary poverty rate - but the second highest MDP rate.
Figure 1.1.3. Differences between MDP and monetary poverty, by region, 2016
1.7
18.5
8.2
26.4
5.6
19.2
10.9
2.2
28.0
11.8
24.1
0.6
5.9 9.8
1.3
18.2
10.3 12.1
0.6
5.1 7.0
0.0
5.0
10.0
15.0
20.0
25.0
30.0
Red riverdelta
NorthMountain
and Midland
North centraland Central
Coastal
SouthEast
CentralHighlands
MekongRiverDelta
All
Multidimensional poverty rate (H) (%) Expenditure poverty rate, GSO-WB (%) Income poverty (%)
Source: Calculation by research team using VHLSS data
The differences among poverty measures show the poverty status of a household is different according to poverty criteria. The figure below shows that although the income poverty rate, expenditure poverty rate and MDP rate are quite similar, the scale of overlaps varies. Many households with MDP were neither income poor nor expenditure poor. Approximately 2.7% of the population was poor according to all three measures of income, expenditure and MDP. The global MDP measure yielded a much lower poverty rate than the national MDP measure, and there was a big difference between whether the household was classified as “poor” according to the international or national MDP measure.
Figure 1.1. 4. Overlaps among poverty measures
H T
M
Expenditure povertyMDP
Income povertyAll
Multidimensional poverty and monetary poverty
H T
M
New poverty lineMDP
Global MDPAll
Global and national multidimensional poverty
Source: Calculation by research team using VHLSS data

Reducing poverty in all its dimensions to ensure a good quality life for all 25
By quintile, even among the rich and near-rich groups, many households were in MDP and income poverty. In general, the correlation between income poverty and expenditure poverty is higher than between income (or expenditure) poverty than MDP. In other words, money was not entirely spent on tackling deprivations.
Figure 1.1. 5. Income poverty and MDP rates, by expenditure quintile
28.7
4.0
1.3 0.5 0.3
7.0
34.4
11.2
5.6
2.7
0.6
10.9
0
5
10
15
20
25
30
35
40
Poorest
Near poorest
Middle Near richest
Richest
All
Income poverty and MDP rates, by expenditure quintile
Tỷ lệ nghèo thu nhập (%) Tỷ lệ nghèo đa chiều
Source: Calculation by research team using VHLSS data
The next section focuses on the analysis of MDP dimensions as well as MDP of different population groups disaggregated by geographic regions, ethnicities and household head characteristics.
1.1.3 Deprivation by dimensions and indicators of well-being
Despite much progress, deprivation remains significant in the indicators for sanitation and adult education.
This section presents a detailed analysis of multiple dimensions of deprivation. The figure below displays the proportions of people living in households who experienced deprivations in poverty dimensions. With the exception of adult education, incidences of deprivation in all national MDP indicators fell during 2012-2016. The access to healthcare indicator improved significantly thanks to the strengthened universal health insurance policy. Deprivation in access to information dramatically dropped thanks to development of mobile phones and the internet. Housing and sanitation conditions also improved, but at a slow pace. Currently, the most severe deprivation is in indicators for hygienic latrines and adult education, with a very low level of access to healthcare services. Nevertheless, this indicator was measured by the proportion of people who were sick and did not make a medical visit, which may not accurately reflect the deprivation in healthcare access. In reality, the distance between home and medical facilities is considerably large in remote and mountainous areas, and medical services in major hospitals are frequently impeded by overloading.
It should be noted that indicators are calculated at household level, so the deprivation level of an individual in a household can affect the household’s assessment. For example, the proportion of households with insufficient healthcare coverage will be much higher than the proportion of uninsured, as only one uninsured member in a household is enough to categorize that household as having insufficient access to health insurance. According to VHLSS 2016, the proportion of population without health insurance was 22%, however, the proportion of households with insufficient health insurance was 42.3%.

26 Multidimensional poverty in Viet Nam
Figure 1.1.6. Proportion of population deprived in national MDP indicators (%)
14.0
4.4 6.0
61.7
8.7 10.3 8.7
18.7 13.1
6.8
14.5
2.8 1.4
42.3
6.8 8.3 7.4
17.3
4.7 3.0
0
10
20
30
40
50
60
70
Adulteducation
SchoolAttendance
Access tohealthcare
HealthInsurance
Housingquality
Housingarea
Safewater
Hygieniclatrine
Use ofcommunication
services
Asser to accessto
information
2012 2016
Source: Calculation by research team using VHLSS data
Significant differences in proportions of deprived population among dimensions and population groups
The proportions of deprived population also vary by household group. The figure below shows the proportions of population who experienced deprivations in MDP indicators for multidimensionally poor households across regions and expenditure groups. Large proportions of multidimensionally poor households in the Central Highlands were deprived in education, health insurance and sanitation indicators. Richer regions such as the Red River Delta, South East and Mekong River Delta tended to be deprived in health insurance. However, the poorest regions such as the Central Highlands and the North had little deprivation in health insurance. This is due to the provision of free health insurance cards to poor and ethnic minorities more concentrated in the Central Highlands and Northern Mountains.
Figure 1.1.7: Proportions of multidimensionally poor households, by deprivation dimension and geographical region, 2016
0
20
40
60
80
100
Adult education
School attendance
Access to health
Health insurance
Housing quality
Housing area
Drinking water
Hygienic latrine
Use of communicationservices
Asset to accessinformation
Red River Delta North Mountain and Midland
North Central and Central Coastal Central Highlands
South East Mekong River Delta
Source: Calculation by research team using VHLSS data

Reducing poverty in all its dimensions to ensure a good quality life for all 27
By expenditure group, the poorest groups as expected were most deprived in a number of indicators, especially education, housing quality and sanitation. However, a larger proportion of multidimensionally poor households in the second and third expenditure quintiles were deprived in health insurance coverage. This group of households also had a high level of deprivation in sanitation and education, but the depriviation is lower than the lowest expenditure group.
Figure 1.1.8: Proportion of multidimensionally poor households, by deprivation dimension and expenditure quintile 2016
Adult education
School attendance
Access to health
Health insurance
Housing quality
Housing area
Drinking water
Hygienic latrine
Use of communicationservices
Asset to accessinformation
0
20
40
60
80
100
Poorest Near poorest Middle Near richest Richest
Source: Calculation by research team using VHLSS data
Box 1.1.2. Development of the internet in Viet Nam
On 19 November 1997, the internet was officially offered to the public in Viet Nam. VNPT and Netnam were the first enterprises to provide internet services, then on prevailing landline network infrastructure with limited speed.
In 1999, internet service providers were allowed to test basic internet-based technologies, telephone services and other services. Viet Nam Internet Network Information Centre (VNNIC) was established one year later.
In 2003, ADSL broadband internet (MegaVNN) was officially introduced to the market. This internet access service was provided through ADSL broadband technology, which enabled users to access high-speed internet and use other services such as telephone and fax, simultaneously. In the same year, the costs of internet and telephone dropped dramatically (by 10-40%), which sharply boosted demand.
In 2009, FTTH Internet cable was officially launched with a significant increase in network access speed compared to ADSL. At the same time, VinaPhone launched the first 3G network, opening the era of mobile internet in Viet Nam. This was considered an important step forward for the future boom in mobile broadband internet in Viet Nam.
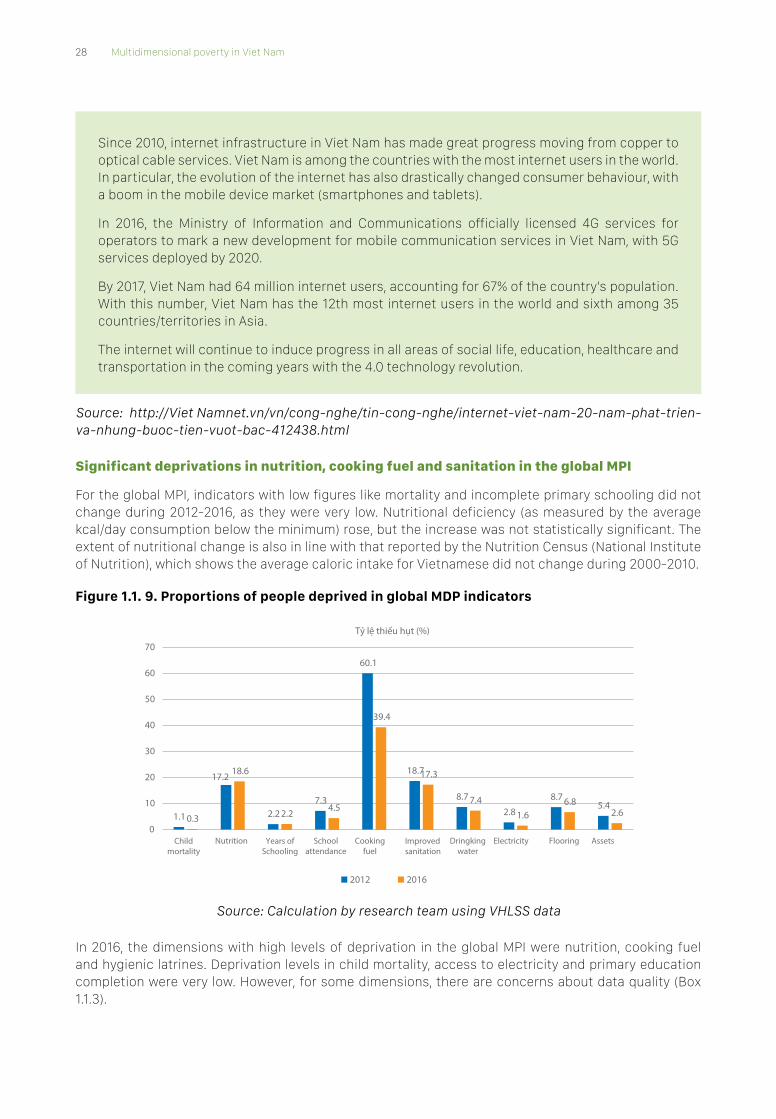
28 Multidimensional poverty in Viet Nam
Since 2010, internet infrastructure in Viet Nam has made great progress moving from copper to optical cable services. Viet Nam is among the countries with the most internet users in the world. In particular, the evolution of the internet has also drastically changed consumer behaviour, with a boom in the mobile device market (smartphones and tablets).
In 2016, the Ministry of Information and Communications officially licensed 4G services for operators to mark a new development for mobile communication services in Viet Nam, with 5G services deployed by 2020.
By 2017, Viet Nam had 64 million internet users, accounting for 67% of the country’s population. With this number, Viet Nam has the 12th most internet users in the world and sixth among 35 countries/territories in Asia.
The internet will continue to induce progress in all areas of social life, education, healthcare and transportation in the coming years with the 4.0 technology revolution.
Source: http://Viet Namnet.vn/vn/cong-nghe/tin-cong-nghe/internet-viet-nam-20-nam-phat-trien-va-nhung-buoc-tien-vuot-bac-412438.html
Significant deprivations in nutrition, cooking fuel and sanitation in the global MPI
For the global MPI, indicators with low figures like mortality and incomplete primary schooling did not change during 2012-2016, as they were very low. Nutritional deficiency (as measured by the average kcal/day consumption below the minimum) rose, but the increase was not statistically significant. The extent of nutritional change is also in line with that reported by the Nutrition Census (National Institute of Nutrition), which shows the average caloric intake for Vietnamese did not change during 2000-2010.
Figure 1.1. 9. Proportions of people deprived in global MDP indicators
1.1
17.2
2.2 7.3
60.1
18.7
8.7
2.8
8.7 5.4
0.3
18.6
2.2 4.5
39.4
17.3
7.4
1.6 6.8
2.6
0
10
20
30
40
50
60
70
Childmortality
Nutrition Years ofSchooling
Schoolattendance
Cookingfuel
Improvedsanitation
Dringkingwater
Electricity Flooring Assets
Tỷ lệ thiếu hụt (%)
2012 2016
Source: Calculation by research team using VHLSS data
In 2016, the dimensions with high levels of deprivation in the global MPI were nutrition, cooking fuel and hygienic latrines. Deprivation levels in child mortality, access to electricity and primary education completion were very low. However, for some dimensions, there are concerns about data quality (Box 1.1.3).

Reducing poverty in all its dimensions to ensure a good quality life for all 29
Box 1.1.3. Data quality to measure indicators of water use and hygienic latrine use in MDP has several pitfalls
The MDP line was approved by the government and officially applied during 2016-2020. Two important dimensions of the MDP line are the use of clean water and hygienic latrines. Currently, the calculation of poverty rates according to the MDP approach is carried out by MOLISA based on administrative reporting systems at different levels and by GSO based on data from VHHLS surveys. However, the quality of data on households using clean water and hygienic latrines is of concern and directly affects the results of poverty rate calculations.
The definition of ‘hygienic water’ according to Ministry of Health (QCVN 01: 2009/BYT) regula-tions includes 21 biochemical indicators that cannot be identified by local officials without nec-essary equipment and capacity-building training. In addition, the definition of hygienic latrines by the Ministry of Health also includes the following criteria: the latrine has separate tanks to contain human waste, the upper part of the latrine must be clean and easy to clean, the waste tank or discharge area should be at least 10 metres from the water source, must ensure privacy and protect the user from external weather factors, a water tap and soap for handwashing are necessary.
Based on the definitions of ‘hygienic water’ and ‘latrines’, the MOLISA’s calculation based on re-sults reported at grassroots level and commune statistics are unlikely to be of high quality due to limited and inconsistent capacity of local staff, as well as the lack of measuring equipment and large number of households in each commune/ward. On the other hand, if VHLSS data is to be relied upon, only information on the types of latrines and water used by the household is provided. However, only using this basic information to determine which water source or toilet is hygienic makes the assessment subjective, which leads to large errors. Therefore, poverty rate calculations in accordance with the current MDP approach may be inaccurate and underesti-mated as measurements of the two indicators of clean water and hygienic latrines generated better results than reality.
To justify this observation, the report used data from the World Bank’s Baseline Survey of the Rural Water Supply and Sanitation Project in eight Red River Delta provinces. The project base-line survey was conducted by experts who used standardized measuring equipment. The results from the baseline survey were compared against those from the reporting system (monitoring and evaluation) conducted by commune-level health staff. Table 1.1.2 shows that the percent-age of households with hygienic latrines recorded by the baseline survey was much lower than presented by the reporting system of commune-level healthcare staff. On the other hand, the number of water supply systems that met standards was also less than reported by provinces. This shows that even water supply facilities are not always up to standard, which clearly demon-strates the calculation of MDP rates based on two main sources of data from MOLISA and GSO is likely to provide lower poverty estimates than reality, which may affect the identification of beneficiaries for the water and sanitation programme for the poor.

30 Multidimensional poverty in Viet Nam
Table 1.1.2: Comparison results between Baseline Survey and Monitoring and Evaluation Report
Province
Tota
l num
ber
of s
ur-
veye
d h
ouse
hol
ds
% o
f h
ouse
hol
ds
wit
h
hygi
enic
latr
ines
(BLS
)
% o
f h
ouse
hol
ds
wit
h
hygi
enic
latr
ines
(M&
E)
% o
f sc
hoo
ls w
ith
hy-
gien
ic la
trin
es (B
LS)
% o
f sc
hoo
ls w
ith
hy-
gien
ic la
trin
es (M
&E)
% o
f h
ealt
h c
linic
s w
ith
hy
gien
ic la
trin
es (B
LS)
% o
f h
ealt
h c
linic
s w
ith
hy
gien
ic la
trin
es (M
&E)
Num
ber
of s
urve
yed
wat
er s
uppl
y fa
cilit
ies
Num
ber
of w
ater
sup
ply
faci
litie
s el
igib
le f
or
disb
urse
men
t
Bac Ninh 90 51.4 77.0 76.2 100.0 66.7 100.0 8 2
Ha Nam 105 45.2 54.6 71.4 80.0 71.4 85.7 6 6
Ha Noi 390 72.6 74.9 82.6 89.8 76.0 84.6 2 1
Hung Yen 150 55.0 49.5 68.2 39.5 60.0 40.0 5 3
Phu Tho 240 34.1 52.6 56.5 76.2 37.5 93.8 3 1
Quang Ninh 120 47.7 70.7 66.7 100.0 50.0 100.0 10 2
Thanh Hoa 570 36.3 35.0 54.1 80.3 47.4 92.1 0 0
Vinh Phuc 135 26.5 52.5 69.6 50.0 55.6 88.9 3 1
Source: Baseline Survey: Red River Delta Water and Sanitation Project
Considering the entire population, 18% was not deprived in any of the 10 MDP indicators in 2012. This proportion grew significantly in 2016, standing at 36.1%. In other words, about 61.9% of the population in 2016 faced deprivations in at least one MDP indicator. No household had deprivations in eight or more indicators. Only 37.6% of the population suffered from one type of deprivation and 15.5% faced two types of deprivations in 2016. ‘Severe deprivation’ is defined as deprivation in five to seven indicators, which accounted for 1.8% of the population in 2016.
Figure 1.1. 10. Distribution by number of deprivation indicators (%)
18.0
36.1
42.6
37.6
21.3
15.5
10.0
6.14.8 2.93.3 1.8
0%
10%
20%
30%
40%
50%
60%
70%
80%
90%
100%
2012 2016
Deprived in 5-7 indicators
Deprived in 4 indicators
Deprived in 3 indicators
Deprived in 2 indicators
Deprived in 1 indicators
No Deprivation
Source: Calculation by research team using VHLSS data

Reducing poverty in all its dimensions to ensure a good quality life for all 31
Using the Alkire-Foster (2011) method, this report estimated the intensity of deprivation or the average number of deprivation indicators in the 10 indicators for MDP. A household is regarded as multidimensionally poor if its deprivation score is more than 0.3, or the number of deprivation indicators is greater than 3. The left figure 1.1.11 below shows the deprivation scores of MDP. For example, in 2012 the national MDP deprivation score of 0.371 meant the multidimensionally poor had an average deprivation score of 0.317 or a 31.7% deprivation in MDP indicators. The deprivation score ranged from 0 (not deprived in any indicator) to 1 (deprived in all component indicators).
The deprivation intensity of national and global MDP decreased slightly during 2012-2016, indicating the multidimensionally poor of 2016 had less severe deprivations than the multidimensionally poor of 2012. Although the poverty rate according to the global MDP line was lower than the national one, the deprivation intensity according to the global MDP method was higher.
The MPI was calculated using the Alkire-Foster method as a product of the headcount ratio H and Poverty Intensity A (average deprivation score of multidimensionally poor people). Results show the national MPI fell sharply during 2012-2016. The international MPI also fell, but with less intense declines.
Figure 1.1. 11. Deprivation and MPI (%)
0.371 0.365
0.399
0.382
0.340
0.360
0.380
0.400
0.420
2012 2016 2012 2016National multidimensional
povertyGlobal multidimensional
povertyNational multidimensional
povertyGlobal multidimensional
poverty
Deprivation score
0.067
0.040
0.019 0.016
0.000
0.020
0.040
0.060
0.080
2012 2016 2012 2016
Multidimensional Poverty Index
Source: Calculation by research team using VHLSS data
The Alkire-Foster method (2011) allows us to analyze how the deprivation intensity of indicators and components contributes to the overall MPI. This decomposition analysis sheds light onto the causes of MDP, revealing how improvements to which indicators and dimensions would lead to greater poverty reduction. The following figure shows the contribution percentage of each indicator to the MPI in 2012 and 2016. The indicators on schooling, access to healthcare, communication and information reduced their contributions to overall MDP during this period. The other indicators increased their contributions to overall MDP. In 2016, adult education contributed up to 16% to overall MPI and access to hygienic latrines made the highest contribution, up to 22%. The dimensions of healthcare service access and school attendance had the lowest levels of contribution.

32 Multidimensional poverty in Viet Nam
Figure 1.1. 12. Contribution of indicators to MPI
Adulteducation
SchoolAttendance
Access tohealthcare
HealthInsurance
Housingquality
Housingarea
Safewater
Hygieniclatrine
Use ofcommunication
services
Asser to accessto
information
13.0%
4.5%
4.5%
16.0%
9.0%
8.7%
8.3%
16.4%
12.2%
7.5%
16.1%
3.7%
0.8%
13.0%
10.9%
10.2% 11.3%
21.8%
6.2%
6.0%
.00%
5.00%
10.00%
15.00%
20.00%
25.00%
Education Healthcare Housing Living conditions Access to information
2012 2016
Source: Calculation by research team using VHLSS data
The figure 1.1.13 displays the contribution of five dimensions to the national MPI. In 2012, the five dimensions made fairly equal contributions. In 2016, deprivation in living standards accounted for up to 33% of the MPI. Access to information and healthcare made the lowest contributions to the MPI.
Figure 1.1. 13. Contribution of poverty indicators to MPI
2012 2016
Living conditions
Access to information
2012 2016
17.5%
20.5%
17.7%
24.7%
19.6% Education
Healthcare
Housing
19.8%
13.8%
21.1%
33.1%
12.3%
Source: Calculation by research team using VHLSS data
Reducing poverty in all its dimensions to ensure a good quality life for all 33
Box 1.1.4. Learning achievement significantly improved between cohorts, but differences among student groups remain: Evidence from the research project “Young Lives”
The research project “Young Lives” gathers information about children’s learning achievements through vocabulary and maths tests. Of the children aged 15 who answered all comparable math questions at correctly, girls performed better than boys (3% and 6% differences for 2016 and 2009, respectively). There was no significant difference in girls’ and boys’ performances in the vocabulary test. In both tests, the greatest differences in performance were between children from ethnic minority groups and the Kinh majority (19% and 12% differences in average scores in maths and vocabulary, respectively) and between children whose caregivers have no schooling and those whose caregivers have completed lower secondary school (26% and 15% differences in average scores in maths and vocabulary, respectively). It is noteworthy that scores for children, whose caregiver had between one and four years schooling, showed significant differences from those whose caregivers had no schooling (an 11-point difference in average maths scores).
In 2009 and 2016, 15-year-olds’ ability in maths was tested in terms of three comparable questions: (1) two-digit division, (2) reading a pie chart and (3) solving a problem. The results showed a general improvement, as 15-year-olds in 2016 (38%) were more likely to answer all three questions correctly compared to 15-year-olds in 2009 (35%). Similarly, the average number of comparable questions answered correctly by younger cohort children in 2016 increased compared to the older cohort in 2009. Caregivers’ level of education is strongly associated with children’s scores: 51% of children whose caregivers completed lower secondary level and above answered the three selected questions correctly in 2016, compared to only 16% of children with caregivers with no schooling. The greatest improvement occurred in the first two questions rather than the one related to problem-solving, as 49% of children were able to answer it correctly in 2009 and 2016. For this question, children living in the wealthiest households and those in urban areas performed best, with 60% and 64%, respectively having answered correctly in 2016.
Source: Young Lives (2017)
1.1.4 Multidimensional poverty among population groups
Poverty by sex and age
Poverty is measured at the household level, so poverty rates are similar for men and women. However, the poverty rate varies by sex of the household head. The poverty rate for female-headed households is generally lower than for male-headed households, likely explained by demographic differences. Female-headed households are usually subject to an absence of husbands due to death or migration. The poverty rate is often low in small-sized households. If the husband is not in the household due to migration, he may send money to his family and contribute to income generation and poverty reduction for the household.

34 Multidimensional poverty in Viet Nam
Figure 1.1. 14. Poverty rate by sex of household head (%)
18.2
10.7
13.4
7.4
18.5
11.2
13.5
6.6
9.6
5.3
16.7
9.7
.00
2.004.00
6.00
8.00
10.00
12.00
14.00
16.00
18.00
20.00
VHLSS 2012 VHLSS 2016 VHLSS 2012 VHLSS 2016 VHLSS 2012 VHLSS 2016
Expenditure poverty Income poverty Multidimensional poverty
Male head Female head
Source: Calculation by research team using VHLSS data
The multidimensional and unidimensional poverty rates vary significantly by age because the household demographic characteristics have considerable influence on a household’s poverty status. Households with numerous dependents, such as children and the elderly, are likely to have lower income and higher poverty rates. Individuals under the age of 30 or over 70 years have a higher prevalence of MDP than adults aged 30-70 years. However, at any age, the MDP rate decreased during 2012-2016.
Income and expenditure poverty by age shared a similar trend with MDP. Interestingly, after the age of 55 the MDP, income and expenditure poverty rates were quite close, while the 20-35 age group income poverty and expenditure poverty rates were higher than MDP. This suggests that although incomes in the 20-35 age range were relatively high, they were not spent to address deprivations.
Figure 1.1.15. MDP rate by age, 2012-2016
0
5
10
15
20
25
30
0 2 4 6 8 10 12 14 16 18 20 22 24 26 28 30 32 34 36 38 40 42 44 46 48 50 52 54 56 58 60 62 64 66 68 70 72 74 76 78 80+
Tỷ lệ
ngh
èo đ
a ch
iều
(%)
Age 2012 2016
Source: Calculation by research team using VHLSS data

Reducing poverty in all its dimensions to ensure a good quality life for all 35
Figure 1.1.16. Income poverty rate, expenditure poverty rate and MDP rate by age, 2016
0
2
4
6
8
10
12
14
16
18
200 2 4 6 8 10 12 14 16 18 20 22 24 26 28 30 32 34 36 38 40 42 44 46 48 50 52 54 56 58 60 62 64 66 68 70 72 74 76 78 80+
Age Expenditure poverty Multidimensional poverty Income poverty
Source: Calculation by research team using VHLSS data
Box 1.1.5. Multidimensional child poverty
The figure above shows that the poverty rate, regardless of the measure in use, tends to be higher among children under 16, although poverty was measured for the whole household. This reflects that poor households usually have more children than non-poor households. In addition, children have different needs from adults. The United Nations also points out that child poverty is not just about deprivation in income or expenditure, but also deprivations in a range of basic needs that prevent them from fully realizing their rights as defined in the United Nations Convention on the Rights of the Child. Children have different needs than those of adults, so a general measure of household poverty cannot adequately reflect the dimensions of child poverty and deprivation. UNICEF (2018) found that there was a significant proportion of children in non-poor households according to expenditure poverty line or MDP criteria who did not attend school or accessed health services. UNICEF (2018) proposes the multidimensional child poverty measurement with eight basic needs (dimensions) in (i) education, (ii) health, (ii) nutrition, (iv) housing, (v) clean water and sanitation, (vi) (protection from) early labour, (vii) recreation, and (viii) social recognition and protection. This method also allows for determining the level of child deprivation in each indicator of each dimension.
Higher poverty rates among ethnic minority groups compared to Kinh
This report disaggregated data by ethnic group for those with more than 100 observations (households). Ethnic minority groups with less than 100 observations were grouped into the “others” category. A degree of caution is needed with regards comparisons of poverty rates among ethnic groups due to sampling errors. Calculations account for standard errors to check whether differences in poverty rates among the ethnic groups are statistically significant. The results show that income poverty declined sharply across all major ethnic groups from 2012-2016, with the exception of the H’Mong group with a smaller decline. Ethnic minorities in the “others” group had less poverty, but a lower poverty reduction rate. In 2016, the Kinh population had a poverty rate of 2.9%, much lower than for ethnic minorities in general.

36 Multidimensional poverty in Viet Nam
Figure 1.1. 17. Income poverty rate by ethnic group (%)
6.9
30.8
55.2
24.1 31.3 31.2
76.5
59.6
40.5
2.9
14.5
26.3
7.9 13.6 16.3
65.9
28.4 28.1
.00
10.00
20.00
30.00
40.00
50.00
60.00
70.00
80.00
90.00
Kinh Tày Thái Khmer Mường Nung H'Mong Dao Others
2012 2016
Source: Calculation by research team using VHLSS data
Similar to income poverty, MDP also declined among all ethnic groups during 2012-2016. Kinh, Muong and Tay had the lowest MDP rates. Dao, H’Mong and “other” ethnic minority groups had the highest MDP rates. Income poverty and MDP were strongly correlated.
Figure 1.1. 18. MDP rate by ethnic group
12.8
27.5
51.6 43.4
23.6 32.3
88.7
56.2 48.2
6.4 11.9
23.7 24.0
7.3 12.9
76.2
37.5 43.4
.00
10.00
20.00
30.00
40.00
50.00
60.00
70.00
80.00
90.00
100.00
Kinh Tày Thái Khmer Mường Nung H'Mong Dao Other
2012 2016
Source: Calculation by research team using VHLSS data
The figure below shows the average deprivation scores (out of 10 indicators) for the entire population (including poor and non-poor) by ethnic group. The number of deprivation indicators fell from 1.5 in 2012 to 1.1 in 2016, by around 25%. The intensity of deprivation decreased in all ethnic groups. In 2016, the deprivation score for the Hmong was high, followed by the Dao ethnic minority group.

Reducing poverty in all its dimensions to ensure a good quality life for all 37
Figure 1.1. 19. Number of deprivation indicators by ethnic group
1.3 1.8
2.9 2.4
1.8 1.9
4.3
2.9 2.6
1.5 0.9 1.0
1.7 1.6 1.1 1.2
3.5
2.1 2.3
1.1
00
01
02
03
04
05
Kinh Tay Thai Khmer Muong Nung H'Mong Dao Other Total
2012 2016
Source: Calculation by research team using VHLSS data
The figure below shows the intensity of deprivation (measured by average deprivation score) of households in MDP and the MPI. The intensity of deprivation of the poor did not differ much among ethnic groups. The Hmong poor minority and other ethnic minority groups had the highest deprivation scores. Among the Kinh group, despite having the lowest MDP rate, the Kinh MPI poor did not have the smallest deprivation score. The lowest deprivation scores were for the Khmer and Nung.
The MPI of ethnic groups decreased during 2012-2016, with Muong, Nung, Tay and Thai ethnic minorities experiencing significant reductions. In 2016, the lowest MPI was for Kinh, followed by Muong, Nung and Tay. The highest MDP rate was among the Hmong and other small groups.
Figure 1.1. 20. Deprivation score and MPI by ethnic group
Deprivation score MPI
0.4 0.4
0.4 0.4 0.4
0.3
0.5
0.4 0.4
.00
.0500
.100
.1500
.200
.2500
.300
.3500
.400
.4500
.500
Kinh Tay Thai Khmer Muong Nung H'Mong Dao Other
2012 2016
0.045
0.096
0.212
0.167
0.088
0.111
0.406
0.222 0.191
0.022 0.042
0.089 0.078
0.028 0.042
0.310
0.133 0.175
.000
.050
.100
.150
.200
.250
.300
.350
.400
.450
Kinh Tay Thai Khmer Muong Nùng H'Mong Dao Other
2012 2016
Source: Calculation by research team using VHLSS data
The figure below shows the contributions of ethnic groups to the national MPI. The Kinh made the biggest contribution as a group to account for 85% of the population. However, the contribution declined considerably during 2012-2016, suggesting the Kinh’s poverty reduction rate was higher than the average for ethnic minority groups. The contribution of Hmong and “other” minority groups in the national MPI increased, reflecting lower rates of poverty reduction among these groups.
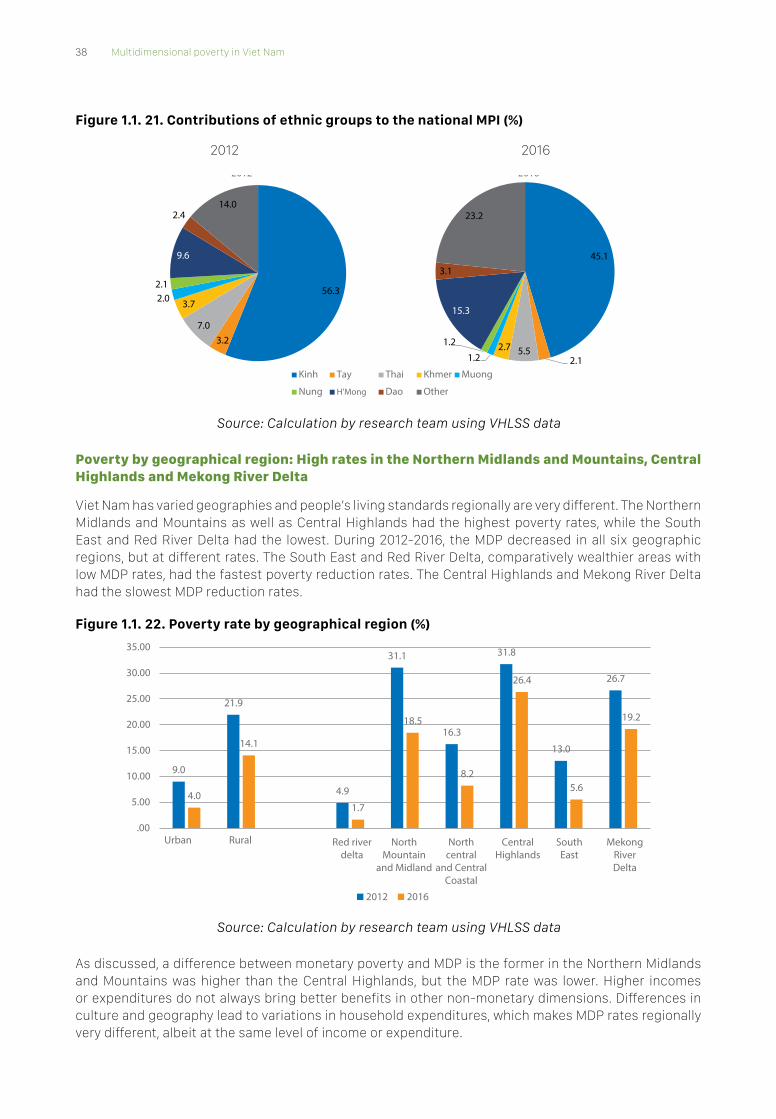
38 Multidimensional poverty in Viet Nam
Figure 1.1. 21. Contributions of ethnic groups to the national MPI (%)
2012 2016
2012 2016
56.3
3.2 7.0
3.7 2.0 2.1
9.6
2.4 14.0
45.1
2.1 5.5 2.7
1.2
1.2
15.3
3.1
23.2
Kinh Tay Thai Khmer Muong
Nung H'Mong Dao Other
Source: Calculation by research team using VHLSS data
Poverty by geographical region: High rates in the Northern Midlands and Mountains, Central Highlands and Mekong River Delta
Viet Nam has varied geographies and people’s living standards regionally are very different. The Northern Midlands and Mountains as well as Central Highlands had the highest poverty rates, while the South East and Red River Delta had the lowest. During 2012-2016, the MDP decreased in all six geographic regions, but at different rates. The South East and Red River Delta, comparatively wealthier areas with low MDP rates, had the fastest poverty reduction rates. The Central Highlands and Mekong River Delta had the slowest MDP reduction rates.
Figure 1.1. 22. Poverty rate by geographical region (%)
Red riverdelta
NorthMountain
and Midland
Northcentral
and CentralCoastal
SouthEast
CentralHighlands
MekongRiverDelta
9.0
21.9
4.9
31.1
16.3
31.8
13.0
26.7
4.0
14.1
1.7
18.5
8.2
26.4
5.6
19.2
.00
5.00
10.00
15.00
20.00
25.00
30.00
35.00
Urban Rural
2012 2016
Source: Calculation by research team using VHLSS data
As discussed, a difference between monetary poverty and MDP is the former in the Northern Midlands and Mountains was higher than the Central Highlands, but the MDP rate was lower. Higher incomes or expenditures do not always bring better benefits in other non-monetary dimensions. Differences in culture and geography lead to variations in household expenditures, which makes MDP rates regionally very different, albeit at the same level of income or expenditure.

Reducing poverty in all its dimensions to ensure a good quality life for all 39
Figure 1.1. 23: Expenditure poverty rate and income poverty rate, 2016 (%)
Red riverdelta
North Mountainand Midland
North centraland Central Coastal
SouthEast
CentralHighlands
MekongRiver Delta
2.2
28.0
11.8
24.1
0.6
5.9
1.3
18.2
10.3 12.1
0.6
5.1
.00
5.00
10.00
15.00
20.00
25.00
30.00
Income poverty rate Expenditure poverty rate
Source: Calculation by research team using VHLSS data
In terms of the overall MPI, the Mekong River Delta and the Northern Midlands and Mountains had the highest contributions as the poverty rates and populations of these regions were quite high compared to others. The Central Highlands had a lower contribution to the MPI than the Northern Mountains due to its smaller population. However, the Central Highlands’ contribution to the MPI has increased significantly over time, reflecting a much lower rate of poverty reduction in the Central Highlands than other parts of the country.
Figure 1.1. 24. Contribution of geographic regions to the overall MPI (%)
2012 20162012 2016
5.4
25.0
20.4 10.6
10.9
28.2
Red river delta North Mountain and Midland North central and Central Coastal Central Highlands
South East Mekong River Delta
3.0
24.5
17.3
17.2
7.2
30.1
Source: Calculation by research team using VHLSS data
The figure below shows the correlation between the rate and intensity of MDP, as described by the linear regression line between the two variables. In addition, there is a correlation with the economic level measured by per capita expenditure (expressed as the size of a circle with a larger circle indicating higher per capita expenditure). Provinces with lower per capita expenditure tended to have higher rates and intensities of MDP. However, some provinces (such as Ho Chi Minh City) had high average expenditures and low MDP rates, but the intensity of multidimensional deprivations was rather high.

40 Multidimensional poverty in Viet Nam
Figure 1.1. 25: Provinces with moderate and high per capita expenditures with concentrated MDP
Dien Bien Lai Chau
Quang Tri
Binh Dinh
Kon Tum
Binh Duong
Ho Chi Minh
y = 0.0003x + 0.3707 R² = 0.0461
0.30
0.32
0.34
0.36
0.38
0.40
0.42
0.44
0.0 10.0 20.0 30.0 40.0 50.0 60.0 70.0
Mul
tidi
men
sion
al p
over
ty in
tens
ity
(A)
Multidimensional poverty rate (%)
Source: Calculation by research team using VHLSS data
Education and occupation of household head influences poverty status
Education and occupation have a direct impact on the employment and income of the household, and thus affect its poverty status. The MDP rate strongly correlated with the education level of the household head. The MDP rate of households headed by college or university graduates was just under 1%, while those whose heads did not complete primary education was 26.6% by 2016. During 2012-2016, the poverty rate fell for households whose heads had different educational levels. For households whose heads graduated from college or university, the MDP rate was very low and did not change. Estimates increased from 0.3% to 0.7% during this period, but this change was not statistically significant.
Figure 1.1. 26. Poverty rate by education level of household head (%)
38.4
20.2
10.2 5.3
0.3
26.6
12.6
4.6 3.1 0.7
0
5
10
15
20
25
30
35
40
45
Less than primarySchool
Primary Lower secondary Upper secondary College and above
2012 2016
Source: Calculation by research team using VHLSS data
The MDP rate fell among household groups by occupation of household head. Households with heads who worked in agriculture had the highest MDP rate, followed by those with heads engaged in unskilled labour. These groups also achieved poverty reduction during 2012-2016, but the rate was lower than other groups. Households whose heads were clerks, office workers and skilled workers experienced the fastest MDP reduction rates.
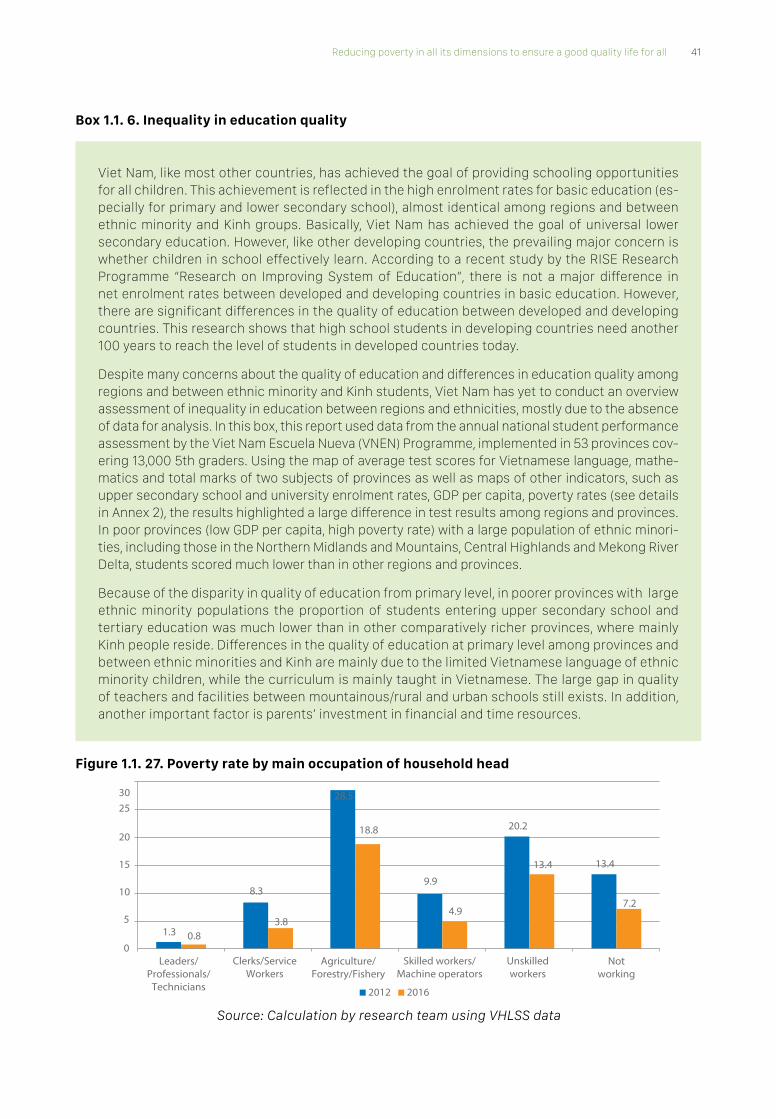
Reducing poverty in all its dimensions to ensure a good quality life for all 41
Box 1.1. 6. Inequality in education quality
Viet Nam, like most other countries, has achieved the goal of providing schooling opportunities for all children. This achievement is reflected in the high enrolment rates for basic education (es-pecially for primary and lower secondary school), almost identical among regions and between ethnic minority and Kinh groups. Basically, Viet Nam has achieved the goal of universal lower secondary education. However, like other developing countries, the prevailing major concern is whether children in school effectively learn. According to a recent study by the RISE Research Programme “Research on Improving System of Education”, there is not a major difference in net enrolment rates between developed and developing countries in basic education. However, there are significant differences in the quality of education between developed and developing countries. This research shows that high school students in developing countries need another 100 years to reach the level of students in developed countries today.
Despite many concerns about the quality of education and differences in education quality among regions and between ethnic minority and Kinh students, Viet Nam has yet to conduct an overview assessment of inequality in education between regions and ethnicities, mostly due to the absence of data for analysis. In this box, this report used data from the annual national student performance assessment by the Viet Nam Escuela Nueva (VNEN) Programme, implemented in 53 provinces cov-ering 13,000 5th graders. Using the map of average test scores for Vietnamese language, mathe-matics and total marks of two subjects of provinces as well as maps of other indicators, such as upper secondary school and university enrolment rates, GDP per capita, poverty rates (see details in Annex 2), the results highlighted a large difference in test results among regions and provinces. In poor provinces (low GDP per capita, high poverty rate) with a large population of ethnic minori-ties, including those in the Northern Midlands and Mountains, Central Highlands and Mekong River Delta, students scored much lower than in other regions and provinces.
Because of the disparity in quality of education from primary level, in poorer provinces with large ethnic minority populations the proportion of students entering upper secondary school and tertiary education was much lower than in other comparatively richer provinces, where mainly Kinh people reside. Differences in the quality of education at primary level among provinces and between ethnic minorities and Kinh are mainly due to the limited Vietnamese language of ethnic minority children, while the curriculum is mainly taught in Vietnamese. The large gap in quality of teachers and facilities between mountainous/rural and urban schools still exists. In addition, another important factor is parents’ investment in financial and time resources.
Figure 1.1. 27. Poverty rate by main occupation of household head
1.3
8.3
28.5
9.9
20.2
13.4
0.8
3.8
18.8
4.9
13.4
7.2
0
5
10
15
20
2530
Leaders/Professionals/
Technicians
Clerks/ServiceWorkers
Agriculture/Forestry/Fishery
Skilled workers/Machine operators
Unskilledworkers
Notworking
2012 2016
Source: Calculation by research team using VHLSS data

42 Multidimensional poverty in Viet Nam
1.1.5 Analysis of poverty dynamics
Rate of escaping poverty significantly higher than that of falling into poverty
Although the poverty rate declined over the 2012-2016 period, the situation of falling back into poverty or vulnerable households falling into poverty persisted. This report used panel data for 2012-2016 to analyze poverty dynamics, with 1,915 households surveyed in VHLSS 2012 and 2016. The figure below shows the proportion of population by poverty status for 2012 and 2016, with 3.4% of the population income-poor in both years, 2.2% falling into poverty and 9.3% having escaped poverty in 2016. The remainder were non-poor households in 2012 and 2016.
The poverty transition trends were relatively similar for households in expenditure poverty, national MDP and global MDP. Relatively, the rate of escaping income poverty was higher than for those escaping expenditure poverty and MDP.
Figure 1.1. 28. MDP status transition 2012-2016 (%)
3.46.6 6.7
1.3
2.2
1.8 2.6
2.5
9.3
11.2 9.4
3.5
0
5
10
15
20
25
Income poverty Expenditure poverty NationalMultidimensional poverty
Global Multidimensionalpoverty
Tỷ lệ
%
Poor in both 2012 & 2016 Fell into poverty in 2016 Escaped poverty in 2012
Source: Calculations of the research team using data from VHLSS
The figure below shows changes in poverty status during 2012-2016 for Kinh and ethnic minorities. The Kinh population escaping poverty accounted for a larger proportion of chronic poor. For ethnic minorities, the proportion of expenditure-poor and chronic multidimensionally poor population was larger than for the population escaping poverty.
Figure 1.1. 29. MDP status transition by ethnic group (2012-2016)
Incomepoverty
Expenditurepoverty
Multidimensionalpoverty
Incomepoverty
Expenditurepoverty
Multidimensionalpoverty
15.4
33.126.8
1.2 1.6 2.9
6.3
5.1
3.8
1.5 1.2 2.4
27.3
27.5
19.4
5.9 8.1 7.6
0
10
20
30
40
50
60
70
Ethnic minotities Kinh
Tỷ lệ
%
Poor in both 2012 & 2016 Fell into poverty in 2016 Escaped poverty in 2012
Source: Calculation by research team using VHLSS data

Reducing poverty in all its dimensions to ensure a good quality life for all 43
An emerging and fast-growing middle-class in the Kinh group
This report divided the population into five groups according to the average expenditure level (according to 2011 purchasing power parity, in US dollars, of the World Bank). These are thresholds used by the World Bank globally to divide the whole population into income groups9. The extreme poverty rate in Viet Nam (below 1.9 USD/day) decreased from 3.1% to 2% during 2012-2016. The percentage of the poor and vulnerable population also decreased. The proportion of the secure and middle-class population grew over the same period. In particular, the Kinh middle-class grew rapidly, with its proportion of population rising from 9.2% in 2012 to 15.4% in 2016.
The rates of extreme poverty, poverty, and vulnerability of the Kinh and ethnic minorities all fell. For ethnic minorities, extreme poverty rates and poverty rates also decreased.
Table 1.1. Error! Bookmark not defined.: Population distribution by income group (USD PPP 2011)
Economic groupsEthnic minorities Kinh Total
2012 2016 2012 2016 2012 2016
Extremely poor (under USD1.9 per day) 16.3 11.5 0.6 0.1 3.1 2.0
Poor (USD1.9 to 3.1 per day) 31.6 25.1 6.0 2.0 10.0 5.9
Vulnerable (USD3.1 to 5.5 per day) 34.1 37.9 29.2 18.5 30.0 21.8
Economically secure (USD5.5 to 15.0 per day) 16.7 22.5 55.1 64.0 49.0 57.0
Middle-class (USD15.0 per day) 1.4 3.0 9.2 15.4 7.9 13.3
Total 100 100 100 100 100 100
Note: USD exchange rate was calculated in purchasing power parity in 2011.Source: Calculation by research team using VHLSS data
Using panel data, the level of population transition according to economic status during 2012-2016 was analyzed. The extremely poor population managed to improve its economic situation during this period, with 21.7% of the extremely poor in 2012 not able to improve their income in 2016, 35.6% of the extremely poor in 2012 moved to the poor group and 28.4% of the extremely poor moved to the vulnerable group in 2012. Remarkably, 11.1% and 3.3% of the “extremely poor” in 2012 moved up to the “economically secure” and “middle-income” groups, respectively, by 2016. For the poor population group in 2012, 8.7% fell into extreme poverty in 2016. In general, the population suffering from economic decline in this period was not significant.
9 Source: World Bank (2018).
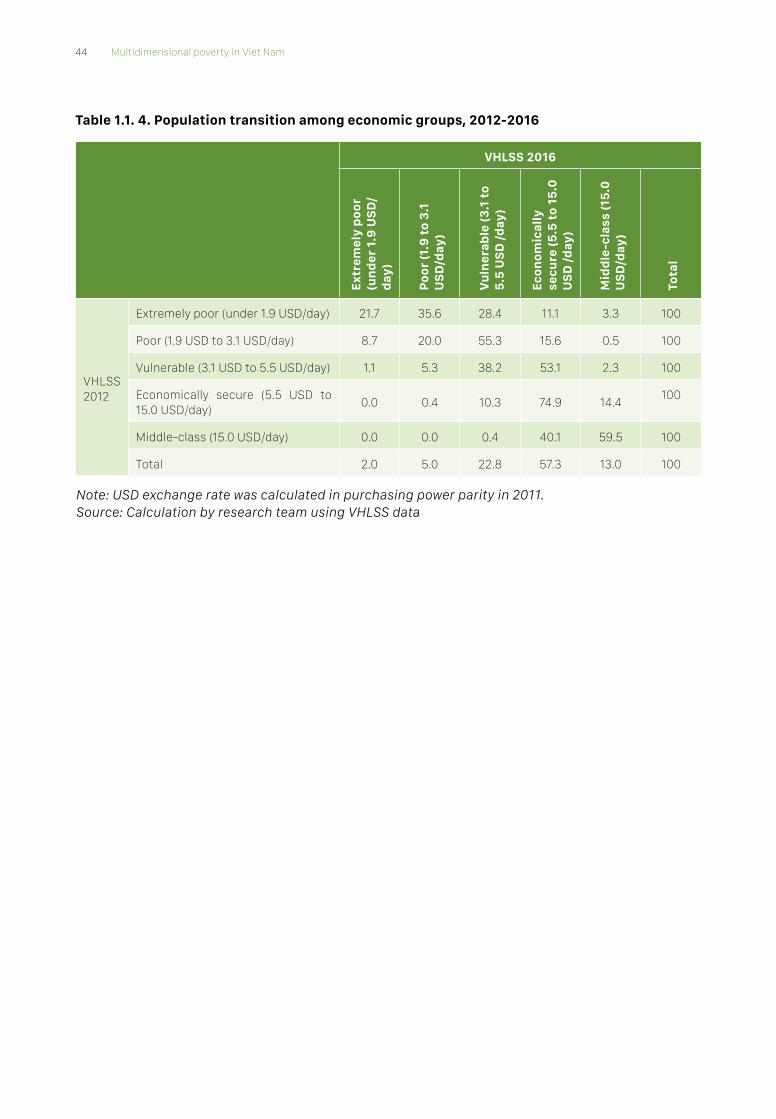
44 Multidimensional poverty in Viet Nam
Table 1.1. 4. Population transition among economic groups, 2012-2016
VHLSS 2016
Extr
emel
y po
or
(und
er 1
.9 U
SD
/da
y)
Poor
(1.9
to
3.1
US
D/d
ay)
Vul
nera
ble
(3.1
to
5.5
US
D /d
ay)
Econ
omic
ally
se
cure
(5.5
to
15.0
U
SD
/day
)
Mid
dle-
clas
s (1
5.0
U
SD
/day
)
Tota
l
VHLSS 2012
Extremely poor (under 1.9 USD/day) 21.7 35.6 28.4 11.1 3.3 100
Poor (1.9 USD to 3.1 USD/day) 8.7 20.0 55.3 15.6 0.5 100
Vulnerable (3.1 USD to 5.5 USD/day) 1.1 5.3 38.2 53.1 2.3 100
Economically secure (5.5 USD to 15.0 USD/day) 0.0 0.4 10.3 74.9 14.4 100
Middle-class (15.0 USD/day) 0.0 0.0 0.4 40.1 59.5 100
Total 2.0 5.0 22.8 57.3 13.0 100
Note: USD exchange rate was calculated in purchasing power parity in 2011.Source: Calculation by research team using VHLSS data

Reducing poverty in all its dimensions to ensure a good quality life for all 45

46 Multidimensional poverty in Viet Nam
Part 2. Disadvantaged groups experienced significant progress, yet continue to lag behind
Chapter 2.1. Poverty and poverty reduction among ethnic minority groups: Outstanding issues
2.1.1 Gaps in expenditure and income between the Kinh and ethnic minority groups in-creased
As discussed in Chapter 1, with sustained poverty reduction, the overall poverty rate in Viet Nam in 2016 had decreased significantly compared to 2012 and previous years. Nevertheless, poverty was more concentrated among ethnic minority groups in the Northern Mountains and Central Highlands
Figure 2.1. 1Error! Reference source not found.). While the poverty rate was low among the Kinh (green - less than 10%) and represented by a small number (yellow) in the Northern Midlands and Mountains region, the poverty picture of poor ethnic minorities is in stark contrast: the colours are mainly yellow (20-40%) and red (40-70%) and even in some areas in the Northern Midlands and Mountains and Central Highlands, reddish brown (poverty rate more than 70%).
Figure 2.1. 1: Poverty map
Kinh Ethnic minorities
Northernmountains
Red river delta
Centralcoast The paracels
MekongRiver Delta
Sounth East
Central highlands
The Spratlys
Northernmountains
Red river delta
Centralcoast The paracels
MekongRiver Delta
Sounth East
Central highlands
The Spratlys
Rural
Poverty rate (%)
Rural
Poverty rate (%)
Source: Developed by the research team based on the Poverty Census 2015

Reducing poverty in all its dimensions to ensure a good quality life for all 47
Expenditure and income gaps show marked increases
The map above reflects the income/expenditure gap between Kinh and ethnic minority groups. Figure 2.1.2, the expenditure gap (in absolute value) between the Kinh and ethnic minorities tended to increase during 2004-2016. In relative comparison, while in 2004 the expenditure of ethnic minorities was 59% that of Kinh/Hoa, by 2016 it stood at only 52%.
Figure 2.1.2: Expenditure gap between Kinh and ethnic minority groups
58.9%
56.3%
57.5%
53.6%
57.3%
51.7%
60%
58%
56%
54%
52%
50%
48%0
1000
2000
3000
4000
5000
6000
7000
8000
9000
10000
2004 2006 2010 2012 2014 2016
Ethnic minotities Kinh và Hoa Gap
Source: Calculation by research team using VHLSS data
Box 2.1. 1. What ethnic minorities think about the increasingly widening living standards gap
Since they moved to a new village in 2006, near the centre for exchange activities, monetary income has increased as has exposure to new and better services (education, health). However, in the view of villagers, the poverty gaps between ethnic minorities and Kinh as well as between Kho Mu and Thai have risen. Their assessment is based on the perspective of cash income, cash expenditures and social resources that help connect to higher income livelihoods.
First, ethnic minority households felt “increasingly behind” in their ability to do business. This is evident from perceptions of poor households that had to change their subsistence lifestyles with local products that relied on natural conditions in their former habitats near rivers and forest. They cannot sustain themselves in the new place. They have a life with increased income and more convenient trade, but face a cost of dealing with unfamiliar climatic changes and changing their traditional livelihoods, with knowledge difficult to acquire. The new climate and changes in environment in a more negative direction makes them feel tired when working in agriculture. New livelihoods make them feel helpless when initially they “did not know what to do”. Gradually, they learnt how to farm with new techniques, but farming now depended on “using fertilizers”, which makes them feel unable to keep up with the better off. Less investment and poorer productivity resulted in “increasingly bad harvests” compared with the better-off group. They find it difficult to catch up with market economy.
Second, although monetary income has risen, monetary expenses have increased. The households can deeply feel this. On one hand, post harvest and sale of produce to traders, households must repay rice purchase costs, seed and fertilizer loans and small debts owed to neighbours due to unexpected needs meant there was little income left to save.

48 Multidimensional poverty in Viet Nam
Worse, the pressure of paying debts leaves many households, especially poor ones, constantly selling agricultural products early to pay debts. The vicious circle of taking out high interest loans, or buying inputs on credit, selling agricultural products early before optimum prices, lack of money for expenses and taking out high interest loans to cover, creates poverty. The lower the productivity, the more crop losses and debt owed, which makes households feel poorer than the rich. On the other hand, without cash poor households often look to borrow money from family members and relatives. Borrowing small sums of money is based on personal relationships and households can only borrow new money when the old debt is paid. Therefore, if they still owe their close relatives money, the household must borrow from other households. As it becomes increasingly difficult to find people who lend money, they feel poorer.
Third, compared to before when the village community lived simply and the social network was small, poorer households become increasingly unaware of the social network of well-off households: “Who did they learn from?”, “Who gave them advice?” “I do not know why they shouted like that [bid price like that]”. Credit relationships can be informed among relatives, as a way of sharing/listening to advice. Nevertheless, investment considerations, how to do business, how to generate higher productivity or deal with production losses are not exchanged specifically. The households can get information about another household suffering from a loss or doing a good business, but do not know why, and there is no exchange of information to learn. They feel that better off households increasingly have “better relations” with groups outside the community.
Source: Nguyen Thi Thu Phuong (2018)
The income gap also shares a similar trend. While the income of the ethnic minority population was equal to 68% of the Kinh in 2004, it fell to only 52% in 2016 or a decrease of 16%. This was mainly due to the high growth rate of non-farm and wage-earning activities and the doubling of non-agricultural Kinh/Hoa household income, not achieved by ethnic minorities. Further analysis of the income structure over the past few years (Table 2.1. 1) points to Kinh/Hoa’s more adept conversion from farming to non-farm paid employment compared to ethnic minorities. The share of non-agricultural wages in Kinh/Hoa’s total income increased by 17% between 2004-2016, the strongest increase compared to other income sources. As a result, non-farm earning accounted for the largest proportion (39%) of Kinh/Hoa household income in 2016. Meanwhile, non-farm wage earning by ethnic minorities increased by only 14% from 2004-2016, which accounted for only 26% of total income in 2016. The largest share of total income of ethnic minorities still came from agricultural crops, accounting for 40% and 30% of total income in 2004 and 2016, respectively.

Reducing poverty in all its dimensions to ensure a good quality life for all 49
Tabl
e 2.
1. 1
: Inc
ome
and
inco
me
stru
ctur
e of
eth
nic
min
orit
y gr
oups
and
Kin
h/H
oa g
roup
Agricultural wage labor
Non - Agricultural wage labor
Crop Farming
Livestock
Forestry
Fishery
Non - Agricultural production and businesses
Cash transfer
Other
Total
Ann
ual i
ncom
e (t
hou
sand
VN
D)
2004
Kinh
& H
oa89
95.
616
6.15
71.
912
282
1.446
4.86
127
53.
859
25.3
07
Oth
er e
thni
c gr
oups
1.034
2.03
47.
294
1.75
51.4
9652
81.1
4821
71.6
8417
.190
Tota
l92
05.
043
6.33
91.
887
476
1.29
94.
269
265
3.51
124
.010
2016
Kinh
& H
oa1.
518
19.6
307.
276
3.22
718
42.
264
10.9
3341
44.
932
50.3
78
Oth
er e
thni
c gr
oups
3.13
96.
688
7.176
2.25
51.
597
385
1.97
771
62.
172
26.10
6
Tota
l1.
864
16.8
697.
254
3.02
048
61.
863
9.02
247
84.
343
45.19
9
Sh
are
in t
otal
inco
me
2004
Kinh
& H
oa3.
6%22
.2%
24.3
%7.
6%1.1
%5.
7%19
.2%
1.1%
15.2
%10
0.0%
Oth
er e
thni
c gr
oups
6.0%
11.8
%42
.4%
10.2
%8.
7%3.
1%6.
7%1.
3%9.
8%10
0.0%
2016
Kinh
& H
oa3.
0%39
.0%
14.4
%6.
4%0.
4%4.
5%21
.7%
0.8%
9.8%
100.
0%
Oth
er e
thni
c gr
oups
12.0
%25
.6%
27.5
%8.
6%6.
1%1.
5%7.
6%2.
7%8.
3%10
0.0%
Sour
ce: N
guye
n Th
i Thu
Phu
ong
(201
8)

50 Multidimensional poverty in Viet Nam
SMEs, especially household businesses, play a fundamental role in Viet Nam’s economic structure shift. This section is characterized by a large number of establishments and low skilled labour, creating an essential channel to attract workers out of agricultural sectors.
Box 2.1. 2. Household businesses in Viet Nam
A recent study has provided detailed information on about 10 million Vietnamese household enterprises. Small non-farm households, mostly informal, have low profits. More than 20% of the workforce owns household businesses in Viet Nam, providing a variety of production and services that serve as a basis for daily operations in the economy They may own small bread shops, be motor mechanics, professional artisans, taxi drivers or be part of countless small businesses that engage rural and urban households. Nearly two-thirds of businesses do not have a business license, while some are not aware they are legally required to register their business. Monthly incomes range from VND4 million to VND9 million (business owner), although this is often shared by the owner and family members. The average size of a household business is 2.5 people, including business owners.
However, workers in household businesses in particular and the informal sector in general are vulnerable to shocks. They create the “missing middle” group as defined in the Viet Nam Human Development Report 2015 who achieve unstable incomes, but are ineligible for social support and unable to access social insurance. For these reasons, promoting the productivity of household businesses and informal sectors as well as addressing the vulnerability of workers is critical for growth, stability and human development on a large scale.
Source: Pasquier-Doumer et al. (2017)
Considerable education gap
The difference in education levels between Kinh/Hoa and ethnic minority groups was also significant, as illustrated by
Figure 2.1.3: Education of household head (%)
The proportion of people in ethnic minority groups without qualifications was double that of Kinh/Hoa, while the proportion of ethnic minorities with high school education was only half that of Kinh/Hoa.
Figure 2.1.3: Education of household head (%)
Other ethnic groups Kinh và Hoa group[
48.35 43.78
25.91 25.55
21.56 22.86
4.18 7.8
0
20
40
60
80
100
2004 2016
28.27 22.73
26.23 27.49
33.01 34.15
12.48 15.64
0
20
40
60
80
100
2004 2016
Upper secondary school
Lower secondary school
Primary education
No quali�cation
Source: Compiled based on research by Nguyen Thi Thu Phuong (2018)

Reducing poverty in all its dimensions to ensure a good quality life for all 51
One of the important policy questions related to the MDP approach is interactions among dimensions of poverty, i.e. whether improving one deprivation can also ameliorate other deprivation(s). Figure 2.1. 4 shows the relationship between two key dimensions of MDP: income (expressed by consumption behaviour) and education. It illustrates that people from ethnic minority groups with higher education (upper secondary or higher) and at a high expenditure quintile in 2004, considerably narrowed the expenditure gap with Kinh/Hoa counterparts with similar characteristics10. This affirms the important role of education in narrowing the development gap for ethnic minority groups. In addition, differences in expenditure between the two groups, when comparing similar education levels, increased during 2004-2016. This shows the gap tended to increase after controlling the level of education during 2004-2016.
Notably, the role of education in narrowing the expenditure gap between ethnic minorities and Kinh/Hoa is not the same across expenditure groups, especially among people with upper secondary school or higher levels of education. For those with lower secondary school education, the ethnic gap between the two groups was relatively stable in 2004, but sharply decreased in 2016 among high expenditure quintiles. For those with high education levels, but in low quintiles in the expenditure spectrum, the gap between ethnic minorities and Kinh/Hoa counterparts with the same levels of education was even greater. This shows that ethnic minorities face a greater challenge in transforming their education into income compared to Kinh/Hoa with the same education, especially those in low quintiles of the expenditure spectrum.
Figure 2.1. 4: Gap in average expenditure per capita by education of household head
2004
0 20 40 60 80 100
0 20
40
60
80
10
0 12
0 14
0 16
0%
chê
nh lệ
ch c
hi ti
êu b
ình
quân
Không bằng cấp Tiểu học Trung học cơ sở Trung học phổ thông trở lên
2016
0 20 40 60 80 100
0 20
40
60
80
10
0 12
0 14
0 16
0%
chê
nh lệ
ch c
hi ti
êu b
ình
quân
Không bằng cấp Tiểu học Trung học cơ sở Trung học phổ thông trở lên
Source: Nguyen Thi Thu Phuong (2018)
Disparities in access to basic services: Gaps in access to electricity and safe water have narrowed, while that to hygienic latrines widened
Despite government policy interventions to develop infrastructure, access to public facilities for ethnic minority households remains limited. Concerns encompass clean water, hygienic latrines and electricity. Ethnic minorities have less access to all public facilities than Kinh/Hoa (Figure 2.1. 5). Access to clean water is relatively low for ethnic minorities (70%) compared to Kinh/Hoa (nearly 95%). Almost all Kinh/Hoa households (99.8%) have access to electricity, compared to 90% for ethnic minority households. Between 2004-2016, the gap in access to clean water and electricity narrowed slightly, in contrast to that for access to sanitation which remained large. The rate of access to hygienic latrines increased considerably for Kinh/Hoa by 28% during 2004-2016, compared to only 17% for ethnic minorities.
10 This type of graph enables the comparison of two groups (ethnic minorities and Kinh/Hoa) not only in terms of average absolute values (expenditure), but also across the entire expenditure spectrum, controlling for education. Specifically, one point in a line gives information about the expenditure gap between ethnic minorities and Kinh belonging to a quintile (in their expenditure spectrum) with the same education level. This helps to reduce implausible comparisons, as contrasts between groups are made among the same rich (or poor) with the same education (e.g. the rich with the same education of upper secondary school). This comparison is more accurate, especially when there are considerable within-group differences (i.e. in either ethnic minority or Kinh/Hoa groups there are rich and poor).

52 Multidimensional poverty in Viet Nam
Figure 2.1. 5: Access to basic services
84.6
94.8
46.8
9.9
75.1
94.5
51.5
70.6
27.2
72.5
90
0
10
20
30
40
50
60
70
80
90
100
2004 2016 2004 2016 2004 2016
Safe water Hygienic latrines Grid electricity use
Kinh và Hoa
Other ethnic groups
Source: Nguyen Thi Thu Phuong (2018)
Similar to Figure Figure 2.1. 4, the relationship between the key dimensions of MDP: income (expressed through spending behaviour) and access to basic services is shown in Figure 2.1. 6. This figure shows two similar patterns of differences between the two groups related to access to public utilities across the entire spectrum of per capita expenditure. First, in the expenditure spectrum for 2004 and 2016, ethnic minorities with no access to public utilities often had higher spending disparities compared to Kinh/Hoa, than those with such access. Secondly, lines displaying differences in expenditure between the two groups mostly climbed between 2004-2016, suggesting the spending gap increased significantly over the period, regardless of access to basic services.
However, for those without access to public services, disparities increased with varying degrees across the expenditure distribution spectrum. For those without access to clean water, the difference was stable across quintiles in the expenditure spectrum. For those without access to hygienic latrines, greater disparity in the lower end of the expenditure spectrum meant greater disparity between the poorer and richer. Conversely, for those without access to electricity in 2016, among the ethnic minorities the better-off households experienced increased disparities than the poorer.

Reducing poverty in all its dimensions to ensure a good quality life for all 53
Figure 2.1. 6: Distribution of average expenditure gap by group with access to basic services and without
For groups with and without access to safe water
2004
0
040
8012
016
0
20 40 60 80 100
% c
hênh
lệch
chi
tiêu
bìn
h qu
ân
2004
0
040
8012
016
0
20 40 60 80 100
For groups with and without access to grid electricity
2004
0
5010
015
025
020
030
0
20 40 60 80 100
% c
hênh
lệch
chi
tiêu
bìn
h qu
ân
2016
0
5010
015
025
020
030
0
20 40 60 80 100
For groups with and without access to hygienic latrines
For groups with and without access to hygienic latrines
2004
0
1030
5070
9011
0
20 40 60 80 100% c
hênh
lệch
chi
tiêu
bìn
h qu
ân
2016
0
1030
5070
9011
0
20 40 60 80 100
Without access With access
Source: Nguyen Thi Thu Phuong (2018)
Social network gap
Many studies have shown the importance of social relationships in improving welfare (an overview of this strand of literature was presented in Nguyen Thi Thu Phuong (2018)). In such studies, a social network is defined as the relationships between a household and others that can shape household welfare by providing/not providing resources for better welfare generation. Some studies have indicated that through social relationships, the poor tend to apply knowledge from counterparts with higher incomes. Social networking can bring people together to share information and enable the poor to learn

54 Multidimensional poverty in Viet Nam
from others in relationship networks who give advice and aspirations, as well as provide other forms of support such as finance, access to employment and risk-sharing collective action, helping the poor to increase their incomes and catch-up with the better off (Afridi, 2011; Kadushin, 2012; Kerr and Mandorff, 2016). All these studies have shown that ethnic minorities faced barriers to access resource flows due to language and cognitive limitations, which lead to increased income disparities between ethnic groups.
Some studies used the proportion of population from the same ethnic group living in one area to measure the size of social networks. This report used the same metric, with the district the unit representing the geographical area in which the household resides. With such a measure, FigureFigure 2.1. 7 shows that in Kinh/Hoa groups, those in the higher quintile of spending spectrum had larger social networks. For ethnic minorities, there was no difference in size of social networks across different quintiles in the expenditure spectrum. This suggests Kinh/Hoa are more likely to live in densely populated places than ethnic minorities. The richer the Kinh/Hoa, the more likely they are to live or migrate to more populated areas with more economic opportunities.
Figure 2.1. 7: Population of the same ethnic group in district by average expenditure decile (thousand people)
-
10
20
30
40
50
1 2 3 4 5 6 7 8 9 10
Ethnic minorities
Kinh và Hoa
Source: Nguyen Thi Thu Phuong (2018)
2.1.2 Factors influencing the living standards gap between ethnic minority and Kinh/Hoa groups
An important policy question is which factors contribute to the living standards gap (measured by average expenditure per capita in this context) between ethnic minority groups and Kinh/Hoa. This problem is often analyzed by using the Blinder-Oaxaca decomposition method to separate the difference between groups in endownments (also known as household characteristics) in relation to returns to endownments.

Reducing poverty in all its dimensions to ensure a good quality life for all 55
Figure 2.1.8: Factors relating to gap between ethnic minorities and Kinh/Hoa
Constant
Infrastructure
Geographic distance
Social network
Diversi�cation
Land area
Training
Education
Sex of household head
Age of household head
Household structure
Household size
75
65
55
-12.7
13.9
22.5
28.1
6.440.2
4.9
53.6
18.2
3.6
0.7
-6.1
-2.7
12.8
3.8
4.4
6.7
4.8
8.7
13.0
6.3
11.5
-5.8
-1.8
-7.0
15.4
3.4
6.4
4.6
10.4
13.5
7.2
-23.1
3.2
3.0
11.6
9.8
11.6
45
35
25
15
5
-5
-15
-25
In�uenced by household
characteristics2004
In�uenced byhousehold
characteristics2016
In�uenced byhousehold
characteristics2016
Other factors Other factors Other factors
Source: Nguyen Thi Thu Phuong (2018)
Note: In this graph, the effect of the factor “Social relationship network” is only calculated for 2016. Therefore, to compare with 2004, the calculation was also performed without accounting for this factor (columns 3 and 4).
Other factors are those not observable in the household surveys, also called “unexplained expenditure/income disparities” from these data sets. Mathematically, this component of expenditure/income disparity is due to differences in use of endownments between ethnic minority groups and Kinh/Hoa households.
Figure 2.1.8 shows the most important drivers of the gap between ethnic minorities and Kinh/Hoa were: (1) characteristics of communities, (2) demographic characteristics (such as household size, household structure and age of household head) and (3) education.
Geographic distance11 was the biggest barrier to improving the well-being of ethnic minorities to help them catch up with Kinh/Hoa. The magnitude of effect of geographic distance on incremental spending increased from 3.2% in 2004 to 15% in 2016 (or 13% if the social relationship network factor is included). The contribution of the most important factor creating the expenditure gap between ethnic minorities and Kinh/Hoa was estimated to be 22.5% in 2004. This proportion was lower in 2016, but still made the largest contribution of 13% to the gap.
Infrastructure improvements helped close the expenditure gap between Kinh and ethnic minority groups, by 14% in 2004 and 6.4% in 2016. This shows the positive impact of infrastructure improvement on the reduction of disparities between ethnic minority and Kinh/Hoa groups. Nevertheless, geographic distances still pose a solid barrier to close this gap in the near future.
11 Information on whether the commune belonged to remote areas, as extracted from VHLSS data.

56 Multidimensional poverty in Viet Nam
Regarding other contributing factors explaining the expenditure gap among ethnic groups, household size and educational attainment made the same 12% contributions to welfare gap increases in 2004. However, during 2004-2016, the impact of education on the gap halved, and household size declined by a quarter.
The social network explains about 3.8% of the welfare gap between ethnic minorities and Kinh/Hoa in 2016. If the ethnic minority group had the same level of social networking as the Kinh/Hoa, its welfare would increase by 2.8%.
2.1.3 Multidimensional poverty in selected ethnic minority groups
2.1.3.1 Rationale for analysis selection
Although the overall poverty rate in Viet Nam is low and continues to decline, poverty is mainly concentrated in core ethnic minority groups in the Northern Midlands and Mountains and Central Highlands. One of the important questions is whether poverty among ethnic minority groups was the same in the past period or were there differences among these ethnic groups. This part of the report will take an in-depth look at the distribution of poor among Kinh and ethnic minorities as well as the poverty reduction rate among the latter and show there is a marked difference among ethnic minorities.
Figure 2.1. 9 shows the poor Kinh population is concentrated in the Red River Delta and Mekong River Delta regions. Meanwhile, the poverty density of ethnic minorities is highest in the Northern Mountains and Central Highlands.
Figure 2.1. 9: Poverty map of ethnic groups
Dân tộc Kinh Ethnic minoritiesKinh Ethnic minorities
Northernmountains
Red river delta
Centralcoast
The paracels
MekongRiver Delta
Sounth East
Central highlands
The Spratlys
1 dot = 500 poor peopleProvince
Northernmountains
Red river delta
Centralcoast
The paracels
MekongRiver Delta
Sounth East
Central highlands
The Spratlys
1 dot = 500 poor peopleProvince
Source: prepared by the research team based on the Poverty Census 2015

Reducing poverty in all its dimensions to ensure a good quality life for all 57
Figure 2.1. 10 12 shows a marked heterogeneity between ethnic minority groups in Viet Nam. Ethnic groups on the left represent low poverty rates and slow rates of poverty reduction, the middle group had relatively low poverty rates and rather rapid poverty reduction, and the right-hand group was characterized by a high poverty rate and slow poverty reduction.
Figure 2.1. 10: Poverty rates 2016 and poverty rate changes 2011-2016 of EM
Mông Gia Rai
Ba Na
Xơ Đăng
Mnông
Bru Vân Kiều Khơ mú
Gié Triêng
Co
Khmer Hoa (Hán)
Ê Đê Tày
Thái Mường
Nùng
Dao
-45
-40
-35
-30
-25
-20
-15
-10
-5
0
5
10 20 30 40 50 60 70 80 90
Pove
rty
rate
cha
nge
2011
-201
6 (%
)(%
)
Poverty rate 2016 (%)
Source: Calculations by the research team based on results of the Agricultural Census 2009 and 2016
The U-shaped graph shows the typical poverty picture of ethnic groups in Viet Nam. While the low poverty and low poverty reduction rates among the Hoa and Khmer ethnic groups can be explained by poor households in this group being core poor with a very small population, which makes it challenging to increase the rate of poverty reduction. The high poverty rates associated with the slow poverty reduction among Gia Rai, Hmong and Xo Dang groups need further investigation to explain. Therefore, this report focused on analyzing MDP of groups with high poverty rates and slow poverty reduction (Gia Rai, Hmong and Xo Dang). At the same time, ethnic groups with low poverty rates and fast poverty reduction (Muong, Tay and Thai) will also be analyzed to partially explain this special phenomenon.
2.1.3.2 Multidimensional poverty of selected ethnic groups in Viet Nam
a.Multidimensional poverty of Hmong ethnic group
Among ethnic minorities in Viet Nam, the Hmong had the fifth largest population (after Tay, Thai, Hoa and Khmer) amounting to 1,068,189 people (2009), which increased to 1,251,040 by 2015. In contrast, the Hoa ethnic group’s population fell sharply during the same period, from 1,268,963 in 2009 to 806,041 in 2015.
The Hmong MDP rate was seven-fold higher than the Kinh’s (91.7% compared to 12.9%) and about three-fold higher than the Hoa (91.7% versus 31.6%) in 2009. By 2015, although the absolute MDP rate sharply declined among Hmong (91.7% to 62%), when compared to Kinh/Hoa groups, the relative gap rose to 9.3 times and 8.7 times, respectively (Figure 2.1. 11).
12 Note: the size of circles corresponds to the population size, excluding Kinh group
Red: EM with poverty rate higher than the median, poverty reduction rate lower than the median, population size >50,000
Orange: EM with poverty rate higher than the median, poverty reduction rate higher than the median
Yellow: EM with poverty rate lower than the median, poverty reduction rate lower than the median
Green: other EM groups

58 Multidimensional poverty in Viet Nam
Figure 2.1. 11: MDP rates of the Hmong and Kinh
12.861 6.639
91.678
61.976
.000
10.000
20.000
30.000
40.000
50.000
60.000
70.000
80.000
90.000
100.000
MDP 2009 MDP 2015
Kinh
H'Mong
Source: Calculations by the research team based on results of the Population Census 2009 and Poverty Census 2015
Regarding the specific domains of MDP, the decreasing trend in poverty dimensions of the Hmong was noticeable from 2009-2015. However, the reduction rates were not even among the dimensions (Figure 2.1. 12).
Figure 2.1. 12: MDP rate of the Hmong
.0010.00
20.0030.0040.0050.00
60.0070.00
2009 2015
Hoa
.00
20.00
40.00
60.00
80.00
100.00
Chất lượng nhà ở kém
DT nhà ở bq < 8m2
Ko có nước hợp vệ sinh
Ko sử dụnghố xí
Ko sử dụngdịch vụ viễn thông
Ko có t.sản tiếp cận
thông tin
Sử dụngBHYT
3.4 18.7
Source: Calculations by the research team based on the results of Population Census 2009 and Poverty Census 2015
The indicator for adult education level is measured by the proportion of households with at least one member aged 15 years or over who did not graduate from high school and was not currently enrolled in school. Although the literacy rate of Hmong adults is significantly higher than Kinh/Hoa, it dropped sharply from 71.2% in 2009 to 57.2% in 2015, helping to significantly close the adult education gap between the Hmong and Kinh/Hoa (educational level of Kinh adults was almost constant). The picture

Reducing poverty in all its dimensions to ensure a good quality life for all 59
is similar and even more spectacular when comparing the indicators of school attendance (measured by proportion of households with at least one school-aged child not attending school). The poverty gap in this dimension between the Hmong and Kinh decreased from 9.7 times in 2009 to nearly 5.5 times in 2015.
The network graph in Figure 2.1. 12 also shows a significant closing of gaps in other dimensions of MPI between the Mong and Kinh/Hoa groups. For example, the poor housing quality indicator (household dwelling in non-permanent or simple housing) of the Mong people fell dramatically from 62.6% in 2009 to 15.8% in 2015, reducing the disparity with Kinh from 4.3 times to 1.4 times in the corresponding period.
In general, the structural change in economic groups of the Hmong ethnic group during 2011-2016 is also quite positive. Table 2 shows the “extreme” poverty rate (under USD1.9 per day) of the Mong ethnic group decreased by almost half after five years. The “extremely poor” gradually moved to moderately poor (USD1.9-3.1 per day), vulnerable (USD3.1-5.5 per day) and “economically secure” (USD5.5-15 per day) groups. As a result, the proportion of groups outside the “extremely poor” group increased significantly during 2011-2016, especially for the “vulnerable” group, which grew three-fold from 8.5% to nearly 26%.
Table 2.1. 2: Economic group structure of the Hmong, 2011-2016
Extremely poor (below USD1.9
PPP/day)
Moderately poor (USD1.9-3.1 PPP/day)
Vulnerable (USD3.1-5.5
PPP/day)
Economically secure (USD5.5-
15 PPP/day)
Middle class (over USD15
PPP/day)
2011 60.8 29.9 8.5 0.7 0.0
2016 31.5 38.5 25.9 4.1 0.0
Source: Calculations by the research team based on VHLSS data
However, there were no Hmong in the middle-income group (over USD15 per day) and this rate was unchanged throughout 2011-2016.
Explanations for the high poverty rate of Hmong group
Although the MDP rate in general and the poverty rate in each dimension of the Hmong ethnic group decreased considerably during 2009-2015, helping to close the gap between the Hmong and Kinh/Hoa, the MDP rate of Hmong people remains among the highest in the country. The next section will analyze some statistical indicators that partly explain the past high poverty rate for the Hmong people.
Figure 2.1. 13 shows the percentage of illiterate females in the Hmong ethnic group was about 67% in 2009 and reduced little by 2015, while this figure for the Kinh/Hoa population was only 6-7%. This may be an important reason for the past high incidence of poverty in the Hmong ethnic group. Moreover, in 2009, while the proportions of primary school students differed little among Hmong and Kinh/Hoa groups, in fact the higher the educational level - the lower proportions of female Hmong students there were compared to Kinh/Hoa (Figure 2.1.8). Remarkably, by 2015, the gap between the proportion of girls with lower secondary education and higher secondary education among the three ethnic groups was considerably reduced.
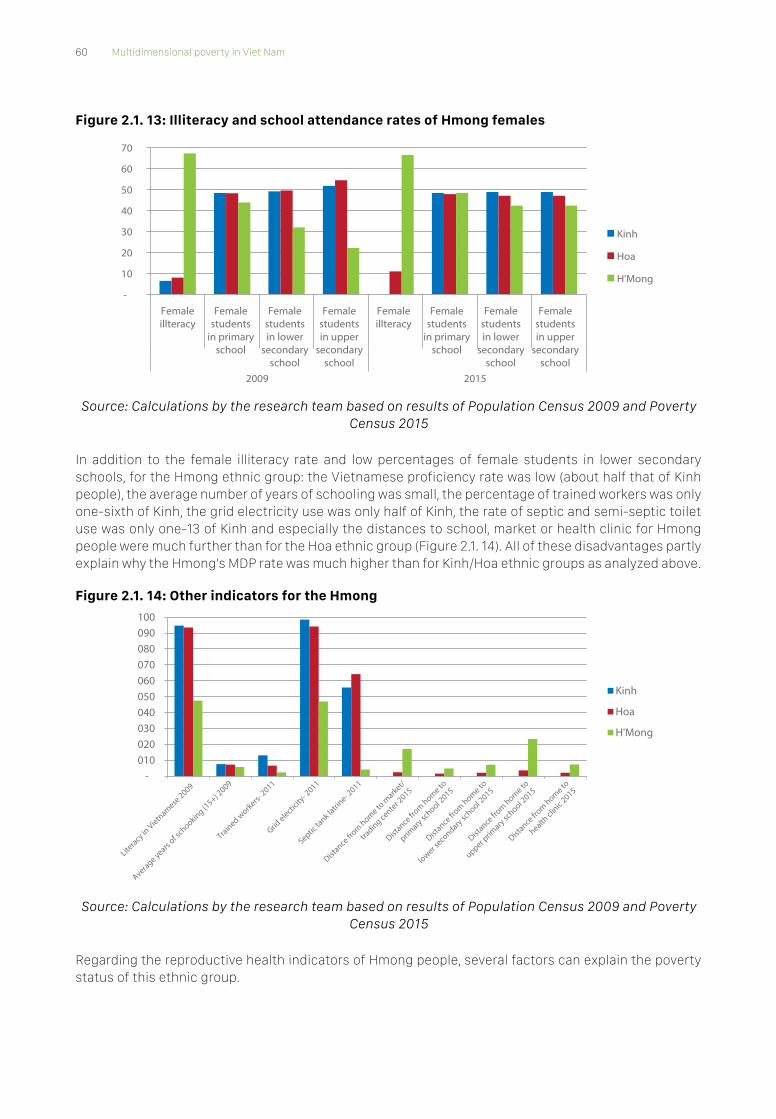
60 Multidimensional poverty in Viet Nam
Figure 2.1. 13: Illiteracy and school attendance rates of Hmong females
-
10
20
30
40
50
60
70
Femalestudentsin upper
secondaryschool
Femalestudentsin lower
secondaryschool
Femalestudents
in primaryschool
Femaleillteracy
Femalestudentsin upper
secondaryschool
Femalestudentsin lower
secondaryschool
Femalestudents
in primaryschool
Femaleillteracy
2009 2015
Kinh
Hoa
H'Mong
Source: Calculations by the research team based on results of Population Census 2009 and Poverty Census 2015
In addition to the female illiteracy rate and low percentages of female students in lower secondary schools, for the Hmong ethnic group: the Vietnamese proficiency rate was low (about half that of Kinh people), the average number of years of schooling was small, the percentage of trained workers was only one-sixth of Kinh, the grid electricity use was only half of Kinh, the rate of septic and semi-septic toilet use was only one-13 of Kinh and especially the distances to school, market or health clinic for Hmong people were much further than for the Hoa ethnic group (Figure 2.1. 14). All of these disadvantages partly explain why the Hmong’s MDP rate was much higher than for Kinh/Hoa ethnic groups as analyzed above.
Figure 2.1. 14: Other indicators for the Hmong
- 010 020 030 040 050 060 070 080 090 100
Kinh
Hoa
H'Mong
Literacy
in Vietn
amese 2009
Average years of s
chooking (1
5+) 2009
Trained workers-
2011
Grid
electicit
y- 2011
Septic ta
nk latri
ne- 2011
Distance
from home to
market/
trading ce
nter 2015
Distance
from home to
primary sc
hool 2015
Distance
from home to
lower s
econdary sc
hool 2015
Distance
from home to
upper prim
ary school 2
015
Distance
from home to
health cl
inic 2015
Source: Calculations by the research team based on results of Population Census 2009 and Poverty Census 2015
Regarding the reproductive health indicators of Hmong people, several factors can explain the poverty status of this ethnic group.

Reducing poverty in all its dimensions to ensure a good quality life for all 61
Figure 2.1. 15: Indicators related to reproductive health of the Hmong
03 01
5860
11
35
13
-
10
20
30
40
50
60
70
80
90
Child marrige2015
Consanguineousmarriage 2015
Assisted births2015
Pregnant womenmaking at least
three antenatal care visitsto health clinics 2015
Hoa
Mong
Source: Calculations by the research team based on results of Population Census 2009 and Poverty Census 2015
Specifically, the prevalence of child marriage by Hmong people was up to nearly 60%, in contrast to just 2.7%. for the Hoa ethnic group. In particular, the prevalence of consanguineous marriages among the Hmong was up to 11.4%, while science has shown that consanguineous marriage can lead to reproductive decline and increased risk of serious illnesses. However, consanguineous marriage among Hmong is a characteristic of this ethnic group. Finally, while the proportion of births assisted by health workers was up to 90% among Hoa, it was just 35% for the Mong ethnic group. The proportion of pregnant women receiving at least three antenatal care visits during pregnancy in the Hmong population was only 12.6% compared to 57.5% for Hoa.
Another important reason for the Hmong ethnic group’s high poverty rate relates to farming-oriented livelihoods (Figure 2.1. 16). While the share of income from farming was 13.6% nationwide and 11.2% for Kinh people in 2016, it was nearly 42% for the Hmong. While the share of State transfers was 11.7% for the Mong (four times the national average and for Kinh), the income share from wages or non-agricultural activities of the Mong was equivalent to one-third and one-ninth in proportion to the national average and of Kinh, respectively. Finally, the share of income from remittances for Hmong was one-third of the two comparison groups.

62 Multidimensional poverty in Viet Nam
Figure 2.1. 16. Income structure of Hmong in 2016 (%)
41.700
11.200 13.600
12.700
4.7005.300
13.300
2.8003.700
15.00
45.10043.700
1.900
18.600 16.800
2.700 10.400 9.80011.700 3.500 3.700
0%
10%
20%
30%
40%
50%
60%
70%
80%
90%
100%
Mông Kinh Total
Others
State tranfers
Remittances
Non - agriculture
Wage
Other agricultural activities
Crop farming
Source: Calculations by the research team based on VHLSS data
Through an analysis of numerous MDP indicators, statistics from 2009-2015 reveal the Hmong achieved particularly impressive poverty reduction in most dimensions of MDP. Not only the absolute MDP rate was significantly reduced, but gaps in the majority of MDP dimensions between Hmong and Kinh were reduced (except for the indicator for non-usage of telecommunication services measured by the proportion of households with no members using the telephone). However, taking into account the relative population size between the Kinh and Mong peoples, it is clear the poverty reduction rate and narrowing poverty gap of the Mong people did not reach expected levels. Therefore more in-depth studies of factors, other than economic ones, are needed to explain why the Hmong population’s MDP rate is still the highest in the country.
The Tay ethnic group has the largest population of all ethnic minority groups in Viet Nam, with a population of 1,626,392 in 2009 and 1,766,927 in 2015. During 2009-2015, the Tay ethnic group made remarkable achievements in reducing MDP, with the poverty rate declining from 30% in 2009 to 6.8% in 2015 - equal to the Kinh’s poverty rate in 2015 (Figure 2.1. 17).
In comparison to the Kinh, the Tay’s poverty reduction story contrasts with the Hmong’s in the previous analysis. Both Hmong and Tay ethnic groups have relatively equal populations of more than one million people, but the Tay’s MDP indicators are much better than the Hmong’s.

Reducing poverty in all its dimensions to ensure a good quality life for all 63
Figure 2.1. 17: MDP of the Tay and Kinh, 2009-2015
12.861
6.639
29.922
6.769
.00
5.00
10.00
15.00
20.00
25.00
30.00
35.00
MDP 2009 MDP 2015
Kinh
Tay
Source: Calculations by the research team based on results of Population Census 2009 and Poverty Census 2015
Several MDP indicators of the Tay ethnic group significantly improved during 2009-2015, especially indicators for poor housing quality and non-usage of telecommunication services (Figure 2.1. 18). Specifically, the housing quality indicator decreased from 55.6% in 2009 to 12% in 2015, almost equal to that of Kinh and even exceeding that of Hoa. This is a major poverty reduction achievement in the Northern Uplands thanks to support programmes to eradicate non-permanent housing and other programmes. The rate of non-use of telecommunications services by Tay also decreased by about five-fold during 2009-2015 from 54% to 11%. The increased use of telecommunications services is a particularly important factor in accessing information as well as learning about production and management methods, which may have helped the Tay to attain such impressive poverty reduction achievements in the recent past.
Noticeably, compared to Kinh/Hoa, the proportion of Tay using health insurance cards was significantly higher. On one hand, ethnic Tay are provided with free health insurance cards under the government’s support programme for ethnic minorities. On the other hand, the distances from homes to health clinics for Tay is not burdensome, approximately 3km on average (equivalent to Hoa ethnic group). Figure 18 can partly explain the usage rate of health insurance cards by Tay, which experienced a rapid increase from 31.5% in 2009 to 53.5% in 2015.

64 Multidimensional poverty in Viet Nam
Figure 2.1. 18: MDP indicators of the Tay and Kinh/Hoa
.00
10.00
20.00
30.00
40.00
50.00
60.00
70.00
Adu
lt ad
ucat
ion
Scho
ol a
tten
danc
e
Hou
sing
qua
lity
Hou
sing
are
a <8
m2
Clea
n w
ater
Sani
tatio
n
Com
mun
icat
ion
serv
ices
Acc
ess
to in
form
atio
n
Hea
lth in
sura
nce
Adu
lt ad
ucat
ion
Scho
ol a
tten
danc
e
Hou
sing
qua
lity
Hou
sing
are
a <8
m2
Clea
n w
ater
Sani
tatio
n
Com
mun
icat
ion
serv
ices
Acc
ess
to in
form
atio
n
Hea
lth in
sura
nce
Poverty census 2009Population census 2009
Kinh
Hoa
Tay
Source: Calculations by the research team based on results of Population Census 2009 and Poverty Census 2015
In general, among Tay people, the structural change by economic groups during 2011-2016 was positive. Table 2 shows the extreme poverty rate (under USD1.9 per day) of the Tay ethnic group dropped to one-fourth after five years, from nearly 13% in 2011 to 3% in 2016. The “extremely poor” households gradually shifted to “moderately poor” (USD3.1-3.0 per day), “vulnerable” (USD3.1-5.5 per day) and “economically secure” (USD5.5-15 per day) groups. Therefore, the percentage of groups above “extreme poverty” rose considerably over the same 2011-2016 period.
Table 2.1. 3: Economic group structure of the Tay, 2011-2016
Extremely poor (below USD1.9
PPP/day)
Moderately poor (USD1.9-3.1 PPP/day)
Vulnerable (USD3.1-5.5
PPP/day)
Economically secure (USD5.5-
15 PPP/day)
Middle class (over USD15
PPP/day)
2011 12.9 35.8 39.0 11.9 0.3
2016 3.0 17.9 47.5 30.7 0.9
Source: Calculations by the research team based on VHLSS data
Strikingly, the percentage of middle-income people (over USD15 PPP/day) of the Tay ethnic group tripled from 0.3% in 2011 to nearly 0.9% in 2016. This offers a contrasting picture to the Hmong people as the middle-income share of the latter was 0% in the same study period.
Explanations for the Tay’s rapid poverty reduction over 2009-2015
The average distance from home to primary and lower secondary schools for Tay students was small (equivalent to the same distance for Hoa ethnic students). Although the distance from home to upper secondary school for Tay was about 10km, it was significantly further than for Hoa (about 3.6km), as high school students could cover this distance every day thanks to increasingly improved roads. This provides good opportunities for Tay children to pursue schooling and benefit from development and explains the high literacy rate of the Tay ethnic group, standing at 93.6% (equivalent to the rates of Kinh/Hoa). Similarly, the proportion of girls in primary, lower secondary and upper secondary schools in the Tay ethnic group was roughly equivalent to Kinh/Hoa.
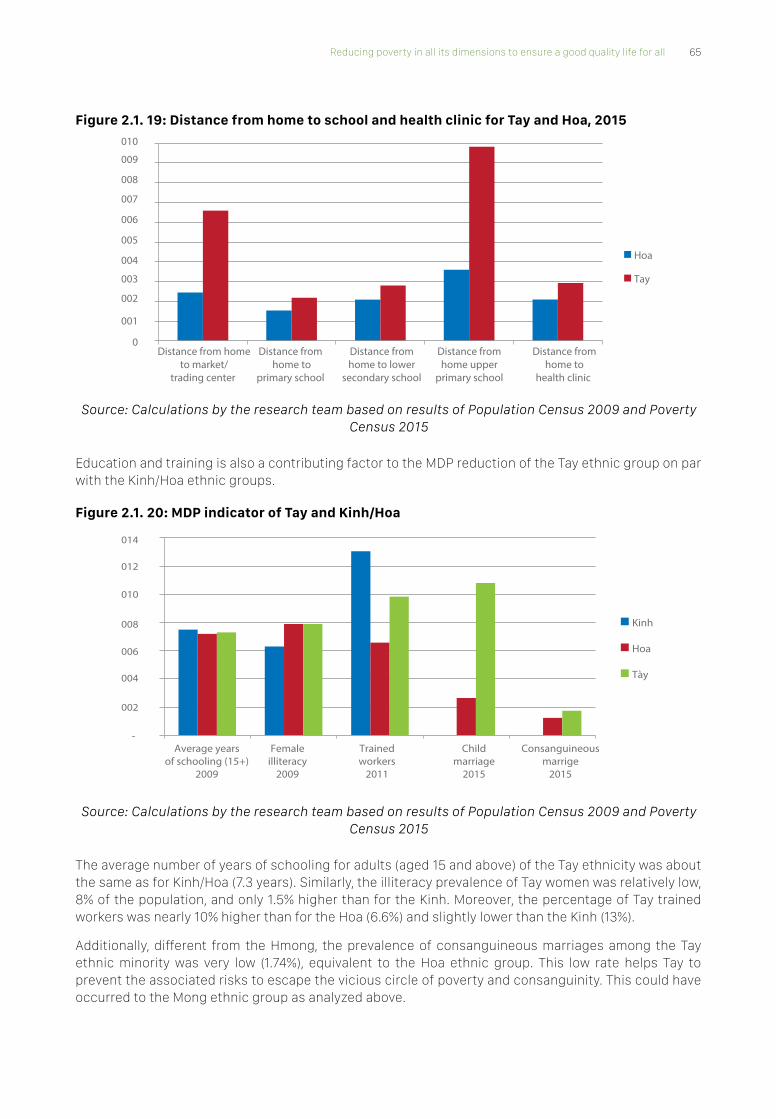
Reducing poverty in all its dimensions to ensure a good quality life for all 65
Figure 2.1. 19: Distance from home to school and health clinic for Tay and Hoa, 2015
001
0
002
003
004
005
006
007
008
009
010
Distance from hometo market/
trading center
Distance from home to
primary school
Distance fromhome to lower
secondary school
Distance fromhome upper
primary school
Distance fromhome to
health clinic
Hoa
Tay
Source: Calculations by the research team based on results of Population Census 2009 and Poverty Census 2015
Education and training is also a contributing factor to the MDP reduction of the Tay ethnic group on par with the Kinh/Hoa ethnic groups.
Figure 2.1. 20: MDP indicator of Tay and Kinh/Hoa
-
002
004
006
008
010
012
014
Average yearsof schooling (15+)
2009
Femaleilliteracy
2009
Trainedworkers
2011
Childmarriage
2015
Consanguineousmarrige
2015
Kinh
Hoa
Tày
Source: Calculations by the research team based on results of Population Census 2009 and Poverty Census 2015
The average number of years of schooling for adults (aged 15 and above) of the Tay ethnicity was about the same as for Kinh/Hoa (7.3 years). Similarly, the illiteracy prevalence of Tay women was relatively low, 8% of the population, and only 1.5% higher than for the Kinh. Moreover, the percentage of Tay trained workers was nearly 10% higher than for the Hoa (6.6%) and slightly lower than the Kinh (13%).
Additionally, different from the Hmong, the prevalence of consanguineous marriages among the Tay ethnic minority was very low (1.74%), equivalent to the Hoa ethnic group. This low rate helps Tay to prevent the associated risks to escape the vicious circle of poverty and consanguinity. This could have occurred to the Mong ethnic group as analyzed above.

66 Multidimensional poverty in Viet Nam
Another important reason for the fast-declining rate of MDP in the Tay ethnic group was related to wage earning livelihoods (Figure 21). The income of the Tay ethnic group in 2016 was nearly as high as the Kinh’s and national average, at 39% compared to 45% and 43.7%, respectively. The share of income from wages also increased significantly compared to 2012 (30.4%), at a faster rate than the Kinh’s (43.3% in 2012) and national average (41.5% in 2012).
Figure 2.1. 21: Income structure of the Tay in 2016 (%)
24.400
11.200 13.600
10.400
4.7005.300
8.600
2.8003.700
39.100
45.10043.700
7.200
18.600 16.800
4.10010.400 9.800
3.700 3.700 3.500
0%
10%
20%
30%
40%
50%
60%
70%
80%
90%
100%
Tay Kinh Total
Others
State tranfers
Renittances
Non - agriculture
Wage
Other agricultural activities
Livestock
Crop farming
Source: Calculations by the research team based on VHLSS data
Although the Tay ethnic group’s income share from farming was still nearly two-fold higher than the national figure and that of Kinh, it was only half that of the Mong people as analyzed earlier. In addition, the Tay’s share of income from State social assistance was very low (2.6%), even lower than the Kinh’s (3.5%) and the national average (3.7%).
c. Multidimensional poverty of Thai ethnic group
Of the 53 ethnic minorities in Viet Nam, the Thai comprise the second largest population after Tay. Between 2009-2015, the Thai population grew by about 11% from more than 1.55 million in 2009 to nearly 1.72 million in 2015.
The MDP rate of the Thai people fell dramatically from 44% in 2009 to 15.5% in 2015, significantly reducing the MDP gap with the Kinh majority from 31% in 2009 to 8.9% in 2015 (Figure 2.1. 22).

Reducing poverty in all its dimensions to ensure a good quality life for all 67
Figure 2.1. 22: MDP of the Thai and Kinh, 2009-2015
12.861
6.639
43.904
15.500
.00
5.00
10.00
15.00
20.00
25.00
30.00
35.00
40.00
45.00
50.00
MDP 2009 MDP 2015
Kinh
Thai
Source: Calculations by the research team based on results of Population Census 2009 and Poverty Census 2015
Despite the Thai’s fast-paced reduction in MDP compared to Kinh, large differences existed in poverty reduction rates in terms of specific MDP indicators between the two ethnic groups (Figure 2.1. 23).
Figure 2.1. 23: MDP indicators of the Thai and Kinh, 2009-2015
.000
10.000
20.000
30.000
40.000
50.000
60.000
70.000
Kinh
Thái
Adu
lt ad
ucat
ion
Scho
ol a
tten
danc
e
Hou
sing
qua
lity
Hou
sing
are
a <8
m2
Clea
n w
ater
Sani
tatio
n
Com
mun
icat
ion
serv
ices
Acc
ess
to in
form
atio
n
Hea
lth in
sura
nce
Adu
lt ad
ucat
ion
Scho
ol a
tten
danc
e
Hou
sing
qua
lity
Hou
sing
are
a <8
m2
Clea
n w
ater
Sani
tatio
n
Com
mun
icat
ion
serv
ices
Acc
ess
to in
form
atio
n
Hea
lth in
sura
nce
Poverty census 2015Population census 2009
Source: Calculations by the research team based on results of Population Census 2009 and Poverty Census 2015
The most dramatic reduction in MDP during 2009-2015 for the Thai people was in indicators for the education level of adults, poor quality housing and especially the use of telecommunications services. The proportion of Thai people who do not use telecommunication services fell sharply from 61% in 2009 to 21% in 2015, while that of Kinh also dropped sharply from 49% to 9.4% in the same period. The boom in development of telecommunication services nationwide during 2009-2015 was reflected by most ethnic

68 Multidimensional poverty in Viet Nam
minorities having gained access to these services, significantly improving the MPI indicator of access to information in provinces and nationwide.
In contrast, while the majority of MPI indicators experienced significant declines for Thai and Kinh ethnic groups, the proportion of households without safe water in fact increased for both ethnic groups. Specifically, the proportion of Thai people without safe water increased from 34.7% in 2009 to 36.2% in 2015 and the respective figures for the Kinh were 7.7% in 2009 and 12.8% in 2015.
The structural change by economic groups of the Thai during 2011-2016 was also very positive. Table 3 reveals the Thai “extreme poverty” rate (less than USD1.9 per day) fell more than three-fold from 25.4% in 2011 to 7% in 2016. Those formerly in “extreme poverty” moved up to “moderately poor” (USD1.9-3.1 per day), “vulnerable” (USD3.1-5.5 per day) and “economically secure” (USD5.5-15 per day) groups. Therefore, the percentage of groups above the “extreme poverty” group increased considerably over the same 2011-2016 period.
Table 2.1. 4: Economic group structure of the Thai, 2011-2016
Extremely poor (below USD1.9
PPP/day)
Moderately poor (USD1.9-3.1 PPP/day)
Vulnerable (USD3.1-5.5
PPP/day)
Economically secure (USD5.5-
15 PPP/day)
Middle class (over USD15
PPP/day)
2011 25.4 41.5 27.8 5.3 0.1
2016 7.0 27.2 47.2 18.4 0.2
Source: Calculations by the research team based on VHLSS data
Indicators related to poverty reduction of Thai people
The literacy rate of Thai people was nearly 81%, quite high compared to other ethnic groups in Viet Nam, such as Hmong (47.5%), Gia Rai (60%) and Bru Van Kieu (61%). This provides favourable conditions for trade and exchanges between Thai and Kinh people, in particular, as well as with other ethnic groups.
Figure 2.1. 24: Indicators of the Thai and Kinh/Hoa, 2009-2015
002
004
006
008
010
012
014
Kinh
Hoa
Thai
Average yearsof schooling (15+) 2009
Trained workers2011
Consanguineousmarrige 2015
Source: Calculations by the research team based on results of Population Census 2009 and Poverty Census 2015
The average schooling years for Thai people was about 6.5 years, one year less than the Kinh majority. While the percentage of trained Thai workers in 2011 was 5.4%, it exceeded 13% for Kinh.

Reducing poverty in all its dimensions to ensure a good quality life for all 69
The Thai population was also considered successful in reducing MDP during 2009-2015, with livelihoods a key driver. In particular, in 2016, one-third of Thai income was from wages and this share was 15% lower for Kinh and the national average (Figure 22). Compared to 2012, the share rose significantly from 21.6% to 30.2% and this increase among Thai was higher than for Kinh and the national average.
Figure 2.1. 25: Income structure of the Thai in 2016 (%)
28.900
11.200 13.600
9.400
4.7005.300
13.200
2.8003.700
30.200
45.10043.700
3.600
18.600 16.800
5.300 10.400 9.800
2.900 3.700 3.500
0%
10%
20%
30%
40%
50%
60%
70%
80%
90%
100%
Thái Kinh Chung
Others
State tranfers
Renittances
Non - agriculture
Wage
Other agricultural activities
Livestock
Crop farming
Source: Calculations by the research team based on VHLSS data
Although the Thai’s income share from farming decreased from 36.2% in 2012 to 28.9% in 2016, it was nearly three times higher than for Kinh and 2.5-fold the national average in 2016. In contrast, the share of non-agricultural income for Thai was only one-fifth of the national average and about one-sixth of that for Kinh. Income from remittances was only about half of the two reference groups in 2016.
d. Multidimensional poverty of Muong ethnic group
Among all ethnic minorities, the Muong’s MDP rate was the second lowest, standing at 10.7% in 2009 (lower than the national average of 18.6% and 12.9% for Kinh). The Muong’s MDP rate continued to fall to 3.9% in 2015, only half that of the Kinh population (Figure 2.1. 26). Meanwhile, the Muong population grew rapidly (approximately 70%) from 823,071 people in 2009 to 1,395,101 in 2015. This observation is worth a detailed analysis and explanation.

70 Multidimensional poverty in Viet Nam
Figure 2.1. 26: MDP of Muong and Kinh, 2009-2015
12.861
6.639
10.711
3.880
.00
2.00
4.00
6.00
8.00
10.00
12.00
14.00
MDP 2009 MDP 2015
Kinh
Muong
Source: Calculations by the research team based on results of Population Census 2009 and Poverty Census 2015
For each component indicator of the MPI, the 2005 Poverty Census data shows that compared to the Kinh majority, most Muong poverty indicators were lower - except the education level of adults (Figure 2.1. 27).
Among component indicators, the indicator of non-usage of telecommunication services for Muong and Kinh underwent the strongest drop from 30% in 2009 to 8.2% in 2015 for the former and 49% to 9.4% for the latter during the same period.
Figure 2.1. 27: MDP indicators of Muong and Kinh, 2009-2015
.0005.000
10.00015.00020.00025.00030.00035.00040.00045.00050.000
Kinh
Muong
Adu
lt ad
ucat
ion
Scho
ol a
tten
danc
e
Hou
sing
qua
lity
Hou
sing
are
a <8
m2
Clea
n w
ater
Sani
tatio
n
Com
mun
icat
ion
serv
ices
Acc
ess
to in
form
atio
n
Hea
lth in
sura
nce
Adu
lt ad
ucat
ion
Scho
ol a
tten
danc
e
Hou
sing
qua
lity
Hou
sing
are
a <8
m2
Clea
n w
ater
Sani
tatio
n
Com
mun
icat
ion
serv
ices
Acc
ess
to in
form
atio
n
Hea
lth in
sura
nce
Poverty census 2015Population census 2009
Source: Calculations by the research team based on results of Population Census 2009 and Poverty Census 2015

Reducing poverty in all its dimensions to ensure a good quality life for all 71
Changes in the economic group structure of the Muong ethnic group during 2011-2016 were also positive. Table 2.1.5 shows the extreme poverty rate (under USD1.9 per day) of the Muong ethnic group fell more than four times from nearly 13.9% in 2011 to 3.2% in 2016 (USD3.1-3.5 per day). Those formerly in the “extremely poor” group moved up to the “vulnerable” (USD3.1-5.5 per day) and “economically secure” (USD5.5-15 per day) groups. Therefore, the share of groups above “extreme poverty” grew considerably over the same 2011-2016 period.
Table 2.1.5: Economic group structure of Muong, 2011-2016
Extremely poor (below USD1.9
PPP/day)
Moderately poor (USD1.9-3.1 PPP/day)
Vulnerable (USD3.1-5.5
PPP/day)
Economically secure (USD5.5-
15 PPP/day)
Middle class (over USD15
PPP/day)
2011 13.9 38.1 37.4 10.4 0.3
2016 3.2 19.7 48.4 27.9 0.7
Source: Calculations by research team based on VHLSS data
Remarkably, the proportion of Muong middle-class people (more than USD15 PPP per day) more than doubled from 0.3% in 2011 to 0.7% in 2016.
Reasons why multidimensional poverty of Muong was lower than for Kinh
The literacy rate among the Muong was 91%, only 3% lower than for the Kinh majority. That said, most Muong and Kinh people can read and write Vietnamese – a crucial factor facilitating exchanges and learning between the two with language barriers considered a hindrance to development of ethnic minority groups.
Figure 2.1. 28: Indicators for years of schooling and trained workers of Muong and Kinh/Hoa
-
02
04
06
08
10
12
14
Kinh
Hoa
Muong
Average yearsof schooling (15+) 2009
Trained workers2011
Consanguineousmarrige 2015
Source: Calculations by the research team based on results of Population Census 2009 and Poverty Census 2015
The average schooling years for Muong was similar to the Kinh’s and the proportion of trained workers reflected the Hoa’s (Figure 28). While the prevalence of consanguineous marriages among most ethnic minority groups was high, this percentage for Muong was 1.7% (slightly higher than the Chinese’s 1.2%) according to ethnic minority survey data in 2015. These factors may partly explain the Muong’s MDP reduction achievements compared to the Kinh’s over the same period.

72 Multidimensional poverty in Viet Nam
Moreover, the illiteracy rate of Muong women was low and sharply declined during 2009-2015. Combined with the similar proportion of Muong and Kinh female students at all school levels (Figure 2.1. 29), its shows the Muong’s educational component development compared to Kinh counterparts in the recent period.
Figure 2.1. 29: Illiteracy and education of female Muong and Kinh
-
10
20
30
40
50
60
2009 2015
Kinh
Muong
Fem
ale
illet
erac
y
Fem
ale
stud
ents
in p
rimar
y sc
hool
Fem
ale
stud
ents
in lo
wer
seco
ndar
y sc
hool
Fem
ale
stud
ents
in u
pper
seco
ndar
y sc
hool
Fem
ale
illet
erac
y
Fem
ale
stud
ents
in p
rimar
y sc
hool
Fem
ale
stud
ents
in lo
wer
seco
ndar
y sc
hool
Fem
ale
stud
ents
in u
pper
seco
ndar
y sc
hool
Source: Calculations by the research team based on results of Population Census 2009 and Poverty Census 2015
Another reason for the Muong’s low MDP rate compared to other ethnic minorities is the small distances to markets, schools and health clinics equivalent to the distances encountered by Hoa (Figure 2.1. 30).
Figure 2.1. 30: Distance to markets, schools and health clinics for Muong and Hoa, 2015
-
01
02
03
04
05
06
07
08
09
10
Hoa
Muong
Distance from hometo market/
trading center
Distance from home to
primary school
Distance fromhome to lower
secondary school
Distance fromhome upper
primary school
Distance fromhome to
health clinic
Source: Calculations by the research team based on results of Population Census 2009 and Poverty Census 2015
The final explanation for the Muong’s impressive MDP reduction was excellent reproductive health care for women of this ethnic group, even better than for Hoa (Figure 2.1.31).

Reducing poverty in all its dimensions to ensure a good quality life for all 73
Figure 2.1.31: Reproductive health of the Muong and Hoa, 2015
-
10
20
30
40
50
60
70
80
90
100
Women in reproductiveage using contraceptives
Assisted births At least three antenatalcare visits to health clinics
Hoa
Muong
Source: Calculations of the research team based on data of the Poverty Census 2015
Up to 83% of reproductive aged women (15-49 years old) used contraceptives, while this rate among Hoa was only 71%. More than 95% of Muong women had the support of health workers during child birth and more than 70% of Muong pregnant women attended at least three antenatal visits at health facilities in 2015. These numbers were the highest of all ethnic minorities included in the 2015 Viet Nam Poverty Census.
Another important reason for the low poverty rate and rapid rate of poverty reduction among Muong people relates to wage-earning livelihoods (Figure 2.1. 32). Specifically, in 2016, the income share from wages was 39.8%, nearly equal to the Kinh’s (45.1%) and the national rate (43.7%). In addition, the income share from farming only accounted for about a fifth of the Muong’s total income and was not significantly higher than the Kinh’s and the national figure in 2016.
Figure 2.1. 32: Income structure of the Muong 2016 (%)
18.50011.200 13.600
10.600
4.700 5.300
6.600
2.8003.700
39.800
45.10043.700
8.0018.600 16.800
11.300 10.400 9.800
2.600 3.700 3.500
0%
10%
20%
30%
40%
50%
60%
70%
80%
90%
100%
Muong Kinh Total
Others
State tranfers
Remittances
Non - agriculture
Wage
Other agricultural activities
Livestock
Crop farming
Source: Calculations by the research team based on VHLSS data
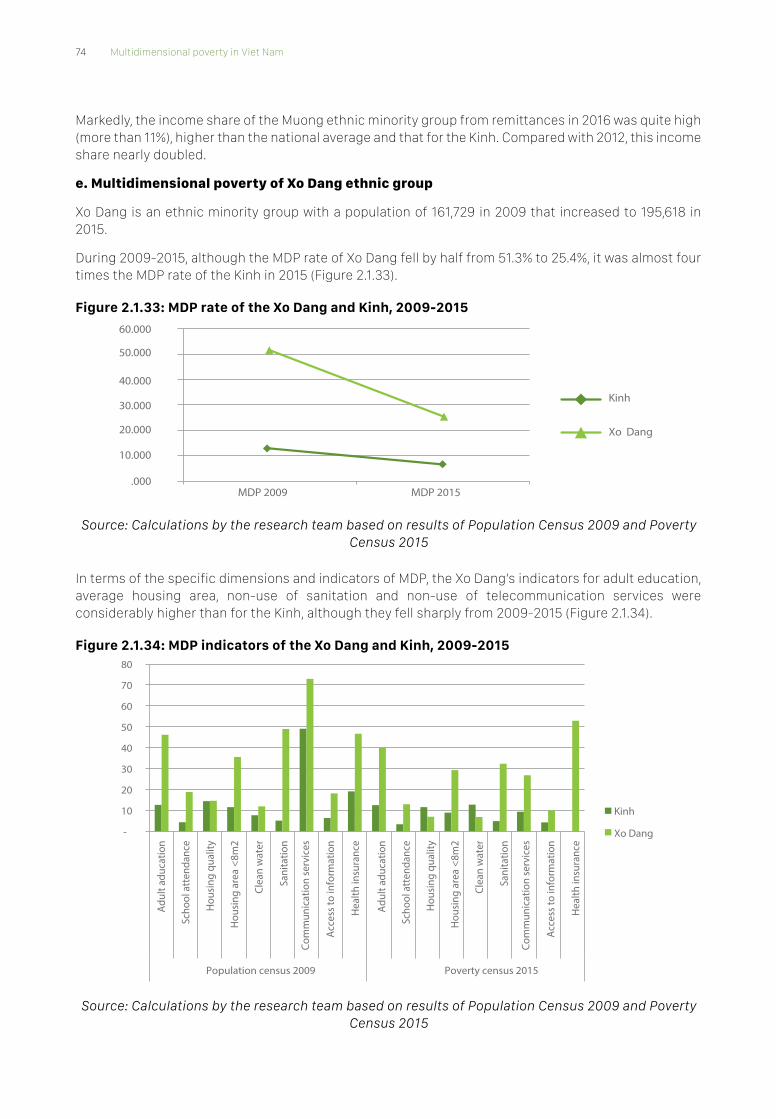
74 Multidimensional poverty in Viet Nam
Markedly, the income share of the Muong ethnic minority group from remittances in 2016 was quite high (more than 11%), higher than the national average and that for the Kinh. Compared with 2012, this income share nearly doubled.
e. Multidimensional poverty of Xo Dang ethnic group
Xo Dang is an ethnic minority group with a population of 161,729 in 2009 that increased to 195,618 in 2015.
During 2009-2015, although the MDP rate of Xo Dang fell by half from 51.3% to 25.4%, it was almost four times the MDP rate of the Kinh in 2015 (Figure 2.1.33).
Figure 2.1.33: MDP rate of the Xo Dang and Kinh, 2009-2015
.000
10.000
20.000
30.000
40.000
50.000
60.000
MDP 2009 MDP 2015
Kinh
Xo Dang
Source: Calculations by the research team based on results of Population Census 2009 and Poverty Census 2015
In terms of the specific dimensions and indicators of MDP, the Xo Dang’s indicators for adult education, average housing area, non-use of sanitation and non-use of telecommunication services were considerably higher than for the Kinh, although they fell sharply from 2009-2015 (Figure 2.1.34).
Figure 2.1.34: MDP indicators of the Xo Dang and Kinh, 2009-2015
-
10
20
30
40
50
60
70
80
Kinh
Xo Dang
Adul
t adu
catio
n
Scho
ol a
tten
danc
e
Hou
sing
qua
lity
Hou
sing
are
a <8
m2
Clea
n w
ater
Sani
tatio
n
Com
mun
icat
ion
serv
ices
Acce
ss to
info
rmat
ion
Hea
lth in
sura
nce
Adul
t adu
catio
n
Scho
ol a
tten
danc
e
Hou
sing
qua
lity
Hou
sing
are
a <8
m2
Clea
n w
ater
Sani
tatio
n
Com
mun
icat
ion
serv
ices
Acce
ss to
info
rmat
ion
Hea
lth in
sura
nce
Poverty census 2015Population census 2009
Source: Calculations by the research team based on results of Population Census 2009 and Poverty Census 2015

Reducing poverty in all its dimensions to ensure a good quality life for all 75
For example, the Xo Dang indicator for not using telecommunication services in 2009 exceeded 70%, but dropped below 30% in 2015. Regarding the education level, in 2009 the literacy rate of Xo Dang was quite high (about 80%) and the average number of years of schooling of the population was only six years (1.5 years less than the Kinh). Moreover, the percentage of trained Xo Dang workers was only about one-fifth of the Kinh (2.5% compared to 13% in 2011) (Figure 2.1.35).
Figure 2.1.35: Education of the Xo Dang and Kinh, 2009-2015
-
10
20
30
40
50
60
70
80
90
100
Literacy inVietnamese 2009
Years of schooling(15+) 2009
Trained workers2011
Kinh
Xo Dang
Source: Calculations by the research team based on results of Population Census 2009 and Poverty Census 2015
The illiteracy rate of Xo Dang women was quite high and seemed to increase rapidly during 2009-2015 from 25% to 35%, while this rate of the Chinese was only about 10% (Figure 2.1.36).
Figure 2.1.36: Female illiteracy rate of the Xo Dang and Kinh/Hoa, 2009-2015
-
05
10
15
20
25
30
35
40
Female illiteracy 2009 Female illiteracy 2015-
Kinh
Hoa
Xo Dang
Source: Calculations by the research team based on results of Population Census 2009 and Poverty Census 2015
Compared to the Hoa, the distance from home to the market or trade centre for the Xo Dang was nearly nine times more, with the latter travelling more than 21km to reach the market in contrast to more than 2km by the Hoa who enjoy better roads.
The higher the schooling level, the greater the distance to school Xo Dang students must go. For example, lower secondary school students must travel 4.6km to get to school and upper secondary school students must go nearly 19km, while their Chinese counterparts must journey only 2km and 3.6km (Figure 2.1. 37).

76 Multidimensional poverty in Viet Nam
Figure 2.1. 37: Distance to market, school and health clinic of the Xo Dang and Kinh
-
05
10
15
20
25
Hoa
Xo Dang
Distance from hometo market/
trading center
Distance from home to
primary school
Distance fromhome to lower
secondary school
Distance fromhome upper
primary school
Distance fromhome to
health clinic
Source: Calculations by the research team based on results of Population Census 2009 and Poverty Census 2015
The distance from home to the nearest clinic for the Xo Dang was about 4km, while for the Chinese it was only 2km in 2015.
The change in structure of the Xo Dang by economic groups during 2011-2016 was not as positive as for the Muong, Tay and Thai. Table 2.1.6 shows the extreme poverty rate (under USD1.9 per day) of the Xo Dang was rather high and only decreased by 10% from 4.4% in 2011 to 30.5% in 2016. The “extremely poor” group gradually moved to “vulnerable” (USD3.1-5.5 per day) and the “economically secure” (USD5.5-15 per day).
Table 2.1.6: Economic group structure of Xo Dang, 2011-2016
Extremely poor (below USD1.9
PPP/day)
Moderately poor (USD1.9-3.1 PPP/day)
Vulnerable (USD3.1-5.5
PPP/day)
Economically secure (USD5.5-
15 PPP/day)
Middle class (over USD15
PPP/day)
2011 40.4 38.5 18.2 2.7 0.2
2016 30.5 34.8 28.3 6.4 0.0
Source: Calculations by research team based on VHLSS data
The proportion of Xo Dang population in “moderate poverty” (USD1.9-3.1 per day) among also fell slightly from 38.5% to 34.8% during 2011-2016. Nevertheless, the share of middle-class people (over USD15 PPP/day) in the Xo Dang population decreased from 0.2% in 2011 to 0% in 2016.
f. Multidimensional poverty of Gia Rai ethnic group
Gia Rai is a ethnic minority group in Viet Nam with a population of 469,789 people in 2015 and compared to 2009, it increased by about 14% with an absolute rise of 58,514. The Gia Rai are largely located in the Central Highlands, with 90% in Gia Lai province. The Gia Rai is traditionally a matriarchal society where a woman is free to choose her lover and manage her married life.
During 2009-2015, the MDP rate of the Gia Rai ethnic group decreased dramatically from 75% to nearly 48%. Although the poverty gap also fell sharply, the MDP rate of Gia Rai was still seven times higher than the Kinh’s poverty rate in 2015 (Figure 2.1. 38).

Reducing poverty in all its dimensions to ensure a good quality life for all 77
Figure 2.1. 38: MDP rate of the Gia Rai and Kinh, 2009-2015
.00
10.00
20.00
30.00
40.00
50.00
60.00
70.00
80.00
MDP 2009 MDP 2015
Kinh
Gia-Rai
Source: Calculations by the research team based on results of Population Census 2009 and Poverty Census 2015
In specific dimensions and indicators, despite decreasing trends during 2009-2015, most MDP indicators of the Gia Rai were considerably higher than those of the Kinh (Figure 2.1.39).
Figure 2.1.39: MDP indicators of the Gia Rai and Kinh/Hoa, 2009-2015
-
10
20
30
40
50
60
70
80
90
Kinh
Hoa
Gia-Rai
Adul
t adu
catio
n
Scho
ol at
tend
ance
Hous
ing
quali
ty
Hous
ing
area
<8m
2
Clea
n wa
ter
Sani
tatio
n
Com
mun
icatio
n se
rvice
s
Acce
ss to
info
rmat
ion
Healt
h in
sura
nce
Adul
t adu
catio
n
Scho
ol at
tend
ance
Hous
ing
quali
ty
Hous
ing
area
<8m
2
Clea
n wa
ter
Sani
tatio
n
Com
mun
icatio
n se
rvice
s
Acce
ss to
info
rmat
ion
Healt
h in
sura
nce
Source: Calculations by the research team based on results of Population Census 2009 and Poverty Census 2015
For example, the education indicator of Gia Rai adults was almost unchanged during 2009-2015 and about five times higher than the Kinh majority’s. In other words, 60% of Gia Rai households had at least one member aged 15 years or more who did not graduate from lower secondary school and was not currently enrolled in school. The Gia Rai people’s lack of clean water and hygienic latrines improved little and the deprivation rates were significantly higher than for the Kinh. The Gia Rai’s most prominent MDP reduction achievement during 2009-2015 was the reduction in the indicator of non-use of telecommunication services from 90% to 42%. However, this happened with most other ethnic minorities during the same period due to the explosion in technology and telecommunications services companies in Viet Nam.

78 Multidimensional poverty in Viet Nam
Language barriers could be one of the causes for the higher poverty rate among Gia Rai than other ethnic minorities. Gia Rai’s literacy rate was about 60% and the average number of schooling years was less than the Kinh’s by nearly two years, while the percentage of trained Gia Rai workers was about 10% lower than of Kinh people (3.3% versus 13.1% in 2011) (Figure 2.1.40).
Figure 2.1.40: Education of the Gia Rai and Kinh
Literacy inVietnamese 2009
Years of schooling(15+) 2009
Trained workers2011
-
10
20
30
40
50
60
70
80
90
100
Kinh
Gia Rai
Source: Calculations by the research team based on results of Population Census 2009 and Poverty Census 2015
The group of factors related to reproductive health of Gia Rai women may have been affected by the past poverty status of this ethnic group. Compared to the 3% prevalence of underage marriage in the Hoa ethnic group, the prevalence of child marriage for Gia Rai was 42% and the prevalence of consanguineous marriage was more than 9%. Moreover, only 23% of Gia Rai ethnic women had antenatal care visits at least three times in medical facilities during pregnancy, while this percentage for the Hoa was 58% and 74% for the Muong ethnic group (Figure 2.1.41).
Figure 2.1.41: Reproductive health of Gia Rai and Hoa, 2015
-
10
20
30
40
50
60
70
80
90
Childmarriage
Consanguineousmarriage
Women ofreproductive age
usingcontraceptives
Assistedbirths
At least threeantenatal carevisits to health
clinics
Hoa
Gia Rai
Source: Calculations by research team based on Poverty Census 2015 data
The change in economic group structure of the Gia Rai during 2011-2016 was quite positive, as was the case for the Muong, Tay and Thai. Table 2.1.7 shows the share of the “extremely poor” (under USD1.9 per

Reducing poverty in all its dimensions to ensure a good quality life for all 79
day) of the Gia Rai was rather high and almost halved during 2011-2016 (37.6% in 2011 to 20.8% in 2016). The “extremely poor” group gradually moved to the “vulnerable” (USD3.1-5.5 per day) and “economically secure” (USD5.5-15 per day) groups.
Table 2.1.7: Economic group structure of the Gia Rai, 2011-2016
Extremely poor (below USD1.9
PPP/day)
Moderately poor (USD1.9-3.1 PPP/day)
Vulnerable (USD3.1-5.5
PPP/day)
Economically secure (USD5.5-
15 PPP/day)
Middle class (over USD15
PPP/day)
2011 37.6 38.6 20.4 3.2 0.3
2016 20.8 34.8 35.6 8.8 0.0
Source: Calculations by research team based on VHLSS data
The share of Gia Rai “moderately poor” (USD1.9-3.1 per day) also slightly decreased from 38.6% to 34.8% during 2011-2016. However, the share of middle-class (over USD15 PPP/day) of the Gia Rai fell from 0.3% in 2011 to 0% in 2016.
Chapter 2.2. Multidimensional poverty among people with disabilities
The Viet Nam National Survey on People with Disabilities (VDS), conducted in 2016 with a sample of 35,029 households and designed based on set of questions for disability monitoring and evaluation of the Washington Group on Disability Statistics (WG) and household demographic questions, provides the basis to study MDP in people with disabilities.
There are many definitions of people with disabilities, such as “[A] person with disabilities means a person who is impaired in one or more body parts or suffers functional decline manifested in the form of disability which causes difficulties to his/her work, daily life and study” (Law on Persons with Disabilities, Law No.51/2010/QH12). Persons with disabilities are defined as those who have a health condition that makes it difficult to perform basic or general activities, which puts them at greater risk than people without disabilities when engaging in unfitting environments. (The social model of disability. WG, Convention of the Rights of Persons with Disabilities, SDGs, and Incheon strategies all abide by this model). In accordance with the social model of disability, WG developed a short set and an extended set of questions to assess six functional domains of seeing, hearing, walking, cognition, self-care, and communication and four levels on severity scale from “no difficulty”, “some difficulty”, “a lot of difficulty” and “cannot do it at all”. A person who has a lot of difficulty or cannot perform at least two functional domains is considered a person with disabilities.
Disability greatly affects the quality of life in ways beyond the control of people with disabilities and of households whose members have disabilities. In addition, difficulties due to lack of access to basic social services exacerbate the situation of people with disabilities and of households with members with disabilities. Disability and MDP are interrelated, as disability is a cause and consequence of MDP. Disability can be caused by a lack of knowledge, poor health and nutritional status, unsanitary conditions, unsafe living and working conditions, and polluted living environments. Conversely, disability is a barrier for people with disabilities and their families to access basic social services, find jobs and create a stable and decent life. Families of persons with disabilities have additional burdensome expenses for people with disabilities, and must spend time and labour caring for people with severe disabilities as they often cannot look after or may even harm themselves.

80 Multidimensional poverty in Viet Nam
2.2.1. People with disabilities in multidimensionally poor households by region and some demographic characteristics
In 2016, Viet Nam had 17.8% of people with disabilities living in multidimensionally poor households in accordance with the government’s Multidimensional Poverty Guideline for 2016-2020. About 66% of persons with disabilities living in multidimensional poor households were also deprived in access to at least three out of 10 basic social services. In particular, among persons with disabilities who lived in poor ethnic minority (other than Kinh/Hoa) households, 79% were in MDP.
Figure 2.2.1: Proportion of people with disabilities in multidimensionally poor households by area, region and ethnic group
.00
5.00
10.00
15.00
20.00
25.00
30.00
35.00
40.00
45.00
50.00
Urban
7.8
Rural
8
21.0
9.77
28.7
15.2
30.8
6.6
27.4
13.6
45.0
Red riverdelta
NorthMountain
and Midland
Northcentral
and CentralCoastal
SouthEast
Kinh/Hoa
CentralHighlands
MekongRiverDelta
Otherethnicgroups
Source: Calculations by research team based on VDS 2016 data
The difference in proportion of people with disabilities in multidimensionally poor households was pronounced between urban-rural areas as well as across regions, age groups and ethnic groups (Figure 2.2.1). For every 10 persons with disabilities, more than four lived in multidimensionally poor households if they were ethnic minorities and similarly about three lived in multidimensionally poor households if they lived in the Northern Midlands and Mountains, Central Highlands or Mekong River Delta and about two if they lived in the countryside. People with disabilities in the Kinh/Hoa group, from urban areas or other regions were much less likely to be in MDP (7%-15%). The percentage of people with disabilities in multidimensionally poor households was lowest in urban areas and the South East (6%-7%), only one-fifth of those in MDP living in the Central Highlands.
Figure 2.2.2 shows that people with disabilities living in multidimensionally poor households were most concentrated in the Mekong River Delta, accounting for nearly one-third of all people with disabilities in the country. Although people with disabilities’ risk of living in multidimensionally poor households in the North and Central Coast was not high, about half that in the Central Highlands, the number of people with disabilities living in multidimensionally poor households was not small, accounting for 23.3% of all people with disabilities in the country. The third most concentrated region with people with disabilities, accounting for 20.2%, was the Northern Midlands and Mountains area, one of three regions with the highest percentage of people with disabilities living in poor households. Meanwhile, in the South East, the proportion and share of people with disabilities living in multidimensionally poor households were the lowest in the country, at 6.6% and 4.3%, respectively. Overall, the distribution of people with disabilities in multidimensional poor households was mostly in rural areas (89.4%) and Kinh/Hoa (66.7%).

Reducing poverty in all its dimensions to ensure a good quality life for all 81
Figure 2.2.2: Distribution of people with disabilities in multidimensionally poor households across regions
4.3
3 1
7.3
1 .7
13.0
23.3
2 00 .2
Red river delta
North central and Central Coastal
North Mountain and Midland
Central Highlands
South East
Mekong River Delta
By age group, the proportion of people with disabilities in multidimensionally poor households tended to decrease as age increased (Figure 2.2.3). The difference was clear and statistically significant between the group of people with disabilities aged 40 years and below and those aged 41 and older (11%). Considering the distribution by age group, the proportion of people with disabilities aged 15-17 years living in multidimensionally poor households accounted for the lowest share (2.2%) and the 65 and older age group accounted for the highest share (40.5%), followed by the 41-64 age group (28.9%). The remaining two age groups (2-14 years old and 18-40 years old) accounted for about 14% of the total population of people with disabilities living in MDP.
Figure 2.2.3: Proportion of people with disabilities living in multidimensionally poor households, by age group
Under 15 15 -17 18 -40 41-64 From 65.00
5.00
10.00
15.00
20.00
25.00
30.00
35.00
27.0
31.5
25.7
17.3
14.4
Source: Calculations by research team based on VDS 2016 data
Nationally, the proportions of people with disabilities living in multidimensional poor households were not significantly different between sex groups, religious or non-religious groups. However, when disaggregated by region and sex, region and religion, differences emerged. In the Northern Midlands and Mountains and in the Mekong River Delta, the proportion of men with disabilities in poor households was higher than of women in poor households by 4.5% (31.1% versus 26.8% and 30% versus 25.5%, respectively). In contrast to these two regions, in the Red River Delta, the proportion of women with disabilities living in poor households was higher than of men by about 5% (11.8% versus 6.6%, respectively). This trend between religious/non-religious groups only occurred in the Central Highlands where the difference between the two groups was about 15%. In this region, the proportion of non-religious people with disabilities living in MDP households was 23.8%, while the percentage for the religious group was 38.6%.

82 Multidimensional poverty in Viet Nam
2.2.2. People with disabilities in multidimensionally poor households and types of disabilities
The proportion of persons with disabilities aged 16 or older living in multidimensionally households in 2016 was 16.6% nationwide. Details of the types of disabilities are shown in Figure 2.2.4. There are clear differences among types of disabilities, with the two most common being upper mobility impairment and cognition, with the incidences of each type of disabilities having stood at 55%, followed by 37.4% of people with disabilities in MDP who have difficulty or cannot carry out upper body movements, such as lifting heavy objects up to 2kg, picking up small objects, showering/bathing or dressing themselves. Psycho-social disabilities had the lowest incidence (14.3%). Out of 10 people with disabilities living in poor households, more than five people had two or more disabilities, nearly four had three or more types of disability and more than two had four or more disabilities.
Figure 2.2.4: Proportions of people with disabilities aged 16 years or older living in multidimensionally poor households, by type of disabilities
21.2
18.7
55.2
17.7
54.7
20.9
37.4
14.3
Nhìn/ Vision
Nghe/ Hearing
Vận động thân dưới/ Lower Mobility
Giao tiếp/ Communication
Nhận thức/ Cognition
Tựchăm sóc/ Self-care
Vận động thân trên/ Upper Mobility
Thần kinh/ Psycho-Social
Source: Calculations by research team based on VDS 2016 data
Among children with disabilities aged 2-15 years in Viet Nam, 27.8% lived in multidimensionally poor households. The proportions of children aged 2-15 years living with disabilities in MDP by type of disability is shown in Figure 2.2.5. The set of questions to determine a child has a disability or not is used separately from the adult questionnaire. There are two sets of disability questions for those aged 2-4 and 5-15 years. Questions about self-care do not apply to children aged 2-4 years and questions related to upper body mobility do not apply to those aged 5-15 years. The results show the most children with disabilities in multidimensionally poor families had mental disabilities, at 76.7%. The next two most common types of disabilities were cognitive impairment (very difficult or cannot learn like other children the same age (36.3%)) and communication (children had difficulty or cannot communicate with family members or vice versa (31.0%)). Children with vision impairment accounted for the lowest percentage of children with disabilities in poor households (7.1%). Out of every 10 children with disabilities in multidimensionally poor households, up to four had at least two types of disabilities, most of whom had mental disabilities (accounting for 85% of children with at least two types of disabilities).

Reducing poverty in all its dimensions to ensure a good quality life for all 83
Figure 2.2.5: Proportions of children aged 2-15 in multidimensionally poor households by type of disability
7.1 13.4
20.1
31.0
36.3
12.6
12.1
76.7
Nhìn/ Vision
Nghe/ Hearing
Vận động thân dưới/ Lower Mobility
Giao tiếp/ Communication
Nhận thức/ Cognition
Tựchăm sóc/ Self-care (5-15)
Vận động thân trên/ Upper Mobility (2-4)
Thần kinh/ Psycho-Social
Source: Calculations by research team based on VDS 2016 data
2.2.3. People with disabilities in multidimensionally poor households, deprivations by dimension
In all MDP indicators, people with disabilities living in MDP faced the least deprivation in indicators related to access to health services and health insurance for people aged 6 and older, 14.2% and 16.5% respectively (Figure 2.2.6). The highest deprivation rate is found in the indicator education of adults aged 15-30 years, with up to 82.8% of people with disabilities in MDP not attending school or did not graduate from lower secondary school, followed by the indicator of hygienic conditions (or shortage of sanitary latrines) whose deprivation stood at 72.7%. Housing quality is also noticeable as 57.0% of people with disabilities in multidimensionally poor households lived in unstable and rudimentary houses. Out of the 10 indicators for access to basic social services, people with disabilities in MDP were significantly more likely than people without disabilities to be deprived in five indicators (differences ranged from 9% to 22%), lower deprivation in four indicators including health insurance, housing quality, housing area and drinking water (differences from 5% to 12%). The only insignificant difference was in sanitation.

84 Multidimensional poverty in Viet Nam
Figure 2.2.6: Deprivations in basic social services of people with disabilities in 2016
5.0
28.8
57.2
11.7
66.6
37.6
28.9
74.8
13.6
24.7
14.2
16.5
82.8
33.4
57.0
25.8
23.8
72.7
31.8
37.9
Persons without disabilities Persons with disabilities
Adult aducation
ChildSchool attendance
Housing area per capita
Sanitation
Drinking water Housing quality
Use ofCommunication services
Access to information
Access to healthcare
Health insurance(over 6 years old)
Source: Calculations by research team based on VDS 2016 data
2.2.4. People with disabilities in multidimensionally poor households and employment
Nationwide, 35.9% of people with disabilities aged 15 and over who lived in multidimensionally poor households worked to generate income for themselves or their families in 2016. This rate was 42% lower than the employment rate of those aged 15 and over. In reality, elderly people account for a large proportion of people with disabilities. Apart from several limitations in terms of hearing, vision, communication, cognitive and neurological functions, limited education restricts their job opportunities.
The proportions of people with disabilities in MDP who had income-generating jobs have significant regional, ethnic and gender differences (Figure 2.2.7). People with disabilities who lived in rural areas, are ethnic minorities or males had higher employment rates than those who lived in urban areas (by 5.4%), are Kinh/Hoa (by 12.4%) or female *(by 6.4%).
Figure 2.2.7: Proportions of people with disabilities in multidimensionally poor households with income-generating jobs
.005.00
10.0015.0020.0025.0030.0035.0040.0045.00
3 11 .136.5
32.1
4 44 .539.7
33.435.9
Urban Rural Kinh/Hoa
Ethnicgroup
Male Female Total
Source: Calculations by research team based on VDS 2016 data

Reducing poverty in all its dimensions to ensure a good quality life for all 85
A cognitive disability (47.6%) was the most common type for those in MDP, followed by lower body immobility (very difficult or unable to walk/climb steps) at 35.2%. In particular, even those with self-care disabilities still had jobs, although this proportion was low, as only 2.7% of people with disabilities in MDP worked. Other types of disabilities related to hearing, vision, upper body mobility, communication and mental from 7% to 16%. Out of every 10 people with disabilities in multidimensionally poor households with an income-earning job, nearly three had multiple disabilities (at least two).
Among those with disabilities more than 15 years of age and not in employment, less than 1% were looking for a job. The main reasons for limited job search motivation were having small children, still in school or too old and weak (58.2%), having disabilities (18.1%), and loss of working capacity (23.4%). There was no significant difference in job-seeking outcomes by sex and ethnicity, but there was a clear difference between urban and rural areas (4.6% and 0.3%, respectively). Other reasons why people with disabilities did not search for employment included unsuitable jobs, limited job-seeking capacity, inadequate skills/experience, housework/child care and temporary sickness.
For people with disabilities who lived in multidimensionally poor households and did not wish to find a job, yet met at least one requirement (appropriate training, transportation, job search assistance, supporting technologies and tools, workplace facilities and conditions appropriate for people with disabilities) nearly 3% were willing to work or look for jobs. The remainder of respondents, the vast majority, said they would not work nor look for jobs in any situation.
The percentages of people with disabilities willing to work or look for jobs were all low by region, ethnic group and sex. The highest percentages were for urban areas and “other” ethnic groups, but only at 7.3% and 4.2%, respectively. There was no significant difference between men and women with disabilities in poor households willing to work or look for jobs if conditions were met.
Figure 2.2.8: Proportions of people with disabilities living in multidimensionally poor households willing to work if conditions were met
Urban Rural Kinh/Hoa
Ethnicgroup
Male Female Total.00
2.00
4.00
6.00
8.00 7.3
2.1 2.1
4.2
2.8 2.6 2.7
Source: Calculations by research team based on VDS 2016 data
2.2.5. People with disabilities in multidimensionally poor households and social assistance
Social protection is essential for vulnerable people, especially those with disabilities in multidimensionally poor households. In fact, many assistance policies and programmes have been implemented in Viet Nam such as monthly cash allowances, vocational training, credit support and employment generation for people with disabilities. There have also been State-funded scholarships, credit for poor households and students, vocational training for rural workers, discounts on medical expenses, free/subsidized health insurance cards and public transport discounts. In 2016, nearly 40% of Viet Nam’s population benefited from at least one of these social protection programmes and policies. This proportion was nearly 100% for people with disabilities who have certificates of disability status issued by local authorities.
People identified as having a disability using WG’s extended questionnaire in the VDS 2016 had relatively high social assistance coverage, with 67.4% having benefited from at least one policy/programme.
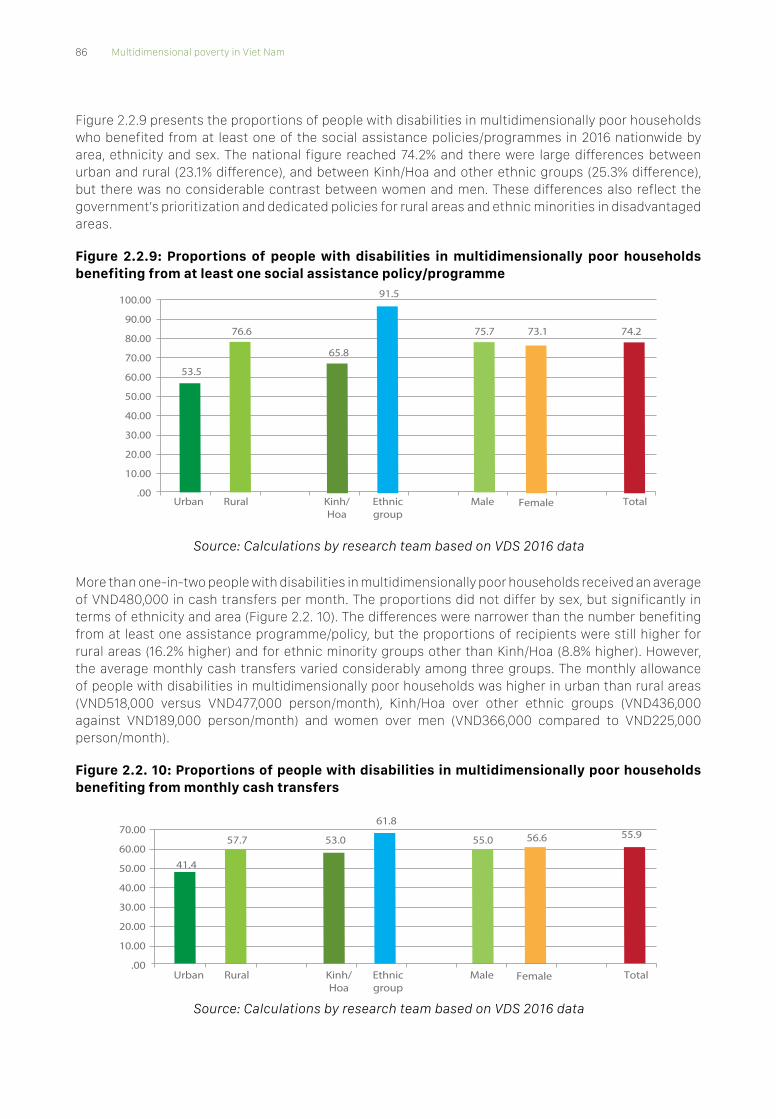
86 Multidimensional poverty in Viet Nam
Figure 2.2.9 presents the proportions of people with disabilities in multidimensionally poor households who benefited from at least one of the social assistance policies/programmes in 2016 nationwide by area, ethnicity and sex. The national figure reached 74.2% and there were large differences between urban and rural (23.1% difference), and between Kinh/Hoa and other ethnic groups (25.3% difference), but there was no considerable contrast between women and men. These differences also reflect the government’s prioritization and dedicated policies for rural areas and ethnic minorities in disadvantaged areas.
Figure 2.2.9: Proportions of people with disabilities in multidimensionally poor households benefiting from at least one social assistance policy/programme
.00
10.00
20.00
30.00
40.00
50.00
60.00
70.00
80.00
90.00
100.00
53.5
76.6
65.8
91.5
75.7 73.1 74.2
Urban Rural Kinh/Hoa
Ethnicgroup
Male Female Total
Source: Calculations by research team based on VDS 2016 data
More than one-in-two people with disabilities in multidimensionally poor households received an average of VND480,000 in cash transfers per month. The proportions did not differ by sex, but significantly in terms of ethnicity and area (Figure 2.2. 10). The differences were narrower than the number benefiting from at least one assistance programme/policy, but the proportions of recipients were still higher for rural areas (16.2% higher) and for ethnic minority groups other than Kinh/Hoa (8.8% higher). However, the average monthly cash transfers varied considerably among three groups. The monthly allowance of people with disabilities in multidimensionally poor households was higher in urban than rural areas (VND518,000 versus VND477,000 person/month), Kinh/Hoa over other ethnic groups (VND436,000 against VND189,000 person/month) and women over men (VND366,000 compared to VND225,000 person/month).
Figure 2.2. 10: Proportions of people with disabilities in multidimensionally poor households benefiting from monthly cash transfers
Urban Rural Kinh/Hoa
Ethnicgroup
Male Female Total.00
10.00
20.00
30.00
40.00
50.00
60.00
70.00
41.4
57.7 53.0
61.8
55.0 56.6 55.9
Source: Calculations by research team based on VDS 2016 data

Reducing poverty in all its dimensions to ensure a good quality life for all 87

88 Multidimensional poverty in Viet Nam
Part 3. Poverty reduction programmes and policies in Viet Nam: Assessment and recommendations
The system of poverty reduction programmes and policies in Viet Nam across 2016-2020 consists of two main components: (1) National Target Programme for Sustainable Poverty Reduction and (2) Support policies for poor and near-poor households. Most policies during 2016-2020 are carried over from the previous period.
3.1 National Target Programme for Sustainable Poverty Reduction during 2016-202013
The NTPSPR during 2016-2020 takes place in a new context associated with implementation of the 10-year Socio-Economic Development Strategy (2011-2020) and five-year Socio-Economic Development Plan (2016-2020), which is the final stage to complete the 10-year Socio-Economic Development Strategy.
The programme is implemented nationwide, with resource investment priorities channelled to poor and disadvantaged areas14 to close the gap among regions. Nationwide there are 64 poor districts under Resolution No.30a/2008/NQ-CP of the Prime Minister on the support programme for fast and sustainable poverty reduction in 62 poor districts, 310 extremely disadvantaged communes in coastal and island areas, 2,331 extremely disadvantaged communes in ethnic minority and mountainous areas, border communes, safety zone communes and 3,509 extremely disadvantaged villages/hamlets that receive investment and support from policies under Programme 135 as per Decision No.551/QD-TTg (dated 4 April 2013) of the Prime Minister15. The total implementation expenditure for the programme during 2016-2020 is VND48,397 billion, of which 95.7% is mobilized from the government budget.
The programme has the following main content/activities: (i) improve critical infrastructure to serve production and people’s livelihoods in poor and disadvantaged areas, (ii) support for production development, livelihoods diversification and upscaling of poverty reduction models, (iii) support for workers of poor, near-poor and ethnic minority households in poor districts for fixed-term work abroad (iv) communications and poverty reduction information and (v) improvements to capacity, monitoring and evaluation of the programme’s implementation.
(i) Improve critical infrastructure to serve production and people’s livelihoods in poor and disadvantaged areas
With the objective of strengthening essential infrastructure for production and livelihoods, the programme has sub-projects to support construction and maintenance of infrastructure for poor and disadvantaged areas. They encompass: roads, work that serves cultural activities in communes including communal broadcasting stations, cultural and community houses, sports centres of communes/hamlets/villages, healthcare and education, provision of electricity and water, irrigation, other infrastructure proposed by
13 Decision No.1722/QD-TTg dated 02/9/2016 of the Prime Minister approving the NTPSPR during 2016-2020
14 Poor and disadvantaged areas cover poor districts and communes (extremely disadvantaged communes in alluvial and coastal regions and on islands, extremely disadvantaged communes/hamlets in ethnic minority and mountainous areas, border area com-munes, safety zone communes) and extremely disadvantaged villages.
15 Data source: National Office for Poverty Reduction, MOLISA.

Reducing poverty in all its dimensions to ensure a good quality life for all 89
communities and work that benefits many poor people and women.
Beneficiaries of infrastructure sub-projects do not only include poor and near-poor households, but also all those in poor and disadvantaged locations. Work supported by the programme is diverse, covering many aspects of daily life like transportation, healthcare and education.
According to a MOLISA report, in 2016 more than VND2,100 billion was invested in infrastructure improvement and maintenance of work in poor districts, with VND328.3 billion for extremely disadvantaged communes in coastal areas and islands (an estimated 350 infrastructure investments) and more than VND3,800 billion to support infrastructure investment in extremely disadvantaged communes, border communes, safety zone communes and extremely disadvantaged villages (5,999 completed works and new ones).
(ii) Support for production development, livelihood diversification and upscaling of poverty reduction models
The Ministry of Agriculture and Rural Development leads this component. Supporting content includes:
• Support for production development and livelihood diversification: 1) support development of agriculture, forestry, pisciculture and salt industry, 2) support for development of sectors and services, 3) give assistance to enterprises/co-operatives in connecting with the poor to develop production, sectors, processing and consumption of products, 4) support other livelihood diversification activities as proposed by communities in conformity with customs, practices and needs of such communities.
Upscaling of poverty reduction models: 1) develop efficient poverty reduction models in large-scale and combined models for development of production, sectors, maintenance, processing and consumption of products between poor and near-poor households, communities and enterprises, 2) models for poverty reduction in association with national defense and security, 3) build and develop employment models by investing in small-scale infrastructural construction in hamlets/villages to increase income for people, 4) models for combined agricultural and forestry production and introduction of jobs to the poor in association with forestation and forest protection and 5) models for minimizing natural disaster risks and coping with climate change.
Beneficiaries of these activities do not only cover poor and near-poor households, but also groups of households and communities, with priorities given to workers who live in poor, near-poor and households that recently escaped poverty, ethnic minorities and women in poor households.
In 2016, the programme spent VND23 billion and developed 80 sustainable poverty reduction models (VND300 million/model on average).16
(iii) Support for workers of poor, near-poor and ethnic minorities in poor districts for fixed-term work abroad
Beneficiaries of this component are workers of poor households, near-poor households, ethnic minorities and workers residing for long-term periods in poor districts, extremely disadvantaged communes in alluvial and coastal regions and on islands, unemployed young people, especially those living in poor households in ethnic minority areas and poor women. Beneficiaries are supported to attend vocational training courses, foreign language classes and profession-oriented education courses to work abroad under contracts, support with food expenses, subsistence allowances, expenses for health examinations and applications for issuance of passports, visas and criminal record clearance to work abroad under fixed-term. They will also be advised and introduced to jobs after returning home after overseas employment.
16 MOLISA (2017), report on the implementation of Sustainable Poverty Reduction target in 2016, orientations and tasks for 2017.

90 Multidimensional poverty in Viet Nam
The policy of supporting poor districts to promote labour exports during 2016-2020 removed a number of barriers and opened up opportunities for workers in poor districts to work abroad. The policy covers essential content helpful for workers during pre-departure, encouraging them to participate in learning, contributing to improving the quality of workers, meeting foreign partner requirements, creating conditions for work in foreign countries and providing employees with stable jobs and incomes to limit risks to workers and enterprises. In 2016, 15 contracts were signed for 290 poor district workers to work in markets such as Japan, Malaysia, Taiwan and the Middle East with a total estimated contract value of VND1,846,430,000. Approximately 800 workers were supported with access to vocational training, learning foreign languages and sent to work abroad 17.
(iv) Communications and poverty reduction information
This component to improve access to information for the poor under the National Target Programme covers the following content:
Disseminating information about poverty reduction: 1) prepare and implement communications and information programmes relating to poverty reduction, 2) organize and develop a network of communications officers and reporters on poverty reduction from central to local governments, 3) organize talks on poverty reduction policies on a regular basis at all levels and sectors, 4) organize communications activities about poverty reduction using art performances to promote exchanges and sharing of experiences between hamlets/villages covered by the programme and 5) develop and strengthen activities of the poverty reduction portal (internet web page).
Poverty reduction information: 1) provide training in professional skills and practices to officials in charge of local information and communications, especially officials of communes, and mountainous hamlets/villages, 2) support the production, edition, broadcasting, transmission, retention and promotion of journalistic products and information products, radio and television programmes, publications and other information products to disseminate policies and guidelines of the Communist Party and government policies and laws, 3) provide audio-visual equipment to poor households on islands, in ethnic minority areas and extremely disadvantaged communes, 4) provide operational facilities to perform communications activities in districts and communes, 5) establish permanent outdoor locations for communication activities, 6) develop content for communications programmes to local information teams and 7) support establishment of local information clusters at border areas and trade centres.
Before 2013, there was no official document or policy on access to information on poverty reduction. Therefore, many poverty reduction policies were issued without beneficiaries’ awareness, which hindered access. Besides, many poor people were unable to access government support packages. With the advent of this content in the National Target Programme for Sustainable Poverty Reduction 2016-2020, the government has shown its determination to meet the essential information needs of society and improve people’s access to information.
Beneficiaries of this activity are communities and citizen groups throughout the country, regardless of region or area.
3.2 Support policies for the poor and near-poor
3.2.1 Policies to support income improvements
3.2.1.1 Credit policies
Preferential credit policies from the State provide the poor with access to preferential loans to promote production, create jobs and raise income to improve living conditions, escape poverty, contribute to economic development in close connection with hunger eradication, poverty reduction and social welfare protection.
17 MOLISA (2017), Report on implementation of Sustainable Poverty Reduction target in 2016, orientations and tasks for 2017.

Reducing poverty in all its dimensions to ensure a good quality life for all 91
Decree No.78/2002/ND-CP, dated 04/10/2002, on credit for poor people and other policy beneficiaries, stipulates that all poor households nationwide can take out loans for: (i) production and business services, (ii) accommodation repairs, lighting, electricity and clean water installation, (iii) working under fixed-term abroad and (iv) payment for learning expenses of students.
According to the annual report of the MOLISA, nearly two million poor households, near-poor households and policy beneficiaries were entitled to preferential credit loans, which supported poor households to cross the poverty line and improve living standards, but not escape poverty. The policy also generated jobs for more than 100,000 people, including more than 1,500 labourers working abroad, supported more than 20,000 students in difficult circumstances to borrow money to study and built more than 800,000 rural water supply and sanitation facilities and more than 10,000 houses for poor households. In 2016 alone, more than 2,297,000 poor, near-poor and households who had recently escaped from poverty and other policy beneficiaries were given loans, of whom more than 74,000 students in difficult circumstances borrowed for the first time in the same year, with loans amounting to more than VND55,150 billion18.
There are weak linkages between the credit policy for productive investment and other policies on model development, agricultural extension and market, vocational training and job creation to ensure sustainable development19. The poor, particularly those in extremely disadvantaged ethnic minority areas, are often constrained in their knowledge and skills in production and business as well as lack access to market information. Therefore, if a loan is not accompanied by vocational training support, agricultural extension services and market information, the effectiveness of capital use will be limited.
3.2.1.2 Policies on support for production land
Decision No.755/QD-TTg, dated 20 May 2013, approved a policy supporting residential land, production land and water for poor ethnic minority households and poor households in extremely disadvantaged communes, villages and hamlets (hereinafter referred to as Decision No.755).
The decision stipulates that poor ethnic minority and poor households in extremely disadvantaged communes and villages are entitled to direct support for production land in accordance with the limit for each household set by localities when production land is available. If no such land is available, householders are supported to change jobs, work overseas or contracted to protect and plant forests.
The target group of this policy is limited in scope, only covering poor ethnic minority and poor households in extremely disadvantaged communes and villages that have insufficient land according to local standards.
For poor ethnic minorities, their customs and habits in daily activities and farming are very important. The government has built numerous hydropower plants that affect the production and daily life habits of poor ethnic minority people in surrounding areas. In this context, competent State agencies should study and formulate support policies to stabilize people’s lives and production after resettlement due to construction of reservoirs, dams and irrigation work.
3.2.1.3 Policies on vocational training and employment
The scheme “Vocational training for rural workers until 2020” was approved under the Prime Minister’s Decision No.1956/QD-TTg, dated 27 November 2009, which stipulates rural labourers are entitled to preferential policies for those with meritorious services to the revolution, poor households, ethnic minorities, people with disabilities and people whose agricultural land was acquired will be supported with short-term vocational training tuition, food and travel allowances. Other rural workers are supported with short-term vocational training fees, but at a lower rate. After vocational training, rural workers can borrow capital from the national employment fund, under the National Target Programme on Employment, to create jobs.
18 MOLISA (2017), Report on the implementation of Sustainable Poverty Reduction target in 2016, orientations and tasks for 2017
19 CEMA, UNDP. 2012. Report on Ethnic Minority Policies and Proposal for Ethnic Minorities Policy Framework to 2020.

92 Multidimensional poverty in Viet Nam
According to statistics from the General Department of Vocational Education (MOLISA) regarding elementary training and regular training, in 2016 one million rural workers nationwide received vocational training and the post-training employment rate exceeded 80%. By the end of August 2017, the country had nearly 700,000 rural workers trained (achieving 63.6% of the 2017target). Of these, about 250,000 people were trained at the elementary level, less than three months of training, reaching 41.6% of the target. Vocational training has helped many people gain a job, increase income and stabilize their lives.
According to the plan for 2018-2020 on vocational training for rural workers, vocational training at elementary level, training for less than three months will be provided for about 2.74 million rural labourers. Among those, female workers shall account for 40% and people with disabilities 10%
3.2.2. Policies on improvement of access to basic social services
3.2.2.1 Policies on education and training
At present, education and training policies aimed at addressing the educational gap between different social groups are moving towards a multidimensional approach. The main policy areas are: (i) direct support for learners (scholarships, tuition exemption and reduction, support for learning expenses and semi-boarding costs, rice support), (ii) education credit (student loans), (iii) direct enrolment, (iv) attracting teachers to disadvantaged areas, (b) bilingual education for ethnic minority children and (vi) investment in infrastructure for education. These direct support policies demonstrate State efforts to support children from poor and ethnic minority households to overcome poverty and remoteness to access schooling. Support is available from preschool to tertiary education levels, helping to reduce financial burdens for learners.
In 2016, the central budget allocated VND5,649,031 billion to implement the policy of tuition fee exemptions, reductions and study expense support for 3,807,187 people according to Decree No.86/2015/ND-CP. Of which, 1,720,463 were exempted from tuition fees (VND3,060,586 billion), 351,180 received tuition fee reductions (VND1,491,867 billion) and 1,735,545 people received support for study expenses (VND1,096,578 billion)20.
However, the current policy documents on education are assessed to address the disparities rather than access to and quality of education. Article 10 of the Education Law and the new Scheme on fundamental and comprehensive innovation in education and training (promulgated under Resolution No.29-NQ/TW dated 04/11/2013) offer no solutions to address gaps in access and quality of education among social groups and regions.
Some policies still miss target disadvantaged groups. Current scholarship policies for ethnic minority students only apply to the direct enrolment process, while ethnic minority students who enter and pass exams are ineligible for this scholarship. Scholarships and support for semi-boarding, rice and disadvantaged high school students only apply to public schools, not the private sector.
3.2.2.2 Policies on healthcare
Since 2002, members of poor households have been granted free health insurance cards. The implementation of this policy has enabled the poor to access healthcare and treatment services, easing financial burdens faced by the poor. In 2012, the Prime Minister issued Decision No.14/2012/QD-TTg on amending and supplementing a number of articles of Decision No.139/2002/QD-TTg. It expanded the target groups to cover near-poor households, households who just escaped poverty and middle-income households engaged in agriculture, forestry, fisheries and salt production who were subsidized to buy health insurance and given indirect support to access quality medical services at grassroots level and in the case of severe illness and high treatment costs.
In 2016, the budget allocated VND9,000 billion to provide health insurance cards for more than 14 million people (the poor, ethnic minorities and people living in extremely disadvantaged areas and on islands),
20 MOLISA (2017), Report on the implementation of Sustainable Poverty Reduction target in 2016, orientations and tasks for 2017

Reducing poverty in all its dimensions to ensure a good quality life for all 93
VND1,172 billion was arranged to support the purchase of health insurance cards for 1,825,000 members of near-poor households21.
Nevertheless, the Ministry of Health survey shows the rate of health insurance purchased among near-poor households is low (15%-20%) as they only receive limited State support to buy health insurance. Therefore, for the poor and near-poor to access healthcare and health services, the government should issue a policy to raise the level of health insurance support for people living near the poverty line and those who recently escaped poverty.
3.2.2.3 Policies on housing
Decision No.33/2015/QD-TTg, dated 10/8/2015, of the Prime Minister stipulates housing support policies for poor households who have no housing or temporary housing that is damaged and not sustainable. Under this decision, the State will provide loans with preferential interest rates for new construction or repairing houses, while communities will provide assistance and householders will organize construction of respective houses. Upon receiving the loan, households must build new houses or repair or upgrade existing ones, ensuring a minimum floor area of 24m2 (single-member households without family support can build houses with smaller areas not less than 18m2) and “three hards” (hard floor, hard-wall, hard roof) to last 10 years or more. Supported housing must be safe enough to weather storms and whirlwinds. It is estimated that during 2016-2020, approximately 311,000 poor households will be supported under this policy.
3.2.2.4 Policy on financial support for electricity bills
The policy on electricity subsidies for poor households and social assistance beneficiaries was stipulated in Decision No.28/2014/QD-TTg, dated 7 April 2014, by the Prime Minister. Accordingly, poor households and social assistance beneficiary households are entitled to monthly electricity support equivalent to the electricity charge of 30kWh calculated at the retail electricity ‘price level 1’. This means support entails direct cash transfers in the form of quarterly cash payments to poor households and social assistance beneficiaries.
21 MOLISA (2017), Report on the implementation of Sustainable Poverty Reduction target in 2016, orientations and tasks for 2017

94 Multidimensional poverty in Viet Nam
Box 3.2. 1: Cash transfer scheme for electricity: some shortcomings
To ensure social equity, power sector reforms have been implemented and accompanied by various mitigation measures to protect low-income groups from increasing electricity costs.
To protect the poor and low-income households from increasing electricity costs, various mitigation measures have been implemented, including a lifeline tariff and a cash transfer scheme. Specifically, (i) poor and low-income groups in on-grid areas were charged at the lifeline tariff rate if they consumed less than a threshold of 50 kWh/month for three consecutive months and were registered with authorities, (ii) households in off-grid areas received a annual cash transfer for fuels as an alternative to electricity. A cash transfer programme was added to help poor households (VND30,000 per month).
However, from mid-2014, two changes were made (see Table 1). The government (i) eliminated the lifeline tariff and expanded the cash transfer programme for the poor and an extended group of beneficiaries, with a monthly cash transfer equivalent to the price of the first 30kWh/month (on condition they consumed less than 50kWh/month) and (ii) regulated a substantial rise in the first step of the block tariff of 50kWh. The adjustments to the incremental block tariff scheme in Viet Nam led to a reduction in the level of cross-subsidies between different groups of residential electricity customers. These changes imposed more stringent requirements on precise identification of the poor, near-poor and social assistance beneficiaries to implement mitigation measures effectively as well as avoid a growing burden on the government budget due to leakages.
The design and implementation of mitigation measures faced considerable drawbacks:
• First, many beneficiaries will be missed if they: (i) do not belong to the list of poor households (for example, migrants), (ii) are near-poor households, (iii) are social assistance beneficiaries who cannot prove their usage is below 50kWh per month and (iv) are informal (non-regis-tered) users who are poor in electricity consumption.
• Second, the cash benefit level is too low, especially for households without access to the grid electricity.
• Third, administrative costs to implement cash transfers are too high, imposing a burden on recipients. High administrative costs relative to benefits question the efficiency of the sup-port.
• Fourth, cash assistance can be delivered in an untimely manner, which does not guarantee support for those in need. Even though a cash transfer plan is made annually, the budget is disbursed quarterly and local staff are required to collect electricity bills from households as a basis for payment. These factors put pressure on the system of payment and report con-solidation to ensure their roles.
• Fifth, manual processing creates a huge burden on supervision and administrative costs as well as heightened risks of errors. For example, to make payments commune officials make a signed list of beneficiaries and collect electricity bills as a basis for payment. In the context of a shortage of human resources, this may result in missed support for beneficiaries.
• Sixth, dissemination of policy information on cash assistance to beneficiaries is ineffective. Many rural people do not seem fully aware the purpose of support is to help them cope with electricity price rises. This limits mitigation measures and social consensus for reform of the power sector.
• Finally, the lack of performance indicators or monitoring and evaluation indicators prevents effective information responses and timely adjustments to the system.
Source: UNDP-CAF. (2017). Ensuring social equity in Viet Nam’s power sector reforms. Policy discussion paper, 1/2017

Reducing poverty in all its dimensions to ensure a good quality life for all 95
3.2.2.5 Policies on legal aid
Policies on legal aid for the poor and ethnic minorities are implemented in accordance with Decision No.32/2016/QD-TTg, dated 8 August 2016, on the promulgation of policies on legal aid for the poor, ethnic minorities in poor communes and extremely disadvantaged villages during 2016-2020. They also follow Decision No.59/2012/QD-Ttg, dated 24 December 2012, of the Prime Minister on the promulgation of legal aid policies for the poor and ethnic minorities in poor communes during 2013-2020.
Under this policy, the poor are provided with free legal services in the following forms of legal aid: a) legal advice, b) participating in legal proceedings, c) authorized representative(s) (not legal proceedings) and d) other forms prescribed by law on legal aid. In addition, other activities targeting poor communities (poor communes, hamlets and villages with special difficulties) are also organized, such as mobile legal aid sessions, legal aid clubs compiling and distributing free legal flyers, legal handbooks and other legal documents, recording cassette tapes and CDs in Vietnamese and ethnic minority languages and providing the Viet Nam Law Newspaper.
The implementation of poverty reduction policies, with legal aid components, has been encouraging and had positive impacts on political and socio-economic lives as well as protected the legitimate rights and interests of people. However, the new Law on Legal Aid stipulates that beneficiaries of legal aid are the poor and ethnic minorities, not near-poor households and those who just escaped poverty.
In summary, during 2016-2020, Viet Nam is implementing a series of programmes and policies to reduce MDP in a sustainable manner. The impact (expected and actual) of programmes and policies on the dimensions of MDP can be summarized in the policy matrix as follows.
Table 3.2. 1: Summary of poverty reduction policies of Viet Nam during 2016-2020
Cri
teri
a on
in
com
e
Criteria on basic social services
Educ
a-ti
on
Hea
lth
Hou
sing
Wat
er
and
san
-it
atio
n
Acc
ess
to in
for-
mat
ion
I. National Target Programme for Poverty Reduction
1. Infrastructure support + + + + +
2. Support for production, livelihood diversification and poverty reduction models ++
3. Support for workers in poor households to work for fixed terms abroad ++
4. Communications and reduction of poverty of information ++
II. Poverty reduction policies
1. Preferential credit policies ++ + + +
2. Production support policies ++
3. Vocational training and employment policies ++
4. Education support policies ++
5. Healthcare policies ++
6. Housing support policies ++
7. Electricity subsidy +
8. Legal aid policies ++
Notes: ++ denotes direct impact, + denotes indirect impact, no sign means no impact

96 Multidimensional poverty in Viet Nam
3.3. Assessment of poverty reduction programmes and policies in Viet Nam
Although Viet Nam only recently changed its poverty measurement method from unidimensional to multidimensional, the system of poverty reduction policies has been assessed to be comprehensive and multidimensional, covering most needs and deprivations of the poor. The system includes general poverty reduction policies22 and distinct poverty reduction policies23. Most policies spanning 2016-2020 are not new and carried over from the previous period with appropriate adjustments. Accompanying inclusive growth, these programmes and policies have contributed to Viet Nam’s remarkable poverty reduction achievements as analyzed in Part 1.
However, several shortcomings exist in poverty reduction policies:
Overlaps and fragmentation in policy design and implementation persist
In the past, the system of poverty reduction programmes and policies was assessed to have many overlaps. It was characterized by a lack of linkages and coordination between poverty reduction programmes and policies and those on social assistance, prevention and management of lifecycle risks (social insurance) and development of basic social services and care covering the poor. Currently, the system is under review and policy consolidation was adopted in the “Plan to review and integrate poverty reduction policies - period 2017-2018” (Decision No.1259/QD-TTg, dated 22 August 2017). Nevertheless, the results have been limited.
More effective use of multidimensional approach in policy design is needed
The multidimensional approach to poverty was formally implemented since 2016 to identify beneficiary households of poverty reduction and social protection policies, as well as to measure and monitor poverty. So far, the list of national socio-economic development indicators includes two related to MDP: (1) MDP reduction and (2) Proportion of population participating in health insurance schemes. Local governments have only mentioned the two indicators in their local socio-economic development plans, but yet to apply MDP dimensions and indicators.
Thus, when poverty is identified and measured in the multidimensional approach, the development of poverty reduction policies and programmes and socio-economic development plans related to component indicators of MDP also demand research and innovations to respond to the new approach, with a view to improving the effectiveness of poverty reduction and holistic socio-economic development.
3.4. Policy recommendations
Impressive poverty reduction achievements in recent years attributed to the growth and development in Viet Nam over the past three decades have been widely regarded as inclusive, with the vast majority of people involved in this growth process having benefitted. In the future, to sustain poverty reduction and curb the rise in inequalities, the inclusive growth model should be constantly strengthened on the basis of four main pillars: (i) job creation to increase productivity for all workers, (ii) expand coverage towards the universalization of basic social services, (iii) strengthen the social protection system for disadvantaged groups to ensure no one is left behind and (iv) take economic, cultural, social and geographic differences among ethnic minority groups as the focus for research and recommendations of appropriate and effective policies.
These orientations should be implemented with the new global and national contexts in mind. Although globalization is still a dominant trend internationally, protectionism in some major economies and trade wars are new challenges for the global economy. The Fourth Industrial Revolution, with the digital revolution at its core, is having a powerful and comprehensive impact on the contemporary world, posing
22 Covering seven groups of basic poverty reduction policies: credit; production support, production land and forest planting; voca-tional training and employment; housing and water; education and training; healthcare; legal aid and information support.
23 These policies are implemented as part of the National Target Programme on Sustainable Poverty Reduction and a number of programmes and policies exclusive for ethnic minority areas.

Reducing poverty in all its dimensions to ensure a good quality life for all 97
new opportunities and challenges. Ageing populations in many countries, climate change and non-traditional security are also major trends with a significant impact on Viet Nam’s economy in general and on poverty and inequality reduction in particular. In Viet Nam, the national economy has flourished and macroeconomic stability is secured. However, structural reforms such as to State-owned enterprises, the banking system and public investment still face many hurdles. Other challenges, such as high public debt and population passing its “golden” stage, also create constraints for growth and poverty reduction.
Based on the aforementioned assessment, a policy framework to promote poverty reduction based on inclusive growth is proposed as follows:
3.4.1 Promoting productive employment to increase income for all workers
Continuing to strengthen the fundamentals of the economy
Viet Nam must further strengthen its economic fundamentals by maintaining macroeconomic stability, continuing active international integration and accelerating the currently sluggish structural reforms to ensure national resources - human, financial and natural - are allocated and used effectively, with the promotion of administrative reforms, increased transparency and an intensified fight against corruption to have more resources for development in general and for poverty reduction and curbing inequality in particular.
Promoting agricultural development
As agriculture is still the main source of livelihoods for many low-skilled labourers and the poor in rural areas, many of whom are ethnic minority people, it should be revitalized. Solutions including implementation of the Land Law, taxation policies, agricultural, forestry and fishery extension activities should be directed towards agricultural sector restructuring to increase productivity through transitions to higher value products and strengthened value chains for farmers’ products. At the same time, Viet Nam must make the most of increasingly cheaper digital technologies to improve the efficiency of agricultural production. Some examples of specific applications include the use of these technologies to trace the origins of products and input materials, receive information on agricultural prices, access digitalized extension services and receive pest warnings.
Promoting productivity and efficiency of SMEs and household businesses
SMEs and household businesses play a key role in restructuring as they help draw labour, many of whom have few skills, out of agriculture to work in manufacturing and services industry with higher productivity and income, thereby supporting sustainable poverty reduction and effectively curbing rising inequality. Therefore, it is necessary to promote productivity and efficiency of SMEs and household businesses. This can be achieved through the effective implementation of the Small and Medium Enterprise Support Law, approved by the National Assembly in 2017.
It is recommended a digitization process is facilitated for the development of Vietnamese enterprises in general and SMEs in particular in the digital era. It is also necessary to raise awareness and encourage SMEs to use cloud-computing services to slash costs, and to use e-commerce platforms to enhance connections to the market. Special assistance should be provided to business households and people in ethnic minority areas to strengthen their links with international and domestic markets, particularly in urban areas, through digital technologies and platforms for e-commerce, tourism, thereby promoting the sale of local products and services with potential.
3.4.2 Expanding the coverage and improving the quality of basic social services
It is recommended coverage of basic social services is continually expanded, accompanied by improved efficiency and quality. A thorough assessment of the impact of basic social service privatization is needed. While the privatization of basic social services has been deeply rooted in the system and mobilized substantial resources, its current activity in the context of regulatory pitfalls has raised concerns about equity and efficiency. The privatization of basic social services has led to under-utilization of services,
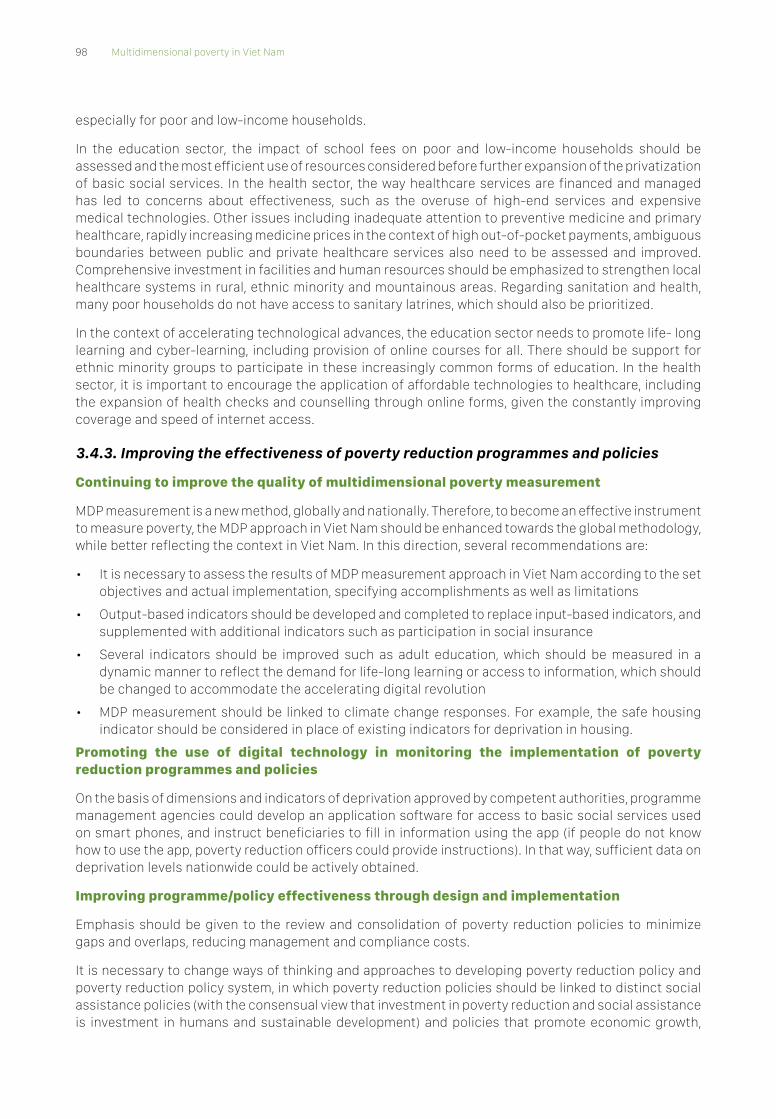
98 Multidimensional poverty in Viet Nam
especially for poor and low-income households.
In the education sector, the impact of school fees on poor and low-income households should be assessed and the most efficient use of resources considered before further expansion of the privatization of basic social services. In the health sector, the way healthcare services are financed and managed has led to concerns about effectiveness, such as the overuse of high-end services and expensive medical technologies. Other issues including inadequate attention to preventive medicine and primary healthcare, rapidly increasing medicine prices in the context of high out-of-pocket payments, ambiguous boundaries between public and private healthcare services also need to be assessed and improved. Comprehensive investment in facilities and human resources should be emphasized to strengthen local healthcare systems in rural, ethnic minority and mountainous areas. Regarding sanitation and health, many poor households do not have access to sanitary latrines, which should also be prioritized.
In the context of accelerating technological advances, the education sector needs to promote life- long learning and cyber-learning, including provision of online courses for all. There should be support for ethnic minority groups to participate in these increasingly common forms of education. In the health sector, it is important to encourage the application of affordable technologies to healthcare, including the expansion of health checks and counselling through online forms, given the constantly improving coverage and speed of internet access.
3.4.3. Improving the effectiveness of poverty reduction programmes and policies
Continuing to improve the quality of multidimensional poverty measurement
MDP measurement is a new method, globally and nationally. Therefore, to become an effective instrument to measure poverty, the MDP approach in Viet Nam should be enhanced towards the global methodology, while better reflecting the context in Viet Nam. In this direction, several recommendations are:
• It is necessary to assess the results of MDP measurement approach in Viet Nam according to the set objectives and actual implementation, specifying accomplishments as well as limitations
• Output-based indicators should be developed and completed to replace input-based indicators, and supplemented with additional indicators such as participation in social insurance
• Several indicators should be improved such as adult education, which should be measured in a dynamic manner to reflect the demand for life-long learning or access to information, which should be changed to accommodate the accelerating digital revolution
• MDP measurement should be linked to climate change responses. For example, the safe housing indicator should be considered in place of existing indicators for deprivation in housing.
Promoting the use of digital technology in monitoring the implementation of poverty reduction programmes and policies
On the basis of dimensions and indicators of deprivation approved by competent authorities, programme management agencies could develop an application software for access to basic social services used on smart phones, and instruct beneficiaries to fill in information using the app (if people do not know how to use the app, poverty reduction officers could provide instructions). In that way, sufficient data on deprivation levels nationwide could be actively obtained.
Improving programme/policy effectiveness through design and implementation
Emphasis should be given to the review and consolidation of poverty reduction policies to minimize gaps and overlaps, reducing management and compliance costs.
It is necessary to change ways of thinking and approaches to developing poverty reduction policy and poverty reduction policy system, in which poverty reduction policies should be linked to distinct social assistance policies (with the consensual view that investment in poverty reduction and social assistance is investment in humans and sustainable development) and policies that promote economic growth,
Reducing poverty in all its dimensions to ensure a good quality life for all 99
applying inclusive growth approach.
A long-term vision on poverty reduction in ethnic minority and mountainous areas should be developed for a comprehensive socio-economic development strategy of these areas, laying the foundation for re-directing investments under the National Target Programme to be more focused and effective.
There should be emphasis on the design of endogenous capacity-building policies, together with communication approaches to facilitate access to policies of the poor. At the same time, awareness should be raised among the poor to actively work with the government to achieve poverty reduction goals, avoiding the situation of passively benefiting from policies and falling back into poverty without support from the government.
Viet Nam should scale-up effective poverty reduction models, promote community-based poverty reduction initiatives, create jobs associated with infrastructure construction investments in the area, promote cooperation models to link poor households with enterprises in production, product distribution and consumption, attracting poor labourers to secured employment in enterprises.
The country should also promote grassroots democracy and participation in the development, implementation and monitoring of programmes/policies. The use of digital technology in the implementation of poverty reduction programmes should be promoted to help improve efficiency and transparency, quickly receive feedback from beneficiaries and stimulate broader public participation. Through using digital platforms, relevant management agencies can collect and analyze the data, as well as prepare timely reports towards real-time reporting, in line with the orientation of the government towards e-government in Viet Nam.
Extending the coverage of programmes/policies in breadth and depth, focusing on vulnerable groups
Social security should be ensured for all. In the future, the design of policies should be changed, so the lowest level ensures that all people have minimum essential security regardless of the level of contribution and participation.
It is necessary to continue to expand beneficiaries, policies and conditions to implement social protection, giving priority to disadvantaged groups and those affected by natural and social events, as well as poor and ethnic minority areas. There should be a gradual shift from supporting poor households to helping easily identified vulnerable people, such as children, the elderly, people with disabilities, people living in disadvantaged areas in the north west, central north and Central Highlands, certain ethnic minorities with high poverty rates and slow poverty reduction, such as the Gia Rai, Hmong and Xo Dang.

100 Multidimensional poverty in Viet Nam
References
Alkire, S., and Robles, G. (2017), Global Multidimensional Poverty Index 2017, Oxford Poverty & Human Development Initiative, Odid.
Alkire, Sabina, and James Foster. “Counting and multidimensional poverty measurement.” Journal of Public Economics 95.7 (2011): 476-487.
Bourguignon, F. (2003), “The Growth Elasticity of Poverty Reduction: Explaining Heterogeneity across Countries and Time Periods,” in: T. Eicher and S. Turnovsky, eds. Inequality and growth. Theory and Policy Implications. Cambridge: The MIT Press.
Dollar, D., and A. Kraay. 2002. “Growth is Good for the Poor,” Journal of Economic Growth, Vol. 7: 195-225.
Hoang Xuan Thanh (2017). Report: Poverty policy review and planning for 2017-2020
Lanjouw, P., & Ravallion, M. (1995). Poverty and household size. The economic journal, 1415-1434.
Nguyen Thi Thu Phuong. (2018). Ethic Gaps, Household Businesses and Social Networks in Viet Nam. PhD Thesis. University of Paris Dauphine
Pasquier-Doumer Laure (ed.), Oudin Xavier (ed.), Nguyen Thang (ed.). (2017). The importance of household businesses and the informal sector for inclusive growth in Viet Nam. Ho Chi Minh: The Gioi; IRD; VASS, 327 p. ISBN 9786047725397
Ram, R. (2007), “Roles of income and equality in poverty reduction: Recent cross country evidence”, Journal of International Development, 19, 919–926.
UNICEF (2018), Improving multidimensional child poverty measurement in Viet Nam, Research Report.
Young Lives (2017). Education and Learning: Preliminary Findings from the 2016 Young Lives Survey (Round 5)
World Bank (2016). Digital Dividends
World Bank (2018). Climbing the Ladder: Poverty Reduction and Shared Prosperity in Viet Nam

Reducing poverty in all its dimensions to ensure a good quality life for all 101
Annexes
Annex 1. Viet Nam – one of the pioneering countries in applying multidimensional poverty measurement
Viet Nam’s achievements in poverty reduction have been recognized by the international community for many years. Over time, the awareness of poverty measurement and poverty reduction approaches in Viet Nam has made significant progress.
In the 1990s, when Viet Nam began implementing the reform Doi Moi, the income-based poverty line was determined by a measure of the number of weight units of rice (the staple food of Viet Nam). A household was then considered poor if the income was lower than the average of 15-25 kgs of rice per capita per month.
During the early years of the twentieth century, poverty measurement in Viet Nam began to approach the monetization of the poverty line. The poverty line as the kilograms of rice per capita was replaced by monetary income. During the period of 2006-2010, the policy makers began to approach the methodology of estimating poverty line based on cost of basic needs.
From the end of the 2000s, MDP measurement was introduced and first applied in Viet Nam. A multidimensional child poverty (MDCP) measurement method was developed with the support of UNICEF for the first time in 2008, consisting of 15 indicators and 8 domains (education, health, nutrition, shelter, water and sanitation, child labour, leisure, social inclusion and protection), using the national Household Living Standards Survey. With technical support from UNDP, Ho Chi Minh City conducted a living standard survey in line with the MDP approach in 2013. The survey served as the basis to pilot the identification of poor and near-poor households using the MDP approach 2015, which was institutionalized in the Plan No. 640 dated 23 February, 2016 of the People’s Committee of Ho Chi Minh City on the listing of poor and near-poor households in the 2016-2020 period.
In 2013, the Government agreed to develop a master scheme to change the method of poverty measurement from one-dimensional to multi-dimensional approach, in which MOLISA was assigned to act as the standing agency. The scheme proposal was promptly developed in 2 years with assistance from UNDP and Irish Aid, experience sharing workshops by OPHI (founding organization of the initiative to apply MDP measurement in policy making); national level workshops among relevant government and nationally assembly agencies including MOLISA, Ministry of Planning and Investment (GSO), Ministry of Education and Training, Ministry of Health, Ministry of Construction, Ministry of Information and Communications, Ministry of Agriculture and Rural Development, Committee for Social Affairs of the National Assembly. And international organizations such as UNDP, Irish Aid, UNICEF, WB; international forums on MDP (High-level meeting of the Multidimensional Poverty Peer Network 2014 in Berlin, High-level meeting of the Multidimensional Poverty Peer Network 2015 in Cartagena).
In September 2015, the Prime Minister signed the Decision No.1614/QD-TTg approving the Master Scheme to Change the method of poverty measurement from one-dimensional to multi-dimensional approach for the 2016-2020 period which stipulates the income-based criteria and deprivation level of access to basic social services (including education, healthcare, housing, water and sanitation, access to information).
The study, development and application of MDP measurement in Viet Nam serve three objectives:
a) To measure and monitor the deprivation level of income and access to basic social services of the population in the whole country and in specific localities, in order to evaluate the social changes and progress, annually and for the whole period;

102 Multidimensional poverty in Viet Nam
b) To identify the beneficiaries of poverty reduction and social protection policies; and socio-economic development programmes and policies of the whole country and of specific regions and sectors;
c) On the basis of the deprivation level of income and access to basic social services, the ministries/sectors shall advise the Government on the issuance of solutions, policies and roadmaps to improve and raise people’s income and access to basic social services by sector and location, ensuring the use of resources for more appropriate, focused and effective poverty reduction.
In September 2015, at a conference side event of the United Nations Sustainable Development Summit of the UN General Assembly, Deputy Minister of Planning and Investment on behalf of the Government of Viet Nam delivered a speech in support of the inclusion of MDP targets and indicators in the system of targets and indicators of the SDGs. In November 2015, the Prime Minister signed Decision No.59/QD-TTg on the issuance of the MPI approach for the period 2016-2020, laying the legal foundation for the practice of MDP measurement in Viet Nam. Viet Nam has become one of the few countries in the world to formally adopt the multidimensional approach to poverty measurement and MPI.
In 2016, for the first time, the review and development of the beneficiary lists for Viet Nam’s sustainable poverty development programmes and policies applied the national 2016-2020 poverty line that combines income poverty line and MPI. In the same year, the Sustainable Poverty Reduction Programme was developed based on multidimensional approach to poverty measurement.

Reducing poverty in all its dimensions to ensure a good quality life for all 103
Annex 2. Correlation between Grade 5 test scores with other indicators
Correlation between Grade 5 test scores with upper secondary school enrolment rates
QĐ. Hoàng Sa
QĐ. Trường Sa
QĐ. Hoàng Sa
QĐ. Trường Sa
QĐ. Hoàng Sa
QĐ. Trường Sa
QĐ. Hoàng Sa
QĐ. Trường Sa
Source: Mekong Development Research Institute (MDRI)

104 Multidimensional poverty in Viet Nam
Correlation between Grade 5 test scores with University enrolment rate
QĐ. Hoàng Sa
QĐ. Trường Sa
QĐ. Hoàng Sa
QĐ. Trường Sa
QĐ. Hoàng Sa
QĐ. Trường Sa
QĐ. Hoàng Sa
QĐ. Trường Sa
Source: Mekong Development Research Institute (MDRI)

Reducing poverty in all its dimensions to ensure a good quality life for all 105
Correlation between Grade 5 test scores with provincial GDP per capita
QĐ. Hoàng Sa
QĐ. Trường Sa
QĐ. Hoàng Sa
QĐ. Trường Sa
QĐ. Hoàng Sa
QĐ. Trường Sa
QĐ. Hoàng Sa
QĐ. Trường Sa
Source: Mekong Development Research Institute (MDRI)

106 Multidimensional poverty in Viet Nam
Correlation between Grade 5 test scores with provincial poverty rates
QĐ. Hoàng Sa
QĐ. Trường Sa
QĐ. Hoàng Sa
QĐ. Trường Sa
QĐ. Hoàng Sa
QĐ. Trường Sa
QĐ. Hoàng Sa
QĐ. Trường Sa
Source: Mekong Development Research Institute (MDRI)