
Multidimensional Outlier Detection - Meetupfiles.meetup.com/1225993/HDoutliers.pdfMultidimensional...
21
Multidimensional Outlier Detection BARUG H2O.ai 13 September 2016 Leland Wilkinson Chief Scientist H2O [email protected]
Transcript of Multidimensional Outlier Detection - Meetupfiles.meetup.com/1225993/HDoutliers.pdfMultidimensional...
2
Outliers
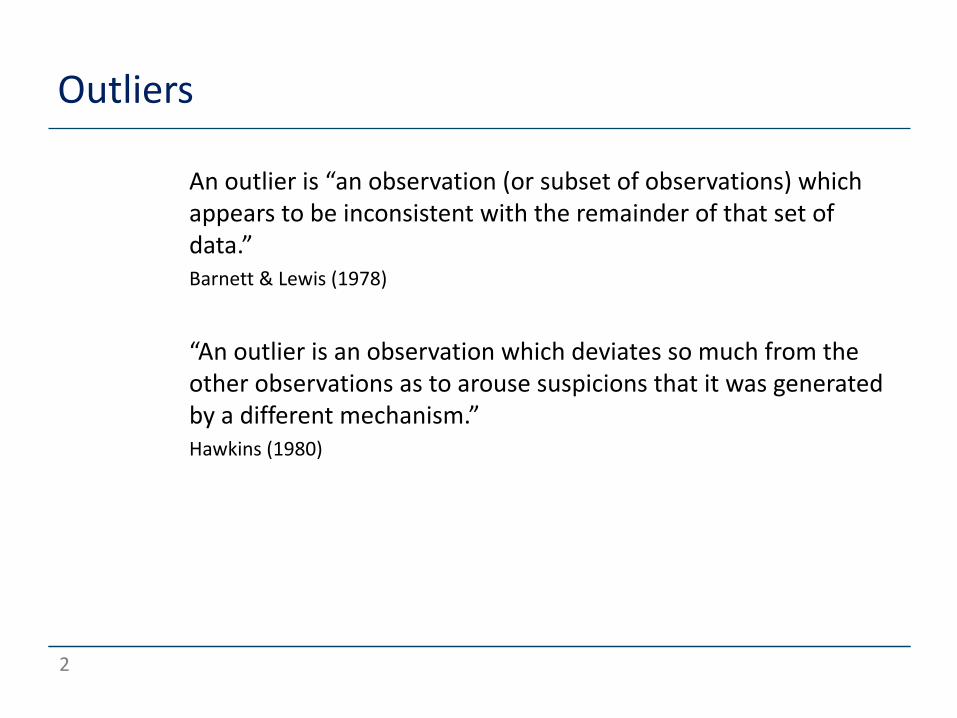
o Anoutlieris“anobservation(orsubsetofobservations)whichappearstobeinconsistentwiththeremainderofthatsetofdata.”
o Barnett&Lewis(1978)
o “Anoutlierisanobservationwhichdeviatessomuchfromtheotherobservationsastoarousesuspicionsthatitwasgeneratedbyadifferentmechanism.”
o Hawkins(1980)
3
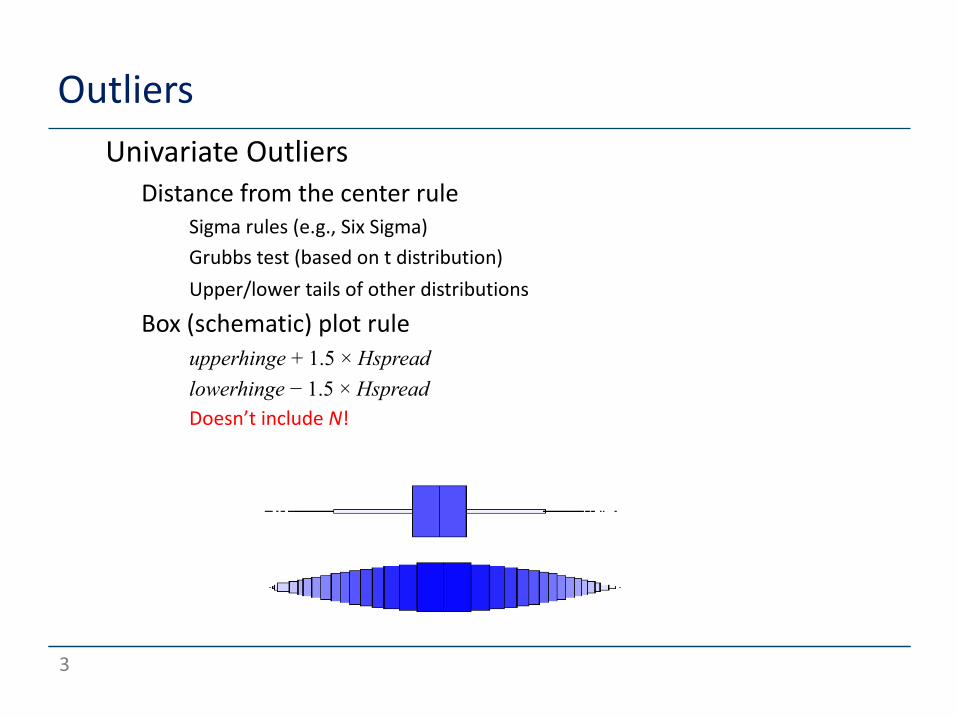
Outlierso UnivariateOutliers
o Distancefromthecenterruleo Sigmarules(e.g.,SixSigma)o Grubbstest(basedontdistribution)o Upper/lowertailsofotherdistributions
o Box(schematic)plotruleo upperhinge + 1.5 × Hspreado lowerhinge − 1.5 × Hspreado Doesn’tincludeN!
4
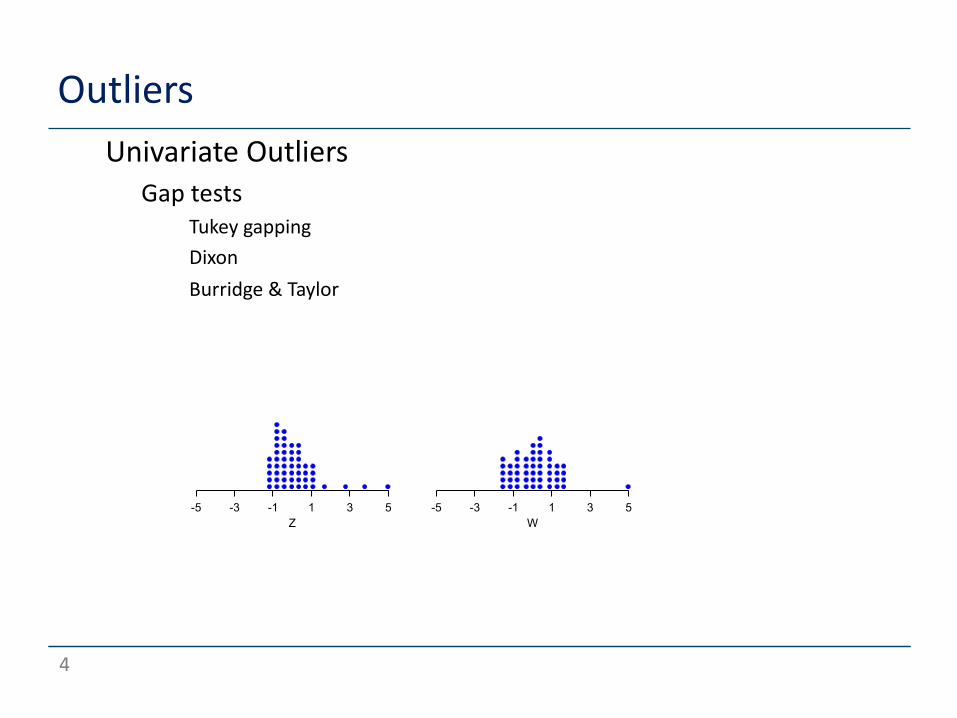
Outlierso UnivariateOutliers
o Gaptestso Tukeygappingo Dixono Burridge&Taylor
-5 -3 -1 1 3 5Z
-5 -3 -1 1 3 5W
5
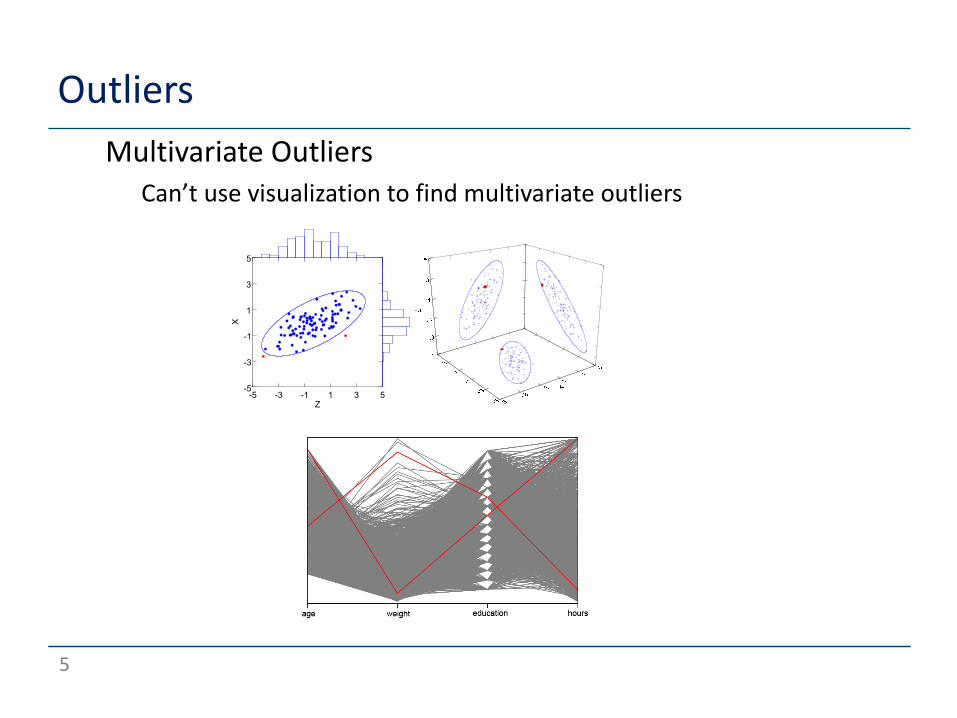
Outlierso MultivariateOutliers
o Can’tusevisualizationtofindmultivariateoutliers
-5 -3 -1 1 3 5Z
-5
-3
-1
1
3
5
X
6
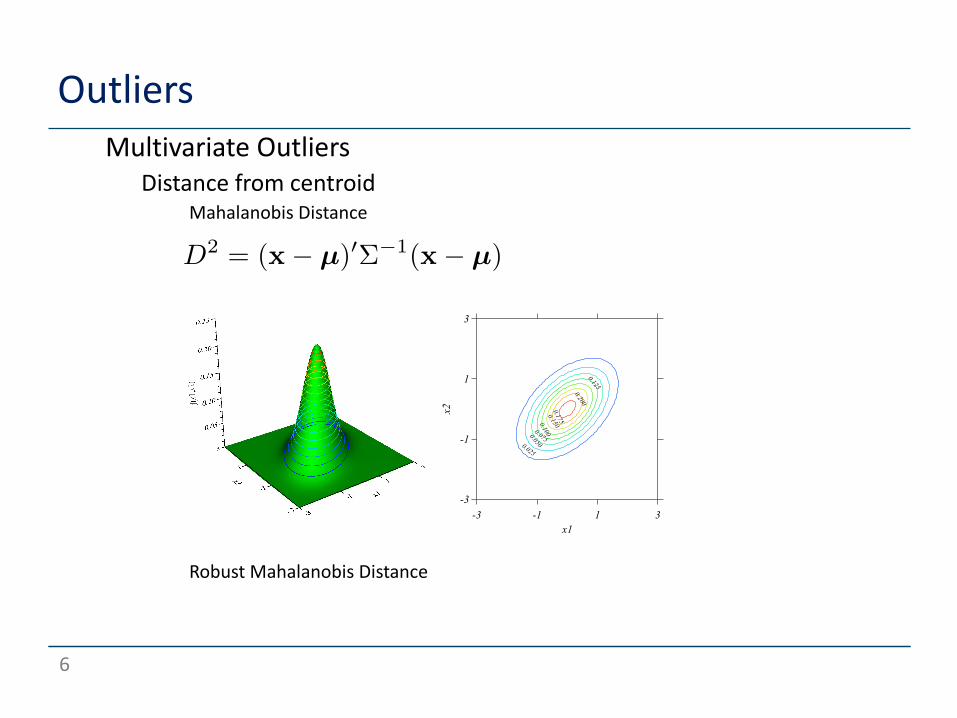
Outlierso MultivariateOutliers
o Distancefromcentroido Mahalanobis Distance
o RobustMahalanobis Distance
D2 = (x� µ)0⌃�1(x� µ)
-3 -1 1 3x1
-3
-1
1
3
x20.025
0.050
0.075
0.100
0.125
0.1500.175
0.200

7
Outlierso MultivariateOutliers
o Gaptestso GeometricMinimumSpanningTree(MST)o Nearestneighbor(NN)o K-Nearestneighbor(KNN)o LocalOutlierFactor(LOF)o ProbabilisticLocalOutlierFactor(PLOF)
8
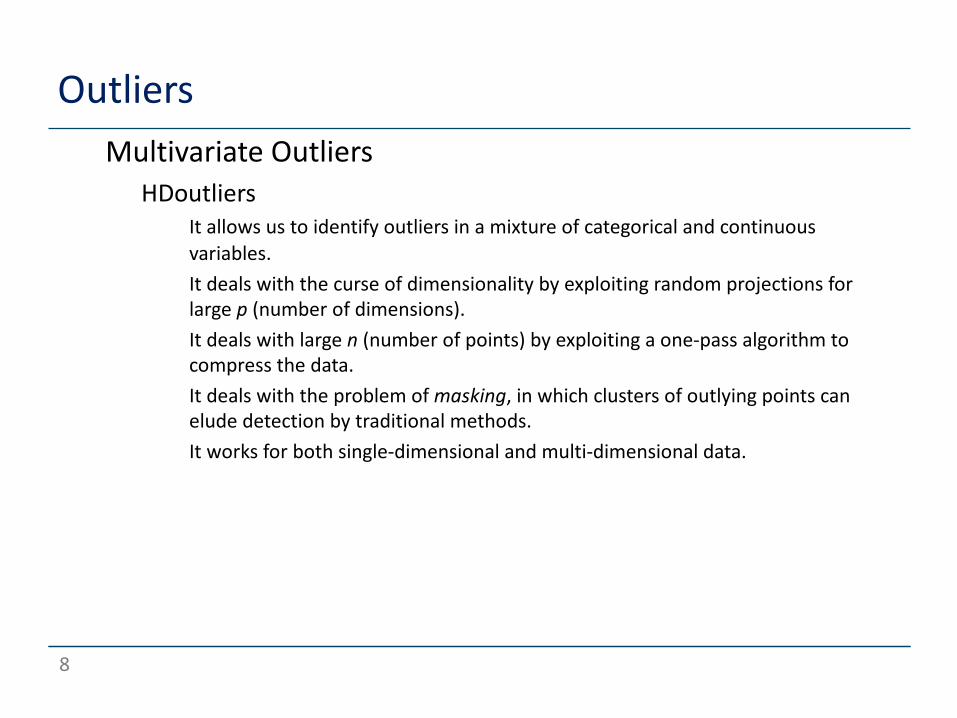
Outlierso MultivariateOutliers
o HDoutlierso Itallowsustoidentifyoutliersinamixtureofcategoricalandcontinuous
variables.1. Itdealswiththecurseofdimensionalitybyexploitingrandomprojectionsfor
largep(numberofdimensions).2. Itdealswithlargen(numberofpoints)byexploitingaone-passalgorithmto
compressthedata.3. Itdealswiththeproblemofmasking,inwhichclustersofoutlyingpointscan
eludedetectionbytraditionalmethods.4. Itworksforbothsingle-dimensionalandmulti-dimensionaldata.

9
Outlierso HDoutliers
o 1.Ifthereareanycategoricalvariablesinthedataset,converteachcategoricalvariabletoacontinuousvariablebyusingCorrespon-dence Analysis

10
Outlierso HDoutliers
o 2.Iftherearemorethan10,000columns,userandomprojectionstoreducethenumberofcolumnsto
o whereistheerrorboundonsquareddistances.
o TheJohnson-Lindenstrauss lemmastatesthatifametriconXresultsfromanembeddingofXintoaEuclideanspace,thenXcanbeembeddedinwithdistortionlessthan,where
o Thevalue10,000isthelowerlimitfortheformula’seffectivenessinreducingthenumberofdimensionswhen.
p = 4 log n/(✏2/2� ✏3/3)
Rp
1 + ✏ p ⇠ O(✏2 log n)
✏ = .2
✏
11
Outlierso HDoutliers
o 3.NormalizethecolumnsoftheresultingnbypmatrixX.
o Thecolumnsarenowscaledon[0,1]
12
Outlierso HDoutliers
o 4.Letrow(i) betheith rowofX.o 5.Leto 6.Initializeexemplars,alistofexemplarswithinitialentry[row(1)].o 7.Initializemembers,alistoflistswithinitialentry[1];eachexemplar
willeventuallyhaveitsownlistofaffiliatedmemberindices.
radius = .1/(log n)1/p.
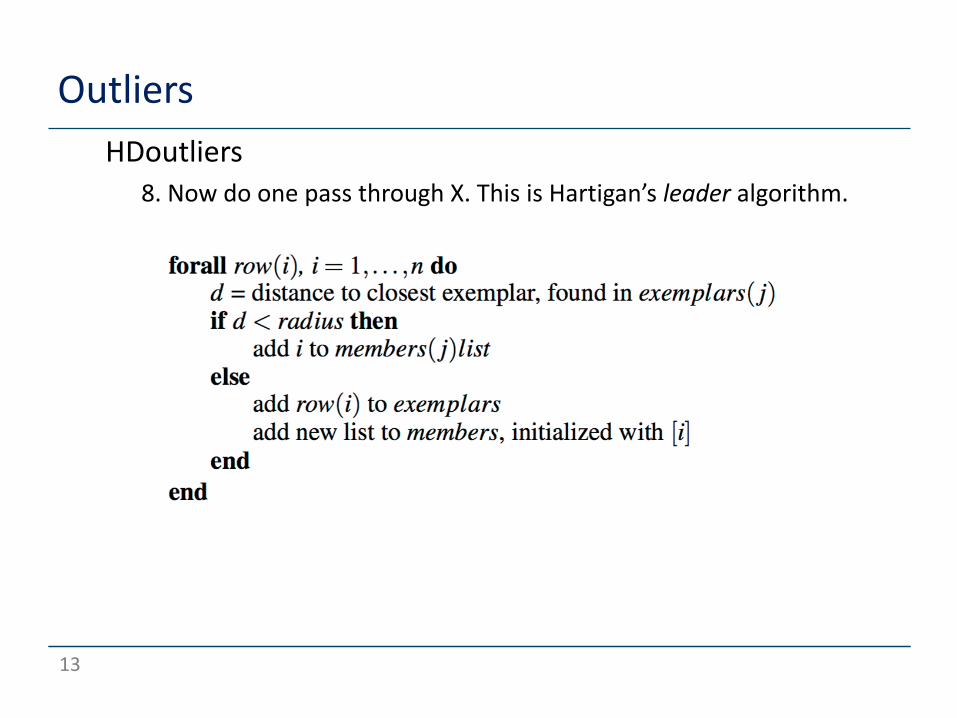
13
Outlierso HDoutliers
o 8.NowdoonepassthroughX.ThisisHartigan’s leader algorithm.
14
Outlierso HDoutliers
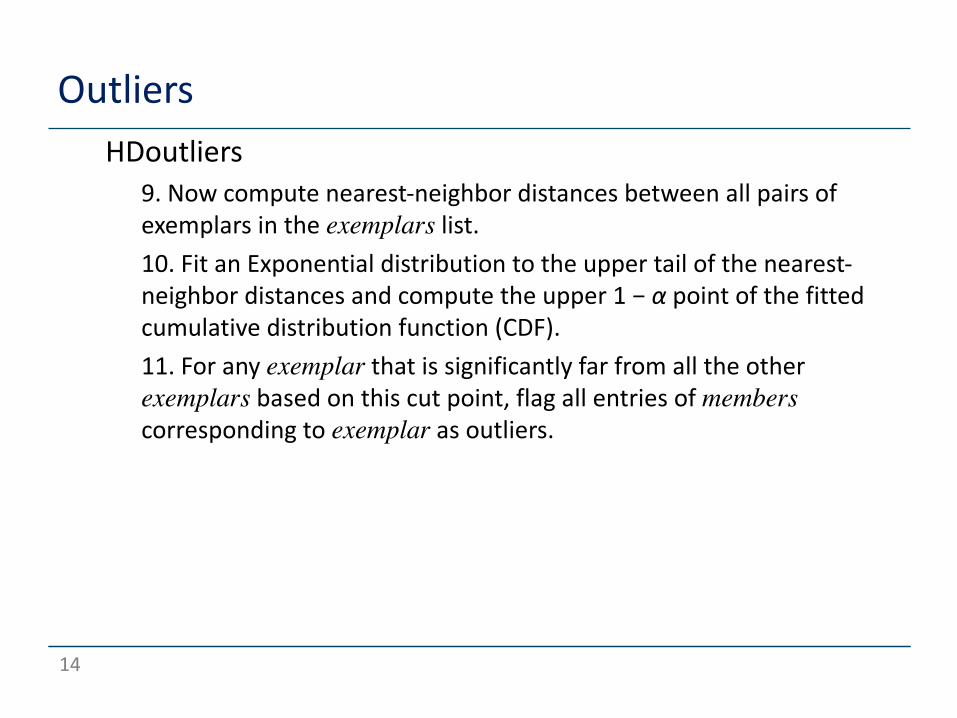
o 9.Nowcomputenearest-neighbordistancesbetweenallpairsofexemplarsintheexemplars list.
o 10.FitanExponentialdistributiontotheuppertailofthenearest-neighbordistancesandcomputetheupper1−α pointofthefittedcumulativedistributionfunction(CDF).
o 11.Foranyexemplar thatissignificantlyfarfromalltheotherexemplars basedonthiscutpoint,flagallentriesofmemberscorrespondingtoexemplar asoutliers.
15
Outlierso HDoutliers
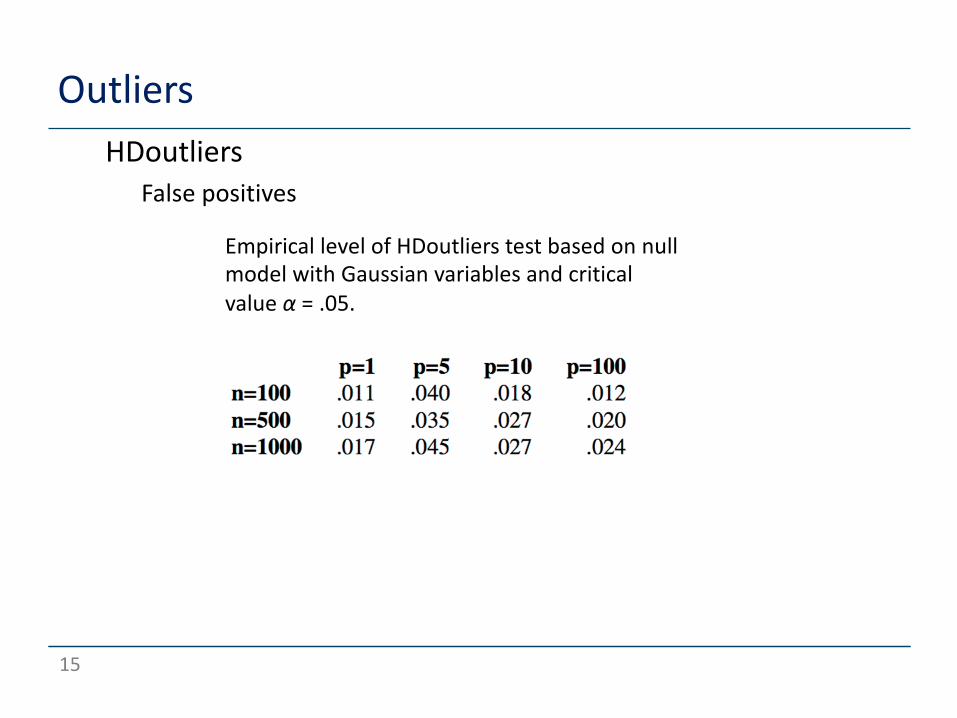
o Falsepositives
EmpiricallevelofHDoutliers testbasedonnullmodelwithGaussianvariablesandcriticalvalueα =.05.

16
Outlierso TimeSeries
0 2,000 4,000 6,000 8,000
Time
-0.6
0
0.6
1.2
1.8
2.4
3.0
SNOW_HI
Kernel smoother with a biweight function on the running mean. The data are measurements of snowfall at a Greenland weather station.
Jan Feb Mar Apr May Jun Jul Aug Sep Oct Nov Dec
Month
4
2009
2010
2011
2012
5
6
7
8
9
10
US
Une
mpl
oym
ent R
ate
Each series is a row in the data matrix. For n series on p time points, we have a p-dimensional outlier problem. This figure shows series over 20 years of the Bureau of Labor Statistics Unemployment data.
17
Outlierso Textanalysisofdocuments
Alice in Wonderland
Bleak House
Frankenstein
Gulliver’s Travels
Jude the Obscure
Lord Jim
Moby DickPride and PrejudiceSense and Sensibility
Silas MarnerSons and Lovers
Vanity Fair
War and Peace
Wizard of Oz
*
**
*
*
*
**
**
*
* **
*
Middlemarch
Ulysses
-3.2 -2.4 -1.6 -0.8 0 0.8 1.6 2.4 3.2
Dimension 1
-3.2
-2.4
-1.6
-0.8
0
0.8
1.6
2.4
3.2
Dim
ensi
on 2
*Tristram Shandy *
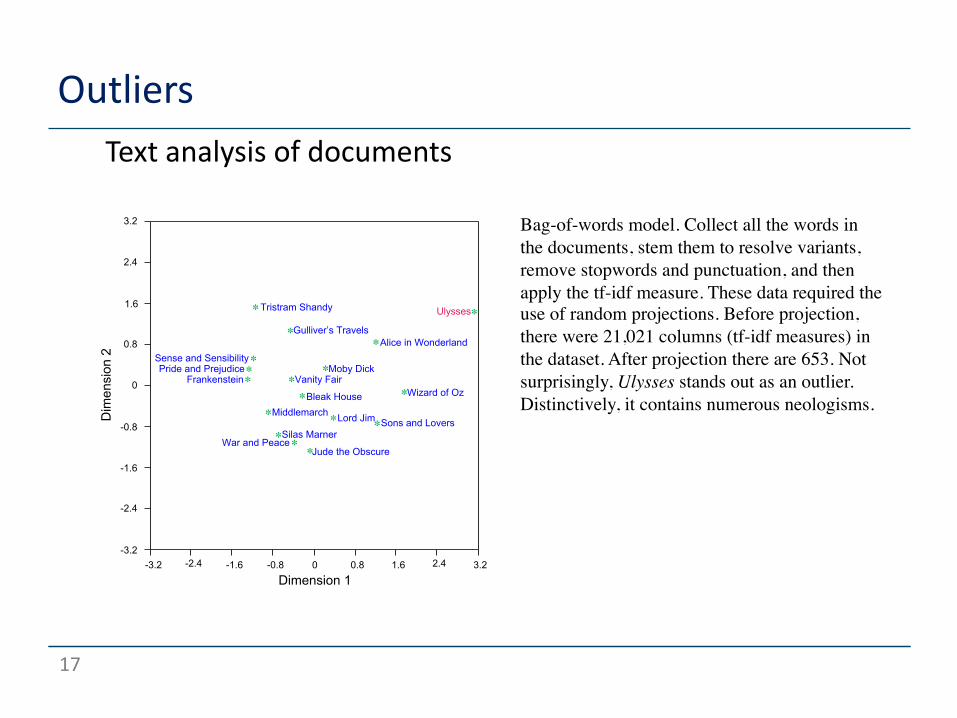
Bag-of-words model. Collect all the words in the documents, stem them to resolve variants, remove stopwords and punctuation, and then apply the tf-idf measure. These data required the use of random projections. Before projection, there were 21,021 columns (tf-idf measures) in the dataset. After projection there are 653. Not surprisingly, Ulysses stands out as an outlier. Distinctively, it contains numerous neologisms.
18
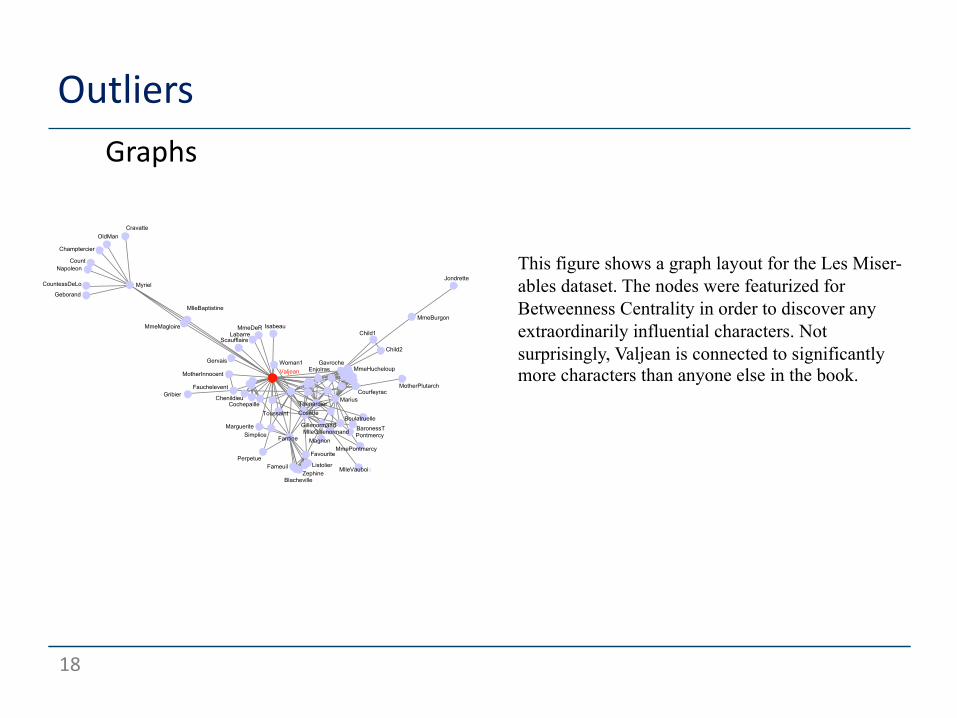
Outlierso Graphs
Woman1
Gribier
Listolier
MmeBurgon
Brujon
MmePontmercy
OldMan
Javert
Valjean
Cosette
Child2
Child1
Courfeyrac
LabarreMmeDeRMmeMagloire
Jondrette
Boulatruelle
MotherInnocentMmeHucheloup
Champtercier
Blacheville
Cravatte
Enjolras
Favourite
Fameuil
Toussaint
Chenildieu
BaronessT
MlleBaptistine
Gavroche
Cochepaille
Zephine
Isabeau
Count
MotherPlutarch
MlleVaubois
Fauchelevent
MagnonSimplice
Thenardier
Napoleon
Scaufflaire
MlleGillenormand Pontmercy
Gervais
Marguerite
Perpetue
Gillenormand
Babet
Geborand
Eponine
CountessDeLo Myriel
Fantine
Marius
This figure shows a graph layout for the Les Miser-ables dataset. The nodes were featurized for Betweenness Centrality in order to discover any extraordinarily influential characters. Not surprisingly, Valjean is connected to significantly more characters than anyone else in the book.
19
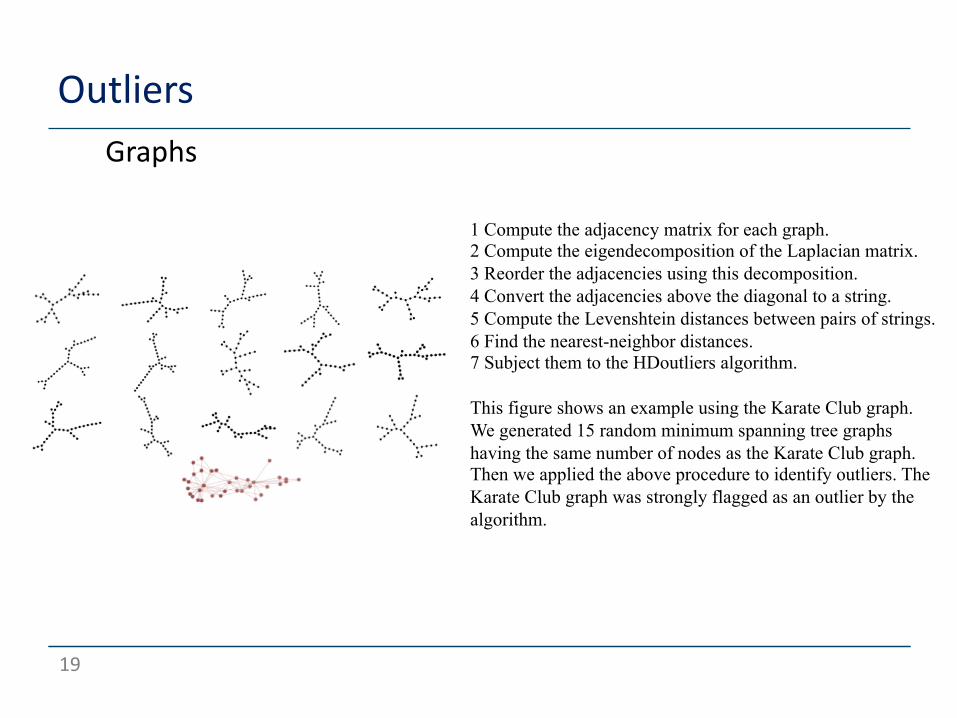
Outlierso Graphs
1 Compute the adjacency matrix for each graph. 2 Compute the eigendecomposition of the Laplacian matrix.3 Reorder the adjacencies using this decomposition.4 Convert the adjacencies above the diagonal to a string. 5 Compute the Levenshtein distances between pairs of strings. 6 Find the nearest-neighbor distances.7 Subject them to the HDoutliers algorithm.
This figure shows an example using the Karate Club graph. We generated 15 random minimum spanning tree graphs having the same number of nodes as the Karate Club graph. Then we applied the above procedure to identify outliers. The Karate Club graph was strongly flagged as an outlier by the algorithm.
20
Outlierso References
o Barnett, V. and Lewis, T. (1978). Outliers in Statistical Data. John Wiley & Sons. o Breunig, M. M., Kriegel, H.-P., Ng, R. T., and Sander, J. (2000). LOF: Identifying
density-based local outliers. In Proceedings of the 2000 ACM SIGMOD In-ternational Conference on Management of Data, SIGMOD ’00, pages 93–104, New York, NY, USA. ACM.
o Burridge, P. and Taylor, A. (2006). Additive outlier detection via extreme-value theory. Journal of Time Series Analysis, 27:685–701.
o Hartigan, J. (1975). Clustering Algorithms. John Wiley & Sons, New York. 12. Hawkins, D. (1980). Identification of Outliers. Chapman & Hall/CRC. o Rousseeuw, P. and Zomeren, B. V. (1990). Unmasking multivariate outliers and
leverage points. Journal of the American Statistical Association, 85:633–651. o Wainer, H. and Schacht, S. (1978). Gapping. Psychometrika, 43:203–212.
21
Outlierso Thanks!
o ChrisFraleyimplementedtheRpackagefrommyJavacode.o [email protected]@o [email protected] https://www.cs.uic.edu/~wilkinson/
o EmailmeorChrisfortechsupport: