Multicolor Flow Cytometry - BD Biosciences€¦ · Multicolor Flow Cytometry Setup and Design Setup...
59
Multicolor Flow Cytometry Setup and Design Multicolor Flow Cytometry Setup and Design Presented by Maria C. Jaimes, MD, Scientist, BD Biosciences Presented by Maria C. Jaimes, MD, Scientist, BD Biosciences 23-13501-00
Transcript of Multicolor Flow Cytometry - BD Biosciences€¦ · Multicolor Flow Cytometry Setup and Design Setup...
Multicolor Flow Cytometry
Setup and Design
Multicolor Flow Cytometry
Setup and Design
Presented by
Maria C. Jaimes, MD, Scientist, BD Biosciences
Presented by
Maria C. Jaimes, MD, Scientist, BD Biosciences
23-13501-00
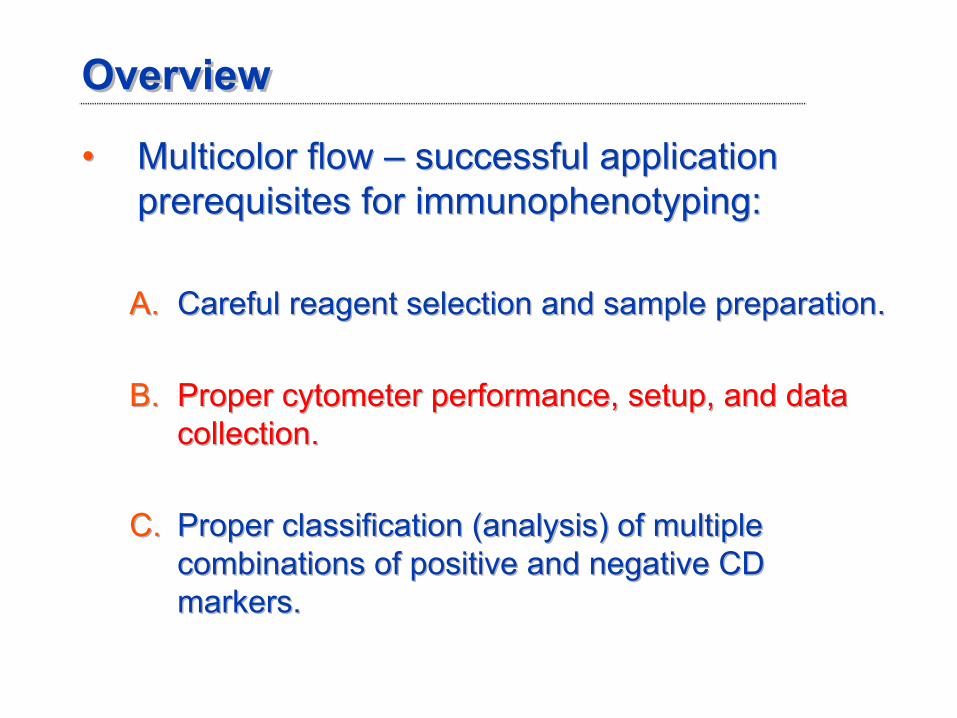
OverviewOverview
• Multicolor flow –
successful application
prerequisites for immunophenotyping:
A.
Careful reagent selection and sample preparation.
B.
Proper cytometer
performance, setup, and data
collection.
C.
Proper classification (analysis) of multiple combinations of positive and negative CD markers.
• Multicolor flow –
successful application
prerequisites for immunophenotyping:
A.
Careful reagent selection and sample preparation.
B.
Proper cytometer
performance, setup, and data collection.
C.
Proper classification (analysis) of multiple combinations of positive and negative CD markers.
Immunophenotyping by Flow Cytometry (1)Immunophenotyping by Flow Cytometry (1)
•
Ultimate GoalResolve distinct subsets of leucocytes expressing one or more unique key markers.
•
Method
The proper classification of many of the large number of distinct leucocyte
subsets (phenotypic and functional)
often requires simultaneous labeling with several markers: a multicolor panel.
• Ultimate GoalResolve distinct subsets of leucocytes expressing one or more unique key markers.
• MethodThe proper classification of many of the large number of distinct leucocyte
subsets (phenotypic and functional)
often requires simultaneous labeling with several markers: a multicolor panel.
Immunophenotyping by Flow Cytometry (2)Immunophenotyping by Flow Cytometry (2)
•
Typical Problems/Challenges–
Some markers are highly expressed, others are expressed at low levels.
–
Some dyes are much brighter than others.
–
Significant emission spillover from non-primary fluorescent reagents contributes to optical background, which can often diminish the resolution of dim markers (due to spread after compensation).
–
Some markers may be available only in certain colors.
–
New fluorochromes are not as bright or stable as the original ones.
–
Instrument setup considerations.
–
Additional complexity increases error possibilities.
Immunophenotyping by Flow Cytometry (3)Immunophenotyping by Flow Cytometry (3)
•
As a result, multicolor flow assays and reagent panel combinations need to be very carefully assembled to obtain reliable and interpretable data.
•
What factors affect reagent performance on a cytometer and what is the best approach for assembling a
multicolor panel?
•
As a result, multicolor flow assays and reagent panel combinations need to be very carefully assembled to obtain reliable and interpretable data.
•
What factors affect reagent performance on a cytometer and what is the best approach for assembling a
multicolor panel?
TNK as an Example
of Multiparametric Flow Cytometry Assays
TNK as an Example
of Multiparametric Flow Cytometry Assays
Several markers used to define T-
and NK-cellsubsets:
-
T-cell markers: CD3, CD8, and CD7
-
NK-cell markers: CD16, CD56, and CD57
-
CD8 and CD7 are also expressed by some subsets of NK cells
Several markers used to define T-
and NK-cellsubsets:
-
T-cell markers: CD3, CD8, and CD7
-
NK-cell markers: CD16, CD56, and CD57
-
CD8 and CD7 are also expressed by some subsets of NK cells
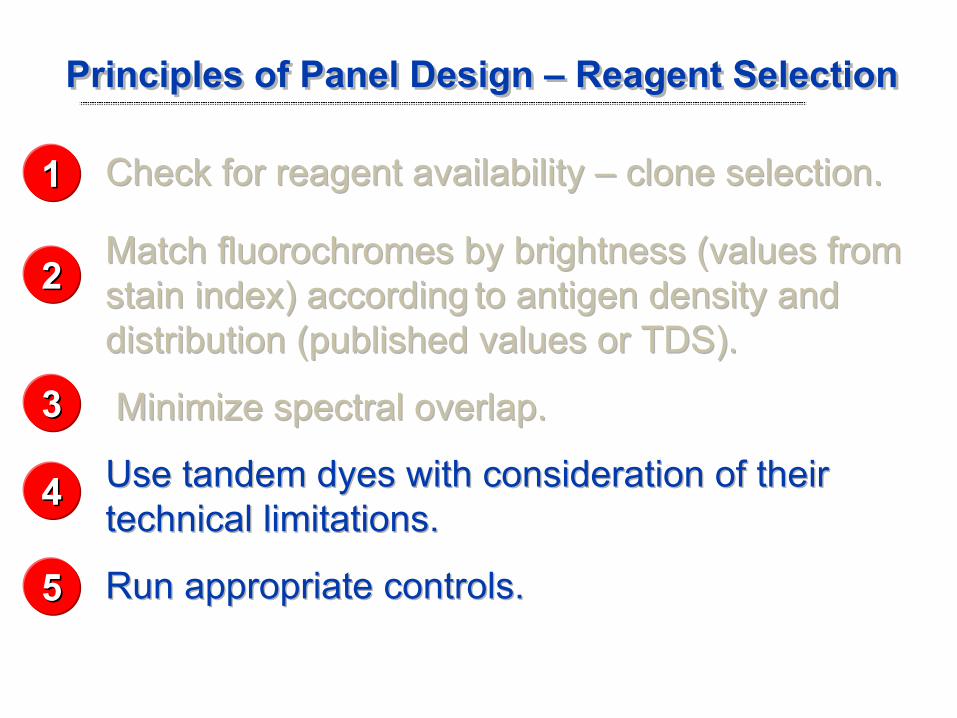
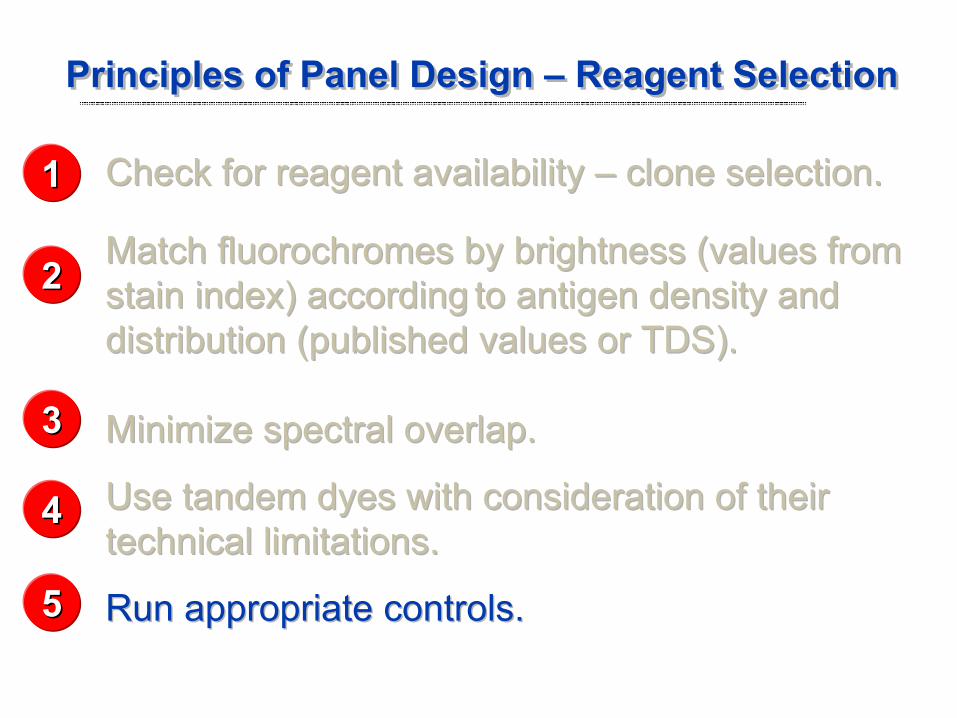
Principles of Panel Design –
Reagent SelectionPrinciples of Panel Design –
Reagent Selection
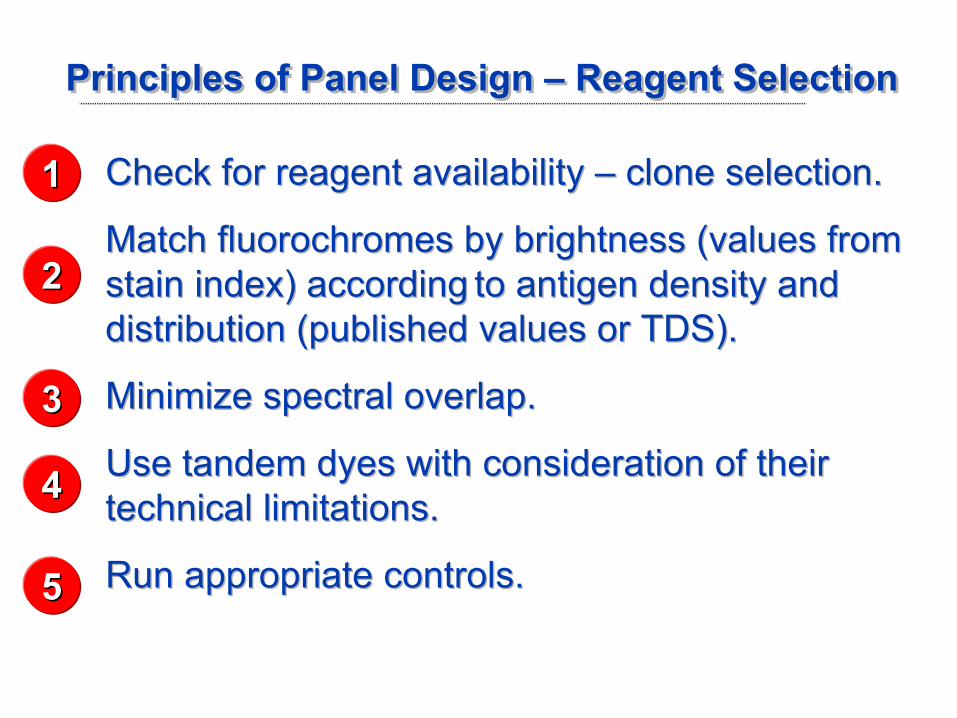
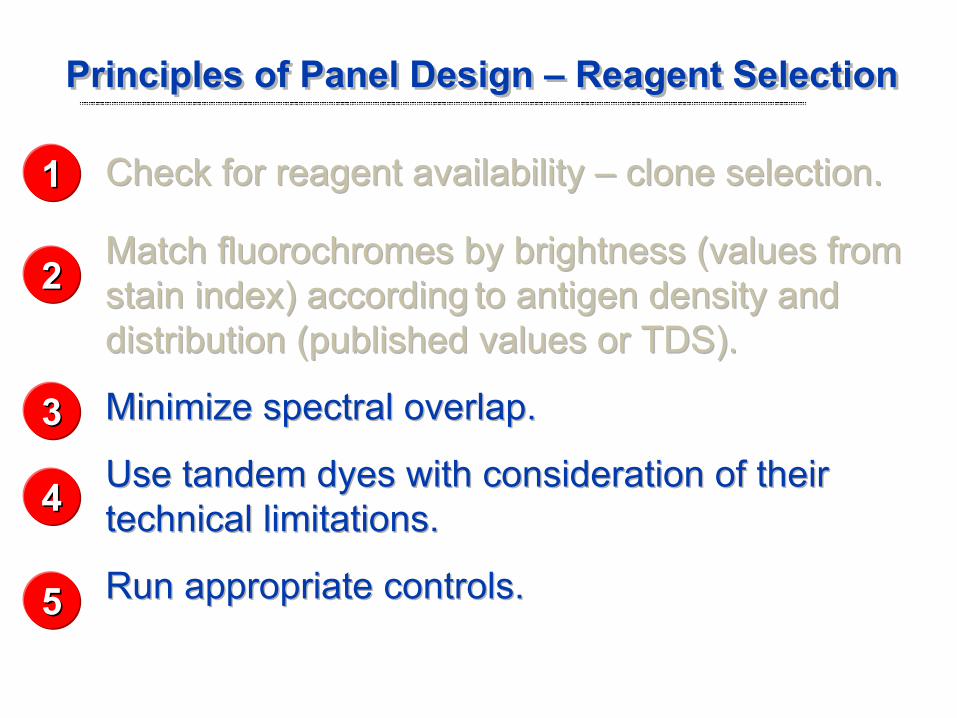
Check for reagent availability –
clone selection.
Match fluorochromes by brightness (values from stain index) according
to antigen density and
distribution (published values or TDS). Minimize spectral overlap.
Use tandem dyes with consideration of their technical limitations.
Run appropriate controls.
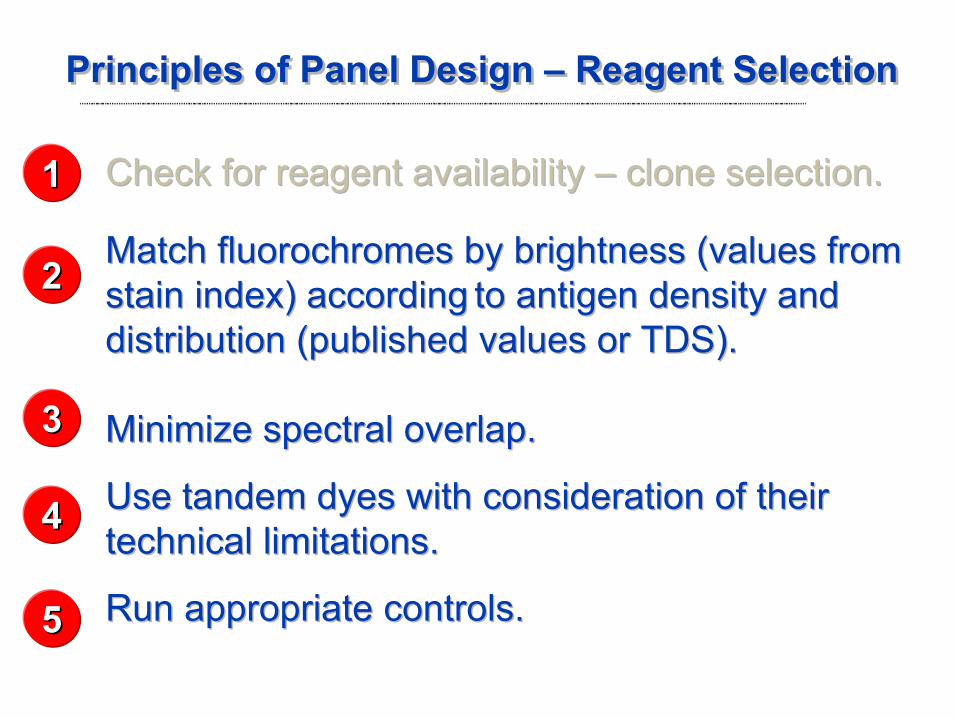
Check for reagent availability –
clone selection.
Match fluorochromes by brightness (values from stain index) according
to antigen density and
distribution (published values or TDS).
Minimize spectral overlap.
Use tandem dyes with consideration of their technical limitations.
Run appropriate controls.
22
11
33
44
55
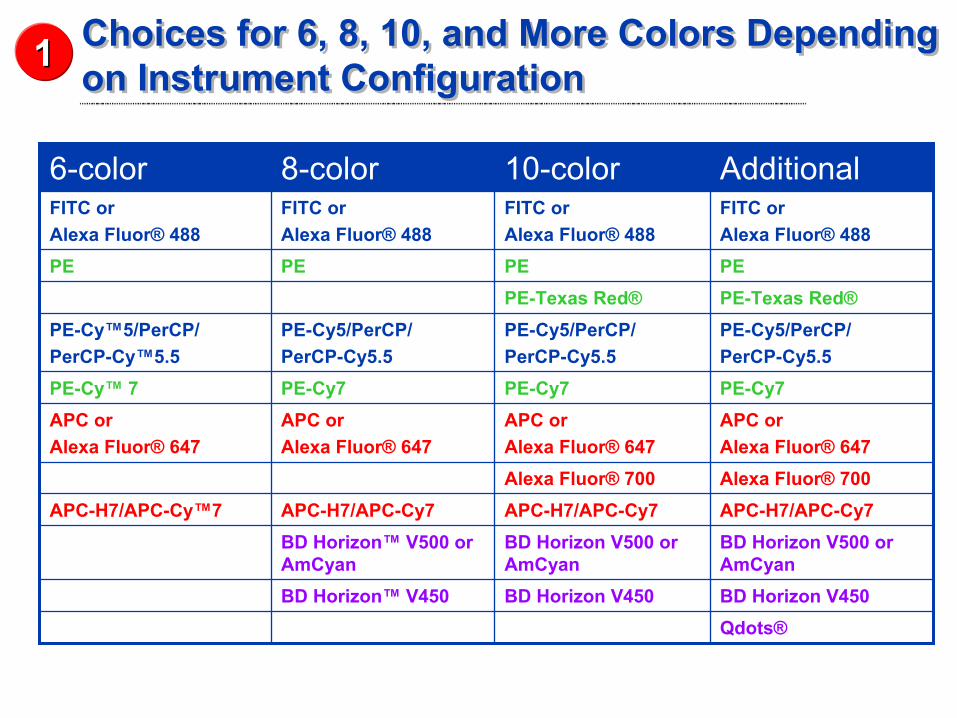
Choices for 6, 8, 10, and More Colors Depending on Instrument Configuration
Choices for 6, 8, 10, and More Colors Depending on Instrument Configuration
6-color 8-color 10-color AdditionalFITC or Alexa Fluor®
488FITC or Alexa Fluor®
488FITC or Alexa Fluor®
488FITC or Alexa Fluor®
488PE PE PE PE
PE-Texas Red® PE-Texas Red®PE-Cy™5/PerCP/PerCP-Cy™5.5
PE-Cy5/PerCP/PerCP-Cy5.5
PE-Cy5/PerCP/PerCP-Cy5.5
PE-Cy5/PerCP/PerCP-Cy5.5
PE-Cy™ 7 PE-Cy7 PE-Cy7 PE-Cy7APC or Alexa Fluor®
647APC or Alexa Fluor®
647APC or Alexa Fluor®
647APC or Alexa Fluor®
647Alexa Fluor®
700 Alexa Fluor®
700APC-H7/APC-Cy™7 APC-H7/APC-Cy7 APC-H7/APC-Cy7 APC-H7/APC-Cy7
BD Horizon™
V500 or AmCyan
BD Horizon V500 or AmCyan
BD Horizon V500 or AmCyan
BD Horizon™
V450 BD Horizon V450 BD Horizon V450Qdots®
11
Checking Reagent AvailabilityChecking Reagent Availability
•
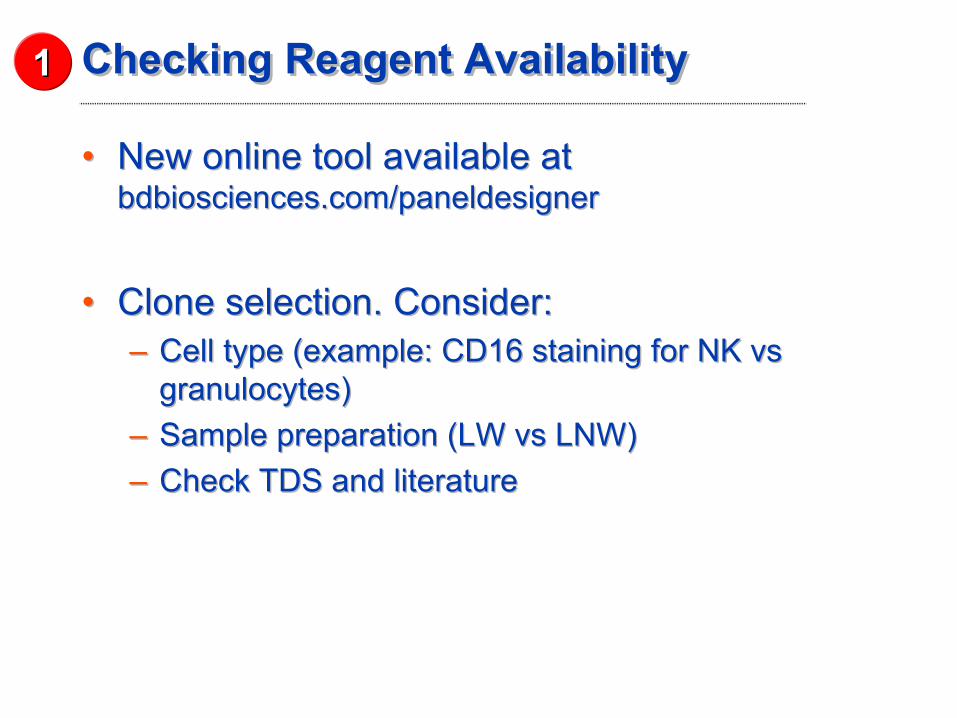
New online tool available at bdbiosciences.com/paneldesigner
•
Clone selection. Consider:–
Cell type (example: CD16 staining for NK vs
granulocytes) –
Sample preparation (LW vs
LNW)
–
Check TDS and literature
•
New online tool available at bdbiosciences.com/paneldesigner
•
Clone selection. Consider:–
Cell type (example: CD16 staining for NK vs
granulocytes)–
Sample preparation (LW vs
LNW)
–
Check TDS and literature
11
Principles of Panel Design –
Reagent SelectionPrinciples of Panel Design –
Reagent Selection
Check for reagent availability –
clone selection.
Match fluorochromes by brightness (values from stain index) according
to antigen density and
distribution (published values or TDS).
Minimize spectral overlap.
Use tandem dyes with consideration of their technical limitations.
Run appropriate controls.
22
11
33
44
55
Determine Antigen/Fluorochrome Combos (1)Determine Antigen/Fluorochrome Combos (1)
•
Use the brighter fluorochromes for dimly expressed markers.
•
Use the dimmer fluorochromes for more highly expressed markers.
•
Use the brighter fluorochromes for dimly expressed markers.
•
Use the dimmer fluorochromes for more highly expressed markers.
22
Determine Antigen/Fluorochrome Combos (2)Determine Antigen/Fluorochrome Combos (2)
•
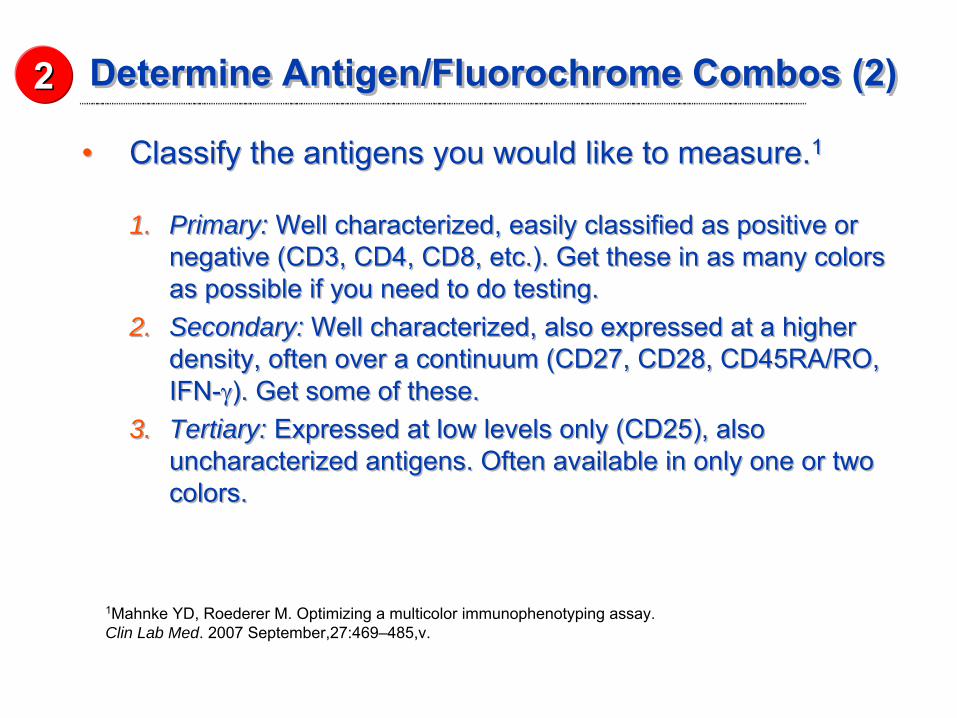
Classify the antigens you would like to measure.1
1. Primary: Well characterized, easily classified as positive or negative (CD3, CD4, CD8, etc.). Get these in as many colors as possible if you need to do testing.
2. Secondary: Well characterized, also expressed at a higher density, often over a continuum (CD27, CD28, CD45RA/RO, IFN-γ). Get some of these.
3. Tertiary: Expressed at low levels only (CD25), also uncharacterized antigens. Often available in only one or two colors.
•
Classify the antigens you would like to measure.1
1. Primary: Well characterized, easily classified as positive or negative (CD3, CD4, CD8, etc.). Get these in as many colors as possible if you need to do testing.
2. Secondary: Well characterized, also expressed at a higher density, often over a continuum (CD27, CD28, CD45RA/RO, IFN-γ). Get some of these.
3. Tertiary: Expressed at low levels only (CD25), also uncharacterized antigens. Often available in only one or two colors.
1Mahnke YD, Roederer M. Optimizing a multicolor immunophenotyping
assay.Clin Lab Med. 2007 September,27:469–485,v.
22
Glossary: Antigen Density
Glossary: Antigen Density
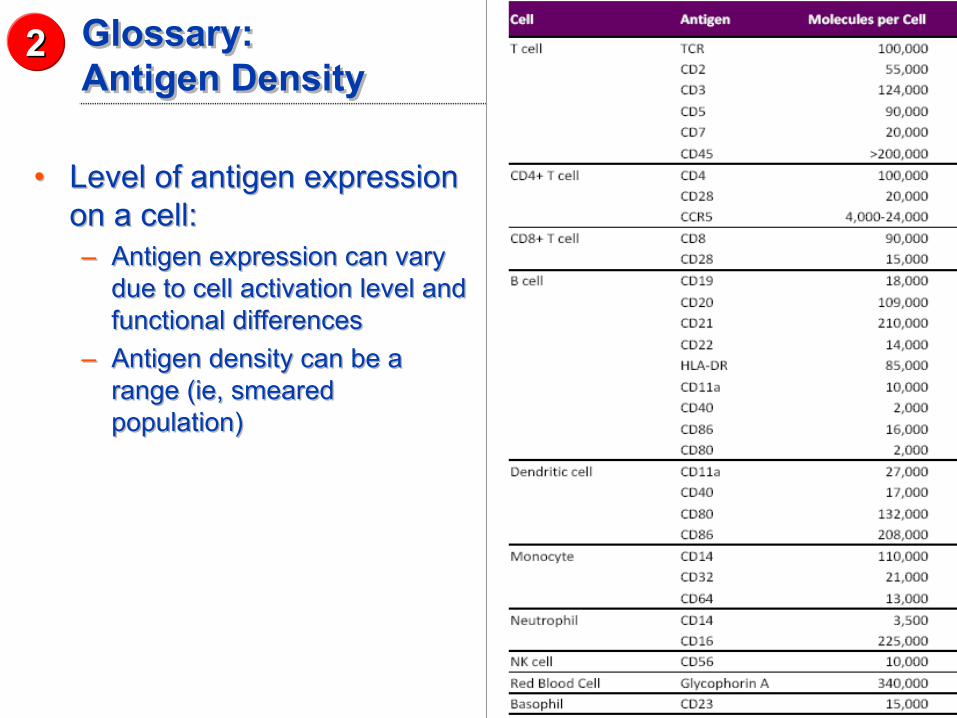
•
Level of antigen expression on a cell:
–
Antigen expression can vary due to cell activation level and functional differences
–
Antigen density can be a range (ie, smeared population)
•
Level of antigen expression on a cell:–
Antigen expression can vary due to cell activation level and functional differences
–
Antigen density can be a range (ie, smeared population)
22
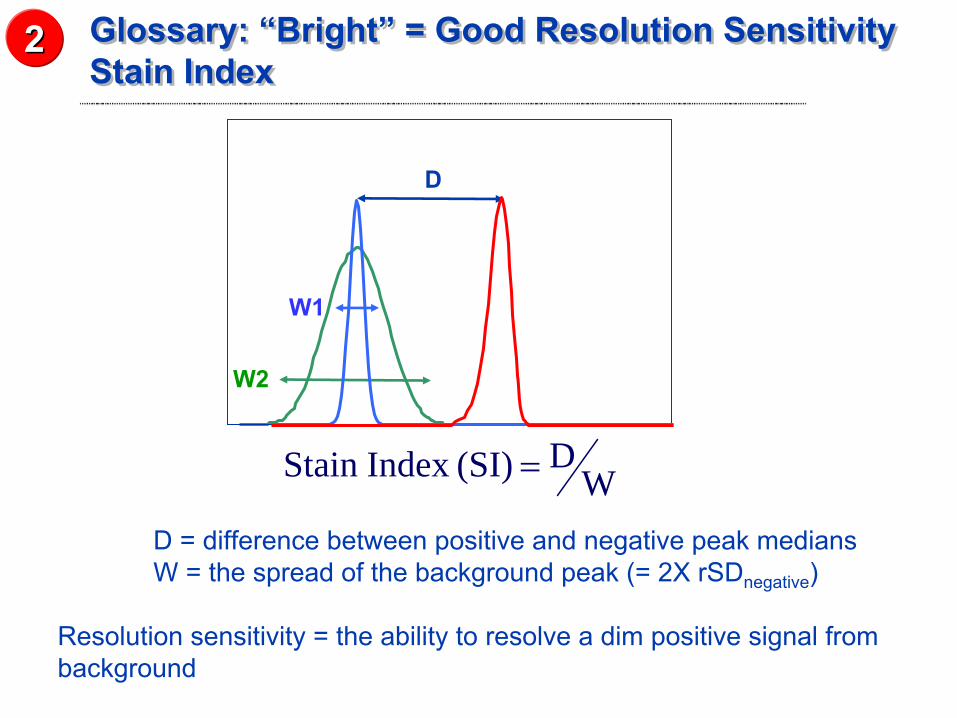
Glossary: “Bright”
= Good Resolution Sensitivity Stain Index
Glossary: “Bright”
= Good Resolution Sensitivity Stain Index
W2
W1
D
WD(SI)Index Stain =
D = difference between positive and negative peak mediansW = the spread of the background peak (= 2X rSDnegative
)
Resolution sensitivity = the ability to resolve a dim positive signal from background
22
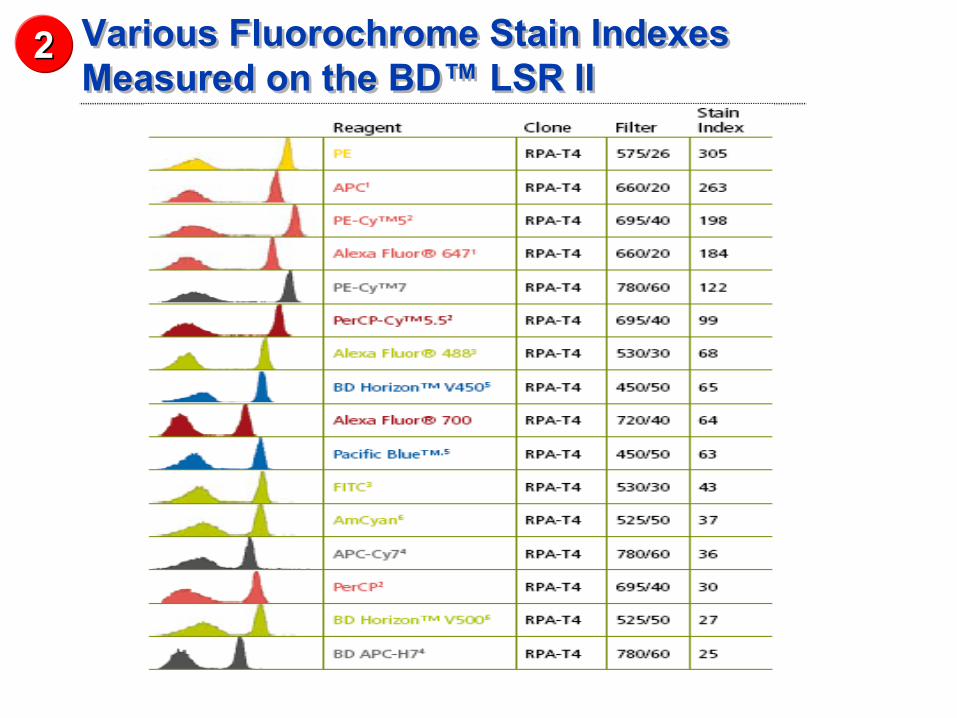
Various Fluorochrome Stain Indexes Measured on the BD™
LSR II
Various Fluorochrome Stain Indexes Measured on the BD™
LSR II
22
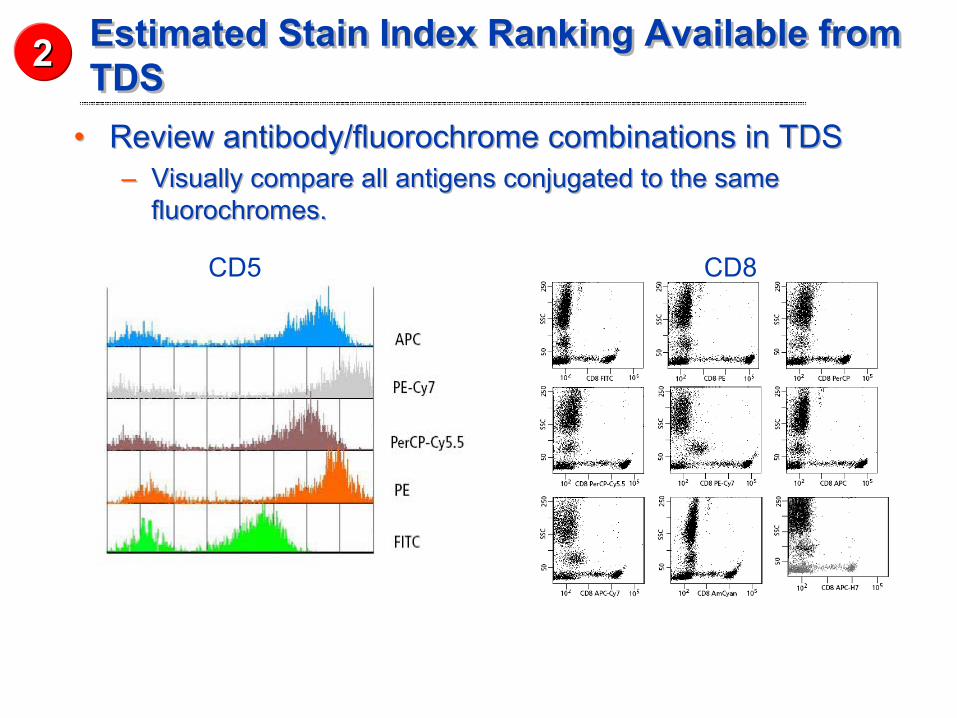
Estimated Stain Index Ranking Available from TDS
Estimated Stain Index Ranking Available from TDS
•
Review antibody/fluorochrome
combinations in TDS–
Visually compare all antigens conjugated to the same fluorochromes.
•
Review antibody/fluorochrome
combinations in TDS–
Visually compare all antigens conjugated to the same fluorochromes.
CD5 CD8
22
ExampleExample
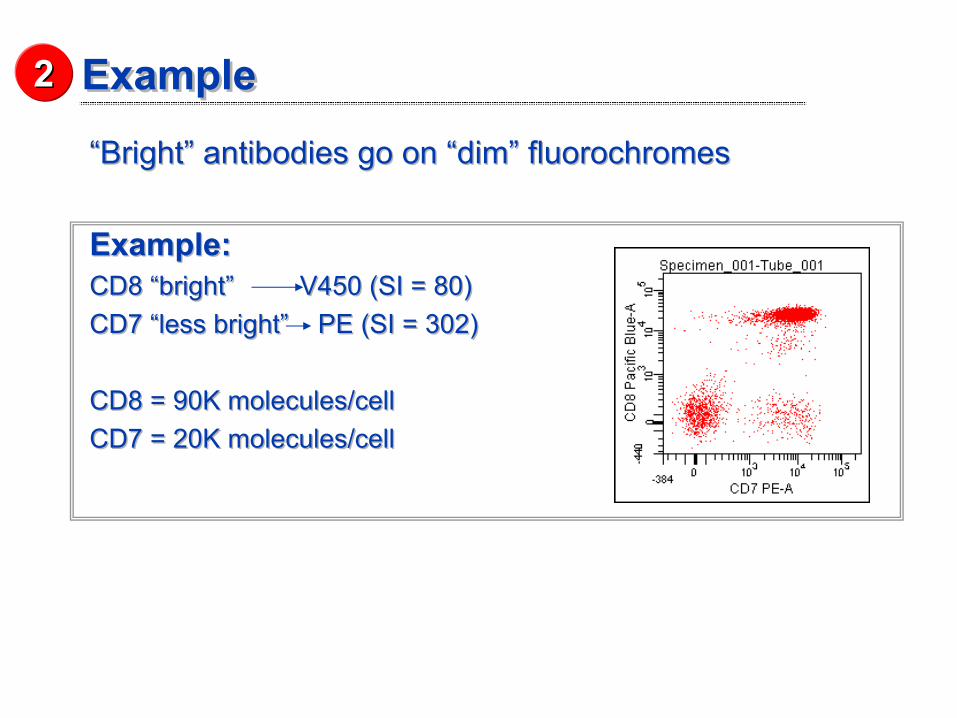
“Bright”
antibodies go on “dim”
fluorochromes
Example: CD8 “bright”
V450 (SI = 80) CD7 “less bright”
PE (SI = 302)
CD8 = 90K molecules/cellCD7 = 20K molecules/cell
“Bright”
antibodies go on “dim”
fluorochromes
Example: CD8 “bright”
V450 (SI = 80) CD7 “less bright”
PE (SI = 302)
CD8 = 90K molecules/cellCD7 = 20K molecules/cell
22
Principles of Panel Design –
Reagent SelectionPrinciples of Panel Design –
Reagent Selection
Check for reagent availability –
clone selection.
Match fluorochromes by brightness (values from stain index) according
to antigen density and
distribution (published values or TDS). Minimize spectral overlap.
Use tandem dyes with consideration of their technical limitations.
Run appropriate controls.
Check for reagent availability –
clone selection.
Match fluorochromes by brightness (values from stain index) according
to antigen density and
distribution (published values or TDS).
Minimize spectral overlap.
Use tandem dyes with consideration of their technical limitations.
Run appropriate controls.
22
11
33
44
55
Fluorescence SpilloverFluorescence Spillover33
•
The single most important factor affecting resolution sensitivity (SI) in multicolor flow cytometry experiments.
•
Fluorescence spillover from other channels:
–
Directly and irreversibly reduces the resolution sensitivity of that channel –
Contributes to background
•
This “background”
is subtracted in the process called compensation.
•
The single most important factor affecting resolution sensitivity (SI) in multicolor flow cytometry experiments.
• Fluorescence spillover from other channels:–
Directly and irreversibly reduces the resolution sensitivity
of that channel –
Contributes to background
•
This “background”
is subtracted in the process called compensation.
Spillover Decreases Resolution SensitivitySpillover Decreases Resolution Sensitivity
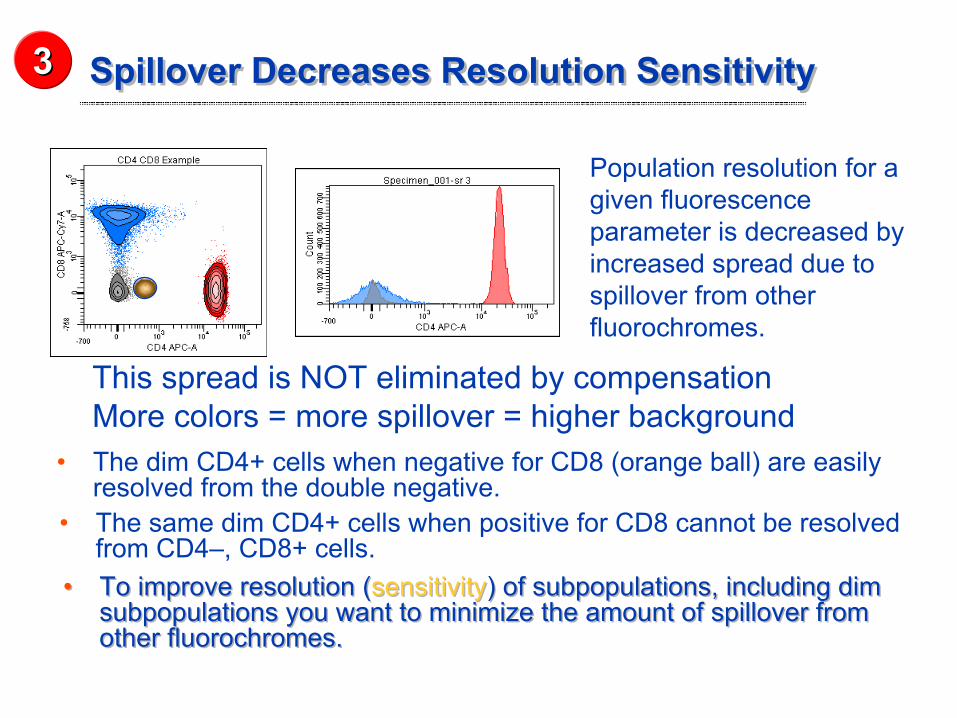
•
To improve resolution (sensitivity) of subpopulations, including dim subpopulations you want to minimize the amount of spillover from
other fluorochromes.
•
To improve resolution (sensitivity) of subpopulations, including dim subpopulations you want to minimize the amount of spillover from
other fluorochromes.
Population resolution for a given fluorescence parameter is decreased by increased spread due to spillover from other fluorochromes.
This spread is NOT eliminated by compensationMore colors = more spillover = higher background
•
The dim CD4+ cells when negative for CD8 (orange ball) are easily resolved from the double negative.
•
The same dim CD4+ cells when positive for CD8 cannot be resolved
from CD4–, CD8+ cells.
33
% Spillover of Fluorochromes –
BD FACSCanto™% Spillover of Fluorochromes –
BD FACSCanto™
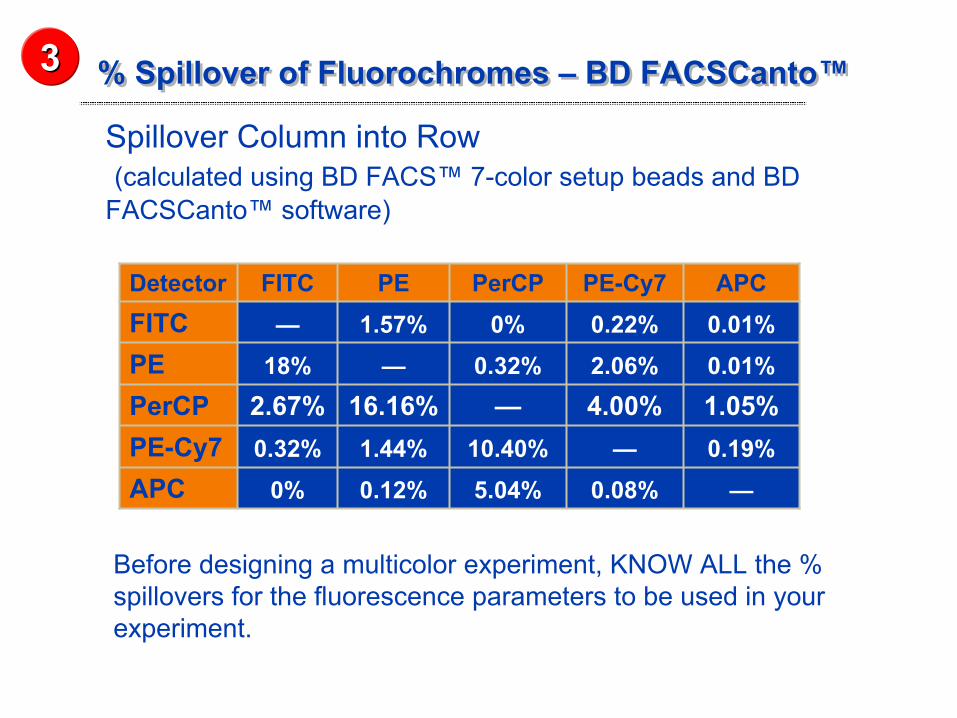
Spillover Column into Row(calculated using BD FACS™ 7-color setup beads and BD
FACSCanto™
software)
Detector FITC PE PerCP PE-Cy7 APCFITC — 1.57% 0% 0.22% 0.01%PE 18% — 0.32% 2.06% 0.01%PerCP 2.67% 16.16% — 4.00% 1.05%PE-Cy7 0.32% 1.44% 10.40% — 0.19%APC 0% 0.12% 5.04% 0.08% —
33
Before designing a multicolor experiment, KNOW ALL the % spillovers for the fluorescence parameters to be used in your experiment.
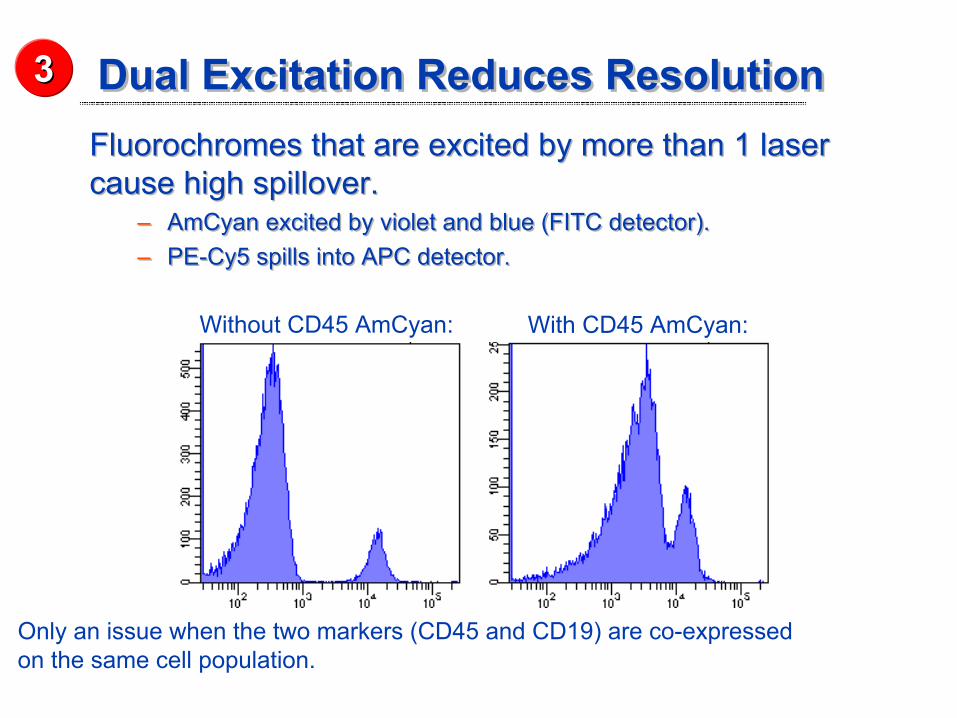
Dual Excitation Reduces ResolutionDual Excitation Reduces ResolutionFluorochromes that are excited by more than 1 laser cause high spillover.
–
AmCyan excited by violet and blue (FITC detector).–
PE-Cy5 spills into APC detector.
Fluorochromes that are excited by more than 1 laser cause high spillover.
–
AmCyan excited by violet and blue (FITC detector).–
PE-Cy5 spills into APC detector.
Without CD45 AmCyan: With CD45 AmCyan:
CD19 FITCOnly an issue when the two markers (CD45 and CD19) are co-expressed on the same cell population.
33
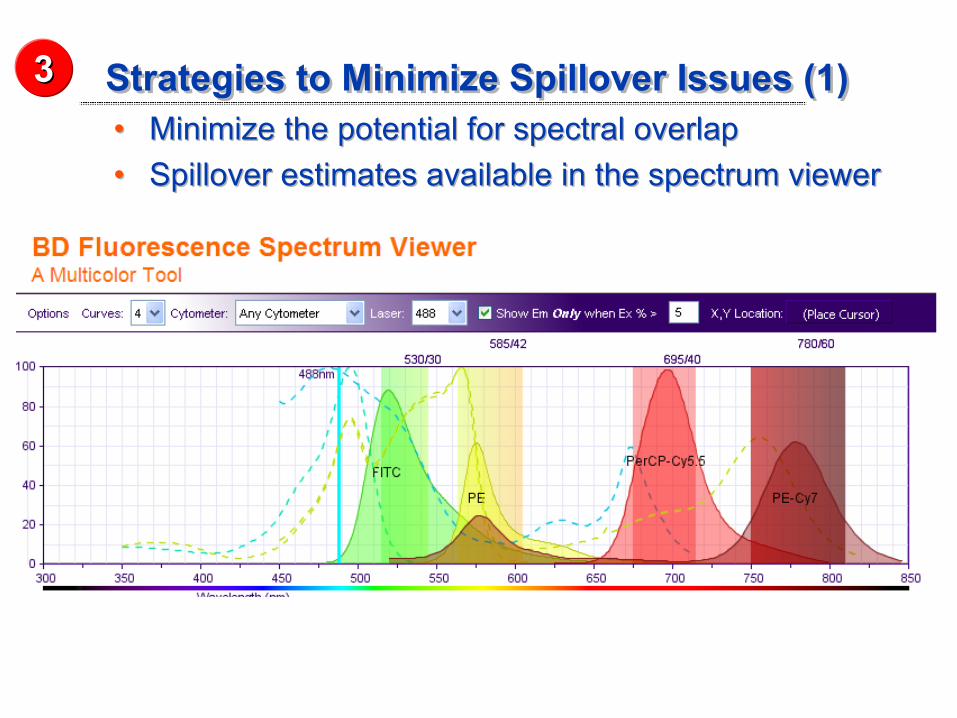
Strategies to Minimize Spillover Issues (1)Strategies to Minimize Spillover Issues (1)•
Minimize the potential for spectral overlap
•
Spillover estimates available in the spectrum viewer•
Minimize the potential for spectral overlap
•
Spillover estimates available in the spectrum viewer
33
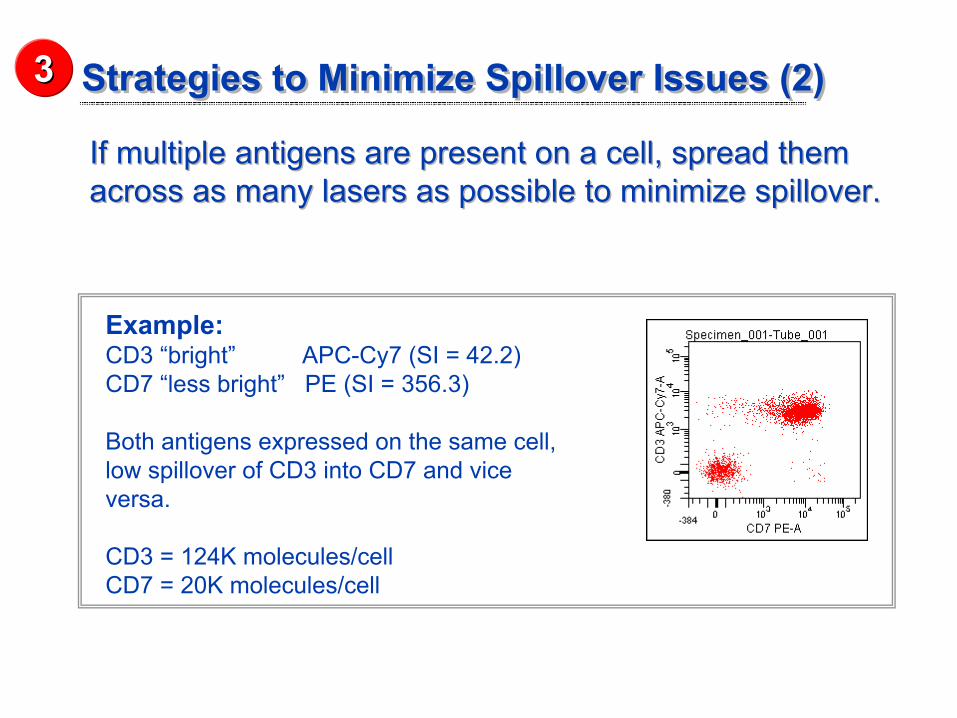
Strategies to Minimize Spillover Issues (2)Strategies to Minimize Spillover Issues (2)
If multiple antigens are present on a cell, spread them across as many lasers as possible to minimize spillover.
If multiple antigens are present on a cell, spread them across as many lasers as possible to minimize spillover.
Example: CD3 “bright”
APC-Cy7 (SI = 42.2) CD7 “less bright”
PE (SI = 356.3)
Both antigens expressed on the same cell, low spillover of CD3 into CD7 and vice versa.
CD3 = 124K molecules/cellCD7 = 20K molecules/cell
33
Principles of Panel Design –
Reagent SelectionPrinciples of Panel Design –
Reagent Selection
Check for reagent availability –
clone selection.
Match fluorochromes by brightness (values from stain index) according
to antigen density and
distribution (published values or TDS). Minimize spectral overlap.
Use tandem dyes with consideration of their technical limitations.
Run appropriate controls.
Check for reagent availability –
clone selection.
Match fluorochromes by brightness (values from stain index) according
to antigen density and
distribution (published values or TDS).
Minimize spectral overlap.
Use tandem dyes with consideration of their technical limitations.
Run appropriate controls.
22
11
33
44
55
Use Tandem Dyes with Consideration of Their Technical Limitations
Use Tandem Dyes with Consideration of Their Technical Limitations
•
Compensation requirements for tandem dye conjugates can vary, even between two experiments with the same antibody.
–
Require compensation that is: lot-specific, experiment-
specific, and label-specific.
–
Treat compensation controls the same as sample cells.
•
Certain tandem dye conjugates (APC-Cy7, PE-Cy7) can degrade with exposure to light, elevated temperature, and fixation.
–
Minimize exposure to these conditions.–
Use BD™
Stabilizing Fixative for final fixation.
•
Compensation requirements for tandem dye conjugates can vary, even between two experiments with the same antibody.–
Require compensation that is: lot-specific, experiment-
specific, and label-specific.–
Treat compensation controls the same as sample cells.
•
Certain tandem dye conjugates (APC-Cy7, PE-Cy7) can degrade with exposure to light, elevated temperature, and fixation.–
Minimize exposure to these conditions.–
Use BD™
Stabilizing Fixative for final fixation.
44
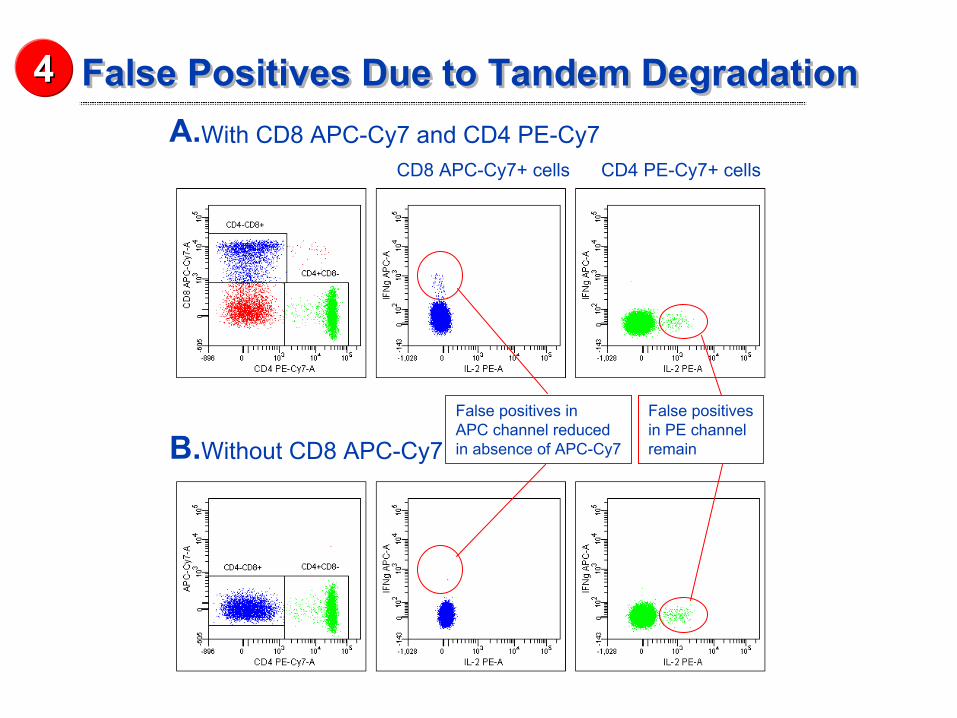
False Positives Due to Tandem DegradationFalse Positives Due to Tandem DegradationA.
False positives inAPC channel reducedin absence of APC-Cy7
False positivesin PE channelremain
CD8 APC-Cy7+ cells CD4 PE-Cy7+ cells
B.
With CD8 APC-Cy7 and CD4 PE-Cy7
Without CD8 APC-Cy7
44
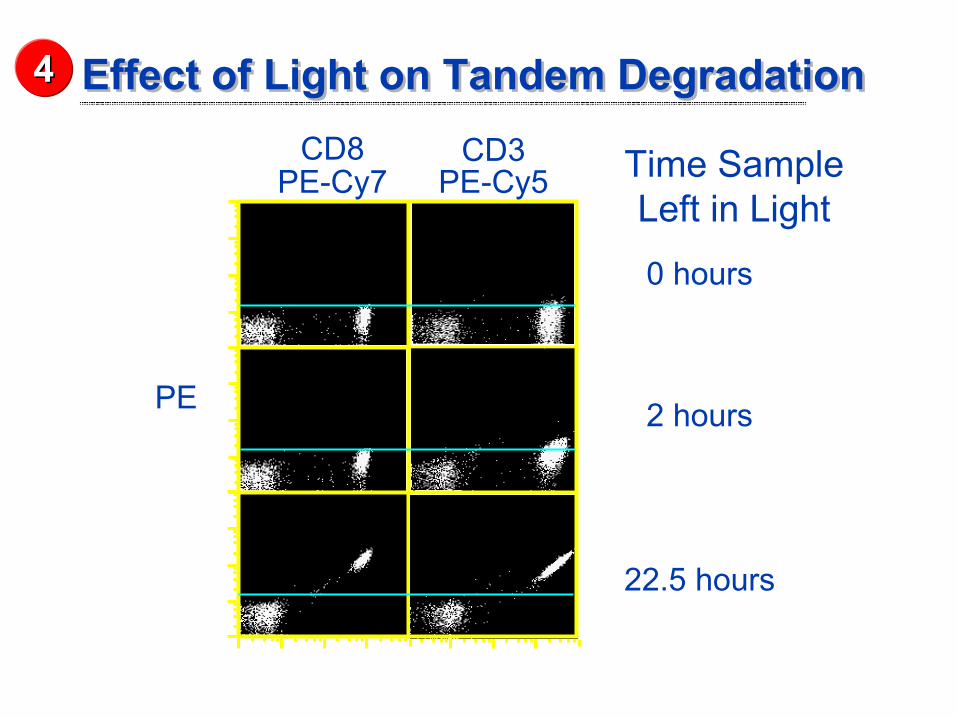
Effect of Light on Tandem DegradationEffect of Light on Tandem Degradation
0 hours
2 hours
22.5 hours
PE
CD8 CD3PE-Cy5PE-Cy7 Time Sample
Left in Light
44
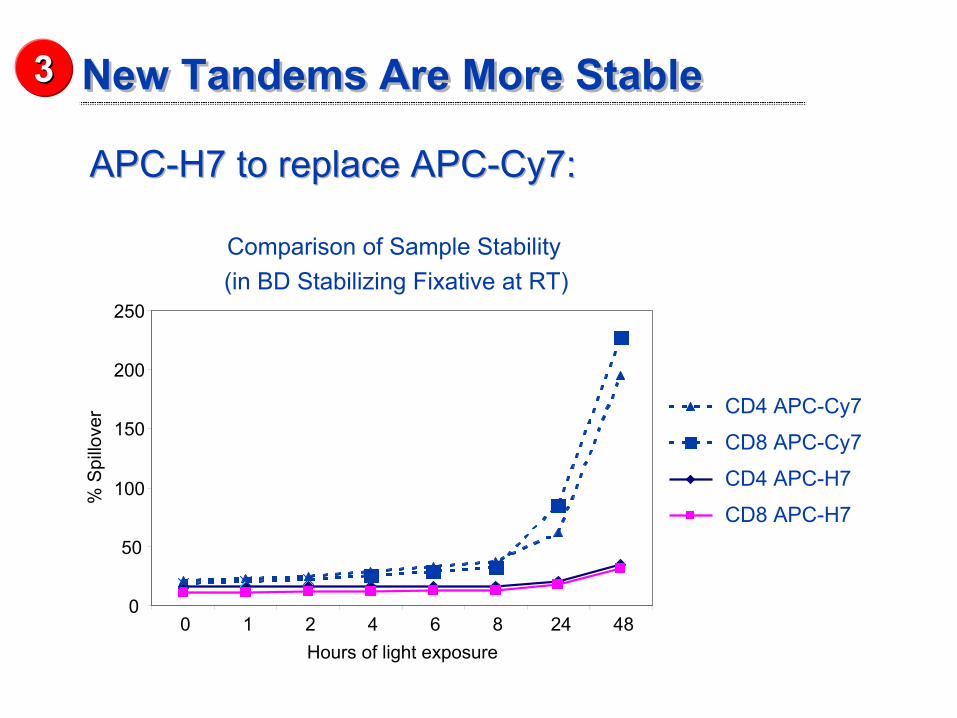
New Tandems Are More StableNew Tandems Are More Stable
APC-H7 to replace APC-Cy7:APC-H7 to replace APC-Cy7:
Comparison of Sample Stability(in BD Stabilizing Fixative at RT)
0
50
100
150
200
250
0 1 2 4 6 8 24 48Hours of light exposure
% S
pillo
ver
CD4 APC-H7
CD8 APC-H7
CD4 APC-Cy7
CD8 APC-Cy7
33
Principles of Panel Design –
Reagent SelectionPrinciples of Panel Design –
Reagent Selection
Check for reagent availability –
clone selection.
Match fluorochromes by brightness (values from stain index) according
to antigen density and
distribution (published values or TDS).
Minimize spectral overlap.
Use tandem dyes with consideration of their technical limitations.
Run appropriate controls.
22
11
33
44
55
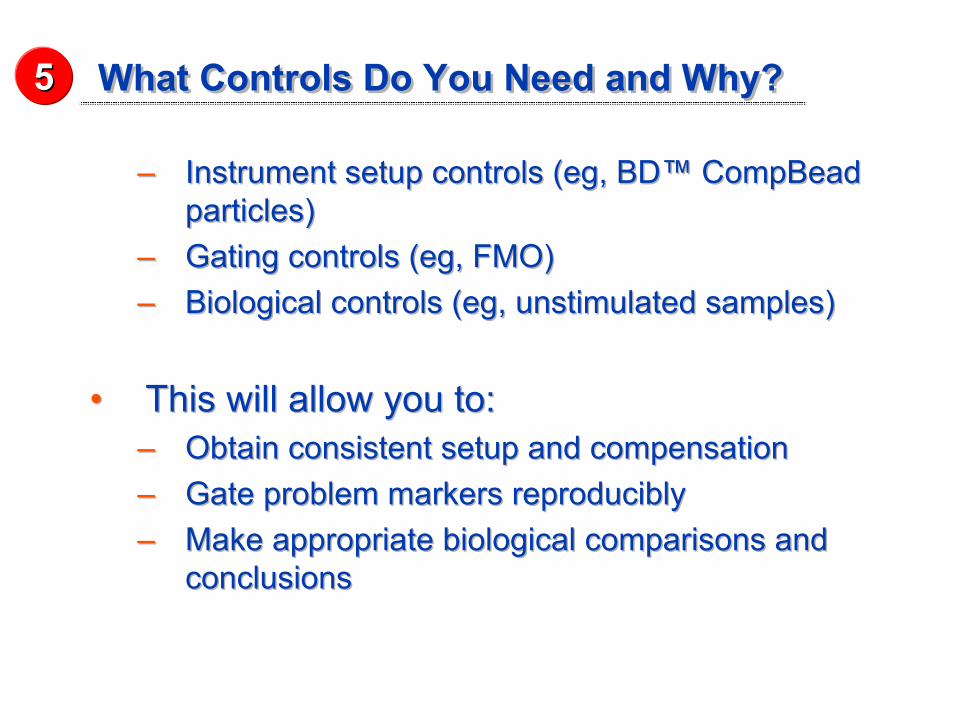
What Controls Do You Need and Why?What Controls Do You Need and Why?
–
Instrument setup controls (eg, BD™
CompBead particles)
–
Gating controls (eg, FMO)–
Biological controls (eg, unstimulated samples)
• This will allow you to:–
Obtain consistent setup and compensation
–
Gate problem markers reproducibly–
Make appropriate biological comparisons and conclusions
–
Instrument setup controls (eg, BD™
CompBead particles)
–
Gating controls (eg, FMO)–
Biological controls (eg, unstimulated samples)
• This will allow you to:–
Obtain consistent setup and compensation
–
Gate problem markers reproducibly–
Make appropriate biological comparisons and conclusions
55
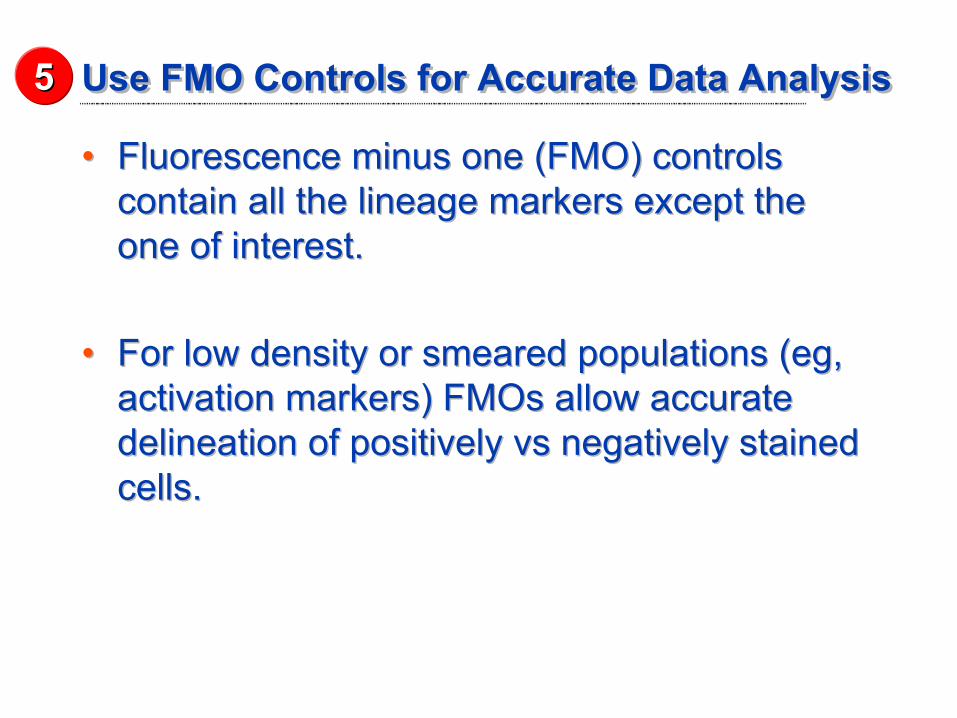
Use FMO Controls for Accurate Data AnalysisUse FMO Controls for Accurate Data Analysis
•
Fluorescence minus one (FMO) controls contain all the lineage markers except the one of interest.
•
For low density or smeared populations (eg, activation markers) FMOs
allow accurate
delineation of positively vs
negatively stained cells.
•
Fluorescence minus one (FMO) controls contain all the lineage markers except the one of interest.
•
For low density or smeared populations (eg, activation markers) FMOs
allow accurate
delineation of positively vs
negatively stained cells.
55
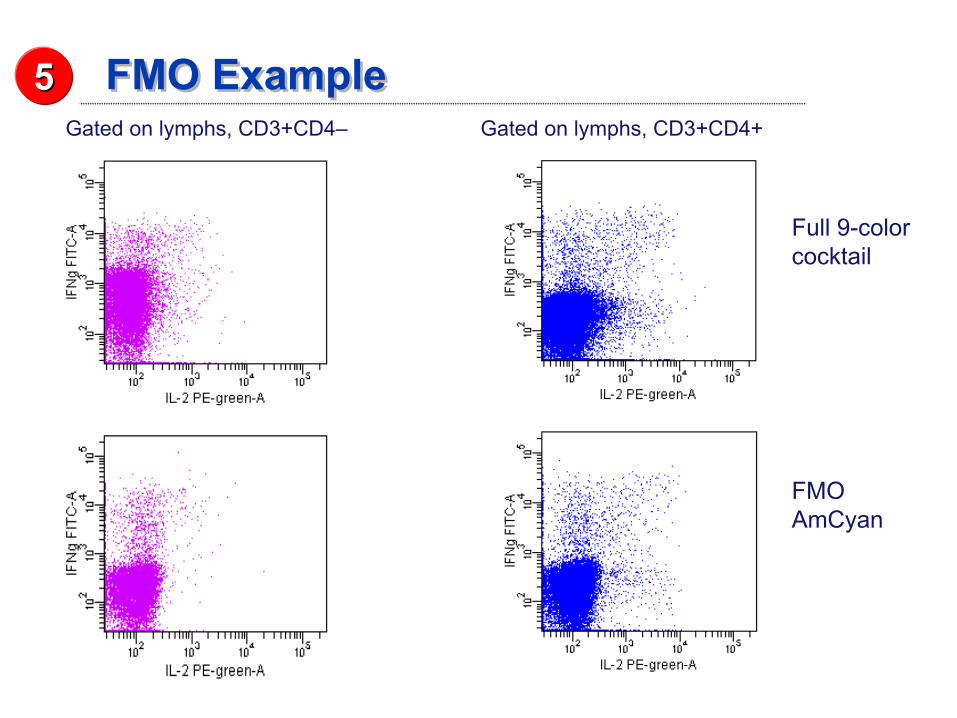
FMO ExampleFMO ExampleGated on lymphs, CD3+CD4– Gated on lymphs, CD3+CD4+
Full 9-color cocktail
FMOAmCyan
55
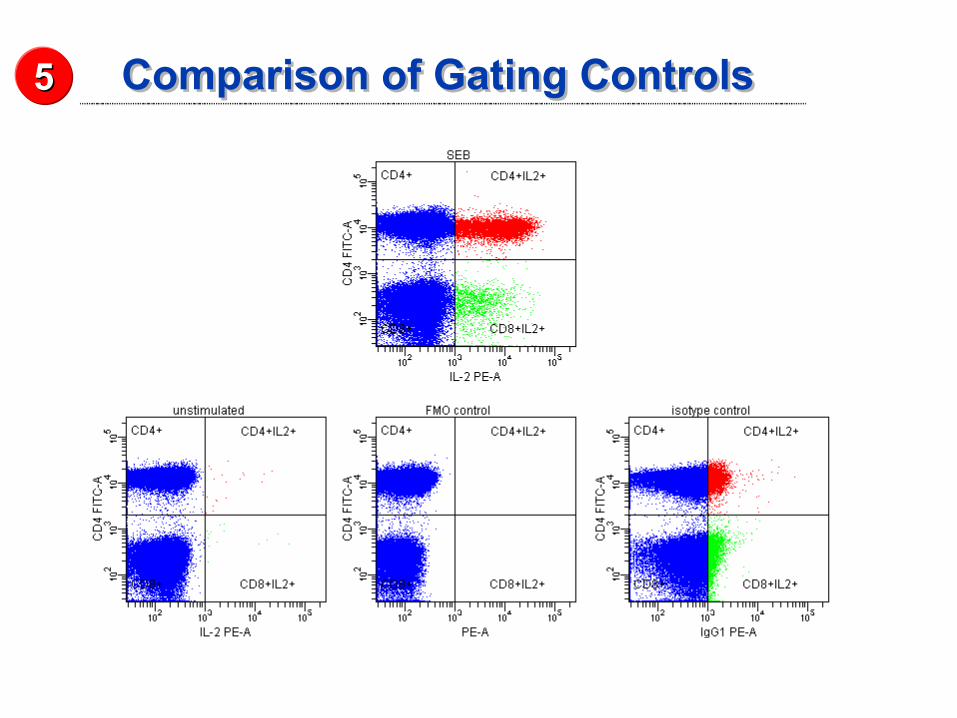
Comparison of Gating ControlsComparison of Gating Controls55
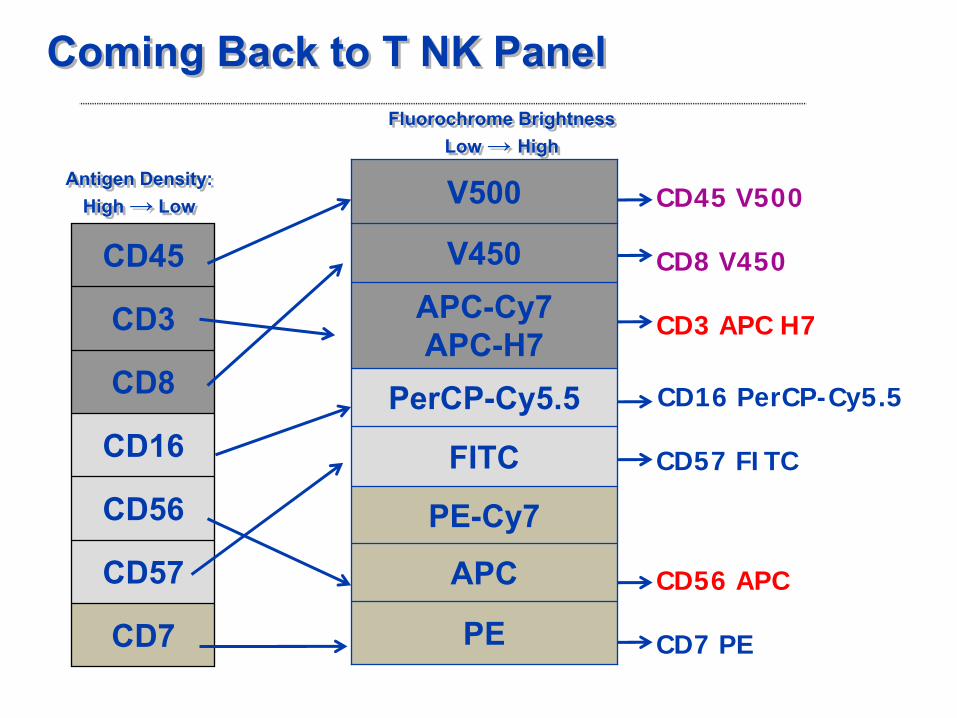
Coming Back to T NK PanelComing Back to T NK Panel
CD45 V500
CD8 V450
CD3 APC H7
CD16 PerCP-Cy5.5
CD57 FITC
CD56 APC
CD7 PE
V500
V450APC-Cy7
APC-H7PerCP-Cy5.5
FITC
PE-Cy7
APC
PE
CD45
CD3
CD8
CD16
CD56
CD57
CD7
Antigen Density:High → Low
Antigen Density:High → Low
Fluorochrome BrightnessLow → High
Fluorochrome BrightnessLow → High
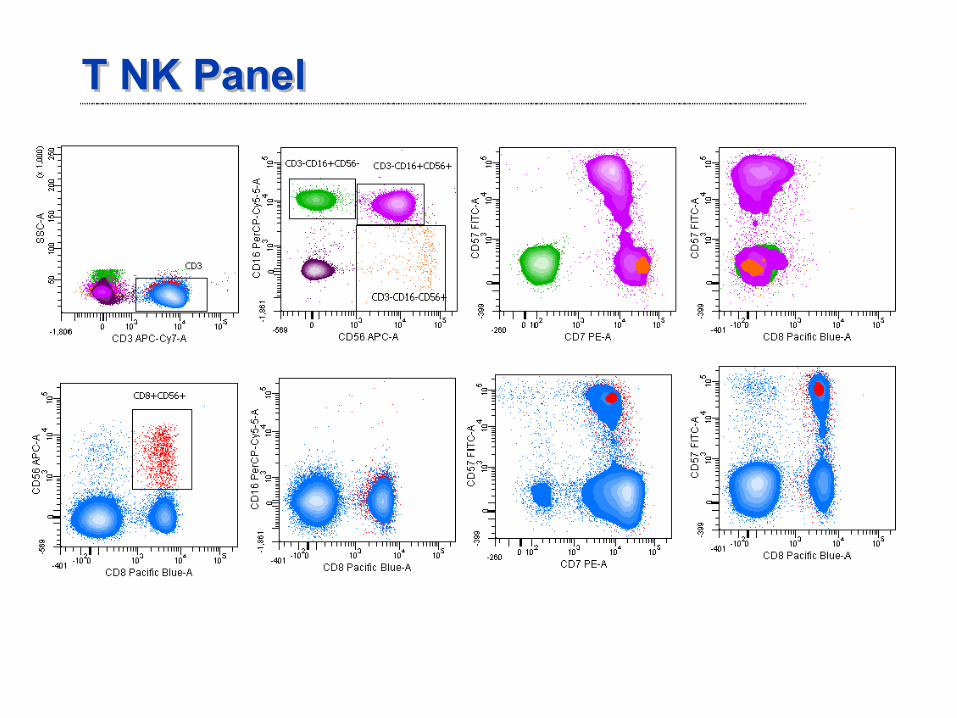
T NK PanelT NK Panel
OverviewOverview
• Multicolor flow –
successful application
prerequisites for immunophenotyping:
A.
Careful reagent selection and sample preparation.
B.
Proper cytometer
performance, setup, and data collection.
C.
Proper classification (analysis) of multiple combinations of positive and negative CD markers.
• Multicolor flow –
successful application
prerequisites for immunophenotyping:
A.
Careful reagent selection and sample preparation.
B.
Proper cytometer
performance, setup, and data collection.
C.
Proper classification (analysis) of multiple combinations of positive and negative CD markers.
Cytometer Performance and Setup
Cytometer Performance and Setup
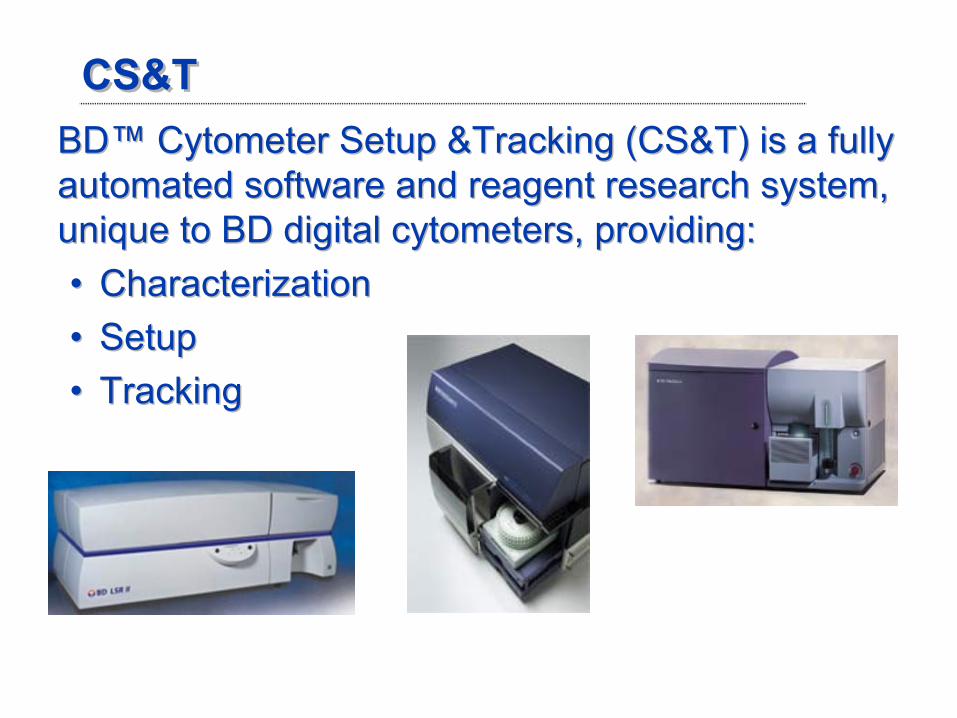
CS&TCS&TBD™
Cytometer Setup &Tracking (CS&T) is a fully
automated software and reagent research system, unique to BD digital cytometers, providing:
•
Characterization• Setup•
Tracking
BD™
Cytometer Setup &Tracking (CS&T) is a fully automated software and reagent research system, unique to BD digital cytometers, providing:•
Characterization
•
Setup•
Tracking
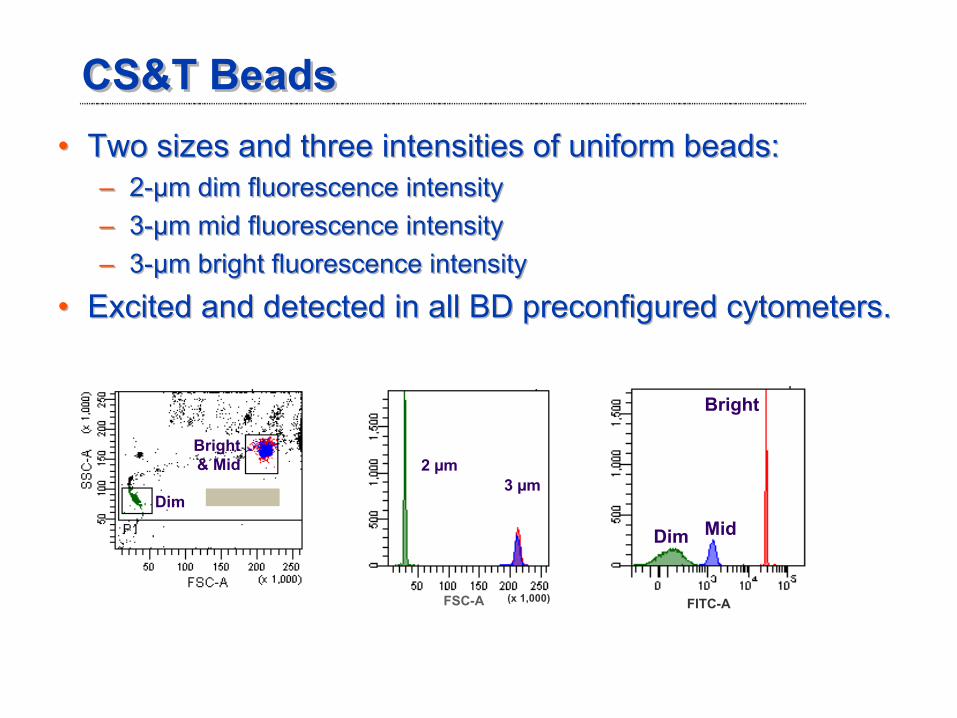
CS&T BeadsCS&T Beads•
Two sizes and three intensities of uniform beads:– 2-μm dim fluorescence intensity– 3-μm mid fluorescence intensity– 3-μm bright fluorescence intensity
•
Excited and detected in all BD preconfigured cytometers.
•
Two sizes and three intensities of uniform beads:–
2-μm dim fluorescence intensity–
3-μm mid fluorescence intensity–
3-μm bright fluorescence intensity
•
Excited and detected in all BD preconfigured cytometers.
Dim
Bright& Mid
3 µm2 µm
Bright
MidDim
FSC-A FITC-A(x 1,000)
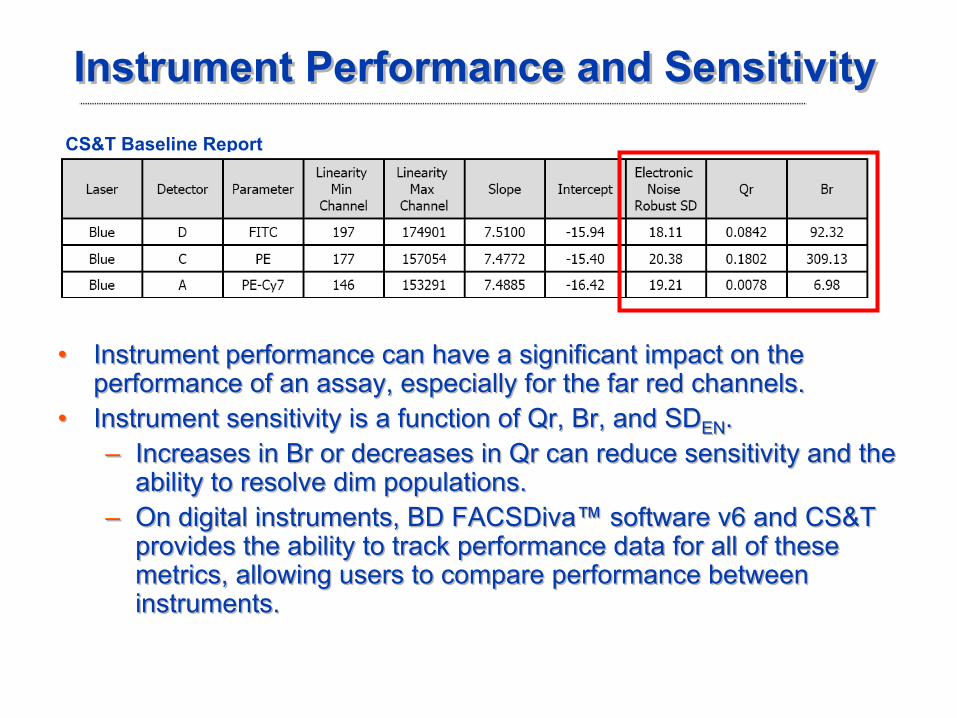
CS&T Baseline Report
Instrument Performance and SensitivityInstrument Performance and Sensitivity
•
Instrument
performance can have a significant impact on the performance of an assay, especially for the far red channels.
•
Instrument sensitivity is a function of Qr, Br, and SDEN
.–
Increases in Br or decreases in Qr can reduce sensitivity and the ability to resolve dim populations.
–
On digital instruments, BD FACSDiva™ software v6 and CS&T provides the ability to track performance data for all of these metrics, allowing users to compare performance between instruments.
•
Instrument
performance can have a significant impact on the performance of an assay, especially for the far red channels.
•
Instrument sensitivity is a function of Qr, Br, and SDEN
.–
Increases in Br or decreases in Qr can reduce sensitivity and the ability to resolve dim populations.
–
On digital instruments, BD FACSDiva™ software v6 and CS&T provides the ability to track performance data for all of these metrics, allowing users to compare performance between instruments.
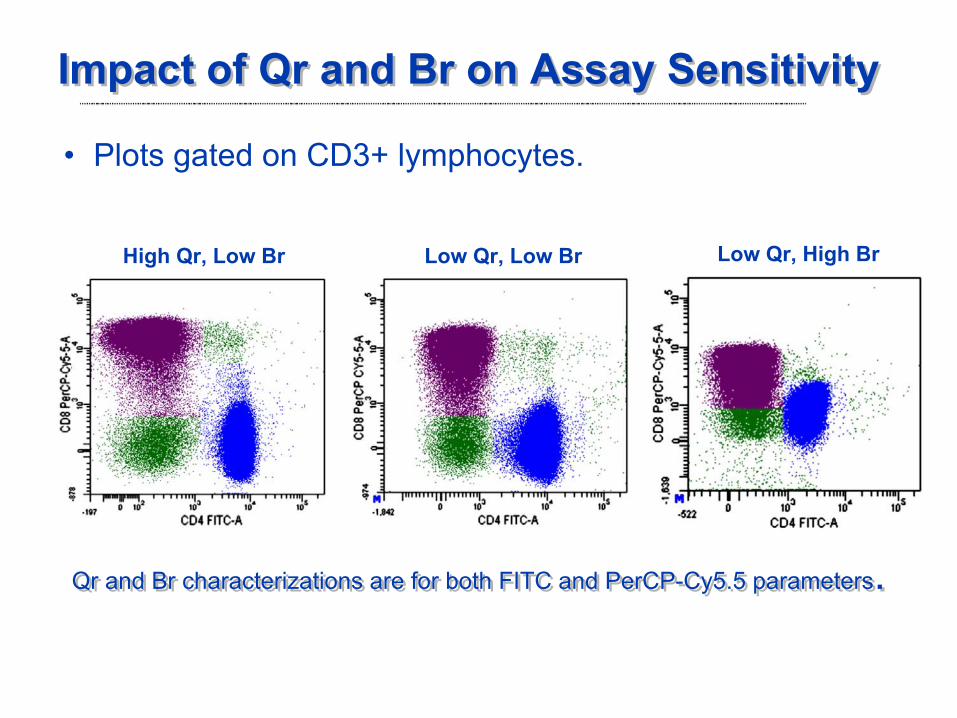
Impact of Qr
and Br on Assay SensitivityImpact of Qr
and Br on Assay Sensitivity
High Qr, Low Br Low Qr, Low Br Low Qr, High Br
•
Plots gated on CD3+ lymphocytes.
Qr
and Br characterizations are for both FITC and PerCP-Cy5.5 parameters
.Qr
and Br characterizations are for both FITC and PerCP-Cy5.5 parameters
.
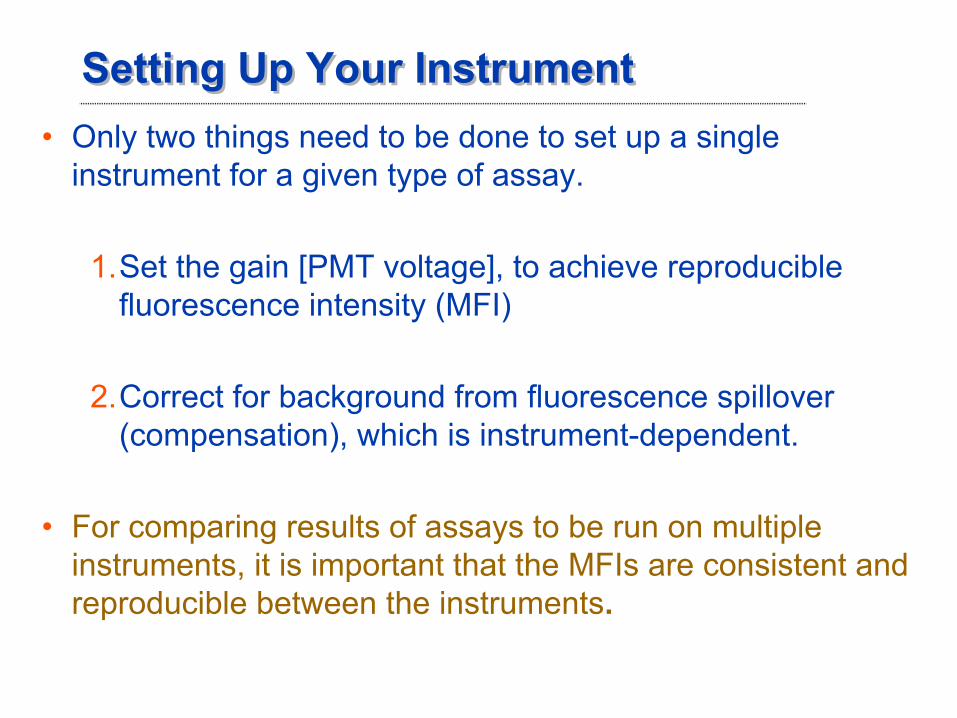
Setting Up Your InstrumentSetting Up Your Instrument•
Only two things need to be done to set up a single instrument for a given type of assay.
1.Set the gain [PMT voltage], to achieve reproducible fluorescence intensity (MFI)
2.Correct for background from fluorescence spillover (compensation), which is instrument-dependent.
•
For comparing results of assays to be run on multiple instruments, it is important that the MFIs are consistent and reproducible between the instruments.
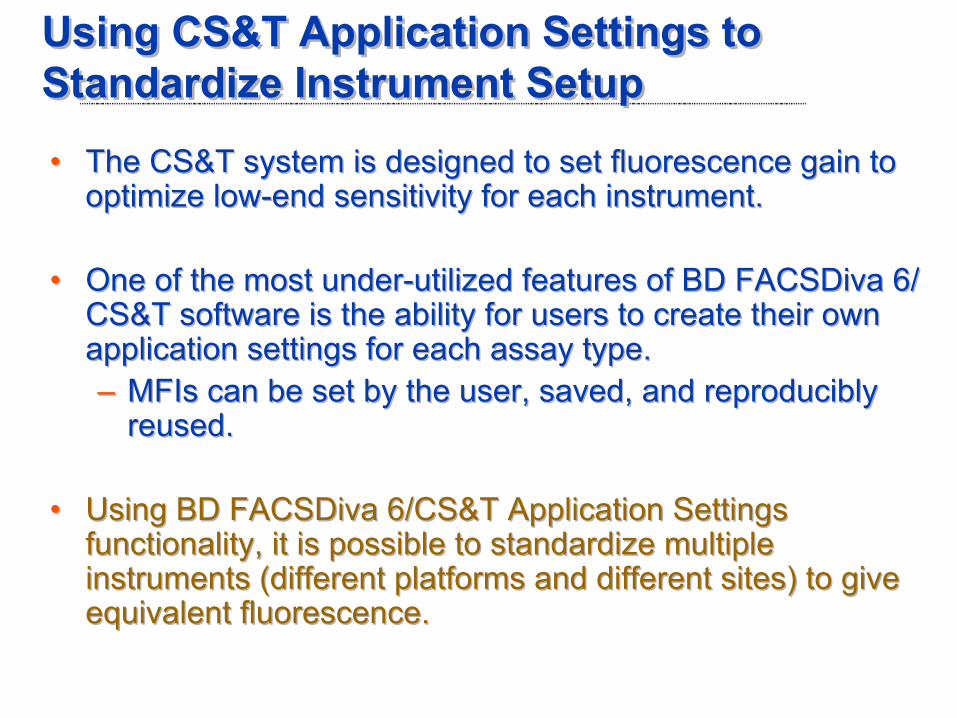
Using CS&T Application Settings to Standardize Instrument Setup
Using CS&T Application Settings to Standardize Instrument Setup
•
The CS&T system is designed to set fluorescence gain to optimize low-end sensitivity for each instrument.
•
One of the most under-utilized features of BD FACSDiva 6/ CS&T software is the ability for users to create their own application settings for each assay type.
–
MFIs can be set by the user, saved, and reproducibly reused.
•
Using BD FACSDiva 6/CS&T Application Settings functionality, it is possible to standardize multiple instruments (different platforms and different sites) to give equivalent fluorescence.
•
The CS&T system is designed to set fluorescence gain to optimize low-end sensitivity for each instrument.
•
One of the most under-utilized features of BD FACSDiva 6/ CS&T software is the ability for users to create their own application settings for each assay type.–
MFIs can be set by the user, saved, and reproducibly reused.
•
Using BD FACSDiva 6/CS&T Application Settings functionality, it is possible to standardize multiple instruments (different platforms and different sites) to give equivalent fluorescence.
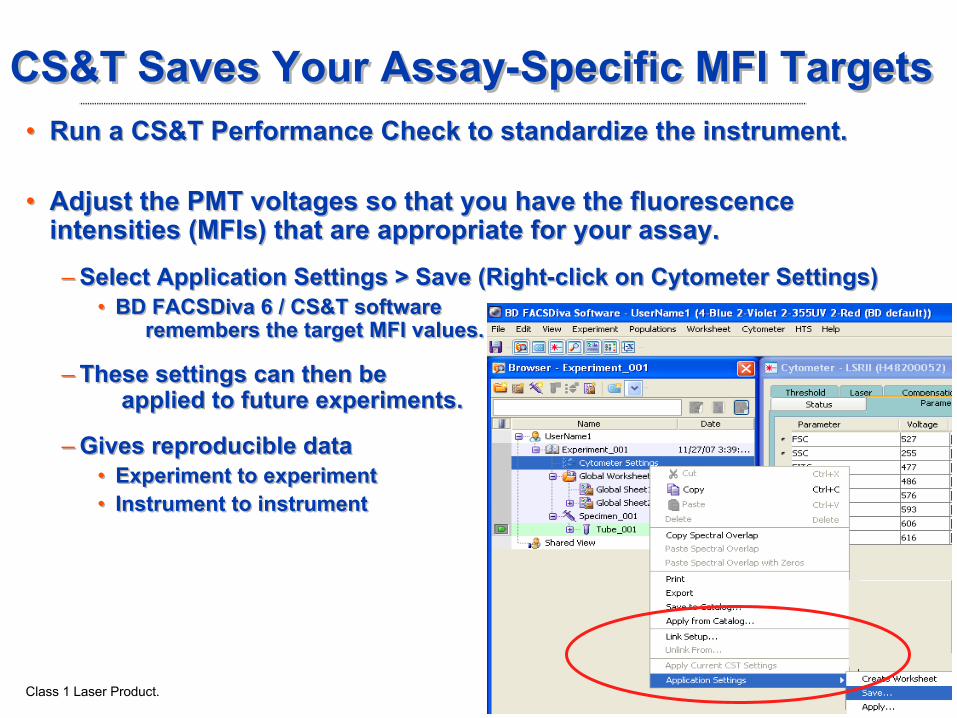
CS&T Saves Your Assay-Specific MFI TargetsCS&T Saves Your Assay-Specific MFI Targets•
Run a CS&T Performance Check to standardize the instrument.
•
Adjust the PMT voltages so that you have the fluorescence intensities (MFIs) that are appropriate for your assay.
–
Select Application Settings > Save (Right-click on Cytometer Settings)•
BD FACSDiva 6 / CS&T software remembers the target MFI values.
–
These settings can then be applied to future experiments.
–
Gives reproducible data•
Experiment to experiment •
Instrument to instrument
•
Run a CS&T Performance Check to standardize the instrument.
•
Adjust the PMT voltages so that you have the fluorescence intensities (MFIs) that are appropriate for your assay.–
Select Application Settings > Save (Right-click on Cytometer Settings)•
BD FACSDiva 6 / CS&T software remembers the target MFI values.
–
These settings can then be applied to future experiments.
–
Gives reproducible data•
Experiment to experiment •
Instrument to instrument
Class 1 Laser Product.
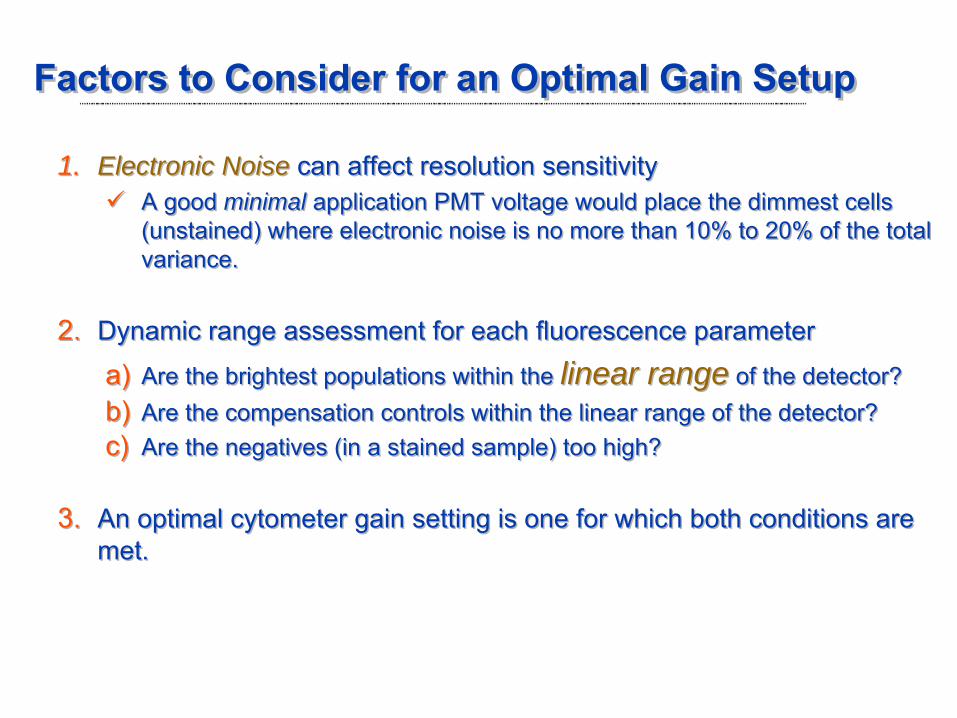
1. Electronic Noise can affect resolution sensitivityA good minimal application PMT voltage would place the dimmest cells (unstained) where electronic noise is no more than 10% to 20% of the total variance.
2.
Dynamic range assessment for each fluorescence parameter
a)
Are the brightest populations within the linear range of the detector?b)
Are the compensation controls within the linear range of the detector?c)
Are the negatives (in a stained sample) too high?
3.
An optimal cytometer
gain setting is one for which both conditions are met.
Factors to Consider for an Optimal Gain SetupFactors to Consider for an Optimal Gain Setup
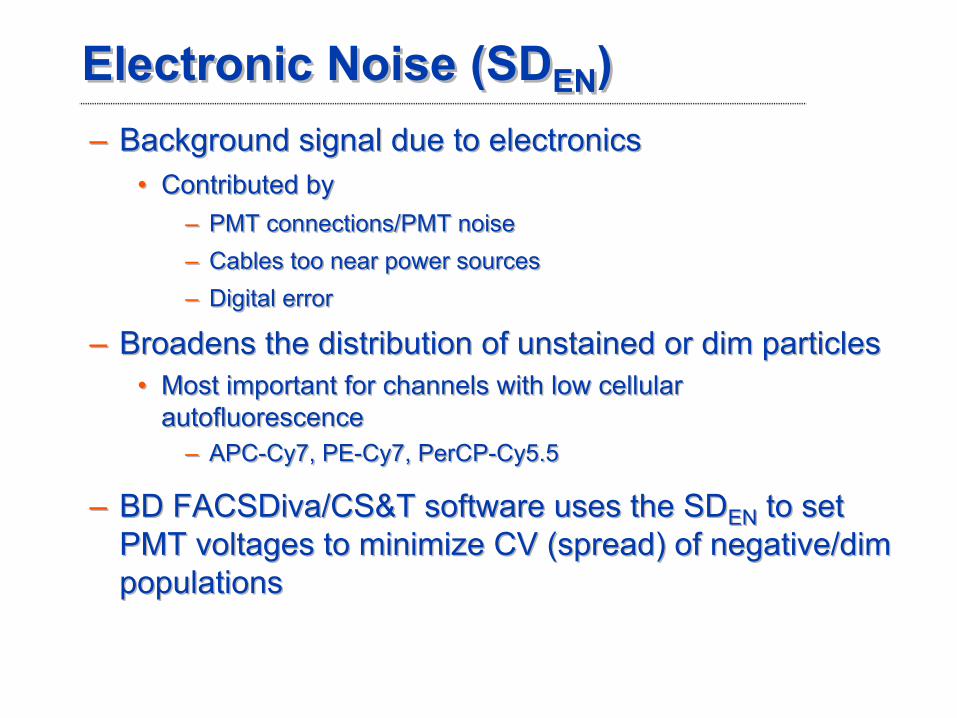
Electronic Noise (SDEN
)Electronic Noise (SDEN
)–
Background signal due to electronics
•
Contributed by–
PMT connections/PMT noise–
Cables too near power sources–
Digital error
–
Broadens the distribution of unstained or dim particles•
Most important for channels with low cellular autofluorescence
–
APC-Cy7, PE-Cy7, PerCP-Cy5.5
–
BD FACSDiva/CS&T software uses the SDEN
to set PMT voltages to minimize CV (spread) of negative/dim populations
–
Background signal due to electronics•
Contributed by–
PMT connections/PMT noise–
Cables too near power sources–
Digital error
–
Broadens the distribution of unstained or dim particles•
Most important for channels with low cellular autofluorescence
–
APC-Cy7, PE-Cy7, PerCP-Cy5.5
–
BD FACSDiva/CS&T software uses the SDEN
to set PMT voltages to minimize CV (spread) of negative/dim populations
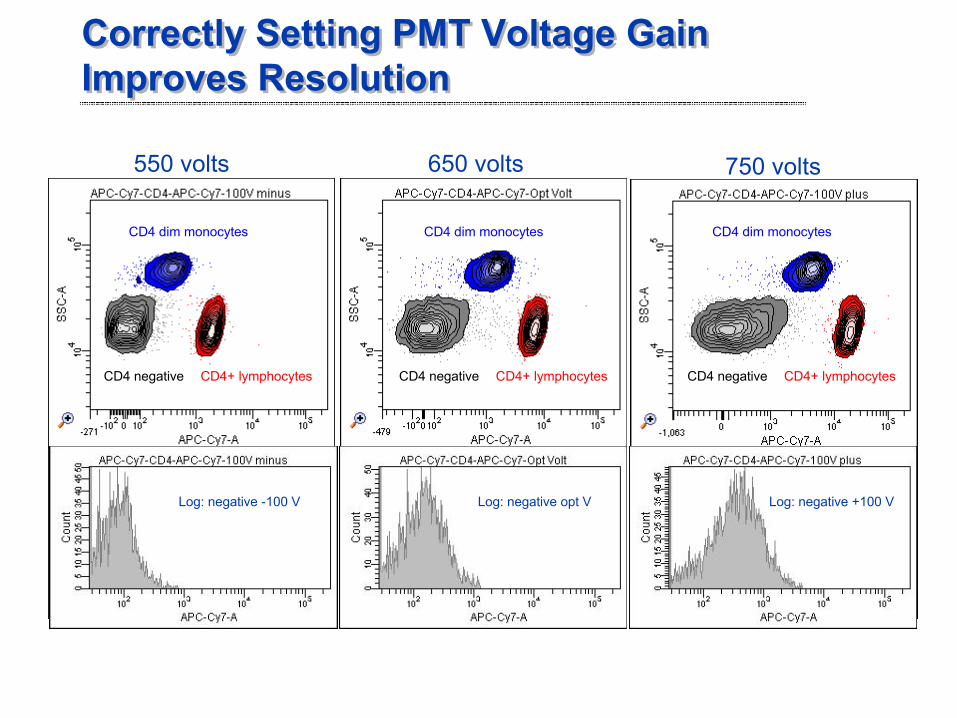
550 volts 650 volts 750 volts
CD4 dim monocytes
CD4+ lymphocytesCD4 negative
CD4 dim monocytes
CD4+ lymphocytesCD4 negative
CD4 dim monocytes
CD4+ lymphocytesCD4 negative
Log: negative -100 V Log: negative opt V Log: negative +100 V
Correctly Setting PMT Voltage Gain Improves Resolution
Correctly Setting PMT Voltage Gain Improves Resolution
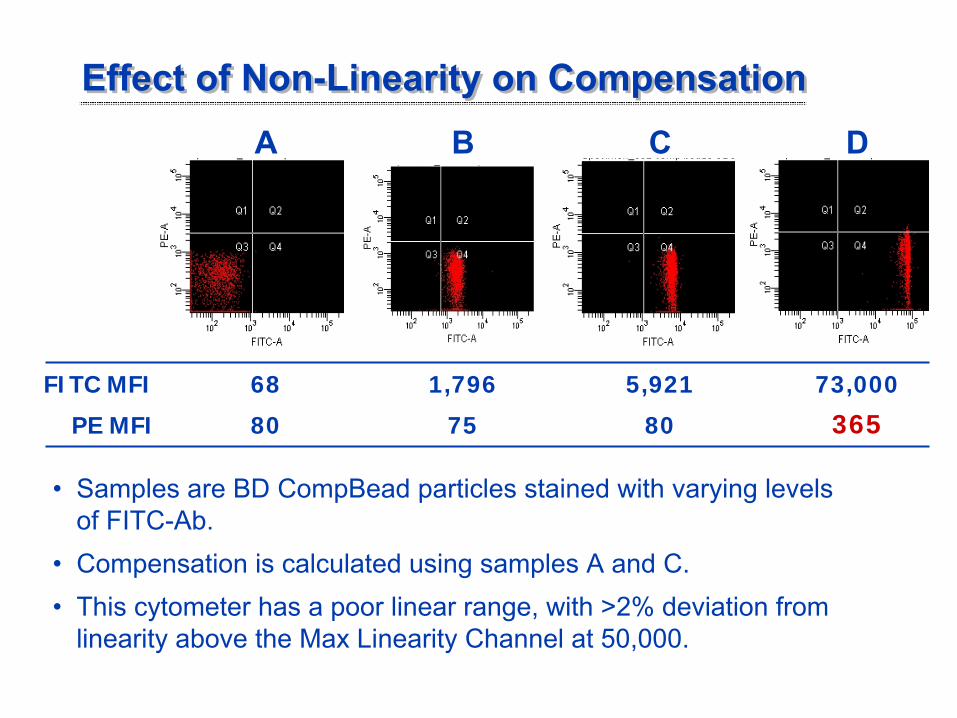
Effect of Non-Linearity on CompensationEffect of Non-Linearity on Compensation
FITC MFI
PE MFI
1,796
75
68
80
5,921
80
73,000
365
DBA C
•
Samples are BD
CompBead particles stained with varying levels of FITC-Ab.
•
Compensation is calculated using samples A and C.•
This cytometer
has a poor linear range, with >2% deviation from linearity above the Max Linearity Channel at 50,000.
ConclusionsConclusions•
Multiple tools available from BD for reagent selection (BD FACSelect™
Multicolor Panel Designer,
Fluorescence Spectrum Viewer, TDS).
•
CS&T is a unique system for instrument characterization, setup, and monitoring.
•
Application settings are a powerful tool that enhances data quality (sensitivity) and reproducibility.
•
Reproducible setup across instruments is a reality.
•
Data sets are more predictable and therefore more amenable for automated data analysis.
•
Multiple tools available from BD for reagent selection (BD FACSelect™
Multicolor Panel Designer,
Fluorescence Spectrum Viewer, TDS).
•
CS&T is a unique system for instrument characterization, setup, and monitoring.
•
Application settings are a powerful tool that enhances data quality (sensitivity) and reproducibility.
•
Reproducible setup across instruments is a reality.
•
Data sets are more predictable and therefore more amenable for automated data analysis.
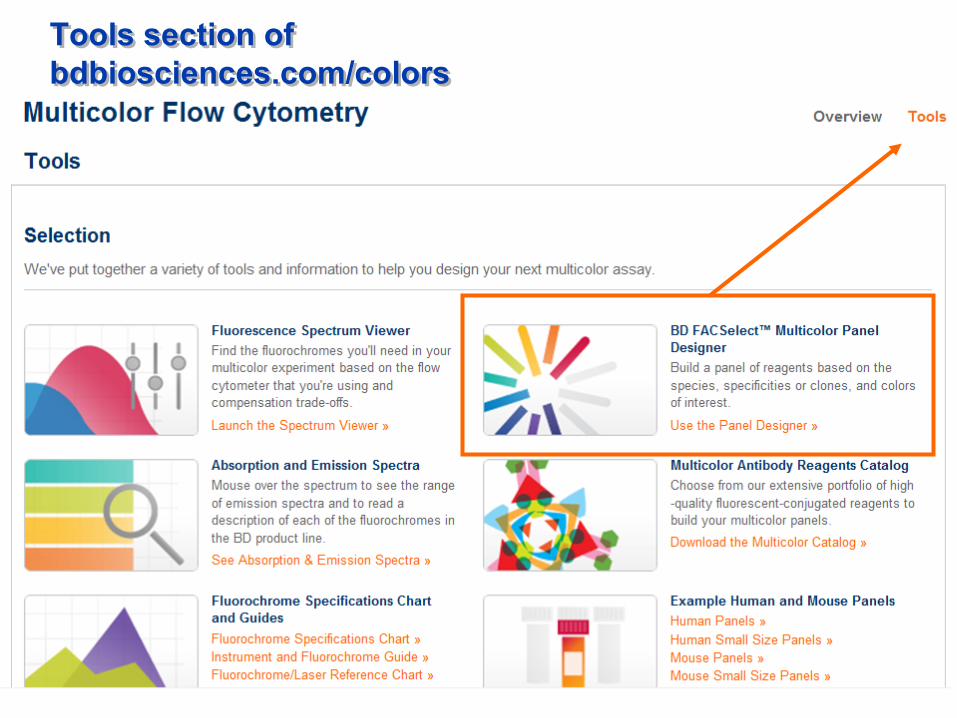
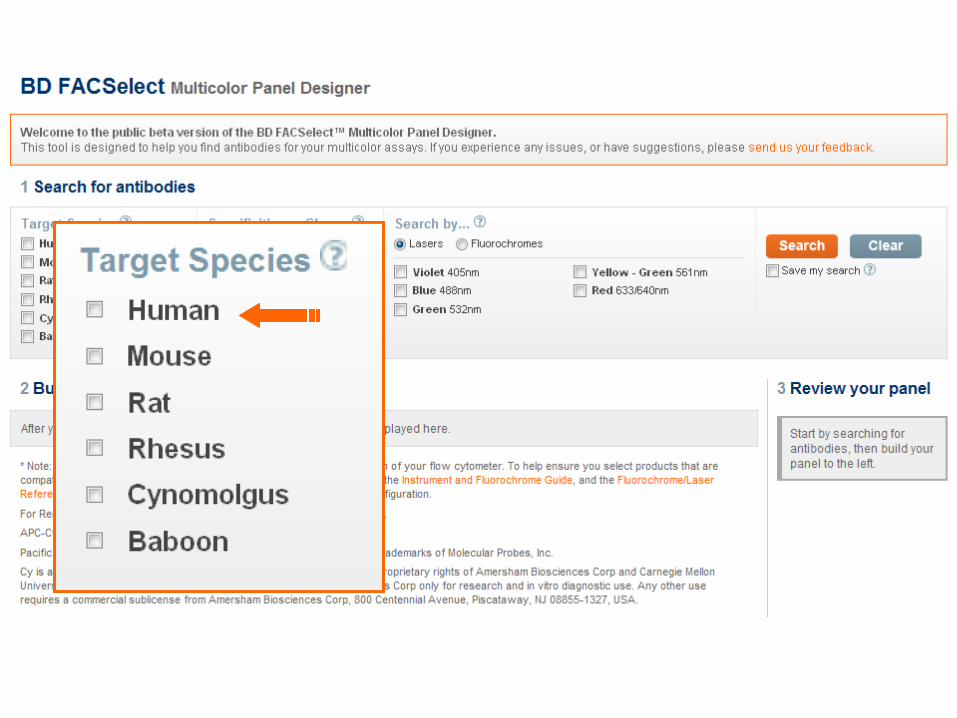
Tools section of bdbiosciences.com/colors
Tools section of bdbiosciences.com/colors
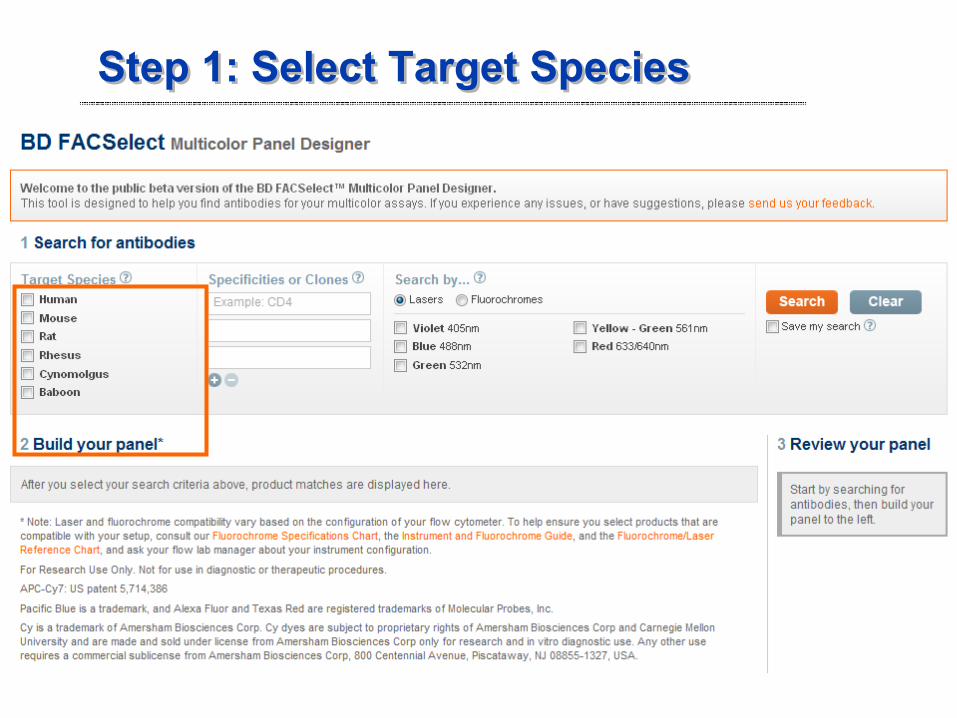
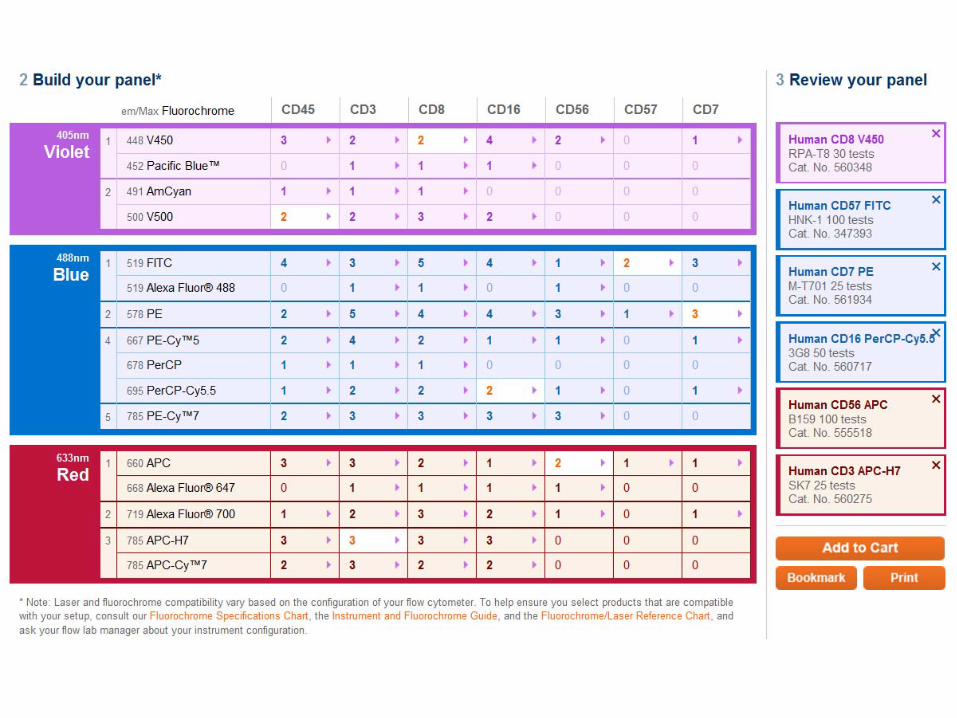
Step 1: Select Target SpeciesStep 1: Select Target Species
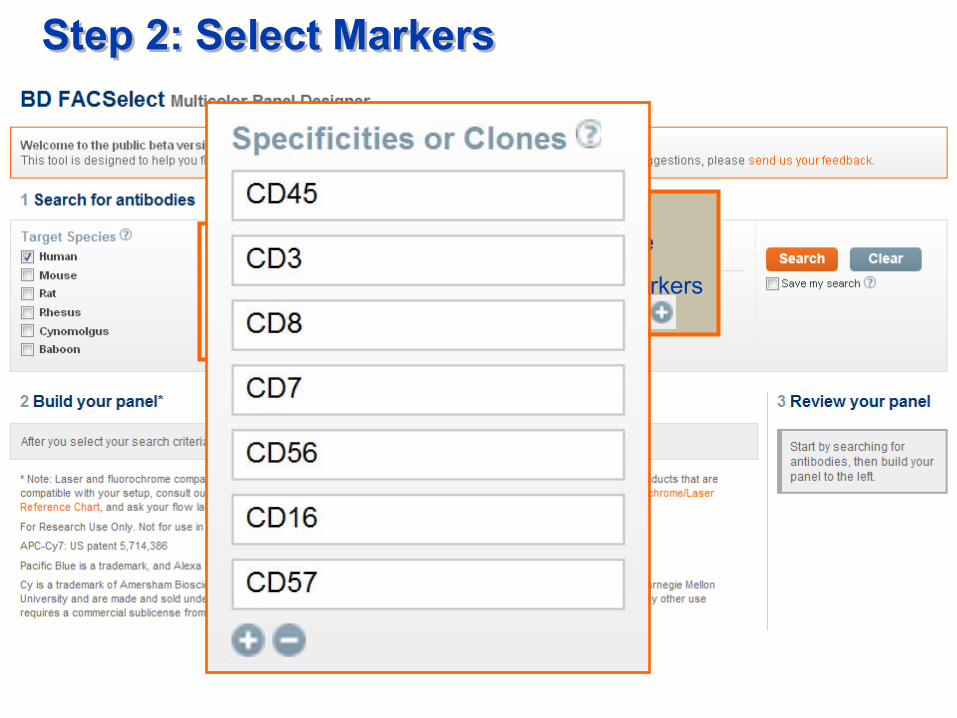
List markers by specificity or clone
Add additional markers by clicking on the
Step 2: Select MarkersStep 2: Select Markers
AcknowledgementsAcknowledgements
•
Mark Edinger• Ming Yan•
Alan Stall
•
Joe Trotter•
Skip Maino
•
Margaret Inokuma•
Bob Hoffman
•
Mark Edinger•
Ming Yan
•
Alan Stall•
Joe Trotter
•
Skip Maino•
Margaret Inokuma
•
Bob Hoffman
•
Pat Collins•
Joerg
Hildmann
•
Holden Maecker•
Mirion
Schultz
•
Barny
Abrams•
Laurel Nomura
•
Dennis Sasaki
•
Pat Collins•
Joerg
Hildmann
•
Holden Maecker•
Mirion
Schultz
•
Barny
Abrams•
Laurel Nomura
•
Dennis Sasaki
For Research Use Only. Not for use in diagnostic or therapeutic procedures.
Alexa
Fluor®, Texas Red®, and Qdot®
are registered trademarks,
and Pacific Blue™
is a trademark of Molecular Probes, Inc.
Cy™
is a trademark of Amersham Biosciences Corp. Cy dyes are subject to proprietary rights of Amersham Biosciences Corp and Carnegie Mellon University and are
made and sold under license from Amersham Biosciences Corp only for research and in vitro diagnostic use. Any other use requires a commercial sublicense from Amersham Biosciences Corp,
800 Centennial Avenue, Piscataway, NJ 08855-1327, USA.
BD, BD Logo and all other trademarks are property of Becton, Dickinson and Company. ©
2011 BD
For More Information….For More Information….
If you have further questions:
Contact Technical Service (US) at: 877-232-8995, Prompt 3, 2
or email: [email protected]
Please visit our multicolor resource site at: bdbiosciences.com/colors