Multi-wavelength variability and quasi-periodic ...
40
Multi-wavelength variability and quasi-periodic oscillations in Blazars Alok C. Gupta, ARIES, India [email protected] , [email protected] ARIES, Nainital, India
Transcript of Multi-wavelength variability and quasi-periodic ...
Multi-wavelength variability and quasi-periodic oscillations in
Blazars
Alok C. Gupta, ARIES, India
[email protected], [email protected]
ARIES, Nainital, India
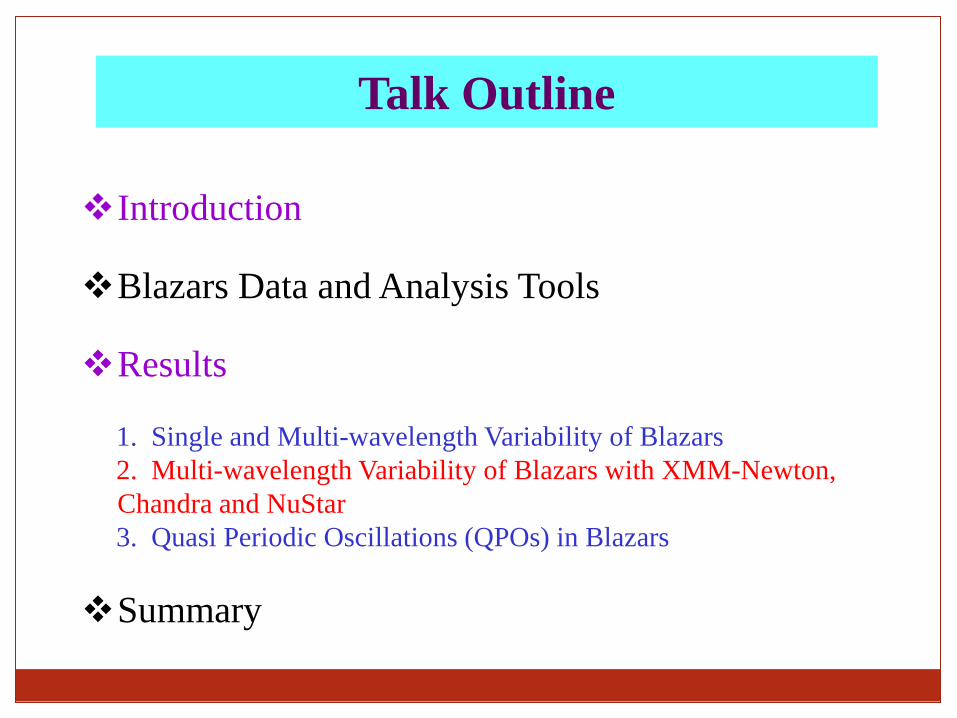
Talk Outline
Introduction
Blazars Data and Analysis Tools
Results
1. Single and Multi-wavelength Variability of Blazars
2. Multi-wavelength Variability of Blazars with XMM-Newton,
Chandra and NuStar
3. Quasi Periodic Oscillations (QPOs) in Blazars
Summary
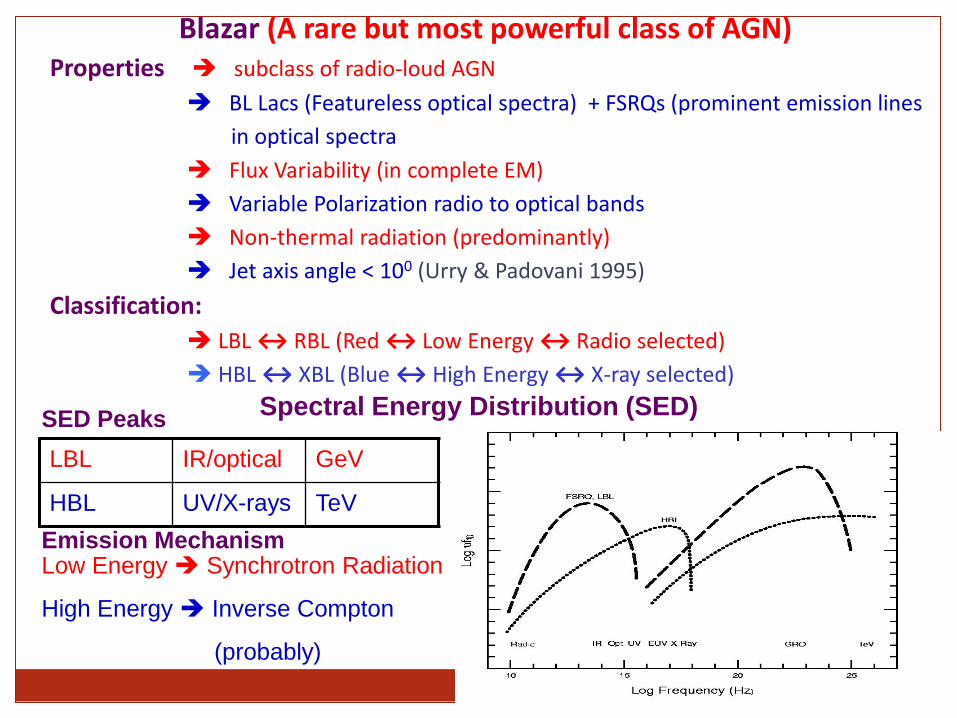
Blazar (A rare but most powerful class of AGN) Properties subclass of radio-loud AGN
BL Lacs (Featureless optical spectra) + FSRQs (prominent emission lines
in optical spectra
Flux Variability (in complete EM)
Variable Polarization radio to optical bands
Non-thermal radiation (predominantly)
Jet axis angle < 100 (Urry & Padovani 1995)
Classification:
LBL ↔ RBL (Red ↔ Low Energy ↔ Radio selected)
HBL ↔ XBL (Blue ↔ High Energy ↔ X-ray selected)
Spectral Energy Distribution (SED)
LBL IR/optical GeV
HBL UV/X-rays TeV
SED Peaks
Emission Mechanism Low Energy Synchrotron Radiation
High Energy Inverse Compton
(probably)

Low energy part of SED well
understood
1. Non-thermal Radiation in High
State
2. Thermal + Non-thermal Radiation
in Low State
High Energy Part of SED is not well
understood. It is usually explained
as arising from inverse-Compton
(IC) scattering of the same electrons
producing the synchrotron emission.
These electrons interacts with
1. synchrotron photons SSC
2. External photons originating in
the local environment EC
Alternative Hadronic Models where
Gamma-rays are produced by high
energy proton either via proton
synchrotron radiation or via secondary
emission from photo-pion and photo-
pair-production
A lot of challenges to understand high energy part of SED of BLAZARS
which can be better understood with multi-wavelength facilities.
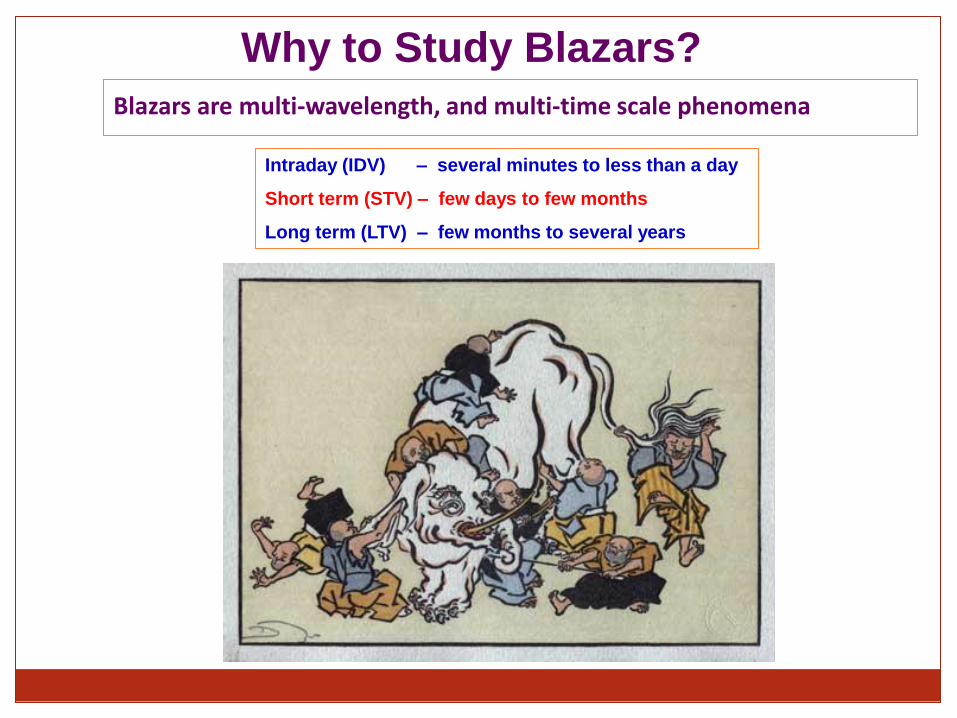
Why to Study Blazars?
Blazars are multi-wavelength, and multi-time scale phenomena
Intraday (IDV) – several minutes to less than a day
Short term (STV) – few days to few months
Long term (LTV) – few months to several years

What are the sources of Variability?
Intrinsic
Shock fronts in the jets (IDV and STV)
Instabilities or hot spots on the accretion disk (variability in the Low-state) (IDV and STV)
Binary Black Hole Model (LTV)
Extrinsic
Gravitational Micro-lensing (IDV)
It is due to interstellar scintillation (RISS or DISS) and only relevant in low-frequency radio observations. In interstellar scintillation, observed variability crosses the brightness temperature limit 1012 K (Compton Catastrophe limit)

Properties Time Scale Physical Implications
Irregular & Non-periodic Few minutes to less than
a day (micro or intra-night
or intra-day) (IDV)
Size of emitting region,
BH mass estimation
Irregular & Non Periodic One Day to several
weeks
(short term) (STV)
Useful to search for color
variations
Quasi-Periodic Few months to several
years (long term) (LTV)
Useful to predict next
Outburst Time, Search for
time lag in different
energy bands.
Blazar Variability Properties, Time Scales and Physical Implications
Simultaneous multi-wavelength observations of a particular blazar is extremely useful to understand the emission mechanism of blazars and emitting regions in different energy bands.
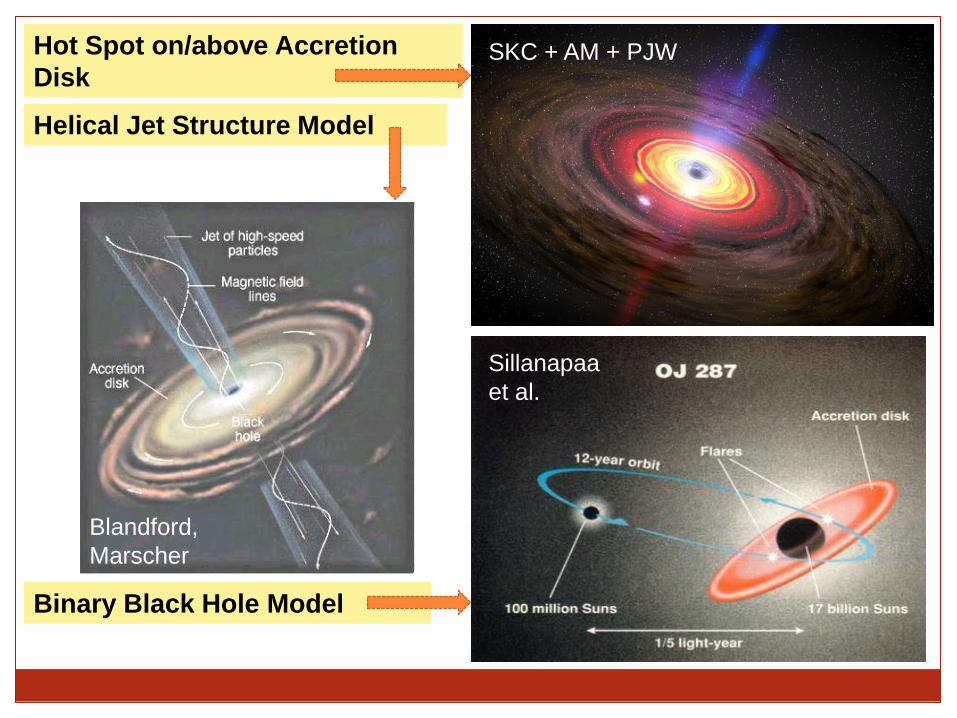
Hot Spot on/above Accretion
Disk
Helical Jet Structure Model
Binary Black Hole Model
SKC + AM + PJW
Blandford,
Marscher
Sillanapaa
et al.

Project 1.
Single and Multi-wavelength Variability of
Blazars

No IDV detection in the blazars due to uniform jet emission.
IDVs in LBLs
Gupta et al. 2008, AJ, 135, 1384
Detected variability in flux measurement on IDV timescales are due to
irregularities in jet flow

IDV timescale is used to get the upper limit of M_BH for S5 0716+714. We got
1.74 * 10^8 M_sun.
Agarwal, Gupta et al. 2016, MNRAS, 455, 680

S5 0716+714
On IDV timescale, we found optical bands are well correlated with zero lag. It
gives evidence of co-spatial origin of emission in all optical bands.
Agarwal, Gupta, et al. 2016, MNRAS, 455, 680

Observations are
carried out during
September 2015 –
May 2016 by using
9 optical telescopes
world wide.
We detected IDV,
STV and color
variation on STV
timescales.
We also detected
multiple flaring
events in our
observations.
Gupta et al. 2017, MNRAS, 465, 4423
STV in LBLs

Optical LTV Results: We noticed large amplitude optical LTV in flux in
almost in all blazars, we observed.
3C 454.3 3C 279
Agarwal, Gupta et al. 2016, MNRAS, 455, 680
In general BL Lac objects show BWB while FSRQs show RWB trend on STV and
LTV timescales. It gives a signature of thermal emission from accretion disk in
addition to non-thermal jet emission.

Simultaneous multi-wavelength observations
of 0716+714 during Dec 11-15, 2009 (core
campaign period).
IDV detected in radio and optical bands.
Total change in optical bands ~ 0.8 mag.
Correlated variability is found in different
optical bands.
2.8 cm band data leads 6 and 11 cm bands.
SED was constructed with non simultaneous
Fermi data and we got Doppler factor ≥ 12 –
26 which is relatively high for a BL Lac.
Gupta et al. 2012, MNRAS, 425, 1357

In the blazar 3C 454.3, we got strong
optical and Gamma-ray correlations
with time lag of ~ 4 days (gamma-ray
leading optical).
Gaur, Gupta & Wiita, 2012a, AJ, 143, 23
99.9% significance level by using
MC simulation.
External Compton emission mechanism can explain the findings.
3C 454.3

Gaur, Gupta, et al. 2014, ApJ Letters, 781, L4
Anti-correlated optical flux and polarization is unique result and possibly detected for the
first time in BL Lacertae.
Optical Flux and Polarization Observations of BL Lacertae during 2008 - 2010
The result is consistent with a model with at least two emission
regions being present, with the more variable component
having a polarization direction nearly perpendicular to that of
the relatively quiescent region so that a rising flux can produce
a decline degree of polarization.
We used the more generalized recent model by Larionov et al.
(2013), where small variation in Lorentz factor by keeping
other parameters e.g. viewing angle, evolution of outburst,
spectral index, shock plasma compression ratio, etc. as fixed
may show variety of variation in flux and polarization.
Gaur, Gupta, et al. 2014, ApJ Letters, 781, L4

Project 2.
Multi-wavelength Variability of Blazars
with XMM-Newton, Chandra and NuStar
• Stable Flux
• Decline Flux
• QPO
• Flare

Evidence of jet and accretion disk based models
Bhagwan, Gupta, Papadakis, Wiita, 2017
• In sub-segments: 1(a) flux is stable; 1(b) & 3(a) flux decreases; 1(c) & 3(b) show flux
rising trend.
• In sub-segment: (2) a hint of weak QPO is detected (Gaur, Gupta, et al. 2010, ApJ).
• The percentage variability of segment 1-3 in 0.3 – 10 keV band are 6.6±0.16, 1.5±0.22 and
21±0.15, respectively.
PKS 2155-304 • Stable Flux
(1a)
• Decline Flux
(1b, 3a)
• QPO
(2)
• Flare
(1c, 3b)

X-ray Variability of the Blazar PKS 2155-304 on IDV Timescale
Evidence of jet and accretion disk based models
Gaur, Gupta, Lachowicz, Wiita, 2010, ApJ, 718, 279
• Out of 14 LCs, only 7 have shown IDV timescales in the range of 15.7 to 41.4 ks.
• On 6 occasions, IDV timescale is longer than the data length.
• Hint of QPO (possible period ~ 5.9 ks) on one occasion.
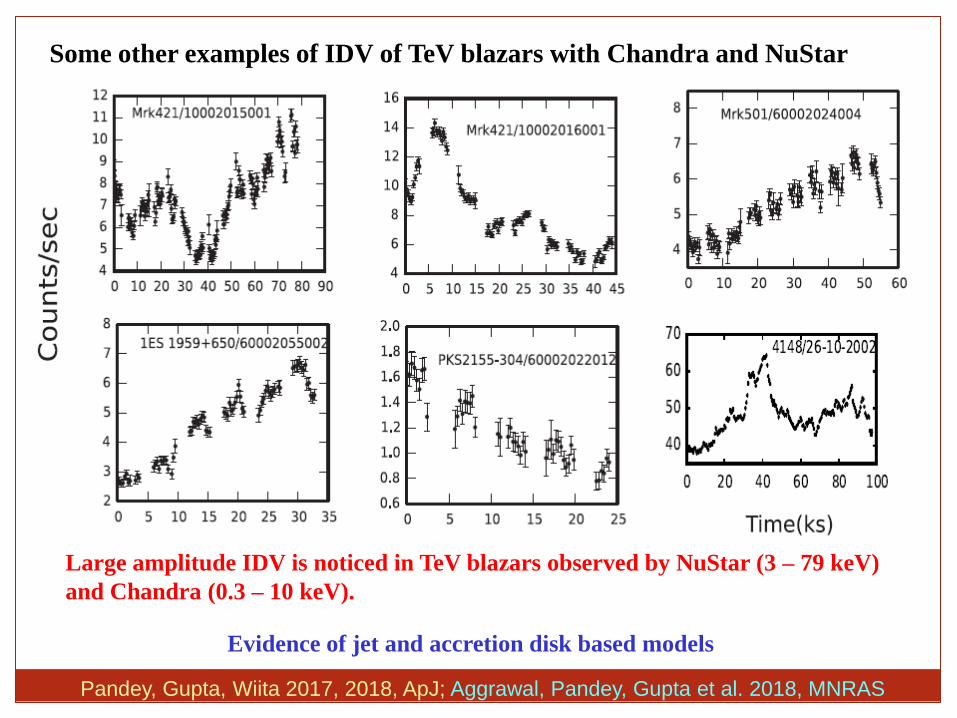
Some other examples of IDV of TeV blazars with Chandra and NuStar
Evidence of jet and accretion disk based models
Large amplitude IDV is noticed in TeV blazars observed by NuStar (3 – 79 keV)
and Chandra (0.3 – 10 keV).
Pandey, Gupta, Wiita 2017, 2018, ApJ; Aggrawal, Pandey, Gupta et al. 2018, MNRAS

• In soft (3 – 10 keV) vs hard (10 – 79 keV) using NuStar and soft (0.3 – 2.0
keV and hard (2 – 10 keV) using Chandra, we noticed spectra harden with
increasing flux evidence for harder when brighter.
• Soft and hard light curves in NuStar and Chandra are well correlated with
zero lag co spatial emission region by same population of leptons.
Pandey, Gupta, Wiita 2017, 2018, ApJ; Aggrawal, Pandey, Gupta et al. 2018, MNRAS

Intra-day Variability Timescales of TeV Blazars using NuStar and Chandra
Using intra-day variability timescales, we calculated following parameters of blazars
Similar results we found for the Blazar Mrk 421 using Chandra data
Pandey et al. 2017, 2018, ApJ; Aggrawal et al. 2018, MNRAS

Double outburst in Mrk 421 on STV timescale using NuStar
Strong double X-ray
outburst is explained
by jet – in – jet model
Pandey, Gupta & Wiita, 2017, ApJ, 841, 123
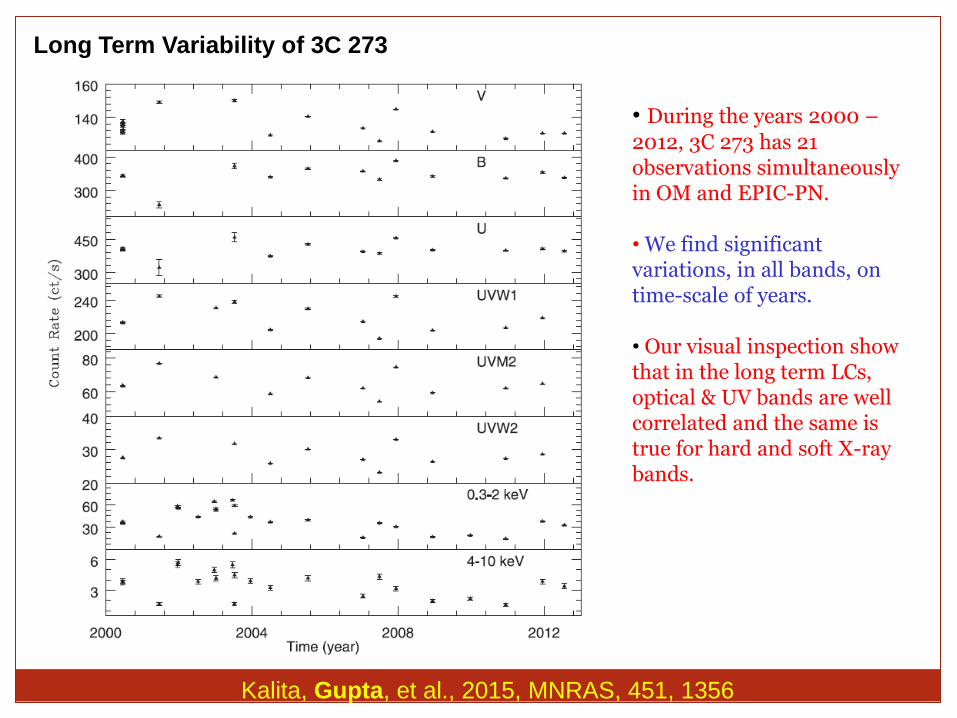
• During the years 2000 –
2012, 3C 273 has 21 observations simultaneously in OM and EPIC-PN. • We find significant variations, in all bands, on time-scale of years. • Our visual inspection show that in the long term LCs, optical & UV bands are well correlated and the same is true for hard and soft X-ray bands.
Kalita, Gupta, et al., 2015, MNRAS, 451, 1356
Long Term Variability of 3C 273

Flux Variations in Optical/UV are not correlated with X-rays. But optical/UV bands are well correlated, similarly soft and hard X-ray bands are well correlated Optical/UV emissions in this blazar may arise from same population of leptons. But X-ray emission is due to a different population of leptons.
Kalita, Gupta, et al., 2015, MNRAS, 451, 1356

In the above HR vs Flux plots, we found clockwise and anti-clockwise loop on
different epochs both synchrotron cooling as well as particle acceleration
are at work on different epochs of observations.
Kalita, Gupta, et al., 2015, MNRAS, 451, 1356
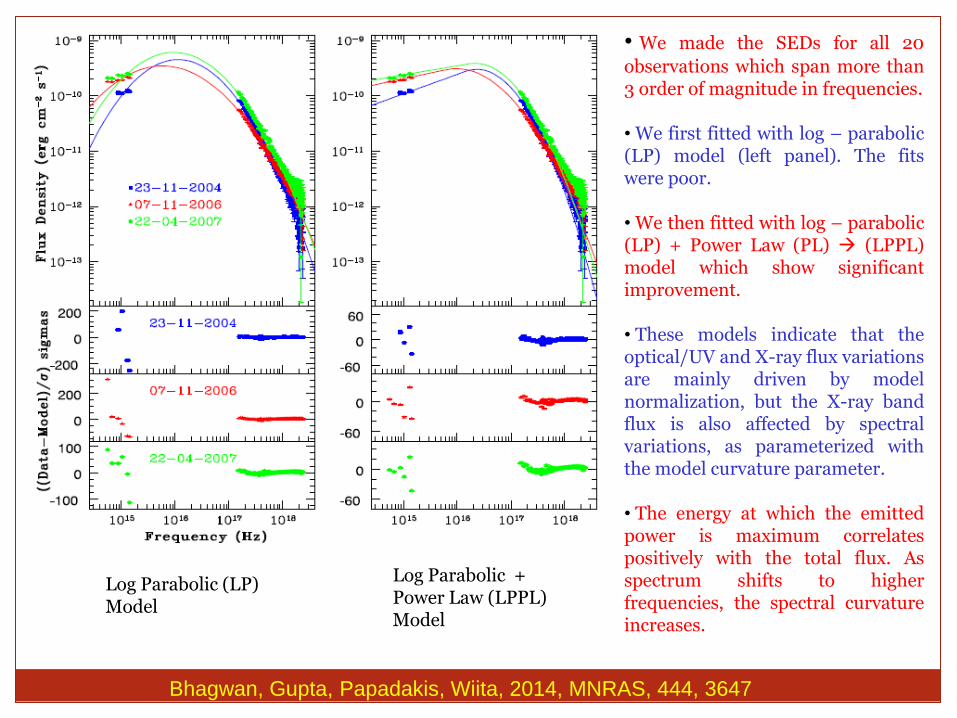
Bhagwan, Gupta, Papadakis, Wiita, 2014, MNRAS, 444, 3647
Log Parabolic + Power Law (LPPL) Model
• We made the SEDs for all 20
observations which span more than 3 order of magnitude in frequencies. • We first fitted with log – parabolic (LP) model (left panel). The fits were poor. • We then fitted with log – parabolic (LP) + Power Law (PL) (LPPL) model which show significant improvement. • These models indicate that the optical/UV and X-ray flux variations are mainly driven by model normalization, but the X-ray band flux is also affected by spectral variations, as parameterized with the model curvature parameter. • The energy at which the emitted power is maximum correlates positively with the total flux. As spectrum shifts to higher frequencies, the spectral curvature increases.
Log Parabolic (LP) Model

Project 3.
QPOs in Blazars

Galactic Black Hole Binary (GRB)
Cartoon
Active Galactic Nuclei (AGN) Cartoon
Presence of QPOs are fairly common in
micro-quasars but rare in AGN

Jet propelled by B-fields twisted by BH
Accretion disk
Hot spot on accretion disk can possibly explain QPO on IDV
timescale but this model is ruled out
for STV & LTV timescales because BH
mass exceeded 10^10 M_sun

EM
Band
QPO Results Time
Scale
Methods Ref.
optical QPO in S5 0716+714 on 5 occasions
25 to 73
min.
wavelet ACG, AKS, PJW,
ApJ, 690, 216 (2009)
X-ray QPO in AO 0235+164
QPO in 1ES 2321+419
17 days
420 days
SF, DCF, LSP, Data Folding
BR, PJW, ACG,
ApJ, 696, 2170 (2009)
X-ray QPO in PKS 2155-304 4.6 hour
SF, wavelet, PSD, MHAoV, data folding
PL, ACG, HG, PJW,
A&A Lett. 506, L17 (2009)
X-ray Hint of QPO in ON 231
Hint of QPO in PKS 2155-304
3.3 hour
1.9 hour
SF, PSD HG, ACG, PJW,
ApJ, 718, 279 (2010)
optical QPO in S5 0716+714
Fastest QPO ever detected in any AGN
15 min SF, PSD, LSP, data folding
BR, ACG, UCJ, SG, PJW, ApJL, 719, L153 (2010)
optical Weak QPO in S5 0716+714
1.1 days SF, PSD, wavelet, MHAoV, data folding
ACG, et al. (34 authors)
MNRAS, 425, 2625 (2012)
Our Results

Black Hole Mass Estimation with Periodic or QPO Timescale
Causality argument gives the size of emitting region R <= c delta T (obs).
Minimum size of such an emitting region is fairly closely related to the
gravitational radius of BH,
The minimum likely period corresponds to the orbital period at the inner
edge of the accretion disk, which is usually is given by marginally stable
orbit, Rms
For a non rotating (Schwarzschild) BH


XMM-Newton data of PKS 2155-304
4.6 hour QPO & 3.8 cycles
Lachowicz, Gupta, Gaur, Wiita, 2009, A&A Lett., 506, L17

The simplest of these models for BHs would attribute the quasi-periods to
particularly strong orbiting hotspots on the disks at, or close to, the innermost
stable circular orbit allowed by general relativity (e.g., Abramowicz et al. 1991;
Mangalam & Wiita 1993). If such simple models apply in this case, and the QPO
is indeed real, then we would estimate the BH mass for PKS 2155−304 to be
3.29 × 10⁷ M (Sun) for a non-rotating BH and 2.09 × 10⁸ M (Sun) for a
maximally rotating BH.
A shock propagating down a jet which contains quasi-helical structures, whether
in electron density or magnetic field, can produce a QPO, with successive peaks
seen each time the shock meets another twist of the helix at the angle that
provides the maximum boosting for the observer (e.g., Camenzind &
Krockenberger 1992). Instabilities in jets just might be able to excite such helical
modes capable of yielding fluctuations that are observed to occur on the time-
scale seen in PKS 2155−304 (e.g., Romero 1995). Or they could arise as the jet
plasma is launched in the vicinity of SMBH and thus actually originate in the
accretion flow but become amplified in the jet. Another very plausible origin for a
short-lived QPO would be turbulence behind the shock in the relativistic jet (e.g.
Marscher et al. 1992), as again intrinsically modest fluctuations could be
Doppler boosted.
Lachowicz, Gupta, Gaur, Wiita, 2009, A&A Lett., 506, L17

Summary
• Multi-wavelength Flux Variability is detected in blazars on diverse timescales.
• On STV and LTV timescales, in general BL Lacs show BWB while FSRQ show RWB
trend.
• In BL Lacerate, we noticed optical flux and polarization are anti-correlated.
• In a single LC of HBL PKS 2155 – 304, we noticed stable flux, QPO, decline flux and
flaring state.
• In LTV LCs, optical and UV LCs were correlated, and soft and hard X-ray LCs were
correlated in PKS 2155 – 304 and 3C 273.
• Optical to X-ray SEDs are well fitted by PLLP model in PKS 2155 – 304
• In 3C 273 and PKS 2155-304 we found, synchrotron cooling and particle acceleration
are at work on different epoch of observations.
• Spectral variability is seen in blazars in XMM-Newton and NuStar observations.
• QPOs in Blazars are rare but occasionally detected on diverse timescales.

THANKS
Acknowledgement to following students and collaborators for the
collaborative work.
Ph.D. Students: Haritma Gaur, Jai Bhagwan, Aditi Agarwal, Nibedita
Kalita, Ashwani Pandey, Vishi Aggrawal
Collaborators: P. J. Wiita, I. E. Papadakis, P. Lachowicz, R. Bachev, M.
Uemura, J. H. Fan, O. Kurtanidze, and about 30 other collaborators
worldwide.


![Capacity Efficiency of Sub-Wavelength Traffic Grooming in ... · In [1], we have evaluated the Quasi-CWDM optical network from the cost perspective compared to the other network architectures](https://static.fdocuments.in/doc/165x107/5ee420e1ad6a402d666d7904/capacity-efficiency-of-sub-wavelength-traffic-grooming-in-in-1-we-have-evaluated.jpg)


![QUASI-BIGEBRES DE LIE ET ALGEBRES QUASI-BATALIN ...streaming.ictp.it/preprints/P/99/174.pdf3 Quasi-bigebres de Lie Les quasi-bigebres de Lie [6] (appelees quasi-bigebres jacobiennes](https://static.fdocuments.in/doc/165x107/60aa5fd4a787df4f051abfc1/quasi-bigebres-de-lie-et-algebres-quasi-batalin-3-quasi-bigebres-de-lie-les.jpg)