Multi-Type Clustering and Classification from Heterogeneous ...gianvitopio/pdf/INS - HENPC...
29
Multi-Type Clustering and Classification from Heterogeneous Networks Gianvito Pio a , Francesco Serafino a , Donato Malerba a,b , Michelangelo Ceci a,b a Department of Computer Science, University of Bari Aldo Moro, Bari, Italy. b Big Data Laboratory, National Interuniversity Consortium for Informatics (CINI), Rome, Italy. E-mail: [email protected] Abstract Heterogeneous information networks consist of different types of objects and links. They can be found in several social, economic and scientific fields, ranging from the Internet to social sci- ences, including biology, epidemiology, geography, finance and many others. In the literature, several clustering and classification algorithms have been proposed which work on network data, but they are usually tailored for homogeneous networks, they make strong assumptions on the network structure (e.g. bi-typed networks or star-structured networks), or they assume that data are independently and identically distributed (i.i.d.). However, in real-world networks, objects can be of multiple types and several kinds of relationship can be identified among them. More- over, objects and links in the network can be organized in an arbitrary structure where connected objects share some characteristics. This violates the i.i.d. assumption and possibly introduces autocorrelation. To overcome the limitations of existing works, in this paper we propose the algorithm HENPC, which is able to work on heterogeneous networks with an arbitrary structure. In particular, it extracts possibly overlapping and hierarchically-organized heterogeneous clus- ters and exploits them for predictive purposes. The different levels of the hierarchy which are discovered in the clustering step give us the opportunity to choose either more globally-based or more locally-based predictions, as well as to take into account autocorrelation phenomena at different levels of granularity. Experiments on real data show that HENPC is able to signif- icantly outperform competitor approaches, both in terms of clustering quality and in terms of classification accuracy. Keywords: Heterogeneous networks, multi-type clustering, multi-type classification. 1. Introduction Many objects and data in the real world can be considered interconnected (i.e., through re- lationships, interactions, etc.), forming complex information networks. Information networks can be found in several social, economic and scientific fields, ranging from the Internet to social sciences, including biology, epidemiology, geography, finance and many others. Current studies about mining networked data mainly focus on homogeneous information networks [31, 28, 41], i.e., networks composed of a single type of object and a single type of link. However, in real life scenarios, there could be multiple types of object, connected to each other through different kinds of link, forming heterogeneous information networks. Examples can be found in biology, where genes, proteins, organisms, etc. are associated to each other through different types of Preprint submitted to Information Sciences October 12, 2017
Transcript of Multi-Type Clustering and Classification from Heterogeneous ...gianvitopio/pdf/INS - HENPC...

Multi-Type Clustering and Classification fromHeterogeneous Networks
Gianvito Pioa, Francesco Serafinoa, Donato Malerbaa,b, Michelangelo Cecia,b
aDepartment of Computer Science, University of Bari Aldo Moro, Bari, Italy.bBig Data Laboratory, National Interuniversity Consortium for Informatics (CINI), Rome, Italy.
E-mail: [email protected]
Abstract
Heterogeneous information networks consist of different types of objects and links. They can befound in several social, economic and scientific fields, ranging from the Internet to social sci-ences, including biology, epidemiology, geography, finance and many others. In the literature,several clustering and classification algorithms have been proposed which work on network data,but they are usually tailored for homogeneous networks, they make strong assumptions on thenetwork structure (e.g. bi-typed networks or star-structured networks), or they assume that dataare independently and identically distributed (i.i.d.). However, in real-world networks, objectscan be of multiple types and several kinds of relationship can be identified among them. More-over, objects and links in the network can be organized in an arbitrary structure where connectedobjects share some characteristics. This violates the i.i.d. assumption and possibly introducesautocorrelation. To overcome the limitations of existing works, in this paper we propose thealgorithm HENPC, which is able to work on heterogeneous networks with an arbitrary structure.In particular, it extracts possibly overlapping and hierarchically-organized heterogeneous clus-ters and exploits them for predictive purposes. The different levels of the hierarchy which arediscovered in the clustering step give us the opportunity to choose either more globally-basedor more locally-based predictions, as well as to take into account autocorrelation phenomenaat different levels of granularity. Experiments on real data show that HENPC is able to signif-icantly outperform competitor approaches, both in terms of clustering quality and in terms ofclassification accuracy.
Keywords: Heterogeneous networks, multi-type clustering, multi-type classification.
1. Introduction
Many objects and data in the real world can be considered interconnected (i.e., through re-lationships, interactions, etc.), forming complex information networks. Information networkscan be found in several social, economic and scientific fields, ranging from the Internet to socialsciences, including biology, epidemiology, geography, finance and many others. Current studiesabout mining networked data mainly focus on homogeneous information networks [31, 28, 41],i.e., networks composed of a single type of object and a single type of link. However, in reallife scenarios, there could be multiple types of object, connected to each other through differentkinds of link, forming heterogeneous information networks. Examples can be found in biology,where genes, proteins, organisms, etc. are associated to each other through different types ofPreprint submitted to Information Sciences October 12, 2017

link. Another example is in the analysis of bibliographic data, where different types of link existamong authors, conferences, journals and papers.
These considerations motivate the recent interest in mining heterogeneous information net-works, which in most cases focus on the clustering task. Typically, (multi-type) clustering isbased on both the attribute values of the objects (possibly of different types) and the links amongthem (e.g., spectral clustering [26], LinkClus [49] and CrossClus [50]). Clustering has been alsoexploited as a preliminary phase for other data mining tasks, such as link prediction [3] and se-mantic tagging [46], as well as for the construction of higher-level features or multiple views ofthe data [8]. Further interesting examples can be found in studies that proposed ranking-basedclustering approaches (e.g., RankClus [44] and NetClus [45]), that generate efficiently resultsfor both ranking and clustering. Some other methods perform classification [18, 19]. They takeadvantage of links in heterogeneous information networks to propagate knowledge across thenodes, enforcing the similarity between similar objects, if linked. Approaches that work in thisdirection are based on label propagation [51] and collective classification [39].
One of the main problems that these approaches tackle when learning predictive models fromnetwork data (regardless of the type of network, that is, homogeneous or heterogeneous) is thatdata are affected by some form of autocorrelation [1, 41]. This means that the value of an at-tribute at a given node depends on the values of the same attribute of the nodes it is connectedwith. This phenomenon is a direct violation of the assumption that data are independently andidentically distributed, which is at the basis of most data mining methods. At the same time, auto-correlation also offers a unique opportunity to improve the performance of predictive models onnetwork data, since inferences about one object can be used to improve inferences about relatedobjects. Autocorrelation can be recognized in several fields, for instance, in spatial data analysisit can be recognized in the (Tobler’s) first law of geography: “Everything is related to everythingelse, but near things are more related than distant things”. In social analysis, autocorrelationcan be recognized in the homophily principle [29], which shows that people connected throughfriendship relationships tend to share many sociodemographic, behavioral, and intra-personalcharacteristics. This is also important in marketing [9].
In this paper, we propose a method which is able to perform both clustering and classificationtasks on heterogeneous networks. In particular, it is able to group together heterogeneous objectsin a network and to assign labels to unlabeled objects, implicitly taking into account autocorre-lation in a collective learning setting. Similarly to multi-type clustering, where cluster labels areassociated to objects of multiple types in an unsupervised fashion, in our work we simultane-ously cluster and classify objects of different types. Classification can be performed accordingto different classification schemes i.e. it can be single-label, multi-label, hierarchical, hierar-chical multi-label (HMC), etc. In this work we focus attention on the single-label setting andwe call the considered learning task multi-type clustering and classification from heterogeneousnetworks. This task is not completely new in the literature and has connections with the taskof multiple predicate learning [36] in ILP. The difference is that it is applied to heterogeneousnetworks and not to logic clauses. Connections can also be found with the task of multi-labelcollective classification [23, 38], where, however, objects to be classified are of the same type.
In this work, we consider the within-network setting [11]: objects for which the class is knownare linked to objects for which the class must be estimated [28]. This setting is semi-supervisedand differs from the across-network setting, where learning is performed from one (labeled)network and prediction is performed on a separate, presumably similar network [27, 41].
In order to simultaneously consider the clustering and the classification tasks, the solutionwe propose is based on predictive clustering [5], which combines elements from both tasks and
2

Figure 1: Multi-type classification from heterogeneous networks. Shapes indicate types of object, while colors indicateclass labels. White objects are unclassified objects. Ellipses represent possible clusters.
allows us to properly take into account the autocorrelation phenomenon: Clusters of similarobjects are identified, and a cluster description and a predictive model are associated to eachcluster. Unlabeled objects are assigned to clusters on the basis of the cluster descriptions and thecorresponding predictive models are considered to provide predictions for the target property.The basic idea is to build (possibly overlapping) clusters of heterogeneous nodes of the network,such that autocorrelation can be implicitly considered when learning the classifier. This meansthat the clustering algorithm should preserve the network structure, that is, linked objects shouldhave similar cluster membership [43]. In other words, highly connected objects should fall in thesame clusters, contributing to learning the same predictive models. When exploiting multi-typeclustering for (multi-type) classification, we use the intuition that class values of objects of typeA are in some way related to class values of objects of type B, when all these objects belong tothe same heterogeneous cluster (or sub-network). See Figure 1 for an example.
The way the clusters are generated implicitly influences prediction. In fact, a hierarchical or-ganization of clusters, which is learned in this work, facilitates, from the descriptive perspective,the understanding of the results by human experts. From the predictive perspective, this orga-nization results in the possibility of choosing either more globally-based or more locally-basedpredictions. This is because each cluster can naturally consider different effects of the autocorre-lation phenomena on different portions of the network: at higher levels of the hierarchy, clusterswill be able to consider autocorrelation phenomena that are spread all over the network, while atlower levels of the hierarchy, clusters will consider the local effects of autocorrelation.
Another characteristic that can influence the prediction is the extraction of overlapping clus-ters. Indeed, overlapping clusters give the opportunity to base predictions on more than oneheterogeneous sub-network. For this reason, we extract hierarchically organized and possiblyoverlapping heterogeneous clusters.
Since clusters are used for predictive purposes, a clustering algorithm which takes as input thenumber K of clusters would affect the predictive capabilities of the learned models. In particular,setting K equal to the number of classes would lead to identifying models which are too generaland are not able to represent the underlying distribution of the data properly. On the contrary,overestimating the value of K could lead to overfitting problems. Therefore, our clustering algo-rithm does not require K as input and automatically identifies (at distinct levels of the hierarchy)the optimal number of clusters, on the basis of the data distribution.
3

The paper, which provides full details about the method and its evaluation, is organized as fol-lows. In the next section, related work is discussed. The method is presented in Section 3, wherewe formally introduce the problem and describe in detail the proposed predictive clustering-based solution. The experimental results, for several real datasets, are presented in Section 4.Section 5 concludes the paper.
2. Related Work
The motivations for this work come from research reported in the literature in mining heteroge-neous network data for both clustering and predictive purposes. In the following subsections, wediscuss related work from both research fields, also considering previously proposed predictiveclustering methods.
2.1. Clustering heterogeneous network data
The problem of clustering objects in heterogeneous networks has received increasing atten-tion in the last years. One of the first attempts in this direction is presented in [47], where theauthors propose improving the cluster quality of interrelated data objects through an iterative re-inforcement clustering process. This process aims at iteratively partitioning objects of each typeinto a given number of clusters. At each iteration, the similarity between two objects a and bof the same type is the linear combination of i) the attribute similarity between a and b, ii) theirintra-type similarity (between the adjacency vectors of a and b, representing links with objectsof the same type) and iii) their inter-type similarity (between the adjacency vectors of a and b,representing links with objects of different types). Contrary to our task, extracted clusters are notheterogeneous, ignoring the possibility to preserve links among objects of different types.
The authors of [7] propose applying a clustering algorithm in a data warehousing framework.In this case, there are objects of a “central” type (stored in the fact table), which are connected toobjects of other types (stored in dimensional tables), forming a star structure. The goal is to builda hierarchy of clusters for each dimensional table, by taking into account both the objects to beclustered and the objects of the central type. These hierarchies are then used for roll-up and drill-down OLAP operations. Since clusters are identified for each dimensional table independently,as in [47], they are not heterogeneous.
The idea of performing clustering of heterogeneous objects organized in a star structure is alsoconsidered in [44], where the authors propose RankClus, a probabilistic approach to multi-typeclustering. The algorithm assumes that, within each cluster, objects from the central type aregenerated by a ranking-based probabilistic generative model. The algorithm aims at identifyingsuch models and at exploiting them, in order to compute the posterior probability that each objectbelongs to each cluster. A limitation of this algorithm is that, although it is possible to extend itsapplication to arbitrary multi-typed star-structured networks, it is tailored for (and experimentsare limited to) bi-typed networks. Moreover, the extracted clusters only contain one type ofobject (i.e., they are homogeneous).
Bi-typed networks are also the main focus of the work presented in [33, 34], where the authorspropose the co-clustering method HOCCLUS2 for the analysis of microRNA-gene interactionnetworks. The main advantages of HOCCLUS2, with respect to the system proposed in [44], arethe possibility to group heterogenous objects in the same cluster (thus, preserving links amongobjects of different types) and the identification of a hierarchy of (possibly overlapping) clusters,which allows an analysis at different levels of granularity. Although similar to the work presented
4
in this paper, HOCCLUS2 is not able to analyze more than two types of objects; it cannot exploitinformation conveyed by attributes of objects, and it is not exploited for prediction purposes.
Another work that extracts heterogeneous clusters which preserve links among objects ofdifferent types is presented in [13], where the authors propose extending co-clustering to star-structured networks. The method models the problem as the fusion of pair-wise co-clusteringsub-problems. However, the star structure limits the types of link that can be considered to thoseinvolving one object of the central type. Thus, links among objects not belonging to the centraltype and links among objects of the same type are not considered and preserved.
In a more recent work [45], the authors present the algorithm NetClus, which takes advantageof the same ranking-based models exploited by RankClus. The main differences are that NetCluscan be directly applied to star-structured networks with an arbitrary number of types and that itis able to extract heterogeneous clusters. As in [13], this algorithm suffers from the problem thatonly links involving one object of the central type can be considered.
The task of multi-view clustering on star-structured data [16] also performs clustering fromheterogeneous objects. However, this task aims at performing co-clustering on objects of the cen-tral type and on features by exploiting multiple (possibly independent) views of the star schema(a la co-training).
One of the first approaches where the single central type is not imposed is proposed in [26],although experiments are limited to datasets with such a structure. In this case, the proposedsolution is based on spectral clustering and resorts to the relational data mining framework, sinceit views the network as a relational database. The authors call the task they solve collectiveclustering on multi-type relational data, which has several connections with our clustering task.An important difference is that, as in [47], clusters are not heterogeneous. In general, the task ofclustering in relational data mining [25, 30, 20] has some connections with our work because, asstated previously, one can view a relational database as a heterogeneous network. However, thesealgorithms cluster objects of a single table (“target” table) of the processed database, also on thebasis of the objects belonging to the other tables (“non-target” tables). This not only means thatextracted clusters are not heterogeneous, but also that only objects of a single type are clustered.
More recently, in [43] the authors propose a method which, similarly to ours, extracts hetero-geneous clusters from heterogeneous information networks. The clustering model is probabilisticand is based on the learned strengths of different types of link. Clusters are obtained by an itera-tive approach, in which the strengths of the links and the quality of the clustering result mutuallyenhance each other. As in our approach, clusters are overlapped. However, differently fromours, this algorithm takes as input the number of clusters and does not generate hierarchicallyorganized clusters. The implications of these differences have been explained in Section 1.
2.2. Network data classification
In the literature, several approaches have been designed to model a partially labeled networkand to provide accurate estimates of labels for unlabeled nodes. These approaches have beenstudied in the research fields of collective inference [28, 12, 39, 17], active inference [4], semi-supervised and transductive inference [52, 37, 2].
All these approaches, however, are designed to work with homogeneous networks. Only re-cently, some works started to consider the heterogeneity of nodes and links in the networks.For instance, in [14] the authors work on documents represented as a heterogeneous networkconsisting of interlinked multimedia objects (containing titles, descriptions and subtitles) andtransform such a network into bag-of-words vectors (propositionalization). However, like most
5

methods based only on propositionalization, it can possibly lose relevant relationships, due to thenecessity to apply aggregation functions to attributes associated to sets of linked objects. On thecontrary, in [19] the authors work directly on the heterogeneous network and consider a trans-ductive classification task. In particular, they propose a graph-based regularization framework,called GNetMine, which models the link structure in arbitrary information networks. GNetMineconsiders each relation graph associated to each type of link separately and aims at preserving itsconsistency. However, GNetMine considers only links among objects (i.e., it is not able to takeinto account possible attributes associated to nodes), and class labels are associated to heteroge-neous sub-networks. This means that the set of the possible class values is common among all theobjects, independently of their types. Although such a characteristic may appear reasonable inmany domains, it cannot model those (more general) situations in which different classificationschemes should be defined for each type of object.
The method proposed in [18] combines ranking and classification tasks on the basis of theintuition that highly-ranked objects within a class should play more important roles in classi-fication or, vice versa, that class membership information is important for determining a goodranking over a dataset. Accordingly, a ranking-based iterative classification framework, calledRankClass, is proposed. At each iteration, a graph-based ranking model is built and, on the basisof the current ranking results, the graph structure is adjusted, so that weights of the links in thesubnetwork corresponding to each specific class are strengthened, while weights of the links inthe rest of the network are weakened. Although experiments show the advantages of combiningranking and classification, as in [19], a single classification scheme can be associated to all thetypes of object. Moreover, in RankClass, each node is associated to one class, meaning that it ismandatory to associate a classification scheme to each object type.
Recently, in [22] the authors proposed a collective classification approach which aims at clas-sifying objects of the same type in a heterogeneous network, based on the concept of meta-path.A meta-path is a path, between two objects to be classified, consisting of a sequence of linktypes. This concept is used to effectively assign labels to a group of interconnected instances, bytaking into account different meta-path-based dependencies. The classification is probabilisticand is based on the feature values of the object to be classified, on the meta-paths, on the “re-lational features” associated to the meta-paths, as well as on the labels associated to the objectstraversed in the meta-paths. In this way, the proposed model is able to capture the subtlety ofdifferent dependencies among instances, with respect to different meta-paths and, at the sametime, to implicitly take autocorrelation into account. Although similar to ours, this approach isspecifically designed to classify objects of a single type, similarly to the classical classificationproblem in relational data mining. In the latter context, many approaches have been proposed inthe literature, which can be considered relevant baselines for the multi-type classification task.For example, in [6] the authors propose exploiting the naıve Bayes classification method in themulti-relational setting. This system exploits: i) first-order classification rules for the compu-tation of the posterior probability for each class; ii) both discrete and continuous attributes byapplying a supervised discretization method; iii) knowledge on the data model (i.e., the databaseschema) during the generation of classification rules. More recently, the work in [48] introducedthe tool RelWEKA, which extends the WEKA toolkit with the multi-relational version of manyclassical data mining algorithms (e.g., k-NN and SVM).
The adaptation of these approaches to the multi-type classification task consists in the gener-ation of several separate classification models, without exploiting possible dependencies amongclass values of objects of different types.
6
2.3. Predictive clustering for network prediction
Some recent works propose the use of predictive clustering in the context of network data.However, none of them consider the heterogeneity of the network.
In [40] the authors follow an approach similar to predictive clustering. In particular, theycombine a descriptive task (clustering) with a predictive task (regression) and argue that usingnetworks as a data representation provides a unified framework for identifying and characterizingpatterns in climate data. In that case, the network is built a-posteriori on the basis of the values ofPearson’s correlation coefficient, computed between pairs of nodes on the time series collectedfor the same variable. Clustering then boils down to a community detection problem that allowsthe proposed approach to group interconnected nodes, so that the pairwise walking distancebetween two nodes in the cluster is minimized. Finally, the prediction of the value of each nodeis obtained by means of a linear regression model built on the (spatial) cluster it belongs to.The innovative aspects of our proposal with respect to this work are twofold. First, extractedclusters are overlapping and hierarchically organized. Second, the correlation is measured onnodes which are interconnected in an existing network, while the method in [40] measures thecorrelation to define virtual edges between examples.
In [41] the authors propose learning network predictive clustering trees, in order to classifynodes in a network. Similarly to classical decision trees, network predictive clustering trees arebuilt top-down. The difference is that the authors propose using a network autocorrelation-basedmeasure as a heuristic, thus explicitly taking autocorrelation into account. The same principle isadopted in [42], where network predictive clustering trees are used to predict gene functions. Thedifference is that, in this last work, a hierarchical multi-label classification scheme is considered.
3. Multi-type Clustering and Classification from Heterogeneous Networks
In this section, we first introduce notations, definitions and concepts for both clustering andclassification tasks in heterogeneous information networks. Subsequently, we present our solu-tion for the identification of the strength of the relationships among nodes of target types, andour method to identify clusters and organize them hierarchically. Finally, we present the classifi-cation step. The first definition we introduce is of the heterogeneous information network:
Definition 1 (Heterogeneous information network). A heterogeneous information network isan information network where objects and links can be of different types. It is represented as anundirected graph G = (V, E), where V is the set of nodes (i.e., objects) and E is the set of edges(i.e., links) between objects. Moreover:
• each node v′ ∈ V is associated to a single node type tv(v′) ∈ T , where T is the finite set{Tp}p of all the possible types of node in the network;
• each node type Tp defines a subset of nodes Vp ⊆ V;
• each node type Tp defines a set of attributes Xp = {Xp,1, . . . , Xp,mp } that are associated withthe nodes of that type;
• each edge between two nodes v′ and v′′ is associated with an edge type R j ∈ R, where Ris the finite set {R j} j of all the edge types in the network. Formally, we define an edge ase = 〈R j, 〈v′, v′′〉〉 ∈ E, where R j = te(e) ∈ R is its type;
7
• each edge type R j defines a subset of edges E j ⊆ (Vp × Vq), where Tp ≤ Tq1;
• the set of node types T is partitioned into Tt (target types), which are considered as thetarget of the clustering/classification task, and Ttr (task-relevant types), consisting of thetypes that are not the main subject of the analysis. Only nodes belonging to a type of Tt areactually clustered and possibly classified, on the basis of the edges involving nodes of anytype in T .
Definition 2 (Heterogeneous cluster). Given a heterogeneous network G = (V, E), we define aheterogeneous (or multi-type) cluster as G′ = (V ′, E′), where:
• V ′ ⊆ V;
• ∀v′ ∈ V ′, tv(v′) ∈ Tt, that is, nodes in the clusters only belong to target types;
• E′ ⊆ (E ∪ E) is a set of edges among the nodes in V ′, belonging either to the set of edges Eor to a set of extracted edges E, that are edges identified by the clustering method (detailsabout these edges will be discussed in Section 3.1).
Definition 3 (Hierarchical organization of clusters). A hierarchy of heterogeneous clusters isdefined as a list of hierarchy levels [L1, L2, . . . , Lk], each consisting of a set of heterogeneous andoverlapping clusters. For each level Li, i = 2, 3, .. . . . k, we have that ∀ G′ ∈ Li ∃ G′′ ∈ Li−1, suchthat G′′ is a subgraph of G′.
Definition 4 (Classification schemes in heterogeneous networks). Given a heterogeneousnetwork G = (V, E), each target type Tp ∈ Tt can be associated to a different classificationscheme S p ∈ S, where S is the set of classification schemes. More formally, we define a partialmapping function φ : Tt → S which maps each node type Tp to the classification scheme S p. Asstated before, in this work we focus on single-label schemes. The mapping function φ is partialin the sense that some target types may have no classification scheme. In other words, nodesbelonging to some types could be considered as the target only for the clustering task, but notfor classification purposes. In this respect, we define the set of types T ∗t ⊆ Tt as the set of targettypes which also have an associated classification scheme. Therefore, each target type in T ∗twill have a single target attribute, whose value will be predicted for unlabeled nodes.
On the basis of these definitions (see Appendix for a compact view of the symbols), we definethe learning task we consider in this work.
Definition 5 (Predictive hierarchical clustering for multi-type classification). Given a het-erogeneous network G = (V, E), the set of target types Tt and the partial mapping functionφ : Tt → S, the goal is to find:
• A hierarchy of heterogeneous clusters [L1, L2, . . . , Lk].
• A classification function ψ(i)p : Vp → Yp for each level Li and for each target type Tp ∈ T
∗t .
Yp is defined according to the classification scheme S p = φ(Tp).
1Since we consider an undirected graph representation, we define an ordering among the node types. In this way, eachedge type R j defines a subset of links E j which associate pairs of nodes belonging to node types Tp and Tq, where Tqfollows Tp according to a total ordering. This guarantees that the edge 〈v′, v′′〉 does not appear also in the form 〈v′′, v′〉.
8

The different classification functions identified for different levels of the hierarchy are exploited toperform either globally-based or locally-based predictions, taking into account autocorrelationphenomena on different portions of the network.
The method we propose for the task in Definition 5 is based on four steps:1. Identification of the strength of the relationship among nodes;2. Extraction of a set of (possibly overlapping) multi-type clusters in the form of multi-type
cliques (see Section 3.2), which are not hierarchically organized;3. An iterative process in which pairs of multi-type clusters are merged when some heuristic
criteria are satisfied. At each iteration, several pairs of clusters can be merged. The processstops when no changes are produced in the last iteration, otherwise an additional level ofthe hierarchy is added.
4. Identification of a classification function for each hierarchical level and for each target typewith an associated classification scheme. Each function associates each node of a giventarget type to a value in the range defined by the classification scheme associated to such atarget type.
For the sake of simplicity, hereafter we will use the terms clique and cluster to refer to multi-typeclique and multi-type cluster, respectively.
3.1. Computing the strength of the relationship among nodes of different typesIn this subsection we clarify how we compute the strength of the relationship among the nodes.
In order to explain this concept, we first provide the definition of tuples of nodes, which is usedto represent the output of this phase.
Definition 6 (Tuple of nodes). A tuple is defined as ~vi ∈ Tp1×Tp2×. . .×Tpr , where ∀ j = 1, . . . , r:Tp j ∈ Tt and Tt − {Tp1 ,Tp2 , . . .Tpr } = ∅. In other words, the structure of a tuple is representedby all the target types, taken at least once (i.e., r ≥ |Tt |)2.
Given the structure of the tuple, for each possible tuple ~vi, it is possible to compute the scoresi which represents the strength of the relationship among all the nodes in the tuple. The waywe identify this value takes into account the possible meta-paths3 in the network that pairwiseconnect all the nodes in the tuple, i.e.: si = min
j′, j′′score(vi, j′ , vi, j′′ ), where vi, j is the j-th node of the
tuple ~vi. If there is no meta-path connecting two nodes in the tuple, si = 0. The rationale behindthe use of the minimum is that the connection among the nodes in the tuple is strong if all thepairwise connections are strong (see Figure 2).
Accordingly, we define the set of extracted edges E, which consists of the edges for each pairof nodes vi, j′ ,vi, j′′ not belonging to E for which score(vi, j′ , vi, j′′ ) > 0. Each edge between twonodes vi, j′ and vi, j′′ is associated to the maximum score computed according to the meta-pathsconnecting them in the network:
score(vi, j′ , vi, j′′ ) = maxP∈metapaths(T j′ ,T j′′ )
pathscore(P, vi, j′ , vi, j′′ ), (1)
2It is noteworthy that, although we do not impose any limit on the value of r, it will be a predefined (very low) value,defined according to the set of target types considered for the clustering and classification tasks. Therefore, the numberof possible tuples is always finite.
3In this paper, the term meta-path represents a concept similar to the meta-path in [22], where it represents a sequenceof link types. The difference is that, in our paper, a meta-path represents the set of sequences of nodes which follow thesame sequence of link types. Accordingly, the length of a meta-path is the number of link types in the sequence.
9

Figure 2: Strength of the relationships for the tuple ~vi = 〈A, B,C〉.
Figure 3: An example of analysis of the sequences associated to the nodes vi, j′ (with id = t103) and vi, j′′ (with id = t209).In the example, sequences 4, 5 and 6 (in yellow) are associated to vi, j′ , and sequences 3 and 7 (in green) are associatedto the node vi, j′′ . The algorithm pair-wisely compares the two sets of sequences (sequences in yellow and sequences ingreen) and computes the similarity between vi, j′ and vi, j′′ as the maximum similarity between two sequences.
where:
• metapaths(T j′ ,T j′′ ) is the finite set {P1, P2, . . . , Pc} of all the possible meta-paths betweenthe nodes of type tv(vi, j′ ) = T j′ and the nodes of type tv(vi, j′′ ) = T j′′ . We consider the cshortest meta-paths;
• each meta-path P is represented as a finite set of sequences of nodes {seqd =
〈v(d)1 , v(d)
2 , . . . , v(d)z 〉}, such that: i) the i-th node of each sequence in the meta-path P is of
the same type; ii) the first and the last nodes are of type T j′ and T j′′ , respectively and iii)two consecutive nodes in a sequence are connected in E;
• pathscore(P, vi, j′ , vi, j′′ ) represents the strength of the connection between vi, j′ and vi, j′′ in P.
If there is a sequence in P that connects vi, j′ and vi, j′′ , pathscore(P, vi, j′ , vi, j′′ ) = 1. Otherwise,it is computed as the maximum similarity between the sequences which start with vi, j′ and thesequences which end with vi, j′′ (see Figure 3). Formally:
pathscore(P, vi, j′ , vi, j′′ ) = maxseqd′ ,seqd′′∈P;
v(d′)1 =vi, j′ ; v(d′′ )
z =vi, j′′
S S (seqd′ , seqd′′ ) (2)
10

In this formula, the similarity between two sequences (S S (·, ·)) is computed as the average be-tween the similarity of target attribute values and the similarity of non-target attribute values ofthe nodes in the two sequences, that is:
S S (seqd′ , seqd′′ ) =12·
∑
x∈XC (seqd′ ,seqd′′ )
sx(seqd′ , seqd′′ )
|XC(seqd′ , seqd′′ )|+
∑x∈XNC (seqd′ ,seqd′′ )
sx(seqd′ , seqd′′ )
|XNC(seqd′ , seqd′′ )|
, (3)
where:
• XC(seqd′ , seqd′′ ) is the set of target attributes;
• XNC(seqd′ , seqd′′ ) is the set of non-target attributes;
• sx(seqd′ , seqd′′ ) is the similarity between valx(seqd′ ), that is the value of the attribute x inthe sequence seqd′ , and valx(seqd′ ), that is the value of the attribute x in the sequence seqd′′ .
Following [15], sx(seqd′ , seqd′′ ) is computed as follows:
• if x is numeric, then sx(seqd′ , seqd′′ ) = 1 − |valx(seqd′ )−valx(seqd′′ )|maxx−minx
, where minx (resp. maxx) isthe minimum (resp. maximum) value, for the attribute x;
• if x is not a numeric attribute, then sx(seqd′ , seqd′′ ) = 1 if valx(seqd′ ) = valx(seqd′′ ), 0otherwise.
If at least one value is not available (i.e., is null), the attribute is ignored. Moreover, the sameattribute can be considered more than once in the sequences. This can happen because nodes ofthe same type can be considered in the same sequence, taking into account the possible presenceof network autocorrelation.
Finally, some node types may not be involved in any meta-path. In order to exploit the infor-mation conveyed by these nodes, we add an aggregation of their attribute values to the nodes thatare connected to them and that appear in at least one meta-path (see Figure 4).
Such an aggregation considers values coming from directly or indirectly (up to a predefineddepth of analysis) connected nodes. For this purpose different aggregation functions could beused. In our case, we use the arithmetic mean for numeric attributes and the mode for attributesof any other type.
Figure 4: An example of the aggregation of nodes that are not involved in any meta-path. In the example T1 and T2 aretarget nodes. Since node a cannot be involved in any sequence of a meta-path, the aggregation phase builds a new nodee new, which aggregates in e new information coming from a.
11

Algorithm 1 Identification of the first hierarchical level L1.Require: List of initial clusters L1 built from {~vi |si ≥ β}; the ordering relation <c.Ensure: The updated list of clusters L1 (first level) in the form of cliques.
cliques← [ ];repeat
sort L1 according to <c;mergedClusters← [ ];for i = 1 to |L1 | − 1 do
merged ← f alse;{Search for a merging leading to a clique}for j = i + 1 to |L1 | do
if merge(L1[i], L1[ j]) is a clique thenadd merge(L1[i], L1[ j]) to mergedClusters;remove L1[ j] from L1; merged ← true;
end ifend for{If L1[i] cannot be merged, add it to the result}if merged = f alse then
add L1[i] to cliques;end if
end forL1 ← mergedClusters;
until mergedClusters = [ ]return cliques
3.2. Building multi-type cliques
Once all the possible tuples are identified, each associated with a strength score, we build a setof (possibly overlapping) clusters in the form of cliques. A cluster is in the form of a clique if allthe tuples involving only nodes in the cluster have a score (strength of the relationships) above agiven threshold β. Consequently, the proposed algorithm requires the parameter β ∈ [0, 1], usedto consider a relationship relevant or not. The task to be solved is formalized in the following.
Given:
• a finite set of tuples {~vi}i, each associated with its own score si, computed according to thealgorithm described in Section 3.1;
• a threshold β;
• a (total) ordering relation <c between clusters, which should reflect the quality of the clusters(the criteria considered in this paper are described in Section 3.5).
Find: a set of clusters in the form of cliques, according to β and the relation <c.
The algorithm consists of the following steps:
i) A filtering phase on the set of tuples, which keeps only the tuples with a score greater than(or equal to) β. The result is the subset of tuples {~vi |si ≥ β}.
ii) The generation of an initial set of cliques, each consisting of a tuple in {~vi |si ≥ β}. This isthe input for Algorithm 1, which identifies the first hierarchy level L1.
12

iii) A process that iteratively merges two clusters G′ and G′′ into a new cluster G′′′ (see Al-gorithm 1). The initial set of clusters is regarded as a list and is sorted according to theordering relation <c. Then, each cluster G′ is merged with the first cluster G′′ in the listwhich leads to a merged cluster G′′′, which is still a clique. This process is repeated untilno more merging takes place.
The result of this phase is a set of clusters which defines the first level of the hierarchy L1. In thenext subsection we explain how we build the other levels.
3.3. Building the hierarchy of clusters
Once the first level L1 of the hierarchy has been identified, we evaluate whether some pairs ofclusters (cliques, in L1) can be reasonably merged to build the other levels.
The approach is similar to that adopted in Algorithm 1. The main difference is that, insteadof working on cliques, it works on generic clusters, where the strength score associated to eachtuple is not necessarily greater than β. This means that a different criterion for the identificationof candidates for merging has to be considered. In particular, we use a criterion which is inspiredby the research in hierarchical co-clustering, where a common stopping criterion is based on athreshold applied to the quality of clusters obtained by merging two clusters [33]. Analogously,in our approach, two clusters G′ and G” are merged into a cluster G′′′ if h(G′′′) > α, where αis a user-defined threshold. Low values of α lead to a higher number of mergings at the price oflower quality of clusters. The task is formalized in the following.
Algorithm 2 Identification of the hierarchy of clusters L1, L2, . . . Lk.Require: The first level of the hierarchy L1; the ordering relation <c; the heuristic function h(·); the threshold α.Ensure: The hierarchy of clusters L1, L2, . . . Lk .
k = 1;repeat
L← Lk; k ← k + 1; clusters← [ ]; mergedClusters← [ ];sort L according to <c;for i = 1 to |L| − 1 do
merged ← f alse;{Search for a merging which satisfies the threshold}for j = i + 1 to |L| do
temp← merge(L[i], L[ j]);if h(temp) >= α) then
add temp to mergedClusters;remove L[ j] from L; merged ← true;
end ifend for{If L[i] cannot be merged, add it to the result}if merged = f alse then
add L[i] to clusters;end if
end for{Build a new level if there was at least one merging}if mergedClusters , [ ] then
Lk ← clusters;end if
until mergedClusters = [ ]return L1, L2, . . . Lk
13

Given:
• the first hierarchy level L1, identified as described in Section 3.2;
• the ordering relation <c;
• a threshold α;
• a heuristic function h(G) which evaluates a cluster G according to a quality criterion (thecriterion considered in this paper is described in Section 3.5).
Find: a list of hierarchical level [L1, L2, . . . , Lk], according to Definition 3.
The method, which is formally described in Algorithm 2, builds a new hierarchy level when afurther iteration of the repeat..until loop is possible. It is noteworthy that Lk (i.e., the top level ofthe hierarchy) does not necessarily contain a single cluster, meaning that a forest of hierarchiesof clusters is actually returned.
3.4. ClassificationOnce the hierarchy has been identified, we define a classification function ψ(i)
p for each level iand each target type Tp ∈ T ∗t . Unlabeled nodes are classified according to a variant of the ma-jority voting algorithm which considers the overlapping among clusters. In particular, predictivemodels are built by considering the labels of the nodes of the same type belonging to the clustersin which the node falls.
Keeping in mind that we work in a semi-supervised learning setting, we have to deal with thefact that both labeled and unlabeled nodes, possibly of different types, belong to the same cluster.Obviously, clusters with a high percentage of labeled nodes lead to more reliable predictions. Inour approach we consider this aspect and we use the percentage of labeled nodes belonging toeach cluster, in order to compute a weight representing the reliability of the prediction model.
Formally, for each hierarchy level Li, the classification function ψ(i)p (v) for an unlabeled node
v of the target type Tp exploits a weighted average of the probabilities that v belongs to the classY in a cluster G′:
P(cl(v) = Y |v ∈ un(G′p)) =f req(Y, lab(G′p))
|lab(G′p)|, (4)
where:
• cl(v) is a possible class (label) to associate with v;
• G′p is the set of nodes of type Tp in G′;
• lab(G′p) is the set of labeled nodes of type Tp in G′;
• un(G′p) is the set of unlabeled nodes of type Tp in G′;
• f req(Y, lab(G′p)) is the number of nodes of type Tp labeled as Y in G′p.
The classification function ψ(i)p (v) can now be defined as:
ψ(i)p (v) = arg max
Y∈Yp
∑{G′ |v∈G′∧G′∈Li}
[w(G′p) · P(cl(v) = Y |v ∈ un(G′p))
]∑{G′ |v∈G′∧G′∈Li}
w(G′p), (5)
14

Figure 5: Predictive models associated to each type of node in the heterogeneous network. Shapes indicate types ofobject, while colors indicate class labels. White objects are unclassified objects. Ellipses represent possible clusters.
where {G′|v ∈ G′ ∧ G′ ∈ Li} is the set of clusters of level Li which v belongs to, and w(G′p) =
|lab(G′p)|/|G′p| is the percentage of labeled nodes of type Tp in G′.To better explain how classification is performed, we report an example of classification mod-
els built for unlabeled nodes of clusters in Figure 5. In this example, an unlabeled circle nodebelonging only to cluster g3 is classified according to the classification model of circle nodes builtfrom g3, that is, [red = 2/3, green = 1/3]. Therefore, it is classified as red. When a node fallsin more than one cluster, the classification model is built according to all the clusters involved,according to Equation (5). For example, the white square node v′ belonging to both g1 and g2 isclassified according to the weighted average of the classification models [purple = 1, yellow = 0](cluster g1) and [purple = 2/3, yellow = 1/3] (cluster g2). Since g1 has 2 out of 3 labeled squarenodes, whereas g2 has 3 out of 4 labeled square nodes, the classification model of g1 will be asso-ciated to a weight of 2/3, while that of cluster g2 will be associated to the weight 3/4. Accordingto Equation (5), v′ will be classified on the basis of the following model:
ψ(i)p (v′) = arg max
purple,yellow
[purple =
2/3 · 1 + 3/4 · 2/32/3 + 3/4
, yellow =2/3 · 0 + 3/4 · 1/3
2/3 + 3/4
]= purple
Here, we assume that unlabeled nodes are known and used during the clustering phase, which isin line with the transductive variant of semi-supervised learning.
Formula (5) allows our method to capture the autocorrelation that relates a target attribute withan independent attribute (relationally-lagged explanatory attributes) for two connected objects,possibly of different types. This form of autocorrelation is more general than that which relatesa target attribute with itself (relationally-lagged response attribute). However, since we can con-sider the same type more than once as the target type in clustering, we can force the method tocatch the form of autocorrelation which relates a target attribute with itself. This turns out to beuseful also when we have only one target type. To balance the contribution of the two forms ofautocorrelation, we introduce the parameter γ ∈ [0, 1]. With γ = 0 we only catch the autocor-relation that relates a target attribute with an independent attribute, whereas with γ = 1 we onlycatch the autocorrelation that relates a target attribute with itself.
15

This means that ψ(i)p (v) can be rewritten as:
ψ(i)p (v) = arg max
Y∈Yp
(γ ·
∑{G′ |v∈G′∧G′∈L∗i }
[w(G′p) · P(cl(v) = Y |v ∈ un(G′p))
]∑{G′ |v∈G′∧G′∈L∗i } w(G′p)
+
+ (1 − γ) ·
∑{G′ |v∈G′∧G′∈Li}
[w(G′p) · P(cl(v) = Y |v ∈ un(G′p))
]∑{G′ |v∈G′∧G′∈Li}
w(G′p)
)(6)
where L∗i is the set of clusters belonging to the i-th hierarchical level, obtained by running thealgorithm considering one single target type twice (i.e., for type Tp, identified tuples consist oftwo nodes of type Tp). In this way, we catch the autocorrelation between the target attribute (ofthe nodes of type Tp) and itself.
3.5. The ordering relation <c and the heuristics h(·)
In this subsection, we describe the approach we adopt to sort clusters (i.e., the ordering relation<c) and to select an appropriate candidate for merging (i.e., the heuristic function h(·)). Boththe ordering relation and the heuristic function aim at the maximization of the strength of therelationships among nodes of different types in the clusters. In this way, we take into account the(possible) dependencies among target attributes of different target types within the same cluster.
The considered measure is inspired by the concept of cohesiveness, which is typically used incoclustering algorithms [33] to represent the average strength of the connection among objects oftwo different types in the same cocluster. In this work, we extend this concept to multiple typesand, in particular, we consider the average score of all the possible tuples that can be built fromthe nodes belonging to a cluster. Formally, we compute h(G′) as the multi-type cohesiveness:
h(G′) =1
|tuples(G′)|·
∑~vi∈tuples(G′)
si (7)
where tuples(G′) is the set of tuples that can be built from the nodes belonging to G′, and si isthe score associated with each tuple. The ordering relation <c is then defined on the basis of theheuristic function h(·): G′ <c G′′ ⇐⇒ h(G′) > h(G′′) that is, one cluster is processed beforeanother if it has a higher cohesiveness.
3.6. Time complexity
The analysis of the time complexity has to take into account the complexity of each singlephase, that is, the complexity of the identification of the possible tuples, the complexity of theidentification of the first and subsequent levels of the hierarchy of clusters and, finally, the com-plexity of the classification of unlabeled nodes.For the identification of possible tuples, we assume that:
• nodes are equally distributed among types, i.e., |V1| = |V2| = . . . = |V|T || = n;
• we consider at most c meta-paths connecting nodes of two different types;
• each node (of every type) is represented according to m attributes.16

In the worst case, a meta-path involves all the types of edge |R|. Therefore, for each pair of targettypes, the time complexity for the identification of the tuples requires O(c · 2 · |R| · n) (for theidentification of the sequences, when nodes are indexed according to an order-preserving datastructure) plus O(c · n2 · m · |R|) (for the computation of the similarities among sequences thatstart with a node of a target type and end with a node of another target type, when there is nosequence that connects the two nodes, see Equation (2)). In these equations, m · |R| is due to thecomputation of the similarity. This means that the cost of extracting tuples is: O(|Tt | · (|Tt |−1)/2 ·c · (2 · n · |R| + n2 · m · |R|)), where |Tt | · (|Tt | − 1)/2 represents the number of possible pairs oftarget types. Since n2 · m · |R| dominates over 2 · n · |R| and since |Tt | and c are small constants,the complexity for identifying tuples is:
O(n2 · m · |R|) (8)
As for the identification of the first and subsequent levels of the hierarchy, we have to take intoaccount the number of tuples which, in the worst case, is O(|Tt | · (|Tt | − 1)/2 · γ2) = O(γ2), whereγ � n is the average number of objects of a given target type which are connected, according toa meta-path, to a node of another target type.
Therefore, if a cluster contains O(γ2) tuples, each iteration of the repeat...until loop of bothAlgorithms 1 and 2 for the evaluation of h(·) costs O(γ4) (due to the pairwise evaluation ofthe clusters). By assuming that the number of clusters halves at each iteration (which happens ifeach cluster can be merged with another cluster), the number of possible iterations is O(log2(γ2)).Therefore, the complexity of Algorithms 1 and 2 can be approximated to:
O(γ4 · log2(γ2)) (9)
The classification of unlabeled nodes only requires a scan of the clusters (at all the levels) andthe application of the classification algorithm, whose time complexity is linear in the numberof nodes that fall in the containing clusters. This means that the complexity of this phase islinear with respect to: the number of hierarchical levels (k), the number of target types with anassociated scheme (|T ∗t |), n, the number of clusters and the average number of labeled examplesper cluster.
In short, by combining Equations (8) and (9) with the time complexity of the classificationphase, we have that the time complexity of the whole algorithm is:
O(n2 · m · |R| + γ4 · log2(γ2)) (10)
which strongly depends on the value of γ. If the dataset, according to the meta-paths, has arelatively small number of connections (i.e., γ4 · log2(γ2) ≤ n2 · m · |R|), the time complexity isO(n2 · m · |R|). Otherwise, the time complexity is O(γ4 · log2(γ2)).
4. Experiments
The proposed method has been implemented in the system HENPC (HEterogeneous Net-work Predictive Clustering), which is publicly available at www.di.uniba.it/~gianvitopio/systems/henpc/. In this section, we describe the experiments aiming at the evaluation ofHENPC for both clustering and classification tasks.
Before presenting the results, in the following subsections, we briefly describe the considereddatasets, the competitor systems and the experimental setting.
17
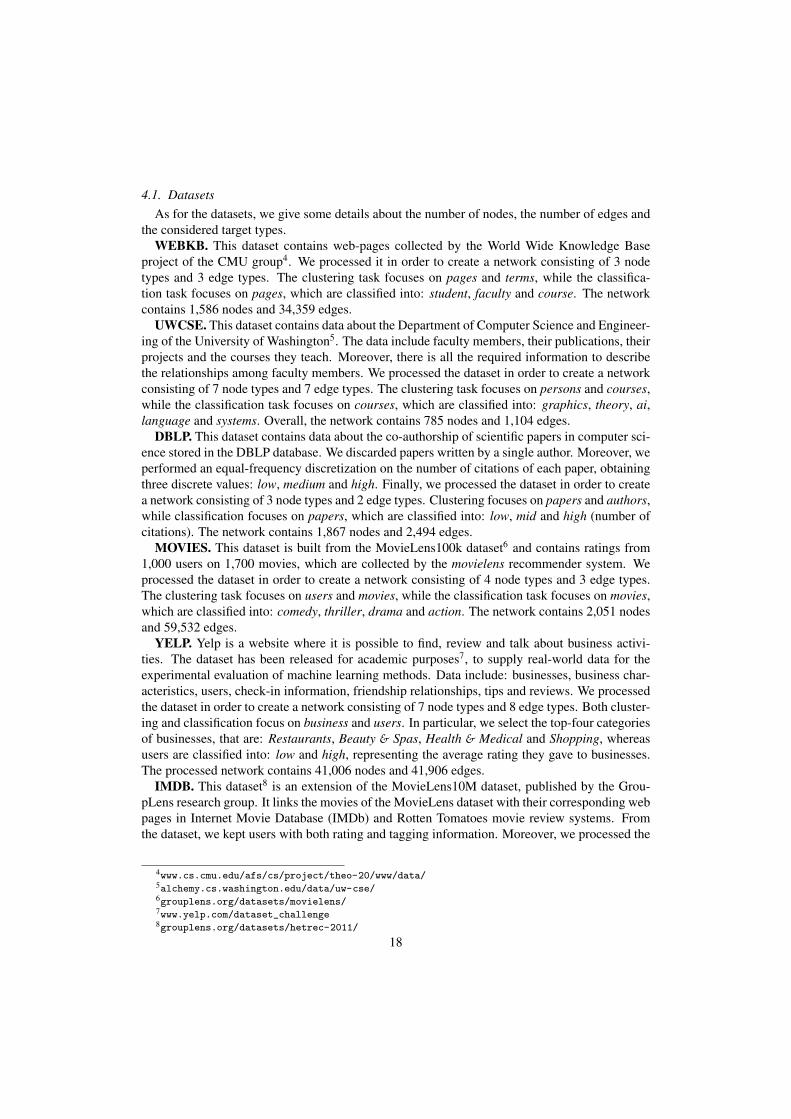
4.1. DatasetsAs for the datasets, we give some details about the number of nodes, the number of edges and
the considered target types.WEBKB. This dataset contains web-pages collected by the World Wide Knowledge Base
project of the CMU group4. We processed it in order to create a network consisting of 3 nodetypes and 3 edge types. The clustering task focuses on pages and terms, while the classifica-tion task focuses on pages, which are classified into: student, faculty and course. The networkcontains 1,586 nodes and 34,359 edges.
UWCSE. This dataset contains data about the Department of Computer Science and Engineer-ing of the University of Washington5. The data include faculty members, their publications, theirprojects and the courses they teach. Moreover, there is all the required information to describethe relationships among faculty members. We processed the dataset in order to create a networkconsisting of 7 node types and 7 edge types. The clustering task focuses on persons and courses,while the classification task focuses on courses, which are classified into: graphics, theory, ai,language and systems. Overall, the network contains 785 nodes and 1,104 edges.
DBLP. This dataset contains data about the co-authorship of scientific papers in computer sci-ence stored in the DBLP database. We discarded papers written by a single author. Moreover, weperformed an equal-frequency discretization on the number of citations of each paper, obtainingthree discrete values: low, medium and high. Finally, we processed the dataset in order to createa network consisting of 3 node types and 2 edge types. Clustering focuses on papers and authors,while classification focuses on papers, which are classified into: low, mid and high (number ofcitations). The network contains 1,867 nodes and 2,494 edges.
MOVIES. This dataset is built from the MovieLens100k dataset6 and contains ratings from1,000 users on 1,700 movies, which are collected by the movielens recommender system. Weprocessed the dataset in order to create a network consisting of 4 node types and 3 edge types.The clustering task focuses on users and movies, while the classification task focuses on movies,which are classified into: comedy, thriller, drama and action. The network contains 2,051 nodesand 59,532 edges.
YELP. Yelp is a website where it is possible to find, review and talk about business activi-ties. The dataset has been released for academic purposes7, to supply real-world data for theexperimental evaluation of machine learning methods. Data include: businesses, business char-acteristics, users, check-in information, friendship relationships, tips and reviews. We processedthe dataset in order to create a network consisting of 7 node types and 8 edge types. Both cluster-ing and classification focus on business and users. In particular, we select the top-four categoriesof businesses, that are: Restaurants, Beauty & Spas, Health & Medical and Shopping, whereasusers are classified into: low and high, representing the average rating they gave to businesses.The processed network contains 41,006 nodes and 41,906 edges.
IMDB. This dataset8 is an extension of the MovieLens10M dataset, published by the Grou-pLens research group. It links the movies of the MovieLens dataset with their corresponding webpages in Internet Movie Database (IMDb) and Rotten Tomatoes movie review systems. Fromthe dataset, we kept users with both rating and tagging information. Moreover, we processed the
4www.cs.cmu.edu/afs/cs/project/theo-20/www/data/5alchemy.cs.washington.edu/data/uw-cse/6grouplens.org/datasets/movielens/7www.yelp.com/dataset_challenge8grouplens.org/datasets/hetrec-2011/
18

dataset in order to create a network consisting of 13 node types and 16 edge types. Clusteringfocuses on users and movies, while classification focuses on movies, which are classified into:comedy, thriller, drama and action. The network contains 97,030 nodes and 56,153 edges.
4.2. Experimental setting
In order to evaluate the clusters identified by HENPC, we performed a comparison with thesystem HOCCLUS2 [33], which also discovers possibly overlapping and hierarchically orga-nized clusters. It is tailored to work with two object types (i.e., it is a co-clustering algorithm)and was originally used in bioinformatics to discover biological correlations between microR-NAs and target genes.
In order to perform a fair comparison of the clustering results, we consider an evaluation mea-sure which is different from the optimization criterion adopted by both HENPC and HOCCLUS2.In particular, the identified clusters are evaluated in terms of a variant of the Q-Modularity [32],which measures the quality of the clustering with respect to a random clustering. This variant isdescribed in the following. Let:
e(G′,G′′) =1
2|E ∪ E|
∑~vi∈tuples(G′,G′′)
si
be a measure of the strength of the edges considering objects in cluster G′ and objects in clusterG′′, where tuples(G′,G′′) is the set of tuples that can be built between objects of different typesbelonging to clusters G′ and G′′. Intuitively, we aim at clusters for which e(G′,G′) values aregenerally large and values e(G′,G′′),G′ , G′′ are generally small. Inspired by [32], we definethe Q-Modularity for the clusters obtained at a hierarchical level i as:
Qi =∑
G′∈Li
e(G′,G′) −∑
G′′∈Li
e(G′,G′′)
. (11)
As regards the classification task, we compare HENPC with four competitor systems which areable to work on data organized in a heterogeneous network. They are:
• MrSBC [6]9, which exploits the naıve Bayes classification method in the multi-relationalsetting.
• RelIBk [48], which is the multi-relational version of the k-NN algorithm and is availablein RelWeka10. As the distance measure, we adopt the Relational Instance-Based Learning(RIBL) measure [21].
• RelSMO [48], which is the multi-relational version of Platt’s Sequential Minimal Opti-mization algorithm [35] and is available in RelWeka10. This algorithm is based on kernelSupport Vector Machines and exploits the kernel Minkowski RIBL set distance [24].
• GNetMine [19], a graph-based regularization framework which aims at preserving the net-work structure of each type of link separately.
9www.di.uniba.it/~ceci/micFiles/systems/MURENA.html10kappa.arisco.pl/~adamw/home_page/rel_weka/
19

Note that MrSBC, RelIBk and RelSMO perform single-type classification, therefore we learna model and evaluate the results for each target type in the set T ∗t separately. Moreover, althoughGNetMine is, in principle, able to perform multi-type classification, it assumes that all the targettypes have the same classification scheme (i.e., the set of possible labels is common). We per-formed some preliminary experiments with GNetMine and discovered that this assumption leadsto very poor results when different classification schemes are assigned to different object types(as, for example, in the case of the dataset Yelp). Such a poor result is mainly due to the fact thatthe system assigns labels belonging to the classification scheme of a target type also to unlabelednodes of other target types. For this reason, also for GNetMine, in the following we report theresults obtained by learning a model for each target type in the set T ∗t separately.
We evaluate the classification performance according to the accuracy measure, which is de-fined, for each target type Tp ∈ T
∗t , as:
acc(Tp) =
∑Y∈Yp
T PY
|un(Vp)|, (12)
where T PY is the number of true positive examples for the class Y .For both clustering and classification, we average the results obtained with a stratified 10-fold
cross validation. For classification, we report the weighted (according to the number of classes)average results obtained on multiple target types.
As regards the parameters of HENPC, we set c = 3 (the number of considered shortest meta-paths), in order to guarantee that the best meta-paths are considered, and depth = 2 (for theaggregation of attribute values coming from connected nodes which do not appear in any meta-paths). As for the parameter β, since the distribution of scores can vary significantly amongdatasets, we compute the value of β such that we keep a given percentage of tuples. In particular,we consider 20%, 40% and 60% of tuples. This also allows us to evaluate how the accuracy ofthe results changes when the number of tuples increases. As regards the parameter α, we followthe recommendations in [33], where a similar merging approach is proposed: We set α = β−0.2.Finally, we set γ to the values {0.7, 0.8, 0.9}, which, according to some preliminary experiments,generally lead to the best results.
The parameters of the competitor systems have been set as follows. HOCCLUS2 requires twoparameters, i.e. α and β. Since they have a similar role with respect to α and β of HENPC (i.e.,a threshold on the merging procedure and a threshold on the edge weight), we set them to thesame values considered for HENPC. MrSBC, RelIBk and RelSMO require the parameter depth(maxPathLength in MrSBC), which is the maximum depth of analysis from the target nodes.Since its role is similar to that of the parameter depth of HENPC, we set it to the same value(i.e., 2). As for the parameter k of RelIBk (i.e., the number of nearest neighbors considered forthe classification), we consider the values {1, 3, 5}. Finally, GNetMine requires a weight for eachnode type and link type. We leave these weights to the default values, which assume that all nodetypes and link types have the same weight.
4.3. Results
In this section, we describe the results obtained by HENPC and the competitor systems on theconsidered datasets. First, we analyze the clustering results, which are reported in Table 1.
Overall, we focus on the first three hierarchical levels which appear, according to the clusteringand classification results, to be the most significant. We can observe that HENPC is always ableto identify at least three hierarchical levels for all the datasets, except for UWCSE. Moreover,
20

Table 1: Q-Modularity obtained by HOCCLUS2 and HENPC. Bold values indicate the best result obtained for a givendataset and a given percentage of considered instances. L1, L2 and L3 indicate the level of the hierarchy.
DBLP β: 20% β: 40% β: 60% WEBKB β: 20% β: 40% β: 60%HENPC L1 0.64840 0.60114 0.54510 HENPC L1 0.98684 0.77932 0.77937HENPC L2 0.64674 0.60423 0.54487 HENPC L2 0.97914 0.77868 0.77878HENPC L3 0.63536 0.60296 0.53310 HENPC L3 0.96622 0.77783 0.7773HOCCLUS2 L1 0.33482 0.07372 0.11779 HOCCLUS2 L1 0.19096 0.19096 0.19096HOCCLUS2 L2 N/A N/A N/A HOCCLUS2 L2 0.20774 0.20774 0.20774HOCCLUS2 L3 N/A N/A N/A HOCCLUS2 L3 0.21558 0.21558 0.21558
MOVIES β: 20% β: 40% β: 60% UWCSE β: 20% β: 40% β: 60%HENPC L1 0.90369 0.79598 0.74514 HENPC L1 0.99304 0.87153 0.79293HENPC L2 0.90279 0.79357 0.74093 HENPC L2 0.98818 0.85076 0.78142HENPC L3 0.89745 0.78821 0.73239 HENPC L3 N/A N/A N/AHOCCLUS2 L1 0.14783 0.10663 0.18794 HOCCLUS2 L1 0.38254 0.3701 0.36977HOCCLUS2 L2 0.19603 0.1518 0.24356 HOCCLUS2 L2 0.41279 0.40052 0.39647HOCCLUS2 L3 0.25359 0.20187 0.28913 HOCCLUS2 L3 0.42437 0.41169 0.40862
YELP β: 20% β: 40% β: 60% IMDB β: 20% β: 40% β: 60%HENPC L1 0.76875 0.77887 0.71998 HENPC L1 0.82422 0.77225 0.69099HENPC L2 0.80390 0.76771 0.70514 HENPC L2 0.79848 0.71135 0.65255HENPC L3 0.79622 0.73753 0.69806 HENPC L3 0.72499 0.66142 0.57746HOCCLUS2 L1 0.04046 0.17437 0.09984 HOCCLUS2 L1 0.15364 0.4175 0.37215HOCCLUS2 L2 0.05029 0.15234 0.07424 HOCCLUS2 L2 0.20782 0.47259 0.34343HOCCLUS2 L3 N/A N/A N/A HOCCLUS2 L3 0.24304 0.39406 0.20905
in some cases, the quality of the clusters obtained increases at the second level of the hierarchy,emphasizing that the merging procedure is able to improve the clustering results. However, itappears that, for the clustering task, the first hierarchical level is generally able to obtain the bestresults. On the other hand, HOCCLUS2 is not always able to identify at least three hierarchicallevels and, in general, the Q-Modularity obtained is significantly lower. This is possibly dueto the fact that, in some cases, HOCCLUS2 discards objects that are considered as noise andthus loses possibly significant links. As expected, Q-Modularity is higher for smaller values ofβ. This is somehow natural since Q-Modularity is higher when we only focus on tuples with ahigher strength of the relationship (scores).
In order to statistically compare HENPC with HOCCLUS2, we performed the Friedman testwith the Nemenyi post-hoc tests and, following the suggestions made in [10], we plot the graphswhich summarize the results in Figure 6. By observing the graphs, we can conclude that HENPCis able to significantly outperform the competitor in all the considered datasets, especially inthe case of the first and the second level of the hierarchy. This confirms that, even stopping thealgorithm at the first hierarchical level, the behavior of HENPC is robust, independently of theconsidered dataset.
In order to evaluate whether the clustering quality reflects on the classification accuracy, in Ta-ble 2, we report the accuracy values obtained by HENPC on the first three levels of the hierarchy,together with the results obtained by the competitor systems.
As can be observed from the table, HENPC outperforms all the competitors on the datasetsUWCSE and WEBKB, independently of the parameters and for almost all the hierarchical lev-els. In any case, clustering obtained at the first level of the hierarchy guarantees that HENPCoutperforms all the competitors in terms of classification accuracy.
As regards MOVIES, we can observe that HENPC, at the first level, obtains a result which21

DBLP WEBKB
MOVIES UWCSE
YELP IMDB
Figure 6: Results of the Nemenyi post-hoc test for the clustering task. Better algorithms are positioned on the right-handside, and those that do not significantly differ in performance (at p-value=0.05) are connected with a line. The level ofthe hierarchy is denoted with a subscript in the name of the algorithm.
is comparable to that of RelIBk and RelSMO, and outperforms MrSBC and GNetMine. Thisis possibly due to the RIBL similarity, which is able to capture similar network characteristicsconsidered by HENPC. On the dataset YELP, HENPC outperforms all the competitors both onsingle target types and on average, when at least 40% of the tuples are considered (i.e., β suchthat 40% of tuples is kept), whereas the accuracy degenerates when only 20% of tuples is kept.Moreover, also in this case, the best results are obtained at the first level of the hierarchy. Onthe dataset DBLP, HENPC outperforms all the competitors at the first level of the hierarchy,when we keep 40% of the tuples. In the other cases, MrSBC is able to obtain better results,probably because of the availability of features whose data distribution is profitably exploited bythe naıve Bayes approach. Finally, on the dataset IMDB, HENPC outperforms RelIBk, RelSMOand GNetMine on the first level of the hierarchy, but the best results are obtained by MrSBC,which possibly takes advantages of the availability of the node features.
22
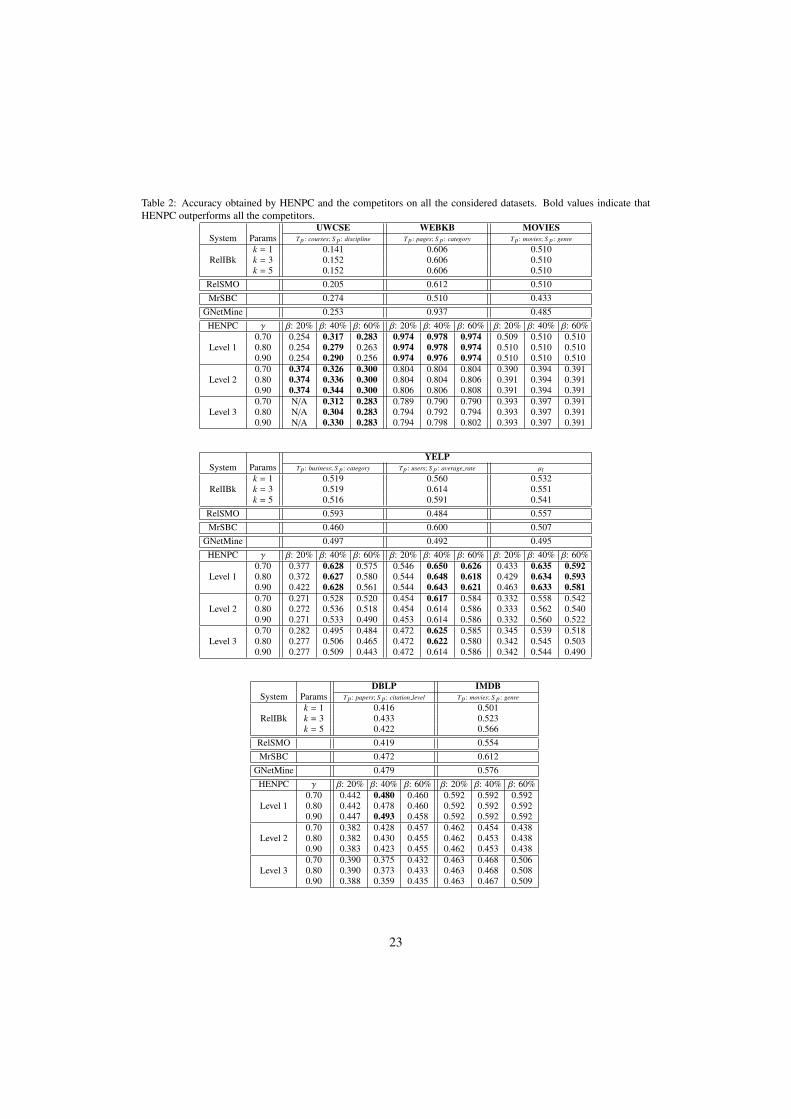
Table 2: Accuracy obtained by HENPC and the competitors on all the considered datasets. Bold values indicate thatHENPC outperforms all the competitors.
UWCSE WEBKB MOVIESSystem Params Tp : courses; S p : discipline Tp : pages; S p : category Tp : movies; S p : genre
k = 1 0.141 0.606 0.510RelIBk k = 3 0.152 0.606 0.510
k = 5 0.152 0.606 0.510RelSMO 0.205 0.612 0.510MrSBC 0.274 0.510 0.433
GNetMine 0.253 0.937 0.485HENPC γ β: 20% β: 40% β: 60% β: 20% β: 40% β: 60% β: 20% β: 40% β: 60%
0.70 0.254 0.317 0.283 0.974 0.978 0.974 0.509 0.510 0.510Level 1 0.80 0.254 0.279 0.263 0.974 0.978 0.974 0.510 0.510 0.510
0.90 0.254 0.290 0.256 0.974 0.976 0.974 0.510 0.510 0.5100.70 0.374 0.326 0.300 0.804 0.804 0.804 0.390 0.394 0.391
Level 2 0.80 0.374 0.336 0.300 0.804 0.804 0.806 0.391 0.394 0.3910.90 0.374 0.344 0.300 0.806 0.806 0.808 0.391 0.394 0.3910.70 N/A 0.312 0.283 0.789 0.790 0.790 0.393 0.397 0.391
Level 3 0.80 N/A 0.304 0.283 0.794 0.792 0.794 0.393 0.397 0.3910.90 N/A 0.330 0.283 0.794 0.798 0.802 0.393 0.397 0.391
YELPSystem Params Tp : business; S p : category Tp : users; S p : average rate µt
k = 1 0.519 0.560 0.532RelIBk k = 3 0.519 0.614 0.551
k = 5 0.516 0.591 0.541RelSMO 0.593 0.484 0.557MrSBC 0.460 0.600 0.507
GNetMine 0.497 0.492 0.495HENPC γ β: 20% β: 40% β: 60% β: 20% β: 40% β: 60% β: 20% β: 40% β: 60%
0.70 0.377 0.628 0.575 0.546 0.650 0.626 0.433 0.635 0.592Level 1 0.80 0.372 0.627 0.580 0.544 0.648 0.618 0.429 0.634 0.593
0.90 0.422 0.628 0.561 0.544 0.643 0.621 0.463 0.633 0.5810.70 0.271 0.528 0.520 0.454 0.617 0.584 0.332 0.558 0.542
Level 2 0.80 0.272 0.536 0.518 0.454 0.614 0.586 0.333 0.562 0.5400.90 0.271 0.533 0.490 0.453 0.614 0.586 0.332 0.560 0.5220.70 0.282 0.495 0.484 0.472 0.625 0.585 0.345 0.539 0.518
Level 3 0.80 0.277 0.506 0.465 0.472 0.622 0.580 0.342 0.545 0.5030.90 0.277 0.509 0.443 0.472 0.614 0.586 0.342 0.544 0.490
DBLP IMDBSystem Params Tp : papers; S p : citation level Tp : movies; S p : genre
k = 1 0.416 0.501RelIBk k = 3 0.433 0.523
k = 5 0.422 0.566RelSMO 0.419 0.554MrSBC 0.472 0.612
GNetMine 0.479 0.576HENPC γ β: 20% β: 40% β: 60% β: 20% β: 40% β: 60%
0.70 0.442 0.480 0.460 0.592 0.592 0.592Level 1 0.80 0.442 0.478 0.460 0.592 0.592 0.592
0.90 0.447 0.493 0.458 0.592 0.592 0.5920.70 0.382 0.428 0.457 0.462 0.454 0.438
Level 2 0.80 0.382 0.430 0.455 0.462 0.453 0.4380.90 0.383 0.423 0.455 0.462 0.453 0.4380.70 0.390 0.375 0.432 0.463 0.468 0.506
Level 3 0.80 0.390 0.373 0.433 0.463 0.468 0.5080.90 0.388 0.359 0.435 0.463 0.467 0.509
23

DBLP WEBKB
MOVIES UWCSE
YELP IMDB
Figure 7: Results of the Nemenyi post-hoc test for the classification task. Better algorithms are positioned on the right-hand side, and those that do not significantly differ in performance (at p-value=0.05) are connected with a line. Subscriptsdenote the level of the hierarchy.
24

Table 3: Average running times (in seconds) required by HENPC and competitors on all the considered datasets.RelIBk1 RelIBk3 RelIBk5 RelSMO MrSBC GNetMine HOCCLUS2 HENPC
DBLP 1.01 0.97 0.96 12.65 4.25 1.45 41.55 2.75WEBKB 123.12 123.29 123.75 2630.07 2.45 15.57 20.95 92.46MOVIES 601.47 595.41 605.52 2067.69 13.98 43.50 128.15 441.46UWCSE 0.16 0.16 0.15 3.88 1.50 0.62 2.12 3.74YELP 325.94 326.12 327.85 500.61 51.45 262.22 34.36 152.00IMDB 36.89 37.10 37.43 211.25 31.68 358.71 0.91 1.62
Overall, we can conclude that keeping 40% of tuples, HENPC provides the best classificationresults. Moreover, as regards the user-defined parameter γ, we can observe that the performancein the range of values examined can be considered comparable. However, by looking at theresults in the tables, it is clear that, in general, γ = 0.7 (which gives a weight of 0.7 to the auto-correlation that relates each target attribute with itself and a weight of 0.3 to the autocorrelationthat relates each target attribute with an independent attribute) leads to the best results.
Similarly to the analysis reported for the clustering task, also for the classification task weperformed the Friedman test with the Nemenyi post-hoc tests and plotted the graphs which sum-marize the results in Figure 7. As we can observe from the graphs, the first level of the hierarchyof HENPC leads to the most robust results over the considered datasets. In the case of the DBLPand IMDB datasets, the system MrSBC shows better results, but for DBLP the difference is notstatistically significant.
By comparing the clustering and classification results, we can conclude that there is a strongrelationship between the clustering quality, measured in terms of Q-Modularity, and the classifi-cation quality, measured in terms of accuracy. This result confirms one of the main assumptionwhich guided this work, that is: a strong relationship among a group of heterogeneous objectspossibly implies that their class values are correlated.
As a further evaluation, in Table 3 we report the average running time (in seconds) requiredby HENPC and competitor systems to analyze the considered datasets, on a machine with four3.5Ghz CPUs and 32GB of RAM. It is noteworthy that the comparison of running times shouldtake into account that HENPC solves both the clustering and the classification tasks, while HOC-CLUS2 solves only the clustering task and RelIBk, RelSMO, GNetMine and MrSBC solve onlythe classification task. From this table, we can observe that HENPC requires a comparable, andoften lower, running time with respect to RelIBk, RelSMO and GNetMine. However, if com-pared with MrSBC, HENPC genrally requires higher running time. This is in line with naıveBayesian approach implemented in MrSBC. However, in the three cases where MrSBC is fasterthan HENPC (WEBKB, MOVIES and YELP) the accuracy obtained by HENPC is significantlyhigher than that obtained by MrSBC (see Figure 7).
5. Conclusion
In this work, we consider the task of multi-type clustering and classification in heterogeneousnetworks, i.e. with multiple types of nodes and edges, organized in an arbitrary structure. In orderto perform this task, we propose the algorithm HENPC, which extracts hierarchically organized,possibly overlapping and heterogeneous clusters, and exploits them for predictive purposes. Theproposed algorithm is four-stepped: i) the identification of the strength of the relationships amongtarget nodes, which exploits the whole network structure; ii) the identification of an initial set ofheterogeneous clusters in the form of multi-type cliques; iii) the construction of a hierarchy of
25

heterogeneous clusters, which allows the algorithm to possibly catch autocorrelation phenomenaat different levels of granularity; iv) the identification of classification functions by exploiting theidentified clusters.
The experiments performed on real datasets show that HENPC is able to outperform competi-tors in terms of both clustering quality and classification accuracy. Moreover, we observed thepresence of a relationship between the clustering quality, measured in terms of Q-Modularity,and the classification quality, measured in terms of accuracy. This confirms the assumption thatthe identification of groups of strongly connected objects, even if they are heterogeneous, can beexploited to catch autocorrelation phenomena and possibly improve the classification accuracy.
For future work, we intend to investigate the possibility of extending HENPC to the inductivesemi-supervised setting (not only transductive). Moreover, we will consider the exploitation ofthe discovered heterogeneous clusters for the prediction of previously unknown links betweenobjects (heterogeneous link prediction).
Acknowledgments
We would like to acknowledge the support of the EU Commission through the project MAES-TRA - Learning from Massive, Incompletely annotated, and Structured Data (Grant numberICT-2013-612944). The authors wish to thank Lynn Rudd for her help in reading the manuscript.
References
[1] Angin, P., Neville, J., 2008. A shrinkage approach for modeling non-stationary relational autocorrelation, in: Proc.IEEE ICDM, IEEE Computer Society. pp. 707–712.
[2] Appice, A., Ceci, M., Malerba, D., 2009. An iterative learning algorithm for within-network regression in thetransductive setting, in: Proc. of Discovery Science, Springer. pp. 36–50.
[3] Barracchia, E.P., Pio, G., Malerba, D., Ceci, M., 2017. Identifying lncRNA-disease Relationships via Heteroge-neous Clustering, in: New Frontiers in Mining Complex Patterns - 6th International Workshop, NFMCP 2017,Held in Conjunction with ECML-PKDD 2017, Skopje (Macedonia).
[4] Bilgic, M., Getoor, L., 2008. Effective label acquisition for collective classification, in: Proc. 14th ACM SIGKDDIntl. Conf on Knowledge Discovery and Data Mining, ACM. pp. 43–51.
[5] Blockeel, H., De Raedt, L., Ramon, J., 1998. Top-down induction of clustering trees, in: Proc. 15th Intl. Conf. onMachine Learning, Morgan Kaufmann. pp. 55–63.
[6] Ceci, M., Appice, A., Malerba, D., 2003. Mr-SBC: a multi-relational naive bayes classifier, in: Knowledge Dis-covery in Databases: PKDD 2003. Springer, pp. 95–106.
[7] Ceci, M., Cuzzocrea, A., Malerba, D., 2015a. Effectively and efficiently supporting roll-up and drill-down OLAPoperations over continuous dimensions via hierarchical clustering. J. Intell. Inf. Syst. 44, 309–333.
[8] Ceci, M., Pio, G., Kuzmanovski, V., Dzeroski, S., 2015b. Semi-supervised multi-view learning for gene networkreconstruction. PLOS ONE 10, 1–27.
[9] Chuhay, R., 2010. Marketing via Friends: Strategic Diffusion of Information in Social Networks with Homophily.Technical Report 2010.118. Fondazione Eni Enrico Mattei.
[10] Demsar, J., 2006. Statistical comparisons of classifiers over multiple data sets. J. Mach. Learn. Res. 7, 1–30.[11] Desrosiers, C., Karypis, G., 2009. Within-network classification using local structure similarity, in: Proc. of ECML
PKDD 2009, Springer-Verlag, Berlin, Heidelberg. pp. 260–275.[12] Gallagher, B., Tong, H., Eliassi-Rad, T., Faloutsos, C., 2008. Using ghost edges for classification in sparsely
labeled networks, in: Proc. ACM SIGKDD, ACM. pp. 256–264.[13] Gao, B., Liu, T.Y., Zheng, X., Cheng, Q.S., Ma, W.Y., 2005. Consistent bipartite graph co-partitioning for star-
structured high-order heterogeneous data co-clustering, in: Proc. ACM SIGKDD, ACM, New York, NY, USA. pp.41–50.
[14] Grcar, M., Trdin, N., Lavrac, N., 2013. A methodology for mining document-enriched heterogeneous informationnetworks. Comput. J. 56, 321–335.
[15] Han, J., Kamber, M., Pei, J., 2006. Data Mining: Concepts and Techniques, Second Edition (The Morgan Kauf-mann Series in Data Management Systems). 2 ed., Morgan Kaufmann.
26

[16] Ienco, D., Robardet, C., Pensa, R., Meo, R., 2013. Parameter-less co-clustering for star-structured heterogeneousdata. Data Mining and Knowledge Discovery 26, 217–254.
[17] Jensen, D., Neville, J., Gallagher, B., 2004. Why collective inference improves relational classification, in: Proc.ACM SIGKDD, ACM. pp. 593–598.
[18] Ji, M., Han, J., Danilevsky, M., 2011. Ranking-based classification of heterogeneous information networks, in:Proc ACM SIGKDD, ACM, New York, NY, USA. pp. 1298–1306.
[19] Ji, M., Sun, Y., Danilevsky, M., Han, J., Gao, J., 2010. Graph regularized transductive classification on hetero-geneous information networks, in: Machine Learning and Knowledge Discovery in Databases. Springer BerlinHeidelberg. volume 6321 of LNCS, pp. 570–586.
[20] Kirsten, M., Wrabel, S., Horvath, T., 2000. Distance based approaches to relational learning and clustering, in:Dezeroski, S. (Ed.), Relational Data Mining. Springer-Verlag New York, Inc., New York, NY, USA, pp. 213–230.
[21] Kirsten, M., Wrobel, S., Horvath, T., 2001. Distance based approaches to relational learning and clustering, in:Relational data mining. Springer, pp. 213–232.
[22] Kong, X., Cao, B., Yu, P.S., Ding, Y., Wild, D.J., 2013. Meta path-based collective classification in heterogeneousinformation networks. CoRR abs/1305.4433.
[23] Kong, X., Shi, X., Yu, P.S., 2011. Multi-label collective classification, in: Proc. of SIAM SDM 2011, SIAM /
Omnipress. pp. 618–629.[24] Kruskal, J.B., 1964. Multidimensional scaling by optimizing goodness of fit to a nonmetric hypothesis. Psychome-
trika 29, 1–27.[25] Li, T., Anand, S.S., 2008. Hirel: An incremental clustering algorithm for relational datasets, in: ICDM, IEEE
Computer Society. pp. 887–892.[26] Long, B., Zhang, Z.M., Wu, X., Yu, P.S., 2006. Spectral clustering for multi-type relational data, in: Proceedings
of the 23rd international conference on Machine learning, ACM, New York, NY, USA. pp. 585–592.[27] Lu, Q., Getoor, L., 2003. Link-based classification, in: Fawcett, T., Mishra, N. (Eds.), Machine Learning, Proceed-
ings of the Twentieth International Conference (ICML 2003), August 21-24, 2003, Washington, DC, USA, AAAIPress. pp. 496–503.
[28] Macskassy, S.A., Provost, F., 2007. Classification in networked data: A toolkit and a univariate case study. J.Mach. Learn. Res. 8, 935–983.
[29] McPherson, M., Smith-Lovin, L., Cook, J., 2001. Birds of a feather: Homophily in social networks. AnnualReview of Sociology 27, 415–444.
[30] Neville, J., Adler, M., Jensen, D.D., 2003. Clustering relational data using attribute and link information, in:Proceedings of the Workshop on Text Mining and Link Analysis, Eighteenth International Joint Conference onArtificial Intelligence, Acapulco, Mexico.
[31] Newman, M., Barabasi, A.L., Watts, D.J., 2006. The Structure and Dynamics of Networks: (Princeton Studies inComplexity). Princeton University Press, Princeton, NJ, USA.
[32] Newman, M.E.J., 2006. Modularity and community structure in networks. Proceedings of the National Academyof Sciences 103, 8577–8582.
[33] Pio, G., Ceci, M., D’Elia, D., Loglisci, C., Malerba, D., 2013. A Novel Biclustering Algorithm for the Discoveryof Meaningful Biological Correlations between microRNAs and their Target Genes. BMC Bioinformatics 14, S8.
[34] Pio, G., Ceci, M., Malerba, D., D’Elia, D., 2015. ComiRNet: a web-based system for the analysis of miRNA-generegulatory networks. BMC Bioinformatics 16, S7.
[35] Platt, J., 1998. Fast training of support vector machines using sequential minimal optimization, in: Advances inKernel Methods - Support Vector Learning. MIT Press.
[36] Raedt, L.D., Lavrac, N., 1996. Multiple predicate learning in two inductive logic programming settings. LogicJournal of the IGPL 4, 227–254.
[37] Rahmani, H., Blockeel, H., Bender, A., 2010. Predicting the functions of proteins in protein-protein interactionnetworks from global information. Journal of Machine Learning Research 8, 82–97.
[38] Saha, T., Rangwala, H., Domeniconi, C., 2012. Multi-label collective classification using adaptive neighborhoods,in: Prof of ICMLA 2012. Volume 1, IEEE. pp. 427–432.
[39] Sen, P., Namata, G., Bilgic, M., Getoor, L., Gallagher, B., Eliassi-Rad, T., 2008. Collective classification in networkdata. AI Magazine 29:3, 93–106.
[40] Steinhaeuser, K., Chawla, N.V., Ganguly, A.R., 2011. Complex networks as a unified framework for descriptiveanalysis and predictive modeling in climate science. Statistical Analysis and Data Mining 4, 497–511.
[41] Stojanova, D., Ceci, M., Appice, A., Dzeroski, S., 2012. Network regression with predictive clustering trees. DataMin. Knowl. Discov. 25, 378–413.
[42] Stojanova, D., Ceci, M., Malerba, D., Dzeroski, S., 2013. Using PPI network autocorrelation in hierarchical multi-label classification trees for gene function prediction. BMC Bioinformatics 14, 285.
[43] Sun, Y., Aggarwal, C.C., Han, J., 2012. Relation strength-aware clustering of heterogeneous information networkswith incomplete attributes. Proc. VLDB Endow. 5, 394–405.
27

[44] Sun, Y., Han, J., Zhao, P., Yin, Z., Cheng, H., Wu, T., 2009a. RankClus: integrating clustering with ranking forheterogeneous information network analysis, in: Proc of EDBT 2009, ACM, New York, NY, USA. pp. 565–576.
[45] Sun, Y., Yu, Y., Han, J., 2009b. Ranking-based clustering of heterogeneous information networks with star networkschema, in: Proc of SIGKDD 2009, ACM, New York. pp. 797–806.
[46] Vandic, D., van Dam, J.W., Frasincar, F., 2012. A semantic-based approach for searching and browsing tag spaces.Decision Support Systems 54, 644 – 654.
[47] Wang, J., Zeng, H., Chen, Z., Lu, H., Tao, L., Ma, W.Y., 2003. ReCoM: reinforcement clustering of multi-typeinterrelated data objects, in: Proc of SIGIR 2003, ACM, New York. pp. 274–281.
[48] Woznica, A., Kalousis, A., Hilario, M., 2007. Learning to combine distances for complex representations, in:Machine Learning, Proc ICML 2007, pp. 1031–1038.
[49] Yin, X., Han, J., Yu, P.S., 2006. LinkClus: efficient clustering via heterogeneous semantic links, in: Proc of VLDB2006, VLDB Endowment. pp. 427–438.
[50] Yin, X., Han, J., Yu, P.S., 2007. Crossclus: user-guided multi-relational clustering. Data Min. Knowl. Discov. 15,321–348.
[51] Zhou, D., Bousquet, O., Lal, T.N., Weston, J., Scholkopf, P.B., 2004. Learning with local and global consistency,in: Thrun, S., Saul, L.K., Scholkopf, P.B. (Eds.), Advances in Neural Information Processing Systems 16. MITPress, pp. 321–328.
[52] Zhu, X., Ghahramani, Z., Lafferty, J.D., 2003. Semi-supervised learning using gaussian fields and harmonic func-tions, in: Proc. 20th Intl. Conf. on Machine Learning, AAAI Press. pp. 912–919.
28
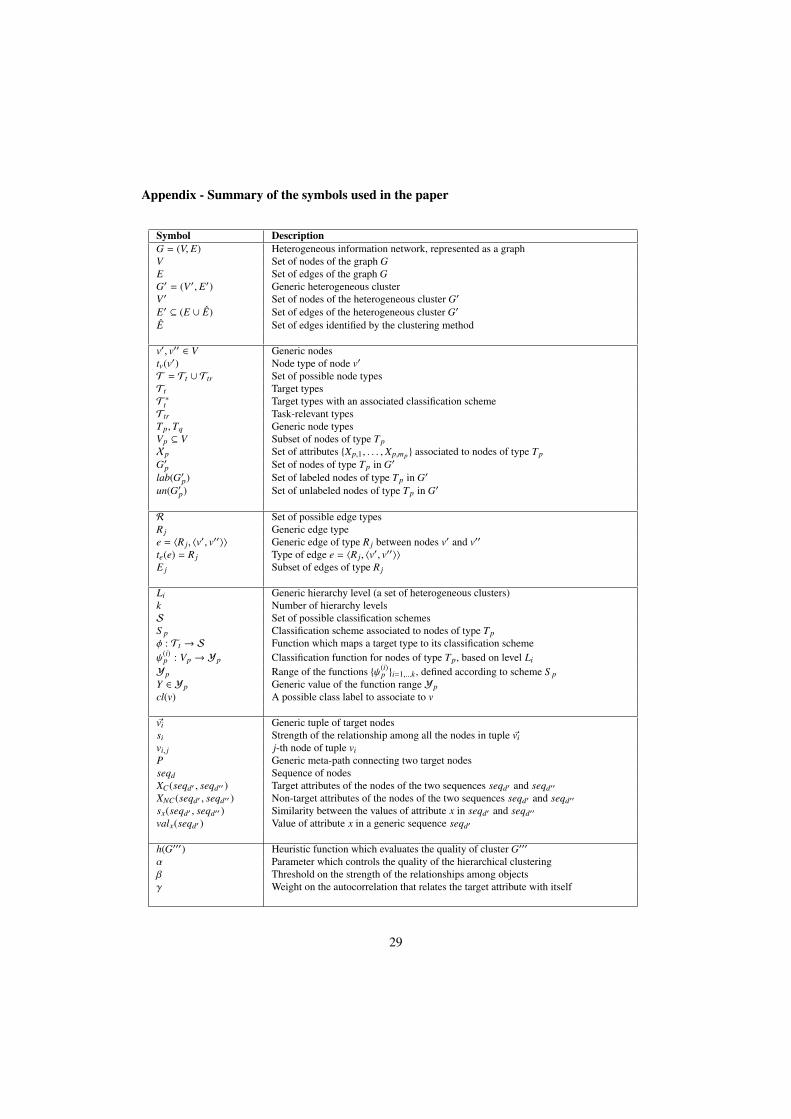
Appendix - Summary of the symbols used in the paper
Symbol DescriptionG = (V, E) Heterogeneous information network, represented as a graphV Set of nodes of the graph GE Set of edges of the graph GG′ = (V′, E′) Generic heterogeneous clusterV′ Set of nodes of the heterogeneous cluster G′
E′ ⊆ (E ∪ E) Set of edges of the heterogeneous cluster G′
E Set of edges identified by the clustering method
v′, v′′ ∈ V Generic nodestv(v′) Node type of node v′
T = Tt ∪ Ttr Set of possible node typesTt Target typesT ∗t Target types with an associated classification schemeTtr Task-relevant typesTp,Tq Generic node typesVp ⊆ V Subset of nodes of type TpXp Set of attributes {Xp,1, . . . , Xp,mp } associated to nodes of type TpG′p Set of nodes of type Tp in G′
lab(G′p) Set of labeled nodes of type Tp in G′
un(G′p) Set of unlabeled nodes of type Tp in G′
R Set of possible edge typesR j Generic edge typee = 〈R j, 〈v′, v′′〉〉 Generic edge of type R j between nodes v′ and v′′
te(e) = R j Type of edge e = 〈R j, 〈v′, v′′〉〉E j Subset of edges of type R j
Li Generic hierarchy level (a set of heterogeneous clusters)k Number of hierarchy levelsS Set of possible classification schemesS p Classification scheme associated to nodes of type Tpφ : Tt → S Function which maps a target type to its classification schemeψ(i)
p : Vp → Yp Classification function for nodes of type Tp, based on level Li
Yp Range of the functions {ψ(i)p }i=1,...k , defined according to scheme S p
Y ∈ Yp Generic value of the function range Ypcl(v) A possible class label to associate to v
~vi Generic tuple of target nodessi Strength of the relationship among all the nodes in tuple ~vivi, j j-th node of tuple viP Generic meta-path connecting two target nodesseqd Sequence of nodesXC(seqd′ , seqd′′ ) Target attributes of the nodes of the two sequences seqd′ and seqd′′
XNC(seqd′ , seqd′′ ) Non-target attributes of the nodes of the two sequences seqd′ and seqd′′
sx(seqd′ , seqd′′ ) Similarity between the values of attribute x in seqd′ and seqd′′
valx(seqd′ ) Value of attribute x in a generic sequence seqd′
h(G′′′) Heuristic function which evaluates the quality of cluster G′′′
α Parameter which controls the quality of the hierarchical clusteringβ Threshold on the strength of the relationships among objectsγ Weight on the autocorrelation that relates the target attribute with itself
29


![Model-Based Clustering and Classification of Functional Data · 2018-03-05 · arXiv:1803.00276v2 [stat.ML] 2 Mar 2018 Model-Based Clustering and Classification of Functional Data](https://static.fdocuments.in/doc/165x107/5e629ed37653e94e3a45f854/model-based-clustering-and-classiication-of-functional-data-2018-03-05-arxiv180300276v2.jpg)