
Multi-technique investigation of calcium hydroxide ...
12
Multi-technique investigation of calcium hydroxide crystals at the concrete surface E. Gueit 1 , E. Darque-Ceretti 1 , P. Tintillier 2 & M. Horgnies 2 1 MINES ParisTech, Center for Material Forming, Sophia Antipolis, France 2 Lafarge Centre de Recherche, St Quentin Fallavier, France Abstract The durability and aesthetic qualities of high-performance concrete, which makes it particularly suitable for architectural applications, are constantly compromised by environmental aggressions. In this study, an innovative solution was developed to protect the concrete from these aggressions, which consists of growing a mineral coating on the concrete surface. The coating is composed of layered calcium hydroxide crystals, whose nucleation and growth are triggered byvarious non-ionic surfactants (the details of the process will not be presented). This paper describes the procedure used to investigate the structure of the formed crystals. Scanning Electron Microscopy and optical microtopography were used to determine the morphology of the crystals. Image analysis allowed the quantification of their amount, size and shape. The contribution and limits of each technique are discussed. Keywords: concrete, scanning electron microscopy, image analysis, optical microtopography, surface. 1 Introduction The mechanical and aesthetic durability of concrete is often compromised by the constant environmental aggressions to which the structures are exposed (organic or inorganic particles, algae, micro-organisms, staining from various sources). It is possible to protect concrete from these attacks and increase its durability by applying organic coatings on the hardened surface, but this comes with operational and environmental costs. Materials Characterisation V 15 www.witpress.com, ISSN 1743-3533 (on-line) WIT Transactions on Engineering Sciences, Vol 72, © 2011 WIT Press doi:10.2495/MC110021
Transcript of Multi-technique investigation of calcium hydroxide ...

Multi-technique investigation of calcium hydroxide crystals at the concrete surface
E. Gueit1, E. Darque-Ceretti1, P. Tintillier2 & M. Horgnies2 1MINES ParisTech, Center for Material Forming, Sophia Antipolis, France 2Lafarge Centre de Recherche, St Quentin Fallavier, France
Abstract
The durability and aesthetic qualities of high-performance concrete, which makes it particularly suitable for architectural applications, are constantly compromised by environmental aggressions. In this study, an innovative solution was developed to protect the concrete from these aggressions, which consists of growing a mineral coating on the concrete surface. The coating is composed of layered calcium hydroxide crystals, whose nucleation and growth are triggered byvarious non-ionic surfactants (the details of the process will not be presented). This paper describes the procedure used to investigate the structure of the formed crystals. Scanning Electron Microscopy and optical microtopography were used to determine the morphology of the crystals. Image analysis allowed the quantification of their amount, size and shape. The contribution and limits of each technique are discussed. Keywords: concrete, scanning electron microscopy, image analysis, optical microtopography, surface.
1 Introduction
The mechanical and aesthetic durability of concrete is often compromised by the constant environmental aggressions to which the structures are exposed (organic or inorganic particles, algae, micro-organisms, staining from various sources). It is possible to protect concrete from these attacks and increase its durability by applying organic coatings on the hardened surface, but this comes with operational and environmental costs.
Materials Characterisation V 15
www.witpress.com, ISSN 1743-3533 (on-line) WIT Transactions on Engineering Sciences, Vol 72, © 2011 WIT Press
doi:10.2495/MC110021
An innovative solution was proposed [1], which consists on covering and protecting high-performance concrete (HPC) with a mineral coating made of calcium hydroxide crystals (CH). The crystals growth happens during the concrete setting and is triggered by the presence of non-ionic surfactants at the concrete/formwork interface. One of the difficulties of this study was to determine the adequate characterization methods to properly investigate the influence of various surfactants on the amount, morphology and size of the crystals. Several techniques exist to observe, measure and study concrete hydrates, but not all of them are directly suitable for surface investigation. An original procedure had to be developed, combining several techniques. The structure and morphology of the crystals were assessed through Scanning Electron Microscopy (SEM) both on the concrete surface and on polished section. The SEM observations were completed by microtopography on the concrete surface. The quantification of the amount and size of the crystals was made by image analysis on binocular images of the concrete surface. The purpose of this paper is to illustrate what each of these techniques can bring to concrete surface studies.
2 Morphology of the crystals
The most common method to observe concrete hydrates morphology is Scanning Electron Microscopy [2]. Most of the time, the observations are made on polished section in secondary electron mode. When higher magnifications or no polishing are required, fresh fractures can also be observed. Surprisingly, it is very rare to find published picture of concrete surface directly observed by SEM. In this study, SEM observations were conducted on both surfaces and cross-sections of the concrete. Small cubes (1 cm x 1 cm x 1 cm) were cut from each concrete sample. For surface observation, the cubes were directly carbon-coated on the adequate face and observed in secondary electron mode. For cross-sections observations, the cubes were impregnated, polished and carbon-coated, and then observed in back-scattered electron mode. A SEM FEG Quanta 400 from FEI Company was used at an accelerating voltage of 15kV and current intensity of 1mA.
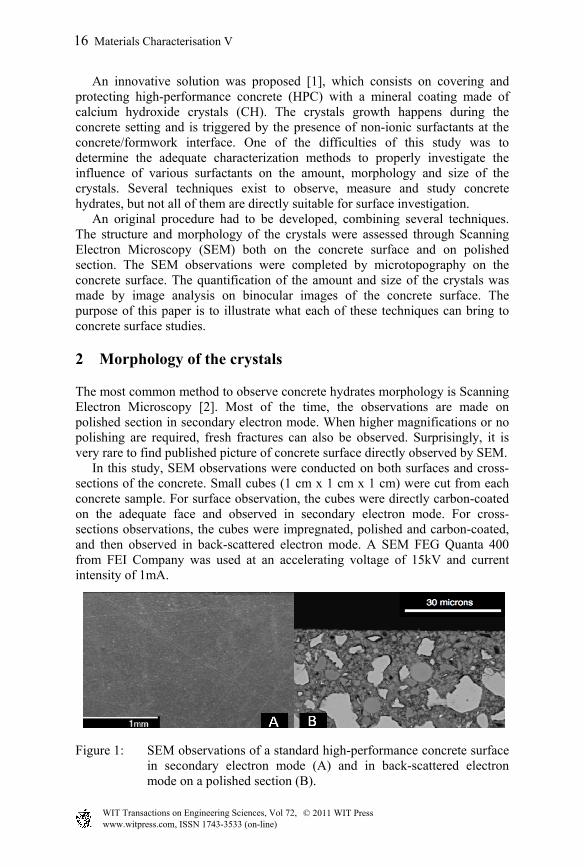
Figure 1: SEM observations of a standard high-performance concrete surface in secondary electron mode (A) and in back-scattered electron mode on a polished section (B).
16 Materials Characterisation V
www.witpress.com, ISSN 1743-3533 (on-line) WIT Transactions on Engineering Sciences, Vol 72, © 2011 WIT Press

Figure 1 shows observations of both the surface (A) and the cross-section (B) of a standard high-performance concrete. No specific features are visible on the surface, except for a couple of scratch due to the formwork defects. As for the polished section, it reveals a classical concrete microstructure, with dark grey aggregates and light grey un-hydrated cement grains surrounded by cement paste. Figure 2 shows SEM observation of two cross-sections from two different samples. These observations reveal the presence at the concrete surface of a thin layered structure presenting various orientations and organization, sometimes well-aligned parallel to the surface (A), sometimes arranged in a more chaotic way in the first micrometers of the surface (B). At this level of observation, it is not possible to clearly indentify the nature of this unexpected phase. The limited magnification in back-scattered mode, the thin structure of the hydrates and the surface damages due to the polishing all complicate the interpretation. This is why it is necessary to make complementary observations of the surface itself.
Figure 2: SEM observation in back-scattered electron mode of two polished sections from two different concrete samples from the study.
Figure 3 shows the same samples as figure 2 observed from the surface in secondary electron mode. These micrographs allow a better understanding of the structure of the crystals. All of them share the same layered and flaky structure with different orientations. In all cases, the crystals are composed of thin leaves that grow around the nucleation point. For some crystals, these leaves are strictly parallel to the surface and grow as ‘flower petals’ around the central point, reaching sometimes a perfect hexagonal shape. For other crystals, the leaves are strictly perpendicular to the surface, forming a very regular spherulitic structure. This very organized structure was not visible on the polished sections, where the leaves appeared randomly implanted in the surface. This is due to the polishing, which damaged the first micrometers of the surface and disturbed the structure. The characteristic hexagonal shape of the crystals, as well as their layered organization, allow identifying them as calcium hydroxide – no other concrete phase would present this morphology. This is confirmed by EDS analysis, where mostly calcium is detected is these areas (spectrum not showed).
Materials Characterisation V 17
www.witpress.com, ISSN 1743-3533 (on-line) WIT Transactions on Engineering Sciences, Vol 72, © 2011 WIT Press

Figure 3: SEM observation in secondary electron mode of the surface of two different samples from the study.
3 Amount and size of the crystals
3.1 Microtopography
SEM observations were very useful to highlight the presence of an unusual phase and to identify it as CH crystals, but they are not sufficient to get a complete insight on the structure of the crystals. Even though the secondary electrons give information on the surface topography, it is difficult to evaluate from the micrographs how thick the crystals are or how deep they are embedded in the surface. As for the polished section, the crystals layers are too strongly delaminated by the polishing for the observation to be conclusive. This is why the observations were completed with profilometry of the surface. Mechanical and optical profilometry are sometimes used on concrete to assess its roughness and evaluate its behavior regarding adhesion problems [3–5]. In our case, the measurements were made using optical profilometry only, because a mechanical probe is likely to damage the very fragile CH crystals. The measurements were made on a confocal full-field 3D surface profilometer with a spot of 2 micrometers and a working distance of 4.5 mm. In these conditions, the vertical resolution is 0.01 micrometers and the lateral resolution 0.1 micrometer. Areas of 4 x 4 mm² were scanned with a step of 10micrometer. The data were computed using the software MountainsMap. In the examples given below, there were only two steps of data treatments: the maps were straightened to compensate for the horizontality defects, and profiles were extracted. Figure 4 shows an example of profilometry on a sample where the crystals are oriented preferentially parallel to the surface. Two patterns appear on the 2D mapping: regular and slightly curved lines, which are due the formwork texture, and irregular spots, which are the CH crystals. Below the mapping is a roughness profile extracted along the dotted line. The narrow peaks correspond to the lines, the larger one at 1.7 mm corresponds to the CH crystal in the middle. The profile allows measuring the size of the crystal (400 micrometers) and the height between the concrete surface and the top of crystal (5 micrometers).
18 Materials Characterisation V
www.witpress.com, ISSN 1743-3533 (on-line) WIT Transactions on Engineering Sciences, Vol 72, © 2011 WIT Press

Figure 4: Example of a mapping of the concrete surface. The profile was extracted from the mapping along the black dotted line.
Figure 5: Example of a mapping of the concrete surface. The profile was extracted from the mapping along the black dotted line.
Materials Characterisation V 19
www.witpress.com, ISSN 1743-3533 (on-line) WIT Transactions on Engineering Sciences, Vol 72, © 2011 WIT Press

The same measurements can be made of figure 5. The mapping was acquired on the same sample, but in an area were the CH crystals have been pulled out of the surface during the demoulding phase, leaving hollows the size of the crystals. The depth of the hollows gives the height between the surface and the bottom of the crystals. The measurements from figures 4 and 5 give an estimation for the total thickness of the crystals of 20 micrometers. Of course, the operation has to be repeated a large number of times to obtain statistical results. This is only one example taken from one of the samples. It should be noted that profilometry gives no conclusive information for the samples where the crystals are oriented perpendicular to the surface. Figure 6 shows a mapping of such a sample (A): the spherulitic structures appear slightly lighter than the surface, but are difficult to distinguish. A zoom on the mapping (B) reveals that the crystals are indeed apparent, but that the resolution is far from being sufficient to separate the different flakes composing the structure.
Figure 6: Example of a mapping from a sample with perpendicular crystals. The 3D mapping on the right is a zoom from the 2D mapping on the left.
3.2 Image analysis
The only way to know the amount of CH crystals as well as their dimension and geometrical parameters is to count and measure them one by one. Image analysis software are capable of automatically achieve this procedure on a large number of images, provided that they are correctly settled by the operator. Image analysis has been successfully used in previous studies [2, 6] to assess the amount of calcium hydroxide in concrete as well as the geometrical parameters of the particles (size, shape, etc.). In those cases, image analysis was conducted on SEM micrographs from polished sections. In our case, there is no need to work on sections as the crystals are on the concrete surface. Furthermore, the crystals are so large that SEM micrographs are not suitable for a proper counting. Even at low magnification, there are too few particles in the observation field. On the contrary, images taken under a binocular have the right scale to count and measure the particles.
20 Materials Characterisation V
www.witpress.com, ISSN 1743-3533 (on-line) WIT Transactions on Engineering Sciences, Vol 72, © 2011 WIT Press

The CH crystals are shinier than the cement paste, which makes them visible with the naked eye, but this is not sufficient for image analysis software to distinguish them. To overcome this problem, the samples were coloured with a black felt-tip pen prior to analysis. The black ink penetrates the cement paste, strongly colouring it, but is not absorbed by the crystals which then become clearly distinguishable. For each concrete samples, five small areas of the surface (1 cm2) were coloured and photographed under a binocular. The images were treated and analysed using the open-source software ImageJ [7]. The most difficult step in image analysis is to separate the studied particles from the background. In our case, the following procedure was used. Figure 7 shows an example of an image prior to treatment. The brightness and contrast of the images were optimized using the automatic function on the software. The optimization was not based on the whole image, but on the histogram analysis of a small area of one of the particle on the image. This step created a highly contrasted image where particles appeared red and the background black (figure 8).
Figure 7: Example of an image before treatment by the software imageJ.
Figure 8: Example of an image after optimization of the contrast and brightness.
Materials Characterisation V 21
www.witpress.com, ISSN 1743-3533 (on-line) WIT Transactions on Engineering Sciences, Vol 72, © 2011 WIT Press

The noise was removed using the ‘remove outliers’ function of the software, which replaces each pixel by the median value of its neighbours in a given area (figure 9). In this case, a radius of 20 pixels was considered, and the removing was set to occur if the difference between the considered pixel and the median of its neighbour was higher than 10.
Figure 9: Example of an image after noise removal.
The images were then converted to binary and inverted. At this point, the background appeared white and the particles black (figure 10).
Figure 10: Example of an image after conversion to binary.
The holes in the particles were closed using the ‘Fill holes’ function of the software (figure 11). Finally, the ‘watershed’ function was used to automatically draw the outlines of the particles (figure 12). This step might be the main cause of errors in the measurements, as watershed segmentation works best for convex objects that do not overlap too much. In some cases, the software was not able to correctly separate clusters of particles, which were then counted as one big particle.
22 Materials Characterisation V
www.witpress.com, ISSN 1743-3533 (on-line) WIT Transactions on Engineering Sciences, Vol 72, © 2011 WIT Press

Figure 11: Example of an image after filling the holes.
Figure 12: Example of an image after the software automatically delimited the particles.
Once the image was treated, the particles were counted one by one. The smallest ones (with a surface smaller than 0.1 mm²) were not considered as they are more likely residual noise than actual crystals. The particles overlapping with the boarder of the image were not considered either as their size would not be correctly measured. This means than the measured amount of crystals (from 1 to 20 particles per mm² depending on the samples) is slightly smaller than reality. The following parameters were measured for each particle:
- The coordinates of the centre of the particles. These coordinates were used to calculate the distance between each crystal and its closest neighbour and to verify that the nucleation appeared randomly and homogeneously on the surface (figure 13).
- The Feret’s diameter, which is the longest distance between two opposing points of the particle.
- The fraction area of the surface covered by the crystals. As these crystals are artificially grown to act as a mineral coating, this fraction area must be as high as possible. The results showed that even if the crystals seemed very large, they hardly cover 50% of the surface, except in one promising case where almost 100% of the surface was coated.
Materials Characterisation V 23
www.witpress.com, ISSN 1743-3533 (on-line) WIT Transactions on Engineering Sciences, Vol 72, © 2011 WIT Press

- The circularity of the particle, which is defined by 4.area / perimeter². A perfect circle has a circularity of 1, whereas a very elongated particle has a circularity close to 0 (figure 14). This geometrical parameter is very convenient to distinguish the crystals that grow parallel to the surface with regular shapes (high circularity) from the crystals that grow perpendicular to the surface, which have a low circularity.
Figure 13: Example of spatial distribution of the particles on the concrete surface, showing that the nucleation occurs rather homogeneously on the surface.
Figure 14: Two examples of the circularity distribution. The curve marked with squares corresponds to a sample where the crystals have a low circularity because they grow perpendicular to the surface. The curve marked with dots corresponds to a sample where the crystals have a high circularity because they grow parallel to the surface and adopt very regular shapes.
24 Materials Characterisation V
www.witpress.com, ISSN 1743-3533 (on-line) WIT Transactions on Engineering Sciences, Vol 72, © 2011 WIT Press

The results of the image analysis allowed a better understanding of the influence of various surfactants on the nucleation (amount of particles) and growth (size and orientation of the particles) of the CH crystals. Two types of sample could not be properly analyzed though, one because it exhibited excessive roughness that induced too much background noise on the images, and one because the crystals overlapped too much to be clearly separated. In those cases, a more sophisticated procedure has to be developed. In particular, software capable of separating overlapping particles exists, but they were not tested yet in this study.
4 Conclusion
Three techniques – scanning electron microscopy, microtopography and image analysis – were successfully used to assess the morphology and geometrical parameters of calcium hydroxide crystals at the concrete surface. These techniques are well-known and developed, but not necessarily widely used in concrete research. Yet, they have proved very efficient in this case to make a preliminary study of a new phenomenon – the massive growth of CH crystals in presence of surfactants, bringing complementary information and results. Of course, they absolutely do not make further investigation any less necessary. For example, a proper crystallographic study would be essential to fully understand the growing mechanisms and the action of the surfactants. In the field of materials characterization, it is important to be creative and to combine and adapt existing techniques. This is particularly true in the field of concrete research, and even more when it comes to concrete surface, a topic which is slowly emerging and where a lot of fascinating research still waits to be done.
References
[1] Gueit, E., Darque-Ceretti, E., Tintillier, P. & Horgnies, M., Surfactant-induced growth of calcium hydroxide at the concrete/formwork interface as a mineral coating for concrete, Manuscript submitted for publication.
[2] Skalny, J., Gebauer, I. & Odler, I., (eds). Calcium Hydroxide in Concrete, The American Ceramic Society: Westerville, 2001.
[3] Garbacz, A., Courard, L., & Kostana, K., Characterization of concrete surface roughness and its relation to adhesion in repair systems, Materials Characterization, 56, pp. 281-289, 2006.
[4] PER09 Perez, F., Bissonette, B. & Courard, L., Combination of mechanical and optical profilometry techniques for concrete surface roughness characterisation. Magazine of Concrete Research, 61(6), pp. 389-400, 2009.
[5] Ramirez, A.M., Demeestere, K., De Belie, N., Mäntylä, T., & Levänen, E, Titanium dioxide coated cementitious materials for air purifying purposes: Preparation, characterization and toluene removal potential, Building and Environment, 45, pp. 832-838, 2010.
Materials Characterisation V 25
www.witpress.com, ISSN 1743-3533 (on-line) WIT Transactions on Engineering Sciences, Vol 72, © 2011 WIT Press

[6] Gallucci, E. & Scrivener, K., Crystallisation of calcium hydroxide in early model and ordinary cementitious systems, Cement andConcrete Reseach,37, pp. 492-501, 2007.
[7] NIH, http:\\rsbweb.nih.gov/ij
26 Materials Characterisation V
www.witpress.com, ISSN 1743-3533 (on-line) WIT Transactions on Engineering Sciences, Vol 72, © 2011 WIT Press