Multi-station basis for Polar Cap (PC) indices: ensuring ... · PC radius for effective PCN index...
14
Developing New Space Weather Tools: Transitioning fundamental science to operational prediction systems RESEARCH ARTICLE Multi-station basis for Polar Cap (PC) indices: ensuring credibility and operational reliability Peter Stauning * Danish Meteorological Institute (DMI), Lyngbyvej 100, 2100 Copenhagen, Denmark Received 22 May 2017 / Accepted 23 November 2017 Abstract – The Polar Cap (PC) indices, PCN (North) and PCS (South) are based on polar geomagnetic observations from Qaanaaq (Thule) and Vostok, respectively, processed to measure the transpolar plasma convection that may seriously affect space weather conditions. To establish reliable space weather forecasts based on PC indices, and also to ensure credibility of their use for scientific analyses of solar wind- magnetosphere interactions, additional sources of data for the PC indices are investigated. In the search for alternative index sources, objective quality criteria are established here to be used for the selection among potential candidates. These criteria are applied to existing PC index series to establish a quality scale. In the Canadian region, the data from Resolute Bay magnetometer are shown to provide alternative PCN indices of adequate quality. In Antarctica, the data from Concordia Dome-C observatory are shown to provide basis for alternative PCS indices. In examples to document the usefulness of these alternative index sources it is shown that PCN indices in a real-time version based on magnetometer data from Resolute Bay could have given 6 h of early warning, of which the last 2 h were “red alert”, up to the onset of the strong substorm event on 13 March 1989 that caused power outage in Quebec. The alternative PCS indices based on data from Dome-C have helped to disclose that presently available Vostok-based PCS index values are corrupted throughout most of 2011. Keywords: Space Weather / ionosphere (polar) / magnetosphere / solar wind / magnetic field 1 Introduction The transpolar plasma convection over the magnetically open PCs presents a direct indication of the cross-PC electric fields created by the interaction of the solar wind with the Earth's magnetosphere that is considered responsible for major magnetic disturbances such as magnetic storms and substorms. At large altitudes the positive ions and the electrons are drifting together in this field and produce no net current. The drifting positive ions are stopped by collisions with the neutrals at heights around 100 km (E-region), while the electrons continue their drift further down thus providing a resulting electric current (Hall current) opposite of the convective drift. Hence, the convection intensity and direction could be monitored at ground level by observations of the transverse magnetic variations generated by the related ionospheric electric currents. In order to provide a consistent measure of the transpolar convection, the PC index concept was proposed by Troshichev and Andrezen (1985) and further developed by Troshichev et al. (1988, 2006) and Vennerstrøm (1991). The standard PC indices, PCN (North) and PCS (South), are based on 1 min samples of geomagnetic data from Qaanaaq and Vostok, respectively. The data are processed to reflect the transpolar convection that may carry plasma and magnetic fields from the front of the magnetosphere to the tail region building up excess energy that subsequently could be released in magnetic storm and substorm activity, which in turn could endanger power grids and other vital community systems. The PC indices have proven useful for a range of space weather-related investigations and analyses of solar wind- magnetosphere interactions. Thus, the PC indices have been used to monitor interplanetary geoeffective electric fields and solar wind pressure pulses, to analyze cross PC voltages, PC diameter, and general PC dynamics. Furthermore, the PC indices have been used to monitor auroral electrojet intensities, ionospheric Joule heating, global auroral power, and to predict ring current intensities (cf. Stauning, 2012; Troshichev and Janzhura, 2012, and references therein). Power grids near the auroral zone are vulnerable to geomagnetically induced currents caused by variations in the magnetic field, in particular, the large and rapid variations associated with the explosive phase of strong substorms. *Corresponding author: [email protected] J. Space Weather Space Clim. 2018, 8, A07 © P. Stauning, Published by EDP Sciences 2018 https://doi.org/10.1051/swsc/2017036 Available online at: www.swsc-journal.org This is an Open Access article distributed under the terms of the Creative Commons Attribution License (http://creativecommons.org/licenses/by/4.0), which permits unrestricted use, distribution, and reproduction in any medium, provided the original work is properly cited.
Transcript of Multi-station basis for Polar Cap (PC) indices: ensuring ... · PC radius for effective PCN index...

J. Space Weather Space Clim. 2018, 8, A07© P. Stauning, Published by EDP Sciences 2018https://doi.org/10.1051/swsc/2017036
Available online at:www.swsc-journal.org
Developing New Space Weather Tools: Transitioning fundamental sc
ience to operational prediction systemsRESEARCH ARTICLE
Multi-station basis for Polar Cap (PC) indices: ensuring credibilityand operational reliability
Peter Stauning*
Danish Meteorological Institute (DMI), Lyngbyvej 100, 2100 Copenhagen, Denmark
Received 22 May 2017 / Accepted 23 November 2017
*Correspon
This is anOp
Abstract – The Polar Cap (PC) indices, PCN (North) and PCS (South) are based on polar geomagneticobservations from Qaanaaq (Thule) and Vostok, respectively, processed to measure the transpolar plasmaconvection that may seriously affect space weather conditions. To establish reliable space weather forecastsbased on PC indices, and also to ensure credibility of their use for scientific analyses of solar wind-magnetosphere interactions, additional sources of data for the PC indices are investigated. In the search foralternative index sources, objective quality criteria are established here to be used for the selection amongpotential candidates. These criteria are applied to existing PC index series to establish a quality scale. In theCanadian region, the data from Resolute Bay magnetometer are shown to provide alternative PCN indices ofadequate quality. In Antarctica, the data from Concordia Dome-C observatory are shown to provide basis foralternative PCS indices. In examples to document the usefulness of these alternative index sources it isshown that PCN indices in a real-time version based on magnetometer data from Resolute Bay could havegiven 6 h of early warning, of which the last 2 h were “red alert”, up to the onset of the strong substorm eventon 13 March 1989 that caused power outage in Quebec. The alternative PCS indices based on data fromDome-C have helped to disclose that presently available Vostok-based PCS index values are corruptedthroughout most of 2011.
Keywords: Space Weather / ionosphere (polar) / magnetosphere / solar wind / magnetic field
1 Introduction
The transpolar plasma convection over the magneticallyopen PCs presents a direct indication of the cross-PC electricfields created by the interaction of the solar wind with theEarth's magnetosphere that is considered responsible for majormagnetic disturbances such as magnetic storms and substorms.At large altitudes the positive ions and the electrons are driftingtogether in this field and produce no net current. The driftingpositive ions are stopped by collisions with the neutrals atheights around 100 km (E-region), while the electrons continuetheir drift further down thus providing a resulting electriccurrent (Hall current) opposite of the convective drift. Hence,the convection intensity and direction could be monitored atground level by observations of the transverse magneticvariations generated by the related ionospheric electriccurrents.
In order to provide a consistent measure of the transpolarconvection, the PC index concept was proposed by Troshichevand Andrezen (1985) and further developed by Troshichev
ding author: [email protected]
en Access article distributed under the terms of the Creative CommonsAunrestricted use, distribution, and reproduction in any m
et al. (1988, 2006) and Vennerstrøm (1991). The standard PCindices, PCN (North) and PCS (South), are based on 1minsamples of geomagnetic data from Qaanaaq and Vostok,respectively. The data are processed to reflect the transpolarconvection that may carry plasma and magnetic fields from thefront of the magnetosphere to the tail region building up excessenergy that subsequently could be released in magnetic stormand substorm activity, which in turn could endanger powergrids and other vital community systems.
The PC indices have proven useful for a range of spaceweather-related investigations and analyses of solar wind-magnetosphere interactions. Thus, the PC indices have beenused to monitor interplanetary geoeffective electric fields andsolar wind pressure pulses, to analyze cross PC voltages, PCdiameter, and general PC dynamics. Furthermore, the PCindices have been used to monitor auroral electrojet intensities,ionospheric Joule heating, global auroral power, and to predictring current intensities (cf. Stauning, 2012; Troshichev andJanzhura, 2012, and references therein).
Power grids near the auroral zone are vulnerable togeomagnetically induced currents caused by variations in themagnetic field, in particular, the large and rapid variationsassociated with the explosive phase of strong substorms.
ttribution License (http://creativecommons.org/licenses/by/4.0), which permitsedium, provided the original work is properly cited.
P. Stauning: J. Space Weather Space Clim. 2018, 8, A07
Usually, such strong substorms require a build-up phase wherethe transpolar magnetospheric convection carries plasma andmagnetic fields from the dayside to be accumulated in the tailregion and provide the fuel for the explosive substormdevelopments. Former studies (e.g., Stauning, 2013b) haveshown the close association between reported power griddisturbances associated with violent substorms and sustainedhigh PC index levels, which makes the indices potentiallyuseful for forecast services.
Concerning possible locations for index data collection,Papitashvili and Rasmussen (1999) examined PCN indicesderived from geomagnetic recordings obtained from a range ofobservatories in Greenland in order to determine the effectivearea for collection of data to provide a useful PC index. Theyconcluded that acceptable PC index values could be producedfrom data recorded within an area of 7.5° in radius centred atthe geomagnetic pole. In a more extended analysis still basedon Greenland data, Papitashvili et al. (2001) concluded that thePC radius for effective PCN index derivation was 10° inmagnetic co-latitude.
The present work extends the analyses of possible indexdata sources to further observatories in the northern andsouthern PCs within the above latitude ranges. Section 2provides a brief summary of PC index basics in order to defineindex derivation terms, relevant magnitude ranges, and majorindex series. In Section 3, quality assessment procedures aredeveloped and used on existing PC index series to establishquality criteria. Data from selected geomagnetic observatoriesin Canada and Antarctica could be used, as will be shown inSections 4 and 5, respectively, to provide alternative PCN andPCS index values of adequate quality. Examples of theirusefulness are presented. Section 6 discusses methods andresults, followed by a summary Section 7, and finalconclusions.
2 PC index basics
It is complicated to scale solar wind intensities and relatedgeospace effects directly from the magnetic data usuallyprovided as components of the disturbed fields in a coordinatesystem fixed to the rotating Earth. Furthermore, the magneticresponse on ground depends strongly on polar ionospheric E-region electron densities which, in turn, have large daily andseasonal variations. These issues are handled in the PC indexconstruction.
2.1 PC index derivation
The steps involved in the processing of data to deriveuseful PC indices are described, among other, in Troshichevet al. (2006). In order to handle the varying impact on theindividual components, the magnetic variations in localcoordinates are projected to an “optimum” direction in space,considered to be transverse to the dominant antisunward“forward” transpolar convection direction. Furthermore, theprojected magnetic variations are scaled to let the index valuesequal (on the average) the related solar wind electric fieldsthereby removing dependencies on local time, season, andobservatory location in order to derive consistent PC indexvalues.
Page 2 o
The optimum direction in space is given by its angle, f, tothe east-west meridian. This angle and the average delay, t,between the solar wind impinging at the front of themagnetosphere and related effects on the PC magnetic fields,are found by maximizing the correlation between solar windelectric field data and projected polar magnetic variations. Foran observatory at longitude l, and for magnetic componentsprovided in a geographical coordinate system, the projectionangle, VPROJ, could be expressed as a function of UThr (UTtime in hours) through:
VPROJ ¼ lþ UThr⋅15°þ f: ð1Þ
From the horizontal geomagnetic disturbance components,(DX, DY), derived as the deviations of the observed values(XOBS, YOBS) from the quiet level (XQL, YQL), the projectedmagnetic value (DFPROJ) is defined by:
DFPROJ ¼ DX ⋅sinðVPROJ Þ±DY ⋅cosðVPROJ Þ; ð2Þ
usingþ for the southern PC (e.g., Vostok) and � for thenorthern PC (e.g., Qaanaaq).
The solar wind geoeffective (or “merging”) electric field(Kan and Lee, 1979) is derived by:
EM ¼ VSW ⋅BT ⋅sin2ðu=2Þ; ð3Þwhere VSW is the solar wind velocity, BT the transversecomponent ðBT ¼
ffiffiffiffiffiffiffiffiffiffiffiffiffiffiffiffiffiffiffiffiffiðB2
Y þ B2ZÞ
qof the interplanetary magnetic
field (IMF), while u is the polar angle between the Z-axis of thegeocentric solar-magnetospheric coordinate system and thetransverse IMF component. The projected polar magneticvariations [in nT] are assumed to be linearly related to the(delayed) merging electric field [in mV/m] through therelation:
DFPROJ ¼ aEM þ b; ð4Þwhere the coefficients a [nT/(mV/m)] and b [nT] are found byleast squares regression on basis of a large ensemble (e.g., acomplete solar cycle) of solar wind electric field data andrelated ground magnetic variations. For each observatory, thederived calibration parameters, (a, b, f) are tabulated to definetheir variations with time-of-day and season. They areinvariant over years.
The PC index [mV/m] is now defined by the inverserelation:
PC ¼ ðDFPROJ � bÞ=a; ð5Þ
which provides index values scaled to equal EM (on theaverage) and thus (in principle) independent of local propertiessuch as local time of day, season, and location within either PC.
2.2 PC index interpretation
Negative PC index values indicate reverse convectionconditions, which typically occur when the IMF has a dominantstrong northward (positive) component (NBZ). In such cases theusual two-cell (DP2) forward polar convection patterns areweakened, while inner two-cell (DP3) reverse convection patterns
f 14

Table 1. Main characteristics of scaling conditions for frequently used PC index versions.
Version Epoch for scaling Solar activity Reverse convection Reference level
OMNI 1977–1980 Peak of cycle Frequent No QDC, BL only
AARI 1998–2001 Peak of cycle Frequent BL and QDC*
IAGA 1997–2009 Cycle average Average BL and QDC**
DMI 1997–2009 Cycle average Excluded BL and QDC***
*QDC: Based on running 30 days quiet samples (Janzhura and Troshichev, 2008).**QDC: Running 30 days quiet samplesþ solar wind sector contribution (Janzhura and Troshichev, 2011).***QDC: 40 days solar rotation weighted quiet samples (Stauning, 2011).
P. Stauning: J. Space Weather Space Clim. 2018, 8, A07
may emerge (e.g., Huang et al., 2000). During NBZ conditions thetransfer of power from the solar wind to the magnetosphere is lowand the global magnetic activity level is weak.
With forward convection (positive PC index values) theoverall magnetic activity expressed, for instance, throughauroral electrojet indices AE (e.g., Troshichev et al., 2012;Stauning, 2012), the midlatitude Kp indices (Stauning, 2012),and the ring current Dst indices (Stauning et al., 2008;Troshichev et al., 2011) generally increases with increasing PCindex level. The development of global magnetic disturbancesrelates to the convection properties in both PCs and is moreclosely related to the non-negative, dual PC index formed froma qualified average of PCN and PCS than to either of the singlePC PCN or PCS indices (Stauning, 2007).
In an investigationofsubstormsoccurring from1997 to2004duringsteadysolarwindconditions, theaveragePClevelatonsetwas found to be 3mV/m (Stauning, 2012). For the more generalcases, substorm onsets would occur at PC index levels of1.5 ± 0.5mV/m according to Troshichev et al. (2014), while thegrowth phase could vary from 60min decreasing to near zerowith increasing PC index levels (Janzhura et al., 2007).
For PC index levels above the onset threshold the strengthand frequency of magnetic storms and substorms generallyincrease with increasing index magnitude. The developmentsof repeating strong substorm conditions (sawtooth events) areassociated with persistent high PC index levels generallyabove 6mV/m (Troshichev and Janzhura, 2009).
In a study of the effects of strong substorms (Stauning,2013b), observed geomagnetic variations and related highvoltage (HV) power-grid disturbances in Sweden wereexamined for 11 cases. The reported HV line disruptionevents were preceded by PCN index values exceeding 10mV/m (“alert” level) through one or more hours before the stroke.For the stronger cases in 1982, 1989 and 2003, the PCN indexvalue averaged through the hour preceding the disturbancesexceeded 15mV/m which could be termed “red alert” level.
The association of PC index values with further well-established activity indices and the specification of relationsbetween index levels and developments of magnetic storms andsubstormsmayhelp todefine the rangeof indexvalues, generallyabove 2–5mV/m, of interest for space weather applications andto assess demands to index quality at such index levels.
2.3 PC index versions
In order to provide a reference scale for judging the qualityof PC index values derived on basis of data from new locations,
Page 3 o
quality analyses shall be conducted for a range of widely usedPC index series. PCN and PCS indices made available at http://pcindex.org are generated according to the procedure endorsedby the International Association for Geomagnetism andAeronomy (IAGA) in 2013 and here termed “IAGA” versions.A general description of this index version has been providedby Troshichev (2011) and made available at http://geophys.aari.ru/Description.pdf, with details described in the refer-enced publications and in the software listings.
Further widely used index versions are discussed inStauning (2013c) comprising, among other, the “OMNI”version developed by Vennerstrøm (1991) with index valuesmade available by the OMNIweb data service, and the “AARI”version developed at the Arctic and Antarctic ResearchInstitute (Troshichev et al., 2006). For the index version that inthe following will be termed “DMI” version, a description ofthe steps in the processing as well as tables of monthly averagehourly parameters for PCN (Qaanaaq) and PCS (Vostok) areavailable on-line in Stauning (2016).
The main differences between the versions resides in thesolar activity level in effect during the epoch used for derivingscaling parameters, in the handling of reverse convectionsamples in the scaling, and in the definition of the quietreference level with or without including the quiet dailyvariation (QDC) on top of the base level (BL). A summary ofcharacteristics is provided in Table 1.
3 PC index quality
The basic quality control comprises the verificationdemands listed in the description “PC indices” by Troshichev(2011) made available at http://pcindex.org:
f
–
14
PCN and PCS indices should be consistent with theinterplanetary electric field, EM;
–
PCN and PCS indices should be in close agreements witheach other irrespective of season and UT time;–
Indices should not demonstrate seasonal variation; – Indices should not demonstrate regular daily variation (i.e.dependence on UT-time).In consequence of the construction of the PC indices (cf.Eqs. (1)–(5)) and to agree with these demands, the ratiobetween PC index values and values of the interplanetaryelectric field, EM, should be invariant to season, time of day,and PC. The challenge is now to derive a representation for theactual distributions of the ratio PC index/EM at the differentconditions.

Fig. 1. Display of PCN vs. EM for the solar cycle epoch 1997–2009.Dashed line indicates equality. Square dots mark bin averages, errorbars indicate standard deviation within every other bin. The curve oflarge red dots shows common reference (Eq. (6) with EC = 10.5mV/m), while the curve of smaller dots indicates best fit between thefunction in Eq. (6) (with variable EC) and the bin average PCN values.The parameters from the fit, EC and the minimum weighted RMSdeviation are noted in the plots.
P. Stauning: J. Space Weather Space Clim. 2018, 8, A07
Figure 1 presents the relations between PCN index valuesand corresponding values of EM, delayed by t = 20min(Stauning, 2016) to compensate for the propagation of effectsfrom the bow shock nose (BSN) to the PC. The EM values havebeen derived from OMNI combined interplanetary satelliteBSN-adjusted solar wind magnetic field and velocity data(http://omniweb.gsfc.nasa.gov). The straight dashed lineindicates equality between EM and PCN. The small (blue)dots are the individual samples provided as 15min averages inorder to enable a detailed visual impression of the data. Thesquare dots in Figure 1 indicate averages of PCN valuesthrough each unit of EM. The size of the dots specifies thenumber of involved samples (N) on the scale displayed in thediagram, while the error bars indicate bin-interval standarddeviations displayed every other bin.
It is seen from Figure 1 that the average values of PCNtrack the corresponding EM values quite well (within 0.2mV/m) up to around 5mV/m. Above that level the PCN valuesappear to saturate much like the driving cross-PC electric field(e.g., Ridley, 2005). Thus, it is clear from Figure 1 that thelinear relation (equality) between average index and mergingelectric field values assumed in equation (5) fails at the largerand more important index levels. A more complex relation isneeded.
The curve of large red dots in Figure 1 and further similardiagrams indicates the functional relation:
PC ¼ EM=
ffiffiffiffiffiffiffiffiffiffiffiffiffiffiffiffiffiffiffiffiffiffiffiffiffiffiffiffiffiffiffiffið1þ ðEM=ECÞ2Þ
q; ð6Þ
with EC fixed at 10.5mV/m. The relation was determined asthe best fit between PC index and EM values for magnetic stormcases during 1995–2005 (Stauning, 2012) and is used here toprovide a common reference (not a target) to ease visualcomparisons of various displays of PC index values versus EM.It is clear that the shape of this curve provides a good
Page 4 o
representation of the linear relation at small EM values andshows PC index saturation effects at larger EM levels. Theprecise course could be adjusted simply by changing theparameter EC in equation (6).
The curve depicted by the small black dots in Figure 1indicates the weighted least squares fit to the bin-averagevalues using the reference formula in equation (6) with avariable parameter, EC. The squared deviations are weightedwith the logarithm (log10(N)) of the number of samples (N) inthe bins, and not N, in order to avoid results dominated by theoverwhelming number of small PCN and EM values (e.g., lessthan 5mV/m), which for space weather purposes are lessimportant. Averages representing less than 3 samples areneglected in the fitting. The parameters resulting from the fit,EC and the minimumweighted RMS deviation, are noted in theplots.It is seen from Figure 1 that the fitted curve of small dots(here with EC= 11.3mV/m) represents the bin-average indexvalues (square dots) quite well with a small weighted RMSdeviation (here 0.34mV/m) compared, for instance, to indexvalues above 5mV/m. Thus, the EC value may convenientlyrepresent the distribution of bin-average PCN values vs. EM.With large values of the EC parameter, the distribution functionapproaches the ideal linear form, PC═EM (assumed whenderiving calibration parameters), while for small values of EC
the distribution would show saturation at low values of themerging electric field, EM. According to equation (6), averagePC index values are half the corresponding EM values atEM ¼ ffiffiffi
3p
⋅EC (quantification of saturation effect).Since the PC indices according to equations 1–5 are scaled
to EM, a solar wind parameter (Troshichev et al., 2006), thenthe relation between average PC index and EM values should(in principle) remain the same (same EC) through all hours ofthe day, seasons of the year, and locations within either PC(Troshichev, 2011; Troshichev and Janzhura, 2012). Thus,displays of the type shown in Figure 1 enable assessments ofindex quality. The primary index quality parameter is thespread in EC (which should be small) between values found forensembles of PC index values grouped at different times of theday and for different seasons. A secondary quality parameter isthe magnitude of the EC fit parameter (which should be large)as it indicates possible saturation effects. The RMS figuresnoted in Figure 1 and corresponding plots are used along with avisual inspection to ensure proper fitting.
In order to derive a “quality scale”, quality parameters havebeen derived from existing series of PCN indices in differentversions comprising OMNI PCN values, AARI PCN values,the IAGA-endorsed PCN values, and DMI PCN values. Aninterval spanning an entire solar cycle has been divided insegments for summer (May–Aug), equinox (Mar–Apr & Sep–Oct), and winter (Nov–Feb) months. Each segment has thenbeen subdivided into daytime (12-20UT) and night time(00-08UT) values noting that local solar and magnetic noon atQaanaaq is at about 16UT.
For each of the PCN versions considered, and for each ofthe seasonally and local time delimited data sets, plots of thetype shown in Figure 1 have been made in addition to plots forthe entire interval. Figure 2 presents for each PCN version acomposite of plots for each pair of winter night and summerdaytime values considered to represent extreme cases. Theseplots display averages marked by the square dots and error barsonly; individual samples are not shown here.
f 14

Fig. 2. Index quality plots of PCN vs. EM in the format and notation of Figure 1 for winter nights and summer daytime cases for OMNI (aþ b),AARI (cþ d), IAGA (eþ f), and DMI (gþ h) index versions.
P. Stauning: J. Space Weather Space Clim. 2018, 8, A07
The dashed line of equality and the reference curve (Eq. (6)with EC= 10.5mV/m) marked by the large dots are included inthe diagrams of Figure 2. The curves indicated by the smalldots display the least squares weighted fit of the form ofequation (6) with a variable EC. The PC index source, theseason displayed, and the value of EC from the fit are noted ontop of the individual diagrams and displayed in Table 2.
Page 5 o
The values found from these data sets are summarized inTable 2. Note that the acronym for Qaanaaq is THL. The tableindicates the epoch of data used for the derivation of the quotedEC quality figures. The EC (all) values were found from “all-data” plots like Figure 1, while the winter nights, EC (wn), andsummer daytime, EC (sd), values are seen in Figure 2. Thespreads in EC between winter nights and summer days,
f 14

Table 2. Quality parameters for different PCN index versions (and Dome-C PCS).
PC version Epoch Best fit EC (mV/m) Spread in EC (DEC)
Origin Index data EC (all) EC (wn) EC (sd) mV/m % of EC (all)
OMNI (THL) 1997–2009 6.6 8.4 4.0 4.4 67AARI (THL) 1995–2004 8.7 9.1 5.6 3.5 40IAGA (THL) 1997–2009 10.4 11.1 7.2 3.9 38DMI (THL) 1997–2009 11.3 11.4 9.7 1.7 15DMI (RES) 1997–2009 11.4 11.9 11.3 0.6 5DMI (DMC) 2009–2016 11.8 9.5 8.1 1.4 12
Table 3. Geographic and geomagnetic parameters at 100 km of altitude for selected stations.
Observatory Station Latitude Longitude CGMlat CGMlon LT= 00 MLT= 00
Name Acr. Deg. Deg. Deg. Deg. UThrs UThrs
Qaanaaq THL 77.48 290.83 85.29 31.30 4.61 3.05Alert ALE 82.50 297.65 87.10 99.74 4.16 21.74Eureka EUR 80.00 274.10 88.42 327.09 5.73 6.86Resolute bay RES 74.68 265.10 83.27 319.40 6.33 7.28Dome-C DMC �75.25 124.17 �88.81 43.07 15.72 1.86Vostok VOS �78.46 106.84 �83.57 54.80 16.88 1.02
P. Stauning: J. Space Weather Space Clim. 2018, 8, A07
DEC=EC (wn)�EC (sd) in mV/m or in percents relative to EC
(all), are listed in Table 2 for the different versions. The DMIResolute (RES) PCN values and the DMI Dome-C (DMC)PCS cases shown in the bottom two rows are presented inSections 4 and 5, respectively, and included here for easyreference.
The distributions of PCN vs. EM in Figure 2 indicate thatthe winter night data, generally, present higher values of the EC
parameter than the averages, while the summer daytime datasets display lower values. The reported values are referenced toin Sections 4 and 5 and further discussed in Section 6.
4 PC indices derived from furthergeomagnetic observatories
The observing sites considered here comprise stations inGreenland, Canada, and Antarctica listed with their geographicand geomagnetic coordinates in Table 3. They are all locatedwithin the co-latitude range (7.5° CGM) specified inPapitashvili and Rasmussen (1999). The table also presentsthe UT times for local solar and magnetic midnight. Thecorrected geomagnetic (CGM) parameters have been derivedfor 100 km of altitude using the NASA Vitmo utility madeavailable at: http://omniweb.gsfc.nasa.gov/vitmo/cgm_vitmo.html
In order to derive PC indices from magnetic data recordedat a location differing from the position of the standardobservatories, methods to derive the quiet reference valuesmust be developed. Projection angles must adopt the newlongitude, and new sets of the daily and seasonally varyingcalibration parameters (a, b, f) must be calculated (cf. Eqs.(1)–(5)).
Page 6 o
For each of the listed observatories, the available data froman epoch of years spanning, if possible, the complete solarcycle throughout the years 1997–2009 have been used for thecalculation of PC index calibration parameters. For some of theobservatories, a limited availability of data has forced the useof different reference epochs spanning still, however, solarmaximum as well as solar minimum years. PC index valueshave then been derived for all years with available observatorydata. The “DMI” methods described in Stauning (2016) havebeen used to calculate PC index values for the new locations.Quality parameters for these index values have been derivedusing the method defined in Section 3 to be compared withcorresponding quality parameters for the other PC index seriesmentioned in Table 1 (cf. discussions in Sect. 6).
4.1 Resolute Bay observatory as an alternative PCNindex source
The geomagnetic observatories in Canada listed in Table 3could be candidates for alternative sources of PCN indexvalues, for instance, for space weather services. Eureka (EUR)magnetic observatory has a very favourable position beingclose to the CGM pole. However, the data collection is ratheruncertain and the available data appear erratic. The Alertobservatory is also in a favourable position close to thegeomagnetic pole. Reliable data have been obtained for someyears (1996–2005) enabling calculation of PC index calibra-tion parameters. However, the quality of recordings throughrecent years is not up to observatory standards.
The observatory at Resolute Bay (RES) at 83.27° CGMlatitude could be candidate for an alternative PCN indexsource. The station has supplied observatory quality data from
f 14

Fig. 3. (Panel a) Resolute PCN in the DMI version vs. EM for the solar cycle epoch 1997–2009 in the format and notation of Figure 1. (b) Binaverage Resolute PCN vs. Qaanaaq PCN. The dashed red line indicates equality. (c) Resolute PCN vs. EM for winter nights and (d) Resolute PCNvs. EM for summer daytime cases in the format and notation of Fig. 2a–h.
P. Stauning: J. Space Weather Space Clim. 2018, 8, A07
(at least) 1988 up to present and made them available troughINTERMAGNET (http://intermagnet.org) and the World DataCenters. The station is located 2° in CGM latitude equatorwardof Qaanaaq. In order to investigate this option, the qualityassessment methods outlined above have been applied to PCNindex values obtained from Resolute data.
Figure 3a presents the PCN-EM relations for 1997–2009 inthe format of Figure 1, while Figures 3c,d present the winternights and summer daytime cases in the format of Figure 2a–h.The quality parameters (EC) noted in the diagrams are added toTable 2. The correlation between 15min PCN values derivedfrom Resolute and Qaanaaq data, respectively, is shown inFigure 3b. The figure display average values within each unitof the indices. The dashed red line indicates equality. Thenumber of samples in each bin is indicated by the size of the dotand the RMS standard deviations are indicated by the errorbars. The correlation value (R= 0.865) noted in Figure 3b isdisplayed in Table 4.
Comparing Figures 3a,c,d, to Figures 1 and 2 indicates thatthe over-all quality of the PCN values derived from Resolutedata is comparable to that of the index values derived fromQaanaaq data. The all-data EC parameter for Resolute is closeto the value for DMI-THL (11.4 vs. 11.3mV/m). The winternight and summer days selections presented in Figure 3c, ddisplay a spread in the EC parameter of 0.6mV/m or 5%, whichis actually better than the DEC values for the other PCNversions of Table 2. Thus, PCN index values derived fromResolute Bay magnetometer data could be considered to be asqualified as the PCN index values based on Qaanaaq data.
Page 7 o
A further quality parameter for PC indices is theirindependence of observatory location. This feature is furtherdocumented by the close correlation between PCN indicesderived from Resolute data versus those derived from Qaanaaqdata displayed in Figure 3b. The correlation coefficient for the1997–2009 epoch is 0.865 based on 15min samples. Thecorrelation between the two PCN data sets is limited by theoccurrence of reverse convection that gives negative indexvalues. Reverse convection events occurring during NBZconditions are mostly observed in a narrow local time sectorclose to local solar and geomagnetic noon (e.g., Stauning et al.,2002), which for the two stations occur at different UT times.Hence, there is an abundance of anti-correlated samples, wherethe index values have opposite signs. For the cases withpositive index values, differences between averages are lessthe 0.5mV/m, while RMS standard deviations between the twoPCN versions are 0.5–1.0mV/m for the bins up to 15mV/m.
4.2 Example case of application of PCN indicesbased on Resolute magnetic data
As an example case, PCN data from the magnetic storm on13March 1989 are presented in Figure 4. For this day, there areno data for the solar wind electric field, EM, in the OMNI database, but Qaanaaq as well as Resolute magnetic data areavailable to derive the PCN index values presented in thefigure. The “alert” and “red alert” levels suggested in Stauning(2013b) are indicated by the horizontal dotted and dashed redlines.
f 14

Table 4. Results from correlation analyses.
Data sets Fig. Epoch Corr. (R)
IAGA PCS vs. PCN 6a 2009–2016 0.762
DMI PCS vs. PCN 6b 2009–2016 0.790PCS-DMC vs. PCN-THL 6c 2009–2016 0.841PCS-DMC vs. PCN-RES 6d 2009–2016 0.800PCS-DMC vs. PCS-VOS 5b 2009–2016 0.947PCN-RES vs. PCN-THL nc 2009–2016 0.841PCN-RES vs. PCN-THL 3b 1997–2009 0.865
Fig. 4. PCN index values for 13 March 1989 derived from Qaanaaq data (green line) and from Resolute data with QDC (blue line) and withoutQDC (magenta line). Solar wind electric field data were not available at this event. “Alert” and “Red Alert” levels are indicated by the dotted anddashed red lines.
P. Stauning: J. Space Weather Space Clim. 2018, 8, A07
InFigure4, thegreen linepresentsPCNindexvaluesderivedfromQaanaaqmagnetic data by the “DMI”method using a quietlevel (QL=BLþQDC) comprising base level value (BL),interpolated from yearly values, and QDC derived by using the“Solar Rotation Weighted” (SRW) method. The calibrationparameters (a, b, f) are provided in Stauning (2016). The blueline presents PCN values derived from Resolute magnetic datausing QL=BLþQDC, while the magenta dashed line presentsPCNvalues derived fromResolute data usingBLonly and a “no-QDC” set of calibration parameters.
The time of the comprehensive power outage in Quebec at02:44 EST (=07:44UT) is marked by an arrow. The event waspreceded by 6 h of “alert” (PCN>10mV/m) conditions with2 h of “red alert” (PCN>15mV/m) conditions immediatelypreceding the outage. It might be noted, that there is a generalclose agreement between Qaanaaq and Resolute PCN valuesexcept for a few intervals at around 12UT in the wake of theviolent substorm. The close agreement between the “QDC”and the much simpler “no QDC” cases should also be noted.Their traces are almost indistinguishable. PCN index valuesbased on Resolute data and using either the “with-QDC”calibration parameters, if QDCs are continually derived, or the“no-QDC” (“BL only”) parameters, could be a worthwhileasset for verification or back-up of the standard PC indices anda supplement to satellite-based solar wind data for spaceweather forecast services. Any small local computer could
Page 8 o
easily convert current magnetometer readings into useable PCindex values.
5 Dome-C observatory as an alternativesource for the PCS index
Apart from the Vostok observatory managed by the RussianArctic and Antarctic Research Institute in St. Petersburg (http://geophys.aari.nw.ru) there are few observatories within thecentral southern PC to provide continuous recordings of thegeomagnetic field through recent years. One is the Dome-C,Concordia observatorymanagedby aEuropean consortium.Thestation has a very attractive position for deriving a PCS indexsince it is situated almost directly at the geomagnetic pole (CGMlatitude =�88.81°). Themagnetic data from the observatory aremade available through the INTERMAGNET portal (http://intermagnet.org) and range from 2009 to present. The quality ofthe data appears good with stable baselines for the components(Chambodut et al., 2009; Di Mauro et al., 2014).
5.1 Quality control of PCS indices derived fromDome-C data
Following the procedures detailed in Stauning (2016) fordetermination of the quiet level (QL=BLþQDC) and
f 14
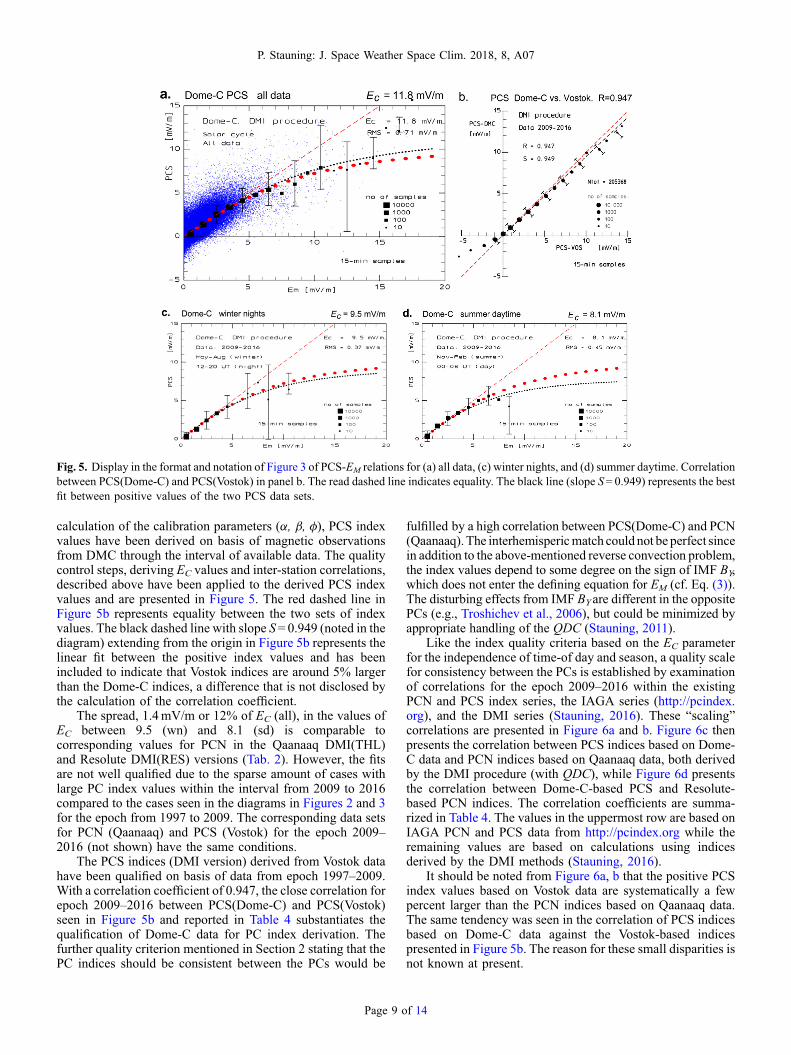
Fig. 5. Display in the format and notation of Figure 3 of PCS-EM relations for (a) all data, (c) winter nights, and (d) summer daytime. Correlationbetween PCS(Dome-C) and PCS(Vostok) in panel b. The read dashed line indicates equality. The black line (slope S= 0.949) represents the bestfit between positive values of the two PCS data sets.
P. Stauning: J. Space Weather Space Clim. 2018, 8, A07
calculation of the calibration parameters (a, b, f), PCS indexvalues have been derived on basis of magnetic observationsfrom DMC through the interval of available data. The qualitycontrol steps, deriving EC values and inter-station correlations,described above have been applied to the derived PCS indexvalues and are presented in Figure 5. The red dashed line inFigure 5b represents equality between the two sets of indexvalues. The black dashed line with slope S= 0.949 (noted in thediagram) extending from the origin in Figure 5b represents thelinear fit between the positive index values and has beenincluded to indicate that Vostok indices are around 5% largerthan the Dome-C indices, a difference that is not disclosed bythe calculation of the correlation coefficient.
The spread, 1.4mV/m or 12% of EC (all), in the values ofEC between 9.5 (wn) and 8.1 (sd) is comparable tocorresponding values for PCN in the Qaanaaq DMI(THL)and Resolute DMI(RES) versions (Tab. 2). However, the fitsare not well qualified due to the sparse amount of cases withlarge PC index values within the interval from 2009 to 2016compared to the cases seen in the diagrams in Figures 2 and 3for the epoch from 1997 to 2009. The corresponding data setsfor PCN (Qaanaaq) and PCS (Vostok) for the epoch 2009–2016 (not shown) have the same conditions.
The PCS indices (DMI version) derived from Vostok datahave been qualified on basis of data from epoch 1997–2009.With a correlation coefficient of 0.947, the close correlation forepoch 2009–2016 between PCS(Dome-C) and PCS(Vostok)seen in Figure 5b and reported in Table 4 substantiates thequalification of Dome-C data for PC index derivation. Thefurther quality criterion mentioned in Section 2 stating that thePC indices should be consistent between the PCs would be
Page 9 o
fulfilled by a high correlation between PCS(Dome-C) and PCN(Qaanaaq).The interhemispericmatch could not be perfect sincein addition to the above-mentioned reverse convection problem,the index values depend to some degree on the sign of IMF BY,which does not enter the defining equation for EM (cf. Eq. (3)).The disturbing effects from IMF BYare different in the oppositePCs (e.g., Troshichev et al., 2006), but could be minimized byappropriate handling of the QDC (Stauning, 2011).
Like the index quality criteria based on the EC parameterfor the independence of time-of day and season, a quality scalefor consistency between the PCs is established by examinationof correlations for the epoch 2009–2016 within the existingPCN and PCS index series, the IAGA series (http://pcindex.org), and the DMI series (Stauning, 2016). These “scaling”correlations are presented in Figure 6a and b. Figure 6c thenpresents the correlation between PCS indices based on Dome-C data and PCN indices based on Qaanaaq data, both derivedby the DMI procedure (with QDC), while Figure 6d presentsthe correlation between Dome-C-based PCS and Resolute-based PCN indices. The correlation coefficients are summa-rized in Table 4. The values in the uppermost row are based onIAGA PCN and PCS data from http://pcindex.org while theremaining values are based on calculations using indicesderived by the DMI methods (Stauning, 2016).
It should be noted from Figure 6a, b that the positive PCSindex values based on Vostok data are systematically a fewpercent larger than the PCN indices based on Qaanaaq data.The same tendency was seen in the correlation of PCS indicesbased on Dome-C data against the Vostok-based indicespresented in Figure 5b. The reason for these small disparities isnot known at present.
f 14
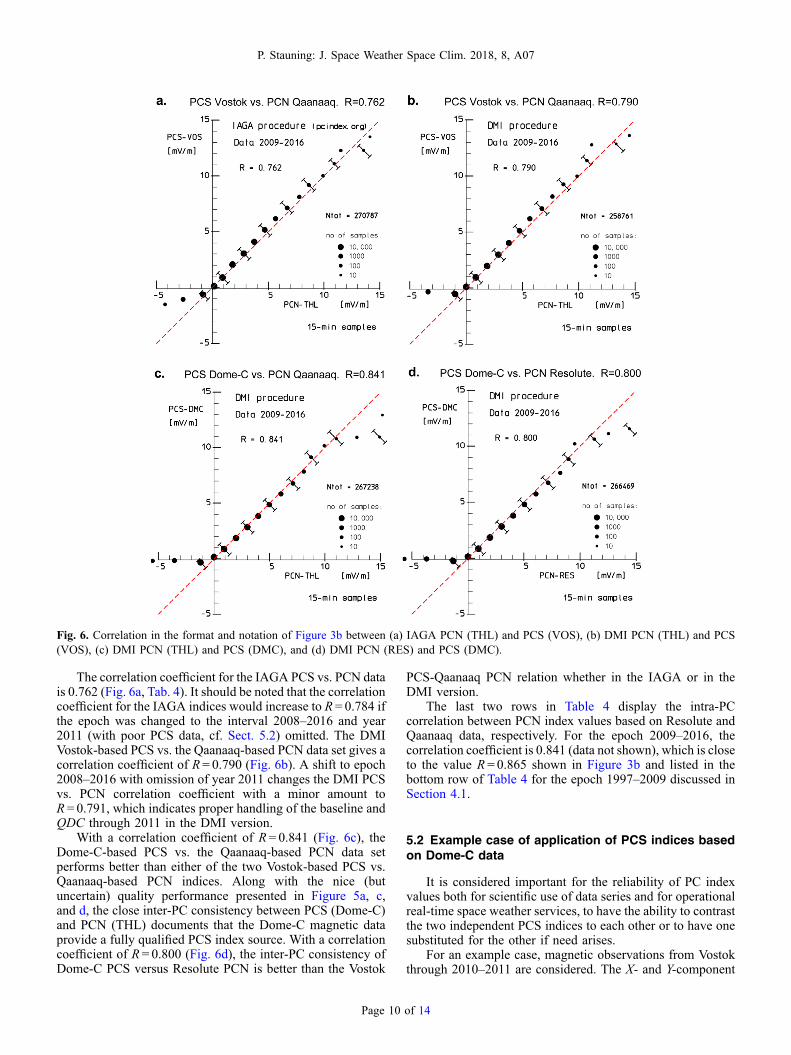
Fig. 6. Correlation in the format and notation of Figure 3b between (a) IAGA PCN (THL) and PCS (VOS), (b) DMI PCN (THL) and PCS(VOS), (c) DMI PCN (THL) and PCS (DMC), and (d) DMI PCN (RES) and PCS (DMC).
P. Stauning: J. Space Weather Space Clim. 2018, 8, A07
The correlation coefficient for the IAGA PCS vs. PCN datais 0.762 (Fig. 6a, Tab. 4). It should be noted that the correlationcoefficient for the IAGA indices would increase to R = 0.784 ifthe epoch was changed to the interval 2008–2016 and year2011 (with poor PCS data, cf. Sect. 5.2) omitted. The DMIVostok-based PCS vs. the Qaanaaq-based PCN data set gives acorrelation coefficient of R= 0.790 (Fig. 6b). A shift to epoch2008–2016 with omission of year 2011 changes the DMI PCSvs. PCN correlation coefficient with a minor amount toR = 0.791, which indicates proper handling of the baseline andQDC through 2011 in the DMI version.
With a correlation coefficient of R= 0.841 (Fig. 6c), theDome-C-based PCS vs. the Qaanaaq-based PCN data setperforms better than either of the two Vostok-based PCS vs.Qaanaaq-based PCN indices. Along with the nice (butuncertain) quality performance presented in Figure 5a, c,and d, the close inter-PC consistency between PCS (Dome-C)and PCN (THL) documents that the Dome-C magnetic dataprovide a fully qualified PCS index source. With a correlationcoefficient of R = 0.800 (Fig. 6d), the inter-PC consistency ofDome-C PCS versus Resolute PCN is better than the Vostok
Page 10
PCS-Qaanaaq PCN relation whether in the IAGA or in theDMI version.
The last two rows in Table 4 display the intra-PCcorrelation between PCN index values based on Resolute andQaanaaq data, respectively. For the epoch 2009–2016, thecorrelation coefficient is 0.841 (data not shown), which is closeto the value R = 0.865 shown in Figure 3b and listed in thebottom row of Table 4 for the epoch 1997–2009 discussed inSection 4.1.
5.2 Example case of application of PCS indices basedon Dome-C data
It is considered important for the reliability of PC indexvalues both for scientific use of data series and for operationalreal-time space weather services, to have the ability to contrastthe two independent PCS indices to each other or to have onesubstituted for the other if need arises.
For an example case, magnetic observations from Vostokthrough 2010–2011 are considered. The X- and Y-component
of 14

Fig. 7. Display of the X- and Y-components of the geomagnetic field at Vostok through 2010–2011. The baselines in the plot are maintained at theconstant levels noted in the diagrams. Data from 2010 are from http://pcindex.org, while data from 2011 are from http://intermagnet.org.
P. Stauning: J. Space Weather Space Clim. 2018, 8, A07
hourly average values are presented in Figure 7. The data for2010 were supplied by the file “IAGA-Vostok-2010” fromhttp://pcindex.org, while the values from 2011 are “definitive”INTERMAGNET data from http://intermagnet.org
From Figure 7 several irregularities are observed. There arejumps in the real base levels on 26 April, 2010, seen in the X-and (particularly) in the Y-component level upon a shortdisruption between 00:00 and 08:30UT. Such base level jumpsare not difficult to handle in post-event processing, but for real-time operations, the derived PC index values could beseriously affected for a while until the QL is adjusted to thenew value.Another feature is the gradual decline through 2011in the real base level for the X-component presented in the plot.Whether the decline is related to the long term (secular)variations in the Earth's field or caused by changes in theinstrument or its base on the ice cap, the PC index programshould be capable of processing the data appropriately.However, the PCS data available from http://pcindex.org arecorrupted throughout most of 2011. Figure 8b presents anexample for July 2011 from a download of PC index values on23 April 2017.
In the IAGA-Vostok PCS data (from http://pcindex.org)presented in Figure 8b, the strong daily variations distinguishthese data from the PCS values derived from Vostok andDome-C data by the DMI procedure. Note, in particular, thevariations seen through the intervals from 16 to 18 and 28–30July where the EM values are low. The PCS-DMI values arealso low in agreement with the calm solar wind conditions,while the PCS-IAGAvalues oscillates between approximately�1 andþ2mV/m through each day. These variations are mostlikely caused by poor handling of the base level (FBL) includedin the quiet level (QL) fromwhich the disturbances representedin the PC indices are counted. According to equation (5), theeffect of a base level error (DFBL) on the PC index would be:
DPC ¼ DFBL;PROJ=a: ð7Þ
Page 11
The projection by equation (2) to the optimum directiongenerates a daily sine-like variation in the PCS index as theprojection angle (Eq. (1)) varies through 360° during the day.The amplitude is modulated by the daily variations in the slopevalue (a), which is also seen in panel b of Figure 8.In the moredisturbed intervals, the proper PCS values come on top of theoscillations. Note in addition from panels c and d of Figure 8the close correspondence between the PCS values derived bythe DMI methods from Dome-C and Vostok observations,respectively.
6 Discussions
The PC indices are meant to monitor the transpolar forwardconvection intensities (Troshichev et al., 2006). The indexquality is degraded if the location of the observatory thatsupplies the basic magnetic data moves outside the polarforward convection belt, for instance, during the daily rotation,at seasonal displacements of the belt, or during strongtransverse IMF BY conditions. Thus, a position very close tothe magnetic pole, on the average, provides the best data basis.A position near the magnetic pole also diminishes the risk thatpoleward expanding substorms might disturb the data.Furthermore, the disturbance magnetic vector from the ringcurrents generated during magnetic storms would be near-vertical at the pole and, therefore, could not affect thehorizontal components from which the PC indices are derived.
Reverse convection events during NBZ conditions mightalso be considered. They maximise in occurrence frequencyand intensity in the summer season and in a relatively narrowregion close to noon in-between the cusp and the pole(Stauning et al., 2002). They are particularly intense atlocations where solar and geomagnetic noon are coincident.During reverse convection the projected magnetic disturbances(cf. Eq. (2)) are negative while the merging electric fields arealways positive (cf. Eq. (3)). If included in the calculations of
of 14
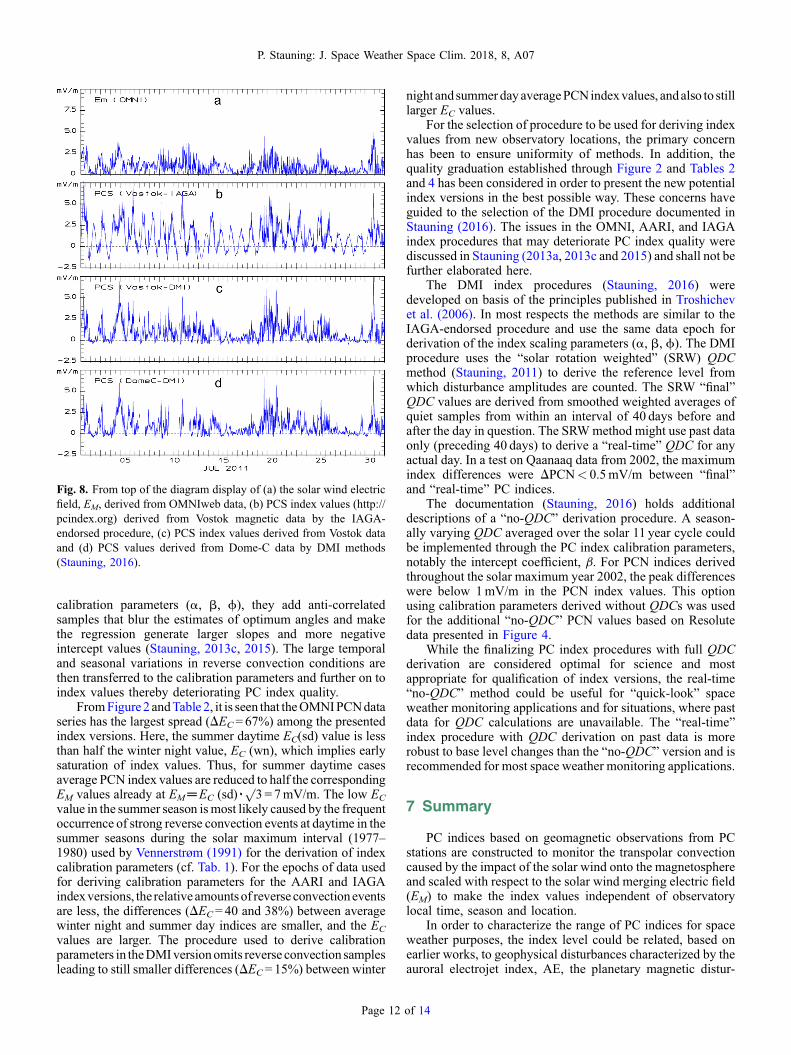
Fig. 8. From top of the diagram display of (a) the solar wind electricfield, EM, derived from OMNIweb data, (b) PCS index values (http://pcindex.org) derived from Vostok magnetic data by the IAGA-endorsed procedure, (c) PCS index values derived from Vostok dataand (d) PCS values derived from Dome-C data by DMI methods(Stauning, 2016).
P. Stauning: J. Space Weather Space Clim. 2018, 8, A07
calibration parameters (a, b, f), they add anti-correlatedsamples that blur the estimates of optimum angles and makethe regression generate larger slopes and more negativeintercept values (Stauning, 2013c, 2015). The large temporaland seasonal variations in reverse convection conditions arethen transferred to the calibration parameters and further on toindex values thereby deteriorating PC index quality.
FromFigure2 andTable 2, it is seen that theOMNIPCNdataseries has the largest spread (DEC= 67%) among the presentedindex versions. Here, the summer daytime EC(sd) value is lessthan half the winter night value, EC (wn), which implies earlysaturation of index values. Thus, for summer daytime casesaverage PCN index values are reduced to half the correspondingEM values already at EM═EC (sd)۰
p3 = 7mV/m. The low EC
value in the summer season ismost likely caused by the frequentoccurrence of strong reverse convection events at daytime in thesummer seasons during the solar maximum interval (1977–1980) used by Vennerstrøm (1991) for the derivation of indexcalibration parameters (cf. Tab. 1). For the epochs of data usedfor deriving calibration parameters for the AARI and IAGAindexversions, the relativeamountsof reverse convectioneventsare less, the differences (DEC= 40 and 38%) between averagewinter night and summer day indices are smaller, and the EC
values are larger. The procedure used to derive calibrationparameters in theDMIversionomits reverse convection samplesleading to still smaller differences (DEC= 15%) between winter
Page 12
night andsummerdayaveragePCNindexvalues, andalso to stilllarger EC values.
For the selection of procedure to be used for deriving indexvalues from new observatory locations, the primary concernhas been to ensure uniformity of methods. In addition, thequality graduation established through Figure 2 and Tables 2and 4 has been considered in order to present the new potentialindex versions in the best possible way. These concerns haveguided to the selection of the DMI procedure documented inStauning (2016). The issues in the OMNI, AARI, and IAGAindex procedures that may deteriorate PC index quality werediscussed in Stauning (2013a, 2013c and 2015) and shall not befurther elaborated here.
The DMI index procedures (Stauning, 2016) weredeveloped on basis of the principles published in Troshichevet al. (2006). In most respects the methods are similar to theIAGA-endorsed procedure and use the same data epoch forderivation of the index scaling parameters (a, b, f). The DMIprocedure uses the “solar rotation weighted” (SRW) QDCmethod (Stauning, 2011) to derive the reference level fromwhich disturbance amplitudes are counted. The SRW “final”QDC values are derived from smoothed weighted averages ofquiet samples from within an interval of 40 days before andafter the day in question. The SRWmethod might use past dataonly (preceding 40 days) to derive a “real-time” QDC for anyactual day. In a test on Qaanaaq data from 2002, the maximumindex differences were DPCN< 0.5mV/m between “final”and “real-time” PC indices.
The documentation (Stauning, 2016) holds additionaldescriptions of a “no-QDC” derivation procedure. A season-ally varying QDC averaged over the solar 11 year cycle couldbe implemented through the PC index calibration parameters,notably the intercept coefficient, b. For PCN indices derivedthroughout the solar maximum year 2002, the peak differenceswere below 1mV/m in the PCN index values. This optionusing calibration parameters derived without QDCs was usedfor the additional “no-QDC” PCN values based on Resolutedata presented in Figure 4.
While the finalizing PC index procedures with full QDCderivation are considered optimal for science and mostappropriate for qualification of index versions, the real-time“no-QDC” method could be useful for “quick-look” spaceweather monitoring applications and for situations, where pastdata for QDC calculations are unavailable. The “real-time”index procedure with QDC derivation on past data is morerobust to base level changes than the “no-QDC” version and isrecommended for most space weather monitoring applications.
7 Summary
PC indices based on geomagnetic observations from PCstations are constructed to monitor the transpolar convectioncaused by the impact of the solar wind onto the magnetosphereand scaled with respect to the solar wind merging electric field(EM) to make the index values independent of observatorylocal time, season and location.
In order to characterize the range of PC indices for spaceweather purposes, the index level could be related, based onearlier works, to geophysical disturbances characterized by theauroral electrojet index, AE, the planetary magnetic distur-
of 14

P. Stauning: J. Space Weather Space Clim. 2018, 8, A07
bance index, Kp, and the ring current disturbance index, Dst.PC index levels to characterize geomagnetic storms, substormonsets, and alert conditions for power grids near the auroralzone, were summarized in Section 2.2.
The variation of average PC index values vs. the mergingelectricfield,EM, has been given a functional form depending ona single parameter, EC. The spread, DEC, between values of EC
derived for ensembles of indexvalues grouped for different localtime and seasonal conditions is thus a quality parameter andshould take small values. The magnitude of EC is a secondaryquality parameter to indicate index saturation properties andshould be large. The interhemispheric correlation (R) betweenPCN and PCS index values, used to describe the degree ofdependence on location, should take high values. Using thequality assessment scheme on some of the current PC indexseries has provided values for the spread between winter nightsand summer days and the average magnitude of the distributionfunction parameters, as well as values for the interhemisphericcorrelations.Thevaluesare summarized in tables (Tabs. 2 and4).
PCN and PCS index values derived from data suppliedfrom the observatories at Resolute Bay in Canada and Dome-Cin Antarctica, respectively, complies well with the establishedquality criteria. Their quality parameters (DEC, EC, and R) takevalues at the best end of the quality parameter ranges. TheResolute Bay location approximately 2 degree CGM latitudeequatorward of Qaanaaq is considered a little inferiorcompared to the PCN standard location at Qaanaaq. TheDome-C location at the CGM pole is superior to the position ofVostok for the PCS index.
An example case from 13 March 1989 has demonstratedthat PCN indices derived from Resolute Bay magnetometerdata, within Canada a local source, could have given around 6 hearly warning of the build up of the extraordinarily strongsubstorm that caused the Quebec power outage event.
An example case based on alternative PCS indices derivedfrom Dome-C observatory data has shown that the PCS valuesbased on Vostok data and supplied through the web portalhttp://pcindex.org are corrupted throughout most of 2011.
8 Conclusions
–
The presented quality analyses have shown that observa-tions from the INTERMAGNET-grade magnetic observa-tories at Resolute Bay in Canada and Dome-C in Antarcticaare fully qualified to become alternative sources for PCNand PCS indices, respectively;–
The presented examples have demonstrated the usefulnessof using multi-station PC index sources for ensuringcredibility and operational reliability in applications usingPC indices for analyses or monitoring of space weatherconditions.9 Data availability
Near real-time PC index values and PCN and PCS indexseries derived by the IAGA-endorsed procedure are availablethrough the web site: http://pcindex.org. Data used in the paperwere downloaded on 23 April 2017. The web site, furthermore,
Page 13
holds PCN and PCS index coefficients. QDC values are notincluded. The web site includes the document “PC Index”(Troshichev, 2011).
Geomagnetic data from Qaanaaq, Resolute and Dome-Cwere supplied in part from the INTERMAGNET data servicecenter at http://intermagnet.org, in part from the DTU Spaceftp data server at ftp://ftp.space.dtu.dk/WDC/, in part from theWDC service for Geomagnetism, Edinburgh, available athttp://www.wdc.bgs.ac.uk
The observatory in Qaanaaq is managed by the DanishMeteorological Institute, while the magnetometer there isoperated by DTU Space, Denmark. The Vostok observatory isoperated by the Arctic and Antarctic Research Institute in St.Petersburg, Russia. The Dome-C observatory is managed byEcole et Observatoire des Sciences de la Terre (France) andIstituto Nazionale di Geofisica e Vulcanologia (Italy), while theobservatory at Resolute Bay is operated by the GeologicalSurvey of Canada.
Geomagnetic data from Vostok were supplied in part fromthe web portal http://pcindex.org, in part from the INTER-MAGNET portal http://intermagnet.org, and in part from theArctic and Antarctic Research Institute in St. Petersburg,Russia (at http://geophys.aari.ru).
Solar wind OMNI BSN data from combined ACE, WIND,IMP8, and Geotail interplanetary satellite measurements andPCN data in the “OMNI” version were provided from theOMNIweb data service at Goddard Space Flight Center,NASA at http://omniweb.gsfc.nasa.gov.
The PCN and PCS data in the “AARI” version weresupplied from the Arctic and Antarctic Research Institute in St.Petersburg, Russia (at http://geophys.aari.ru).
The “DMI” PC index version is documented in the reportSR-16-22 (Stauning, 2016) available at the DMI web site:http://www.dmi.dk/fileadmin/user_upload/Rapporter/TR/2016/SR-16-22-PCindex.pdf.
Acknowledgments. The staffs at the observatories inQaanaaq (Thule), Vostok, Resolute Bay and Dome-C, and theirsupporting institutes are gratefully acknowledged for providinghigh-quality geomagnetic data for this study. The excellentservice at theOMNIwebdata center atGSFC,NASA, to provideprocessed solar wind satellite data, the efficient provision ofgeomagnetic data from the INTERMAGNET data center, andthe nice performance of the PC index portal are greatlyappreciated. The author gratefully acknowledges the goodcollaboration and many rewarding discussions with Drs. O. A.Troshichev and A. S. Janzhura at the Arctic and AntarcticResearch Institute in St. Petersburg, Russia.
The editor thanks Eftyhia Zesta and two anonymousreferees for their assistance in evaluating this paper.
References
ChambodutA,DiMauroD, Schott JJ, Bordais P,AgnolettoL,DiFeliceP. 2009. Three years continous record of the Earth's magnetic field atConcordia station (Dome-C, Antarctica). Annals of Geophysics 52:15–24.
Di Mauro D, Cafarella L, Lepidi S, Pietrolungo M, Alfonsi L,Chambodut A. 2014. Geomagnetic polar observatories: the role ofConcordia station at Dome C, Antarctica. Annals of Geophysics 57:6. DOI:10.4401/ag-6605.
of 14

P. Stauning: J. Space Weather Space Clim. 2018, 8, A07
Huang C-S., Sofko GJ, Koustov AV, André DA, Ruohoniemi JM,Greenwald RA, Hairston MR. 2000. Evolution of ionosphericmulticell convection during northward interplanetary magneticfield with |BZ/BY|>1. J Geophys Res 105: 27095–27107.
Janzhura AS, Troshichev OA. 2008. Determination of the runningquiet daily geomagnetic variation. J Atmos Solar-Terr Phys 70:962–972. DOI:10.1016/j.jastp.2007.11.004.
Janzhura AS, Troshichev OA. 2011. Identification of the IMF sectorstructure in near-real time by ground magnetic data. Ann Geophys29: 1491–1500. DOI:10.5194/angeo-29-1491-2011.
Janzhura A, Troshichev OA, Stauning P. 2007. Unified PC indices:relation to the isolated magnetic substorms. J Geophys Res 112:A09207. DOI: 10.1029/2006JA012132.
Kan JR, Lee LC. 1979. Energy coupling function and solar wind-magnetosphere dynamo. Geophys Res Lett 6: 577–580.DOI:10.1029/GL006i007p00577.
Papitashvili VO, Rasmussen O. 1999. Effective area for the northernpolar cap magnetic activity index. Geophys Res Lett 26: 2917–2920. DOI:10.1029/1999GL003611.
Papitashvili VO, Gromova LI, Popov VA, Rasmussen O. 2001.Northern Polar Cap magnetic activity index PCN: effective area,universal time, seasonal and solar cycle variations. DMI ScientificReport SR 01-01. ISSN: 0905-3263, ISBN: 87-7478-432-3.Available at http://www.dmi.dk/fileadmin/Rapporter/SR/sr01-01.pdf
Ridley AJ. 2005. A new formulation for the ionospheric cross polarcap potential including saturation effects. Ann Geophys 23: 3533–3547. DOI:10.5194/angeo-23-3533-2005.
Stauning P. 2007. A new index for the interplanetary merging electricfield and the global geomagnetic activity: application of the unifiedPolar Cap (PCN and PCS) indices. AGU Space Weather 5: S09001.DOI:10.1029/2007SW000311.
Stauning P. 2011. Determination of the quiet daily geomagneticvariations for polar regions. J Atm Solar-Terr Phys 73: 2314–2330.DOI:10.1016/j.jastp.2011.07.004.
Stauning P. 2012. The Polar Cap PC indices: relations to solar windand global disturbances. In: Marian L, ed. Exploring the solar wind.InTech Publ. ISBN: 978-953-51-0339-4. DOI: 10.5772/37359.
Stauning P. 2013a. Comments on quiet daily variation derivationin: “Identification of the IMF sector structure in near-real time”by ground magnetic data by Janzhura and Troshichev (2011).Ann Geophys 31 : 1221–1225. DOI:10.5194/angeo-31-1221-2013.
Stauning P. 2013b. Power grid disturbances and polar cap indexduring geomagnetic storms. J Space Weather Space Clim 3: A22.DOI:10.1051/swsc2013044.
Stauning P. 2013c. The Polar Cap index: a critical review of methodsand a new approach. J Geophys Res Space Phys 118: 5021–5038.DOI: 10.1002/jgra.50462.
Stauning P. 2015. A critical note on the IAGA-endorsed Polar Capindex procedure: effects of solar wind sector structure and reversepolar convection. Ann Geophys 33: 1443–1455. DOI:10.5194/angeo-33-1443-2015. www.ann-geophys.net/33/1443/2015.
Page 14
Stauning P. 2016. The Polar Cap (PC) index: derivation proceduresand quality control. DMI Scientific Report SR- 16-22. Available at:http://www.dmi.dk/fileadmin/user_upload/Rapporter/TR/2016/SR-16-22-PCindex.pdf
Stauning P, Christiansen F, Watermann J, Christensen T, RasmussenO. 2002. Mapping of field-aligned current patterns duringnorthward IMF. In: Reigber C, Lühr H, Schwintzer P, eds. FirstCHAMP Mission results for gravity, magnetic and atmosphericstudies. Berlin: Springer-Verlag, 353–360, DOI:10.1007/978-3-540-38366-6.
Stauning P, Troshichev OA, Janzhura A. 2008. The Polar Cap (PC)indices. Relations to solar wind parameters and global magneticactivity. J Atmos Solar-Terr Phys 70: 2246–2261. DOI:10.1016/j.jastp.2008.09.028.
Troshichev OA. Polar Cap (PC) index. 2011. Available at: http://geophys.aari.ru/Description.pdf or http://pcindex.org.
Troshichev OA, Andrezen VG. 1985. The relationship betweeninterplanetary quantities and magnetic activity in the southern polarcap. Planet Space Sci 33: 415–419, DOI: 10.1016/0032-0633(85)90086-8.
Troshichev OA, Janzhura A. 2009. Relationship between the PC andAL indices during repetitive bay-like magnetic disturbances in theauroral zone. J Atmos Solar-Terr Phys 71: 1340–1352. DOI:10.1016/j.jastp.2009.05.017
Troshichev OA, Janzhura A, Space weather monitoring by ground-based means, Springer-Verlag, Berlin, Heidelberg, 2012. ISBN:978-3-642-16802-4. DOI:10.1007/978-3-642-16803-1.
Troshichev OA, Andrezen VG, Vennerstrøm S, Friis-Christensen E.1988. Magnetic activity in the polar cap � a new index. PlanetSpace Sci 36: 1095–1102. DOI: 10.1016/0032-0633(88)90063-3
Troshichev OA, Janzhura A, Stauning P. 2006. Unified PCN and PCSindices: method of calculation, physical sense and dependence onthe IMF azimuthal and northward components. J Geophys Res111:A05208. DOI:10.1029/2005JA011402. (note correction in Trosh-ichev et al., 2009)
Troshichev O, Janzhura A, Stauning P. 2009. Correction to UnifiedPCN and PCS indices: method of calculation, physical sense, anddependence on the IMF azimuthal and northward components. JGeophys Res 114: A11202. DOI:10.1029/2009JA014937.
Troshichev OA, Somarkov DA, Janzhura A. 2011. Relation of PCindex to the geomagnetic storm Dst variation. J Atmos Solar-TerrPhys 73: 611–622. DOI:10.1016/j.jastp.2010.12.015.
Troshichev OA, Sormakov DA, Janzhura A. 2012. Relations betweenPC index and substorm (AL) and storm (SYM, ASYM) indicesunder conditions of the steadily high solar wind energy input intothe magnetosphere. Adv Space Res 49: 872–882. DOI:10.1016/j.asr.2011.12.011.
Troshichev O, Podorozhkina NA, Sormakov DA, Janzhura A. 2014.PC index as a proxy of the solar wind energy that entered into themagnetosphere: 1. Development of magnetic substorms. J GeophysRes Space Phys 119: 6521–6540. DOI:10.1002/2014JA019940.
Vennerstrøm S, The geomagnetic activity index PC, PhD Thesis,Scientific Report 91-3, DanishMeteorological Institute, 1991, 105 p.
Cite this article as: Stauning P. 2018. Multi-station basis for Polar Cap (PC) indices: ensuring credibility and operational reliability. J. SpaceWeather Space Clim. 8: A07
of 14