Multi-species ecosystem effects analysis & flow … ecosystem effects analysis & flow criteria...
21
Multi-species ecosystem effects analysis & flow criteria evaluation State Water Resources Control Board -Leo Winternitz - Clint Alexander November 13 2012
Transcript of Multi-species ecosystem effects analysis & flow … ecosystem effects analysis & flow criteria...

Multi-species ecosystem effects analysis & flow criteria evaluation
State Water Resources Control Board -Leo Winternitz - Clint Alexander November 13 2012
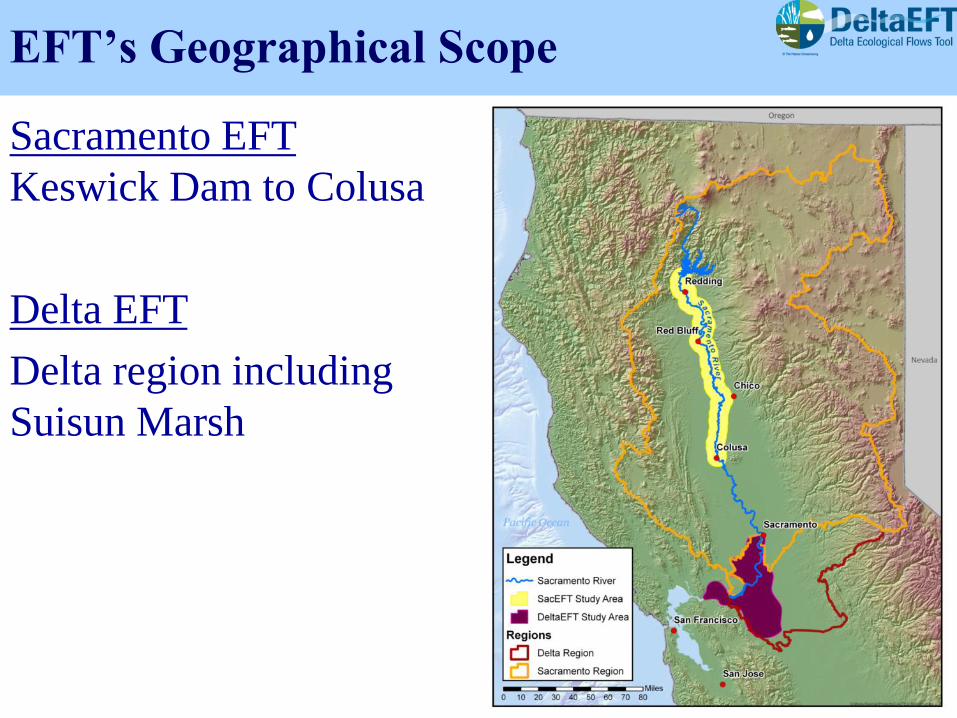
Sacramento EFT
Keswick Dam to Colusa
Delta EFT
Delta region including
Suisun Marsh
EFT’s Geographical Scope
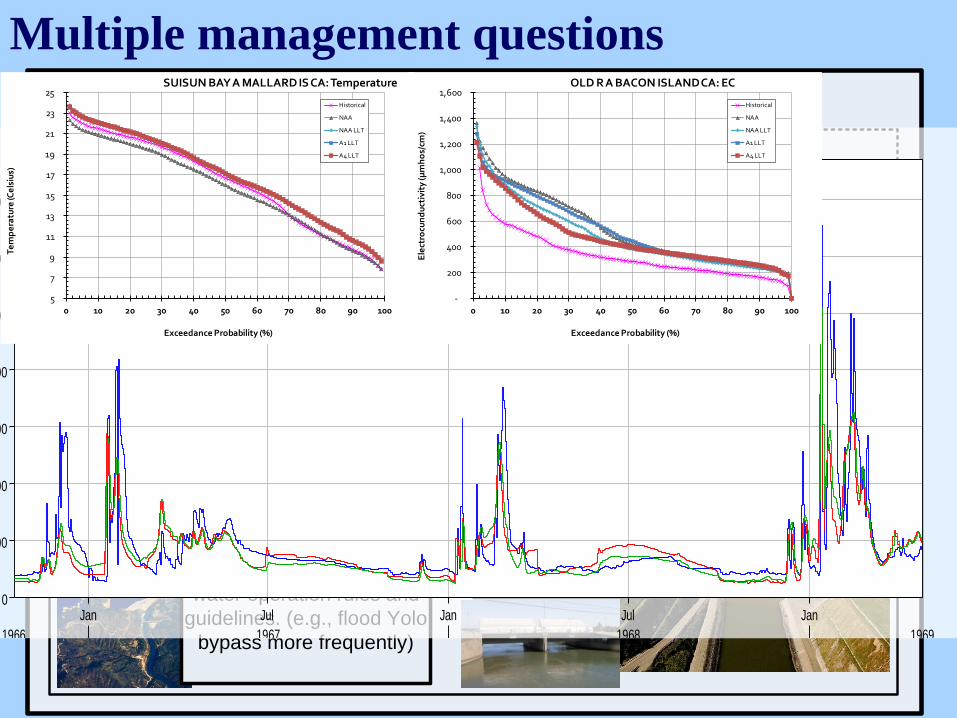
Multiple management questions External forcing: climate & human demand
Delta Conveyance
Operational Standards
Sacramento River
Inte
ractio
n
Interaction
Gravel augmentation (TUGS model)
Rip-rap removal / levee
setback (Meander
Migration model)
BDCP + other “green”
water operation rules and
guidelines. (e.g., flood Yolo
bypass more frequently)
CVP-SWP BIOP
D1641 operations
(+1995)
New water storage
projects
Jan Jul Jan Jul Jan
1966 1967 1968 1969
Flo
w (
cfs
)
0
20000
40000
60000
80000
100000
120000
140000
VINA BASE SACEFTFLOW BASE CFS FLOW VINA NODOS SACEFTFLOW NODOS CFS FLOW VINA SHASTA SACEFTFLOW SHASTA CFS FLOW
-
200
400
600
800
1,000
1,200
1,400
1,600
0 10 20 30 40 50 60 70 80 90 100
Ele
ctro
cun
du
ctiv
ity
(µm
ho
s/cm
)
Exceedance Probability (%)
OLD R A BACON ISLAND CA: EC
Historical
NAA
NAA LLT
A1 LLT
A4 LLT
5
7
9
11
13
15
17
19
21
23
25
0 10 20 30 40 50 60 70 80 90 100
Te
mp
era
ture
(Ce
lsiu
s)
Exceedance Probability (%)
SUISUN BAY A MALLARD IS CA: Temperature
Historical
NAA
NAA LLT
A1 LLT
A4 LLT
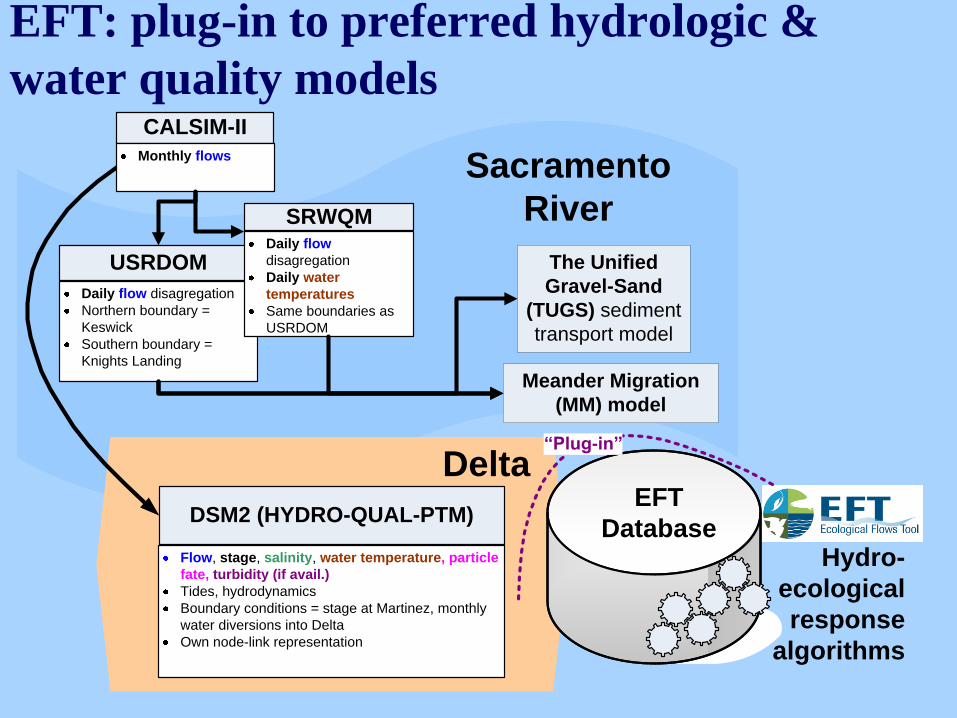
EFT: plug-in to preferred hydrologic &
water quality models
Sacramento
River
Delta
CALSIM-II
Monthly flows
USRDOM
Daily flow disagregation
Northern boundary =
Keswick
Southern boundary =
Knights Landing
SRWQMDaily flow
disagregation
Daily water
temperatures
Same boundaries as
USRDOM
The Unified
Gravel-Sand
(TUGS) sediment
transport model
Meander Migration
(MM) model
DSM2 (HYDRO-QUAL-PTM)
Flow, stage, salinity, water temperature, particle
fate, turbidity (if avail.)
Tides, hydrodynamics
Boundary conditions = stage at Martinez, monthly
water diversions into Delta
Own node-link representation
EFT
DatabaseHydro-
ecological
response
algorithms
“Plug-in”

SacEFT focal species & habitats
Chinook Salmon
(Oncorhynchus tshawytscha)
Steelhead
(Oncorhynchus mykiss)
Green Sturgeon
(Acipenser medirostris)
Bank Swallow
(Riparia riparia) Western Pond Turtle (Clemmys marmorata)
Proxy: Large Woody Debris
Recruitment
Fremont Cottonwood
(Populus fremontii)

Chinook Salmon
(Oncorhynchus tshawytscha)
Steelhead
(Oncorhynchus mykiss)
Splittail
(Pogonichthys macrolepidotus ) Tidal Wetlands
Delta Smelt
(Hypomesus transpacificus )
DeltaEFT focal species & habitats
Invasive deterrence
(E. Densa, Corbicula,
Corbula)
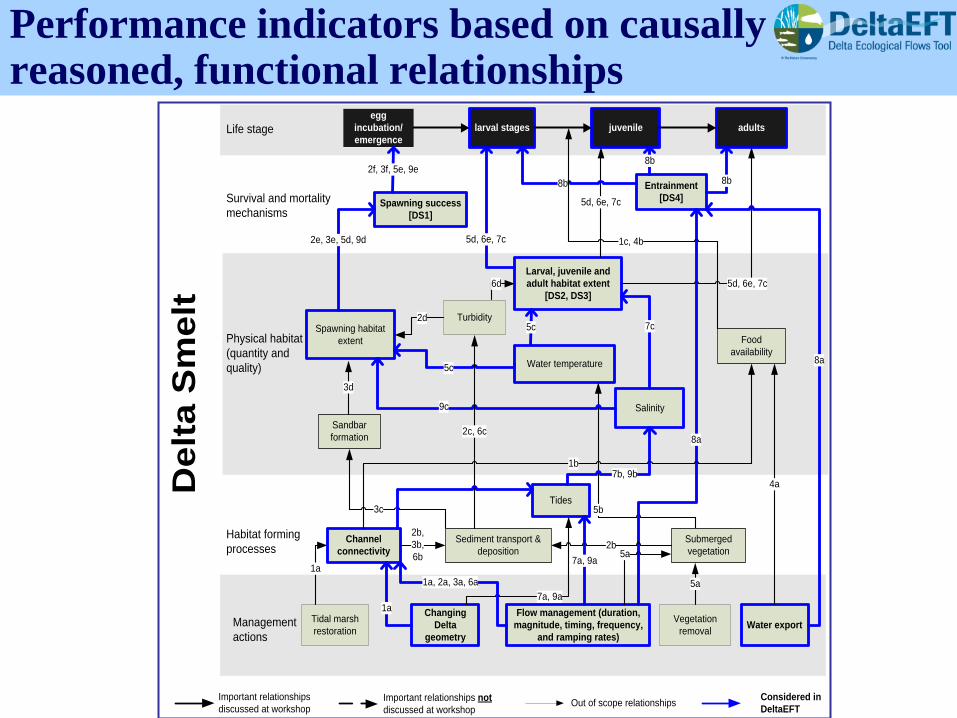
Performance indicators based on causally reasoned, functional relationships
Flow management (duration,
magnitude, timing, frequency,
and ramping rates)
Tidal marsh
restorationManagement
actions
Physical habitat
(quantity and
quality)
Life stage
Habitat forming
processes
Survival and mortality
mechanisms
egg
incubation/
emergence
larval stages juvenile adults
1a
Channel
connectivity
Turbidity
Water temperature
5b
Entrainment
[DS4]
8b
8b
3c
Spawning habitat
extent
Larval, juvenile and
adult habitat extent
[DS2, DS3]
5d, 6e, 7c
5d, 6e, 7c
Salinity
Sediment transport &
deposition
8b
7c
9c
5d, 6e, 7c
8a
Spawning success
[DS1]
5c
2f, 3f, 5e, 9e
5c
6d
Submerged
vegetation
Vegetation
removalWater export
Changing
Delta
geometry
2c, 6c
2b
5a
Sandbar
formation
3d
2e, 3e, 5d, 9d
2b,
3b,
6b
Food
availability
2d
1a
4a
1c, 4b
8a
Tides
7a, 9a
7b, 9b
7a, 9a5a
1b
1a, 2a, 3a, 6a
Important relationships
discussed at workshopImportant relationships not
discussed at workshopOut of scope relationships
Considered in
DeltaEFT
De
lta
Sm
elt

SacEFT indicators
Focal Species &
Habitats Performance Measures
Sacra
me
nto
Riv
er
Fremont cottonwood (FC) FC1 – Successful Fremont cottonwood initiation
FC2 – Cottonwood seedling scour.
Bank swallow (BASW) BASW1 – Habitat potential/suitability
BASW2 – Risk of nest inundation and bank sloughing
during nesting
Western pond turtle LWD1 – Index of old vegetation recruited to the
Sacramento River mainstem.
Green sturgeon (GS) GS1 – Egg-to-larvae survival
Chinook salmon,
Steelhead trout (CS)
CS1 – Area of suitable spawning habitat (ft2)
CS3 – Egg-to-fry survival (proportion)
CS5 – Redd scour risk
CS6 – Redd dewatering (proportion)
CS2 – Area of suitable rearing habitat (ft2)
CS4 – Juvenile stranding (index)
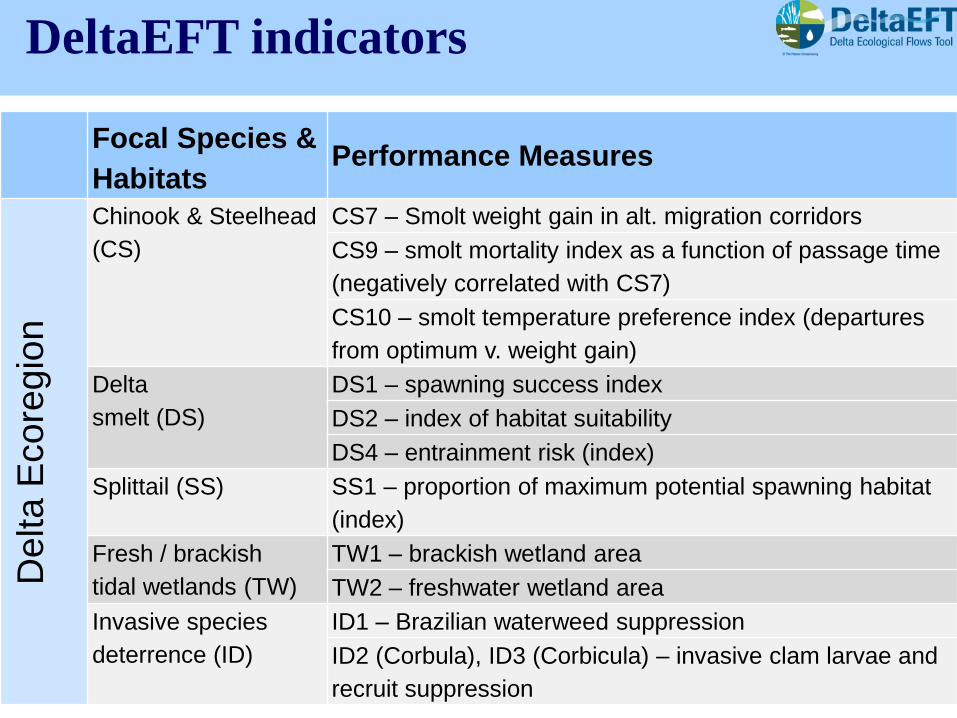
DeltaEFT indicators
Focal Species &
Habitats Performance Measures
Delta E
core
gio
n
Chinook & Steelhead
(CS)
CS7 – Smolt weight gain in alt. migration corridors
CS9 – smolt mortality index as a function of passage time
(negatively correlated with CS7)
CS10 – smolt temperature preference index (departures
from optimum v. weight gain)
Delta
smelt (DS)
DS1 – spawning success index
DS2 – index of habitat suitability
DS4 – entrainment risk (index)
Splittail (SS) SS1 – proportion of maximum potential spawning habitat
(index)
Fresh / brackish
tidal wetlands (TW)
TW1 – brackish wetland area
TW2 – freshwater wetland area
Invasive species
deterrence (ID)
ID1 – Brazilian waterweed suppression
ID2 (Corbula), ID3 (Corbicula) – invasive clam larvae and
recruit suppression
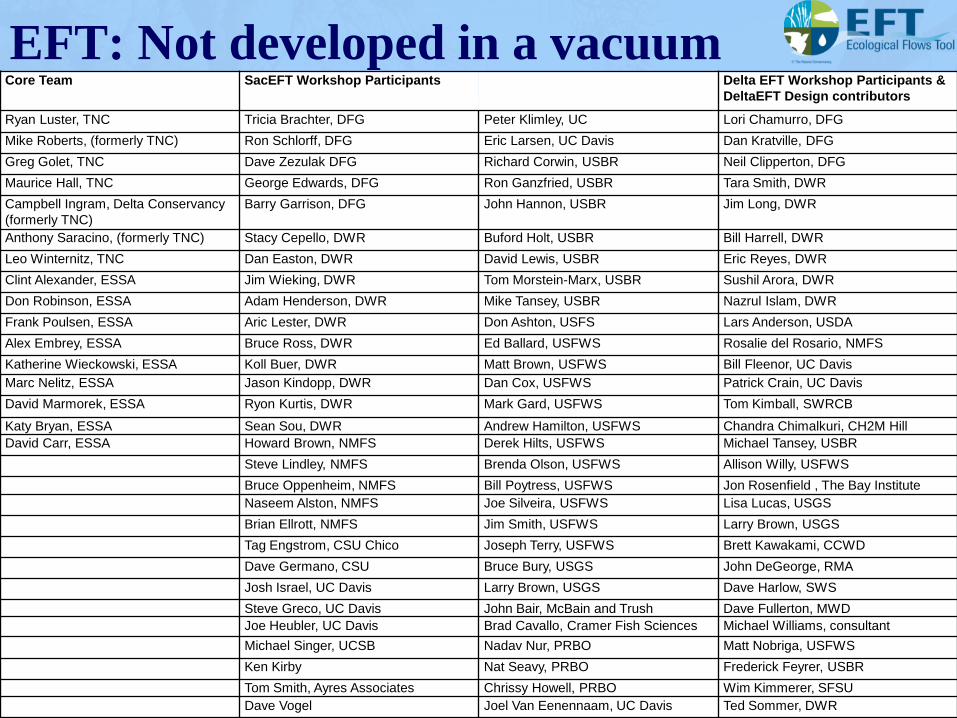
EFT: Not developed in a vacuum
Core Team SacEFT Workshop Participants Delta EFT Workshop Participants &
DeltaEFT Design contributors
Ryan Luster, TNC Tricia Brachter, DFG Peter Klimley, UC Lori Chamurro, DFG
Mike Roberts, (formerly TNC) Ron Schlorff, DFG Eric Larsen, UC Davis Dan Kratville, DFG
Greg Golet, TNC Dave Zezulak DFG Richard Corwin, USBR Neil Clipperton, DFG
Maurice Hall, TNC George Edwards, DFG Ron Ganzfried, USBR Tara Smith, DWR
Campbell Ingram, Delta Conservancy
(formerly TNC)
Barry Garrison, DFG John Hannon, USBR Jim Long, DWR
Anthony Saracino, (formerly TNC) Stacy Cepello, DWR Buford Holt, USBR Bill Harrell, DWR
Leo Winternitz, TNC Dan Easton, DWR David Lewis, USBR Eric Reyes, DWR
Clint Alexander, ESSA Jim Wieking, DWR Tom Morstein-Marx, USBR Sushil Arora, DWR
Don Robinson, ESSA Adam Henderson, DWR Mike Tansey, USBR Nazrul Islam, DWR
Frank Poulsen, ESSA Aric Lester, DWR Don Ashton, USFS Lars Anderson, USDA
Alex Embrey, ESSA Bruce Ross, DWR Ed Ballard, USFWS Rosalie del Rosario, NMFS
Katherine Wieckowski, ESSA Koll Buer, DWR Matt Brown, USFWS Bill Fleenor, UC Davis
Marc Nelitz, ESSA Jason Kindopp, DWR Dan Cox, USFWS Patrick Crain, UC Davis
David Marmorek, ESSA Ryon Kurtis, DWR Mark Gard, USFWS Tom Kimball, SWRCB
Katy Bryan, ESSA Sean Sou, DWR Andrew Hamilton, USFWS Chandra Chimalkuri, CH2M Hill
David Carr, ESSA Howard Brown, NMFS Derek Hilts, USFWS Michael Tansey, USBR
Steve Lindley, NMFS Brenda Olson, USFWS Allison Willy, USFWS
Bruce Oppenheim, NMFS Bill Poytress, USFWS Jon Rosenfield , The Bay Institute
Naseem Alston, NMFS Joe Silveira, USFWS Lisa Lucas, USGS
Brian Ellrott, NMFS Jim Smith, USFWS Larry Brown, USGS
Tag Engstrom, CSU Chico Joseph Terry, USFWS Brett Kawakami, CCWD
Dave Germano, CSU Bruce Bury, USGS John DeGeorge, RMA
Josh Israel, UC Davis Larry Brown, USGS Dave Harlow, SWS
Steve Greco, UC Davis John Bair, McBain and Trush Dave Fullerton, MWD
Joe Heubler, UC Davis Brad Cavallo, Cramer Fish Sciences Michael Williams, consultant
Michael Singer, UCSB Nadav Nur, PRBO Matt Nobriga, USFWS
Ken Kirby Nat Seavy, PRBO Frederick Feyrer, USBR
Tom Smith, Ayres Associates Chrissy Howell, PRBO Wim Kimmerer, SFSU
Dave Vogel Joel Van Eenennaam, UC Davis Ted Sommer, DWR

Delta Focal Species
(we care about)
Cumulative Effects & Multiple Mechanisms (DeltaEFT)
Flow RegimeDilution effects ~ Water
Quality (Ammonia, Toxic
chemicals, Algae
blooms)
Volume, timing,
frequency, variability
Water Quality
Domestic
wastewater
Ag run-off
Contaminants
Temperature,
Salinity, Turbidity
Food Webs
(Food supply)
Who Eats Who
(Predator-Prey)
Density
dependence
Invasive
Species
Habitat
(Alteration)
Floodplains
Tidal wetlands,
marshes
Levees,
weirs,
conveyance
diversions
Sea levelDelta
Exports /
Delta Outflow
SWP/CVP
Pumping
CLIMATE
CHANGE
Carbon-pollution
crisis
Catastrophic
Events
Seismic levee
failureSubsiding
land
Alternative regimes
Mortality &
selection forces
(genetic diversity)
Out-of-Delta
Effects
Harvest
Ocean
Conditions
Tributaries
Nutrient ratios
Sea level
Shifts in
precipitation timing
& volume
Warmer
water
More extreme
weather
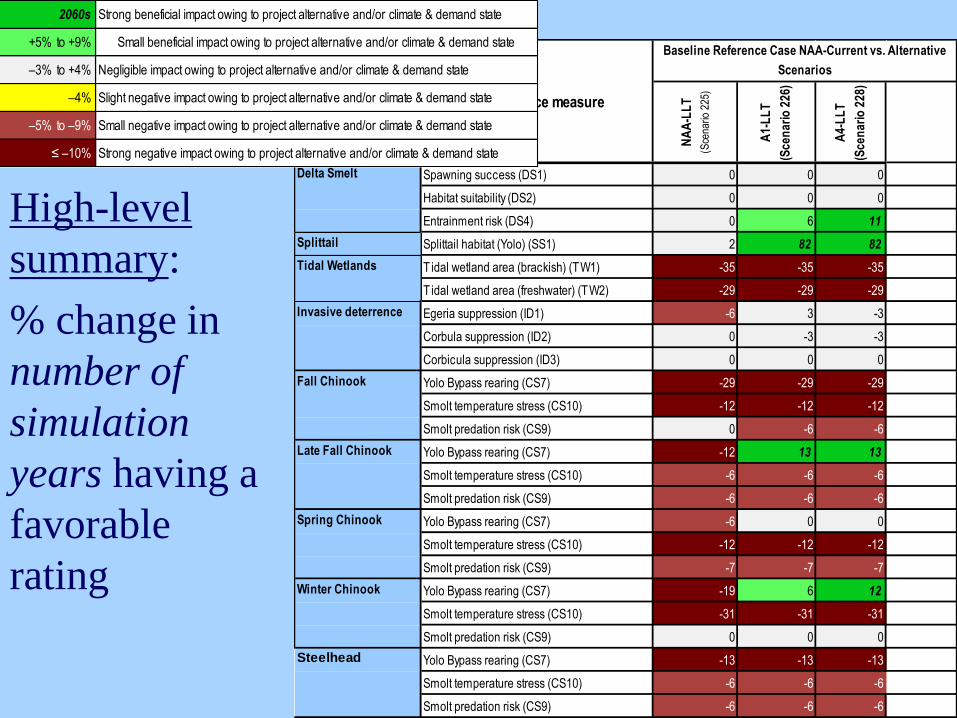
High-level
summary:
% change in
number of
simulation
years having a
favorable
rating
NA
A-L
LT
(Sce
nario
225
)
A1-
LL
T
(Sce
nar
io 2
26)
A4-
LL
T
(Sce
nar
io 2
28)
Spawning success (DS1) 0 0 0
Habitat suitability (DS2) 0 0 0
Entrainment risk (DS4) 0 6 11
Splittail Splittail habitat (Yolo) (SS1) 2 82 82
Tidal wetland area (brackish) (TW1) -35 -35 -35
Tidal wetland area (freshwater) (TW2) -29 -29 -29
Egeria suppression (ID1) -6 3 -3
Corbula suppression (ID2) 0 -3 -3
Corbicula suppression (ID3) 0 0 0
Yolo Bypass rearing (CS7) -29 -29 -29
Smolt temperature stress (CS10) -12 -12 -12
Smolt predation risk (CS9) 0 -6 -6
Yolo Bypass rearing (CS7) -12 13 13
Smolt temperature stress (CS10) -6 -6 -6
Smolt predation risk (CS9) -6 -6 -6
Yolo Bypass rearing (CS7) -6 0 0
Smolt temperature stress (CS10) -12 -12 -12
Smolt predation risk (CS9) -7 -7 -7
Yolo Bypass rearing (CS7) -19 6 12
Smolt temperature stress (CS10) -31 -31 -31
Smolt predation risk (CS9) 0 0 0
Yolo Bypass rearing (CS7) -13 -13 -13
Smolt temperature stress (CS10) -6 -6 -6
Smolt predation risk (CS9) -6 -6 -6
Invasive deterrence
Focal species Performance measure
Baseline Reference Case NAA-Current vs. Alternative
Scenarios
Delta Smelt
Tidal Wetlands
Fall Chinook
Late Fall Chinook
Spring Chinook
Winter Chinook
Steelhead
2060s
+5% to +9%
–3% to +4%
–4%
–5% to –9%
≤ –10% Strong negative impact owing to project alternative and/or climate & demand state
Strong beneficial impact owing to project alternative and/or climate & demand state
Small beneficial impact owing to project alternative and/or climate & demand state
Negligible impact owing to project alternative and/or climate & demand state
Slight negative impact owing to project alternative and/or climate & demand state
Small negative impact owing to project alternative and/or climate & demand state

The climate of 2060s (and its associated sea level) +
increased human water demands = strong downward
impacts on most DeltaEFT performance measures
Exceptions: 1) Yolo Bypass habitats, which benefit from
notching of the Fremont Weir under the A1 and A4 alts
and 2) Delta smelt entrainment which is reduced by
lessening of frequency of reverse flows in Old and Middle
Rivers under A1/A4 operations.
Key Message

Multi-year “roll-up”

Annual “roll-up”
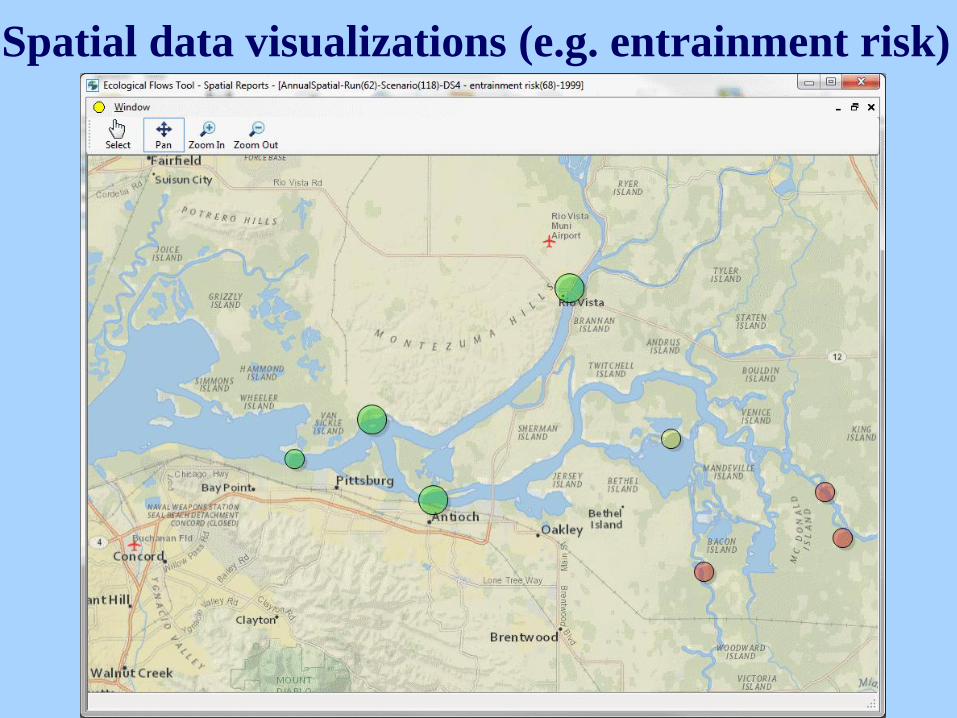
Spatial data visualizations (e.g. entrainment risk)

Delta Smelt Entrainment (DS4): Annual details Scenario:
Water year:
Location of interest:
Units Percentage
1995
VERSION 2 (HISTORICAL)
TURNER CUT NR HOLT CA
0.00
0.10
0.20
0.30
0.40
0.50
0.60
0.70
0.80
0.90
1.00
0
10
20
30
40
50
60
70
80
90
100
0.0
0
0.1
0
0.2
0
0.3
0
0.4
0
0.5
0
0.6
0
0.7
0
0.8
0
0.9
0
1.0
0
We
igh
t
En
tra
inm
en
t (%
)
Export:Import Ratio
DeltaEFT - Delta Smelt Entrainment Report
Location Weight
Particle Tracking Model logistic fit
Delta Smelt Entrainment
0
0.002
0.004
0.006
0.008
0.01
0.012
0.014
-10000
-5000
0
5000
10000
15000
01-M
ar
08-M
ar
15-M
ar
22-M
ar
29-M
ar
05-A
pr
12-A
pr
19-A
pr
26-A
pr
03-M
ay
10-M
ay
17-M
ay
24-M
ay
31-M
ay
07-J
un
14-J
un
21-J
un
28-J
un
05-J
ul
12-J
ul
Da
ily W
eig
ht
Flo
w (
CFS
)
Period of Interest
Old and Middle River (OMR) Flows
Daily weights
OMR Flow
Weighted flow
Zero flow
Scenario:
Water year:
Location of interest:
Units Percentage
1991
VERSION 2 (HISTORICAL)
TURNER CUT NR HOLT CA
0.00
0.10
0.20
0.30
0.40
0.50
0.60
0.70
0.80
0.90
1.00
0
10
20
30
40
50
60
70
80
90
100
0.0
0
0.1
0
0.2
0
0.3
0
0.4
0
0.5
0
0.6
0
0.7
0
0.8
0
0.9
0
1.0
0
We
igh
t
En
tra
inm
en
t (%
)
Export:Import Ratio
DeltaEFT - Delta Smelt Entrainment Report
Location Weight
Particle Tracking Model logistic fit
Delta Smelt Entrainment
0
0.002
0.004
0.006
0.008
0.01
0.012
0.014
-12000
-10000
-8000
-6000
-4000
-2000
0
01-M
ar
08-M
ar
15-M
ar
22-M
ar
29-M
ar
05-A
pr
12-A
pr
19-A
pr
26-A
pr
03-M
ay
10-M
ay
17-M
ay
24-M
ay
31-M
ay
07-J
un
14-J
un
21-J
un
28-J
un
05-J
ul
12-J
ul
Da
ily W
eig
ht
Flo
w (
CFS
)
Period of Interest
Old and Middle River (OMR) Flows
Daily weights
OMR Flow
Weighted flow
Zero flow

1. Determine priorities for ecological needs &
develop alternative ecological flow regimes x
water year class
• Include both flow and non-flow actions
2. Test alternative eFlow regimes (& paired non-flow
actions) vs. other beneficial uses.
• What would these guidelines do to ability to meet
established rights & standards? Which ones have least
impact on water deliveries, power production, water
temperatures, etc.?
Question 1: What types of analyses should be completed?

3. Effects on major linked eco-regions (Sacramento,
San Joaquin).
4. Develop more specific statements of frequency
different targets needed & characterize within year
trade-offs (e.g., “species x over species y if…”).
5. Resilience of strategies vs. future climate change
effects on water supplies, demand and sea level.
Question 1: What types of analyses should be completed?
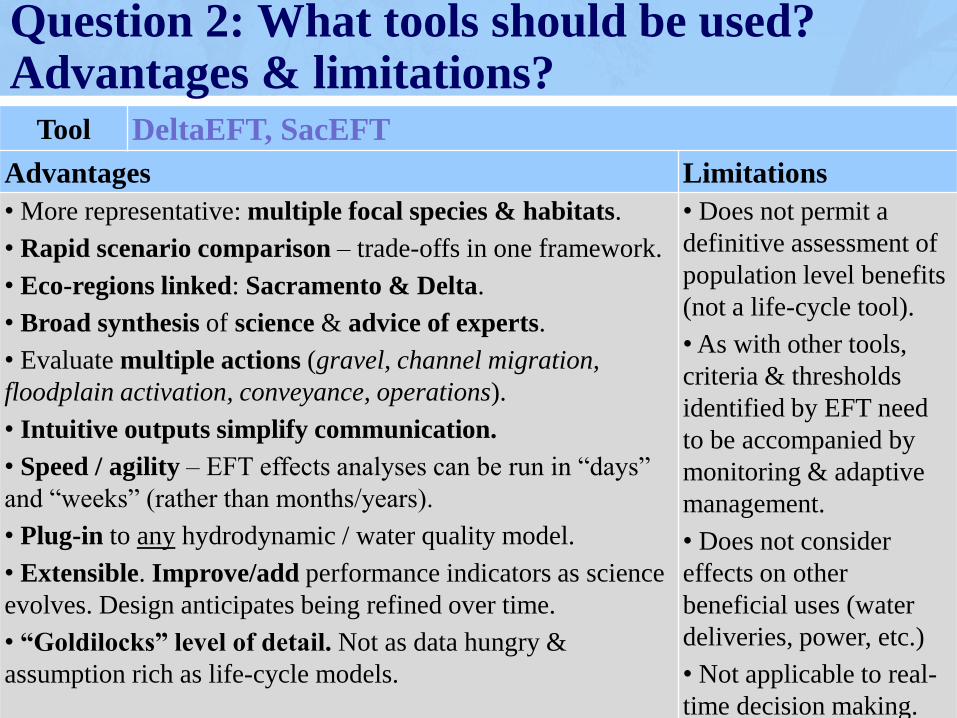
Question 2: What tools should be used? Advantages & limitations?
Tool DeltaEFT, SacEFT
Advantages Limitations
• More representative: multiple focal species & habitats.
• Rapid scenario comparison – trade-offs in one framework.
• Eco-regions linked: Sacramento & Delta.
• Broad synthesis of science & advice of experts.
• Evaluate multiple actions (gravel, channel migration,
floodplain activation, conveyance, operations).
• Intuitive outputs simplify communication.
• Speed / agility – EFT effects analyses can be run in “days”
and “weeks” (rather than months/years).
• Plug-in to any hydrodynamic / water quality model.
• Extensible. Improve/add performance indicators as science
evolves. Design anticipates being refined over time.
• “Goldilocks” level of detail. Not as data hungry &
assumption rich as life-cycle models.
• Does not permit a
definitive assessment of
population level benefits
(not a life-cycle tool).
• As with other tools,
criteria & thresholds
identified by EFT need
to be accompanied by
monitoring & adaptive
management.
• Does not consider
effects on other
beneficial uses (water
deliveries, power, etc.)
• Not applicable to real-
time decision making.

Question 2: What tools should be used? Advantages & limitations?
Tools WEAP, CALVIN, CALSIM-USRWQM/USRDOM, DSM2, etc.
& related hydro-power, water temperature models
Advantages Limitations / Challenges
• Numerous. These tools
have multiple applications &
are essential to planning.
• Physical hydrosystem
effects on water deliveries,
storage, exports, water
temperature, power
generation, flood control for
SWP and CVP.
• Scenario evaluation -
tradeoffs.
• Options for integrating and accurately representing
ecological criteria / guidelines into operations.
• Ability to “unwind” and “re-constrain” hydrosystem
to rapidly evaluate ecological flow regime criteria
(rather than simply cumulatively add ever more low-
priority constraints).
• Economic evaluations not always included.
(Including economic benefits of
fish/wildlife/recreation).
• Future climate / sea level / demand and resilience of
boundary conditions & calibration assumptions?