
A TaqMan-based multiplex real-time PCR assay for the rapid ...
Multi-Site Evaluation of a Multiplex Assay for the Rapid Detection of Leukemia-Associated Fusion Transcripts
Christopher D. Gocke1, Hayley Newell2, Wailairat Laosinchai-Wolf3, Cecilia Higgs1, Judith Karp1, Mike Griffiths2, Joanne Mason2, and Emmanuel Labourier3
1Johns Hopkins University School of Medicine, Baltimore, Maryland, USA | 2West Midlands Regional Genetics Laboratory (WMRGL), Birmingham, UK | 3Asuragen Inc., Austin, Texas, USA
SUMMARY• The Signature® LTx v2.0 Kit (RUO)* is a qualitative assay for the detection of 12 fusion transcripts resulting
from 7 chromosomal abnormalities associated with AML, ALL and CML
• The multiplexed and flexible assay format is compatible with the clinical laboratory setting and the development of expanded panels for other relevant transcripts and mutations
• Preliminary research data indicate that the Signature® technology platform has the analytical and clinical performance required to complement current standard cytogenetic methods**
INTRODUCTIONModern therapy for leukemia is based on the principle of risk stratification. Recurring genetic abnormalities commonly found in leukemia, including balanced chromosomal translocations, are often associated with either an unfavorable or favorable prognosis enabling the use of more or less toxic interventions. Knowledge of the specific genetic abnormality can also facilitate the use of targeted therapies. At the molecular level, the chromosomal breakpoints can vary over a wide region within the genes involved, and it is often necessary to identify the specific fusion transcript variant expressed by leukemic cells for subsequent molecular measurement of patient response during treatment and for assessment of residual disease.
Accurate, rapid and sensitive molecular methods are therefore required to complement standard cytogenetic techniques and speed up the routine workup of leukemia. The main objective of this study was to evaluate in a clinical laboratory setting the potential utility of a multiplex molecular assay for the simultaneous detection of 12 leukemia fusion transcripts and to establish its preliminary performance relative to standard cytogenetic methods.
MATERIALS AND METHODSTotal RNA was isolated from peripheral blood or bone marrow specimens using laboratory-validated methods at site 2 (JHU) or 3 (WMRGL). Residual RNA samples were tested with the Signature ® LTx v2.0 Kit (RUO)* at each site. Fifty independent specimens from site 2 were also tested at site 1 (Asuragen). Total RNA was reverse transcribed into cDNA and amplified by multiplex PCR using target-specific, biotin-modified primers. GAPDH transcripts were co-amplified in each sample and concurrently analyzed to serve as endogenous internal controls. The PCR products were then sorted on a liquid bead array containing oligonucleotide probes specific for each marker and detected using the Luminex® 200 System. Qualitative calls (positive or negative for each target) were determined relative to a fixed cut off signal set at 350 MFI, above the distribution of negative signals (Figure 1). All archived specimens in this study were de-identified and no protected health information was released.
Rep. Signal Min. MFI
Max. MFI
Med. MFI
Avg. MFI
St. Dev.
No RNA (blank) 36 396 0 218 86 90 40
HL60 cell line RNA 36 396 0 212 91 95 40
Control RNA 16 176 0 182 87 84 41
Overall 88 968 0 218 89 91 40
Figure 1. Distribution of negative signals. Limit of blank and normal range studies were performed by testing in triplicate a no RNA control and HL60 total RNA in 12 runs with 3 operators, 3 thermal cyclers and 3 Luminex systems over multiple days at site 1 (36 replicates). Total RNA purified with 2 different extraction methods from 8 healthy control whole blood specimens were also tested at 2 input volumes representing a mass input range from 75 to 1,400 ng per RT reaction. A total of 968 individual probes results were generated.
Figure 2. Representative examples with control materials. Median fluorescence intensity (MFI) signals are shown for the 3 controls included in the Signature® LTx v2.0 Kit, a total RNA sample isolated from a translocation-negative cell line (HL60), and 12 different synthetic fusion transcripts prepared by in vitro transcription and spiked in a background of HL60 RNA. Positive signals above the qualitative cut off are highlighted in orange. Preliminary analytical specificity was also confirmed with total RNA isolated from cell lines expressing fusion transcripts specific for 8 out of the 11 probes included in the assay (data not shown). All samples were confirmed by Sanger sequencing.
Site 1 Site 2 Site 3 Total % agreement
BCR-ABL1 e13a2 3 7 6 16 100
BCR-ABL1 e14a2 2 3 6 11 90.9†
BCR-ABL1 e1a2 2 7 6 15 93.3†
ETV6-RUNX1 0 0 5 5 100
MLL-AFF1 0 0 8 8 100
CBFB-MYH11 A 2 4 6 12 100
CBFB-MYH11 D 1 0 1 2 100
PML-RARA bcr 1 0 2 5 7 100
PML-RARA bcr 3 0 7 5 12 100
RUNX1-RUNX1T1 4 2 6 12 100
TCF3-PBX1 0 0 5 5 100
Positive 14 32 59 105 100
Negative 44 37 12 93 97.9†
Fail 0 0 1 1 n/a
Total 58 69 72 199 n/a
% agreement 100 97.1† 100 n/a 99.0†
†Two specimens from Ph+ ALL or CML cases under treatment and in cytogenetic remission were found low positive with Signature at site 2
Cytogenetics
Pos Neg Total
Signature
Pos 103 2† 105
Neg 0 93 93
Total 103 95 198
Positive % agreement 100 (96.4-100)
Negative % agreement 97.9 (92.6-99.4)
Overall % agreement 99.0 (96.4-99.7)
Site 1 Site 2 Site 3 Total
At presentation 50 57 58 165
At follow up 0 12 2 14
Cytogenetics Pos. 14 30 60 104
Cytogenetics Neg.. 36 39 0 75
Healthy donor 8 0 12 20
Total 58 69 72 199
Category Count
AML 94
ALL 38
CML 27
MDS 8
AL mix lineage 5
MPN 3
Other 4
Healthy donor 20
Total 199
Chrom. Abn. Count
t(9;22) 41
t(15;17) 19
inv(16) 14
t(8;21) 12
t(4;11) 8
t(1;19) 5
t(12;21) 5
n/a 95
Total 199
Figure 3. Study design and sample set. A total of 179 residual total RNA samples from study subjects previously evaluated by karyotyping and/or FISH (and independent molecular tests for site 3) were evaluated with the Signature® LTx v2.0 Kit at 3 independent sites. Among this set, 104 specimens were positive by cytogenetics for one of the 7 different chromosomal abnormalities included in the Signature assay design. Fourteen specimens were from follow up analyses, including 5 relapse cases positive for t(9;22), t(8;21) or t(4;11). The clinical set was supplemented with 20 RNA samples from control healthy donors. The “other” category included 1 poorly differentiated hematologic malignancy, 1 blastic plasmacytoid dendritic cell neoplasm, 1 Felty syndrome, and 1 treated T-PLL with no residual disease, all negative by cytogenetics at site 2.
Figure 4. Summary of results. The correct fusion transcript was detected with the Signature® v2.0 assay in 103 specimens positive by cytogenetics, including 5 relapse cases at sites 2 and 3. Among the 95 specimens negative by cytogenetics, 2 were found low positive by Signature at site 2 (768 and 946 MFI for e14a2 or e1a2, respectively). This discrepancy can be explained by the difference in analytical sensitivity between the 2 methods (the 2 cases were Ph+ at presentation and negative by FISH at follow up). One Ph+ CML specimen failed amplification at site 3 (no GAPDH endogenous control signal) corresponding to an overall failure rate of 0.5% (1.4% at site 3).
Figure 5. Quantitative analysis. The graph shows the distribution of positive, negative and GAPDH endogenous control signals (MFI) in the log space for each of the 3 sites. The boxes represent the 25th, 50th (median) and 75th percentiles of the signal distributions for each category. The tails of the distributions are indicated by whiskers corresponding to 1.5 IQR (interquartile range, that is the 75th percentile value minus the 25th percentile value) or the maximum/minimum value of the distributions if those values were within ±1.5 IQR. The median MFI of the positive and negative signal distributions at each site are shown. These results indicate that a qualitative cut off between 300 and 400 MFI is appropriate for all 3 sites.
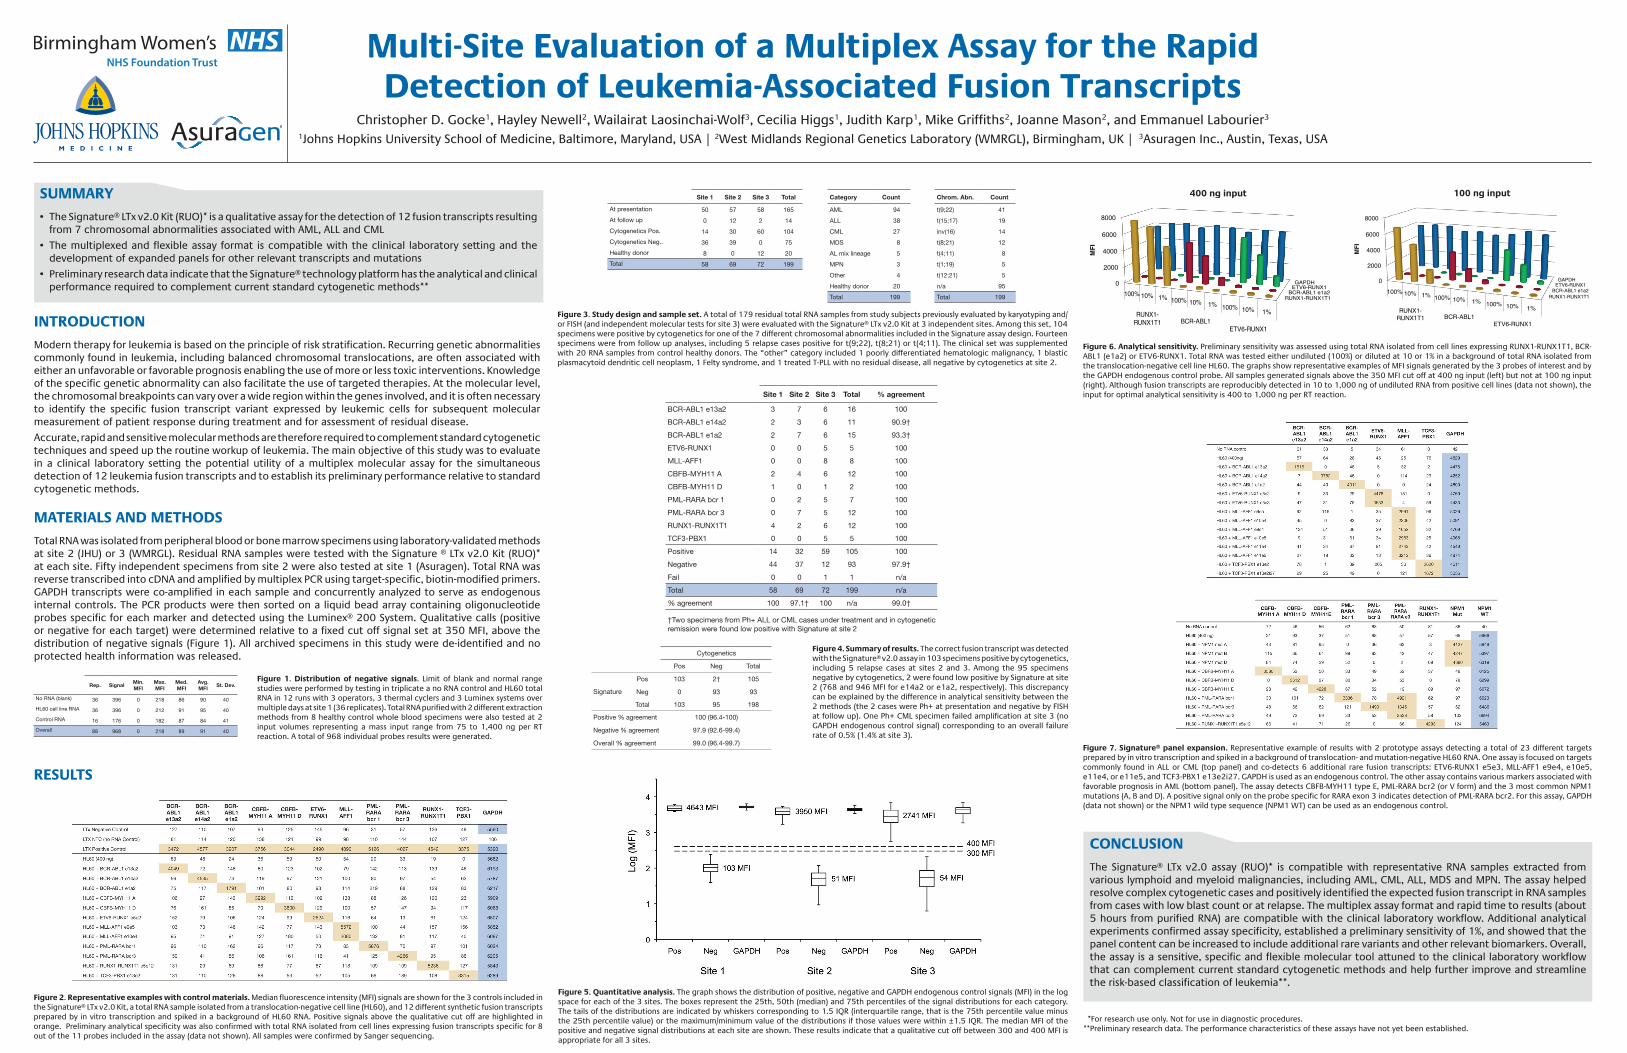
Figure 6. Analytical sensitivity. Preliminary sensitivity was assessed using total RNA isolated from cell lines expressing RUNX1-RUNX1T1, BCR-ABL1 (e1a2) or ETV6-RUNX1. Total RNA was tested either undiluted (100%) or diluted at 10 or 1% in a background of total RNA isolated from the translocation-negative cell line HL60. The graphs show representative examples of MFI signals generated by the 3 probes of interest and by the GAPDH endogenous control probe. All samples generated signals above the 350 MFI cut off at 400 ng input (left) but not at 100 ng input (right). Although fusion transcripts are reproducibly detected in 10 to 1,000 ng of undiluted RNA from positive cell lines (data not shown), the input for optimal analytical sensitivity is 400 to 1,000 ng per RT reaction.
400 ng input
RUNX1-RUNX1T1 BCR-ABL1 e1a2
ETV6-RUNX1 GAPDH 0
2000
4000
6000
8000
MF
I
100% 10% 1% 100% 10% 1% 100% 10% 1% RUNX1-RUNX1T1 BCR-ABL1
ETV6-RUNX1
100 ng input
RUNX1-RUNX1T1 BCR-ABL1 e1a2
ETV6-RUNX1 GAPDH 0
2000
4000
6000
8000
100% 10% 1% 100% 10% 1% 100% 10% 1% RUNX1-RUNX1T1 BCR-ABL1
ETV6-RUNX1
MF
I
Figure 7. Signature® panel expansion. Representative example of results with 2 prototype assays detecting a total of 23 different targets prepared by in vitro transcription and spiked in a background of translocation- and mutation-negative HL60 RNA. One assay is focused on targets commonly found in ALL or CML (top panel) and co-detects 6 additional rare fusion transcripts: ETV6-RUNX1 e5e3, MLL-AFF1 e9e4, e10e5, e11e4, or e11e5, and TCF3-PBX1 e13e2i27. GAPDH is used as an endogenous control. The other assay contains various markers associated with favorable prognosis in AML (bottom panel). The assay detects CBFB-MYH11 type E, PML-RARA bcr2 (or V form) and the 3 most common NPM1 mutations (A, B and D). A positive signal only on the probe specific for RARA exon 3 indicates detection of PML-RARA bcr2. For this assay, GAPDH (data not shown) or the NPM1 wild type sequence (NPM1 WT) can be used as an endogenous control.
CONCLUSIONThe Signature® LTx v2.0 assay (RUO)* is compatible with representative RNA samples extracted from various lymphoid and myeloid malignancies, including AML, CML, ALL, MDS and MPN. The assay helped resolve complex cytogenetic cases and positively identified the expected fusion transcript in RNA samples from cases with low blast count or at relapse. The multiplex assay format and rapid time to results (about 5 hours from purified RNA) are compatible with the clinical laboratory workflow. Additional analytical experiments confirmed assay specificity, established a preliminary sensitivity of 1%, and showed that the panel content can be increased to include additional rare variants and other relevant biomarkers. Overall, the assay is a sensitive, specific and flexible molecular tool attuned to the clinical laboratory workflow that can complement current standard cytogenetic methods and help further improve and streamline the risk-based classification of leukemia**.
RESULTS
*For research use only. Not for use in diagnostic procedures.**Preliminary research data. The performance characteristics of these assays have not yet been established.


