MULTI SECTORAL NEEDS ASSESSMENT IN HOST COMMUNITIES ... · METADATA / BIODATA Respondent gender...
46
MULTI SECTORAL NEEDS ASSESSMENT IN HOST COMMUNITIES – Preliminary findings
Transcript of MULTI SECTORAL NEEDS ASSESSMENT IN HOST COMMUNITIES ... · METADATA / BIODATA Respondent gender...

MULTI SECTORAL NEEDS
ASSESSMENT IN HOST COMMUNITIES
– Preliminary findings
OBJECTIVE
General Objective:
To inform evidence-based strategic planning of humanitarian response activities by the
ISCG, sectors, and sector partners, through the provision of up-to-date, relevant and
comparable information on the multi-sectoral needs of host community populations
across areas hosting refugees in Cox’s Bazar District, Bangladesh.
Specific Objective(s):
1. Provide a comprehensive evidence base of multi-sectoral needs among host
community populations, including:
• Comparison between affected Unions and Upazilas
• Comparison at Union level between host community populations directly
and indirectly affected by the refugee influx
2. Provide a common dataset to inform reporting on 2018 JRP and development of
2019 sector strategies.

METHODOLOGY
Design: Indicators selected by sectors, reviewed and refined by
REACH with support from NPM/ACAPS.
Target population: All Bangladeshi communities within Teknaf and
Ukhiya Upazilas.
Household survey approach:
• Stratified random sample producing data generalisable to the
population of each Union at 95% confidence level and 6% margin
of error, and of each Upazila at 95% confidence level and 3%
margin of error
• Approximately 262 interviews per union, total 2873.
• Aimed for 50/50 balance between male and female respondents
• Sample designed to allow correlation of key findings according to
distance from camp
Data collection team:
• 38 REACH enumerators and 21 NPM enumerators conducted
the surveys.
• Male enumerators surveyed male respondents and females
surveyed female respondents.
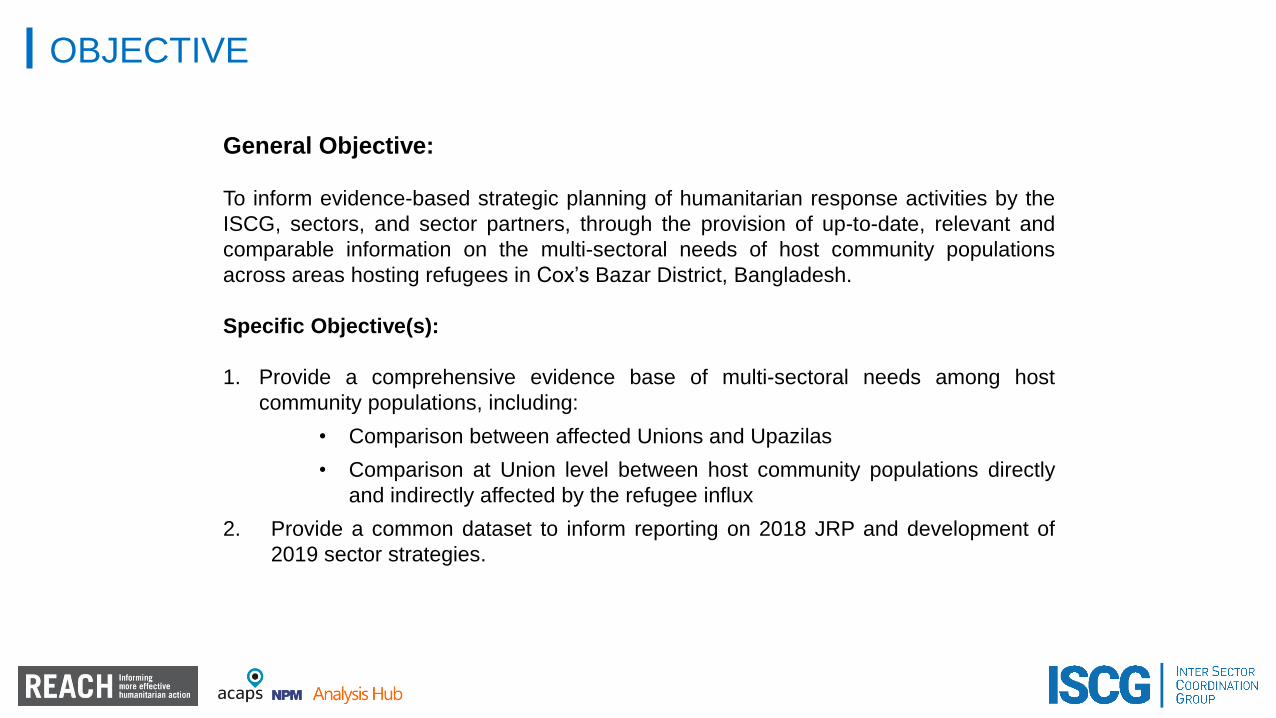
METHODOLOGY
The following sectors were covered in the assessment:
• WASH
• Education
• Health
• Nutrition
• Protection
• Shelter NFI
• Food Security Livelihoods
• Communication with communities

METADATA / BIODATARespondent gender
Gender of household head
51%
49%
Ukhiya
Female Male
58%
42%
Teknaf
Female Male
55%
45%
Total
Female Male
14% 17% 16%
86% 83% 84%
Ukhiya Teknaf Total
Female Male
Age and gender composition of surveyed households
• Average age of respondents was 36.6 in Teknaf years and 37.2
years in Ukhiya
• Average household size is 5.7 in Teknaf and 5.5 in Ukhiya.
• 25% lactating women and 7% pregnant women.
Males Females
4% Aged 60+ 2%
16% Aged 25-59 17%
7% Aged 18-24 8%
8% Aged 12-17 8%
10% Aged 5-11 9%
6% Aged 0-4 5%
WASH – Water
Of households reporting access to an improved drinking water
source, % that report it was reliable*
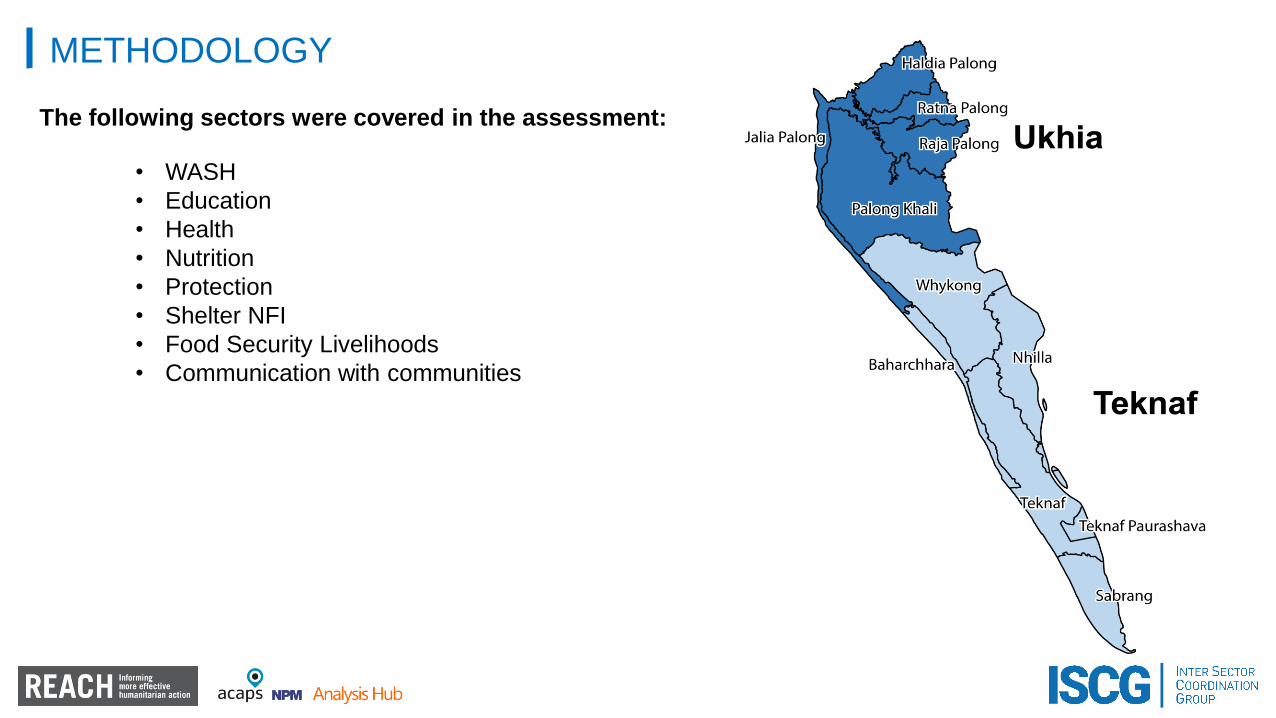
INDICATOR: % of households with access to improved reliable drinking water source
Only 1% in Teknaf and 0% in Ukhiya reported having access to
unimproved source of water: surface water, unprotected dugwell and
unprotected springwell.
2% in Teknaf Sadar reported using surface water, 1% in Whykong and
Teknaf Paurashabha
Water source Ukhiya Teknaf Total
Tubewells / borehole /
hand pump89% 83% 86%
Piped water tap /
tapstand into settlement
site
11% 12% 11%
Protected dug well 0% 4% 2%
86% 87% 86%
11% 11% 11%
3% 2% 3%
Ukhiya Teknaf Total
Always/year-round Intermitently (predictable) Intermitently (unpredictable)
% of households by primary water source
* This question was only asked to the 99% of respondents who reported improved sources of
water as their primary water source

WASH – Water
* Respondents could select more than one option
INDICATOR: % of households reporting having enough water for
drinking, cooking, washing, and bathing
INDICATOR: % of households having problems related to access to
water
30% of households reported having problems collecting water, (29% in
Teknaf and 32% in Ukhiya)
79%
21%
Ukhiya
Yes No
72%
15%
6% 4% 2% 1%
69%
14%6% 5% 3% 3%
70%
14%
6% 5% 3% 2%
5 minutes 10 minutes 15 minutes 20 minutes 30 minutes > 30 minutes
Ukhiya Teknaf Total
82%
18%
Teknaf
Yes No
81%
19%
Total
Yes No
6% in Teknaf and 3% in Ukhiya reported taking 30 and
more than 30 minutes to and from water source.
INDICATOR: Time required for one water collection journey,
including travel in both directions and queuing
% households reporting problems collecting water, by problem*
Problems Ukhiya Teknaf Total
Water source is too far 16% 19% 18%
Path to water source is too steep 6% 6% 6%
The source is available some times of the day 7% 6% 7%
Going to the source/collecting water is
dangerous 3% 4% 4%
Water tastes bad 11% 7% 9%
Water smells bad 6% 3% 4%
Water doesn’t look good 6% 4% 5%
Other 0% 0% 0%

Wash – Water
INDICATOR: % of households who practice water treatment
* Respondents could select more than one option.
10%
90%
Ukhiya
Yes No
15%
85%
Teknaf
Yes No
13%
87%
Total
Yes No
INDICATOR: % of households with soap in the household
74% 72% 73%
23%23% 23%
3% 5% 4%
Teknaf Ukhiya Total
Yes, seen soap Yes, didn’t see soap No
% of households reporting use of different water treatment
practices*
Ukhia Teknaf Total
Aquatabs 0% 1% 0%
PUR sachets 0% 0% 0%
Boiling 1% 1% 1%
Cloth filters 5% 8% 6%
Household filters 4% 6% 5%
Solar Disinfectant 0% 0% 0%
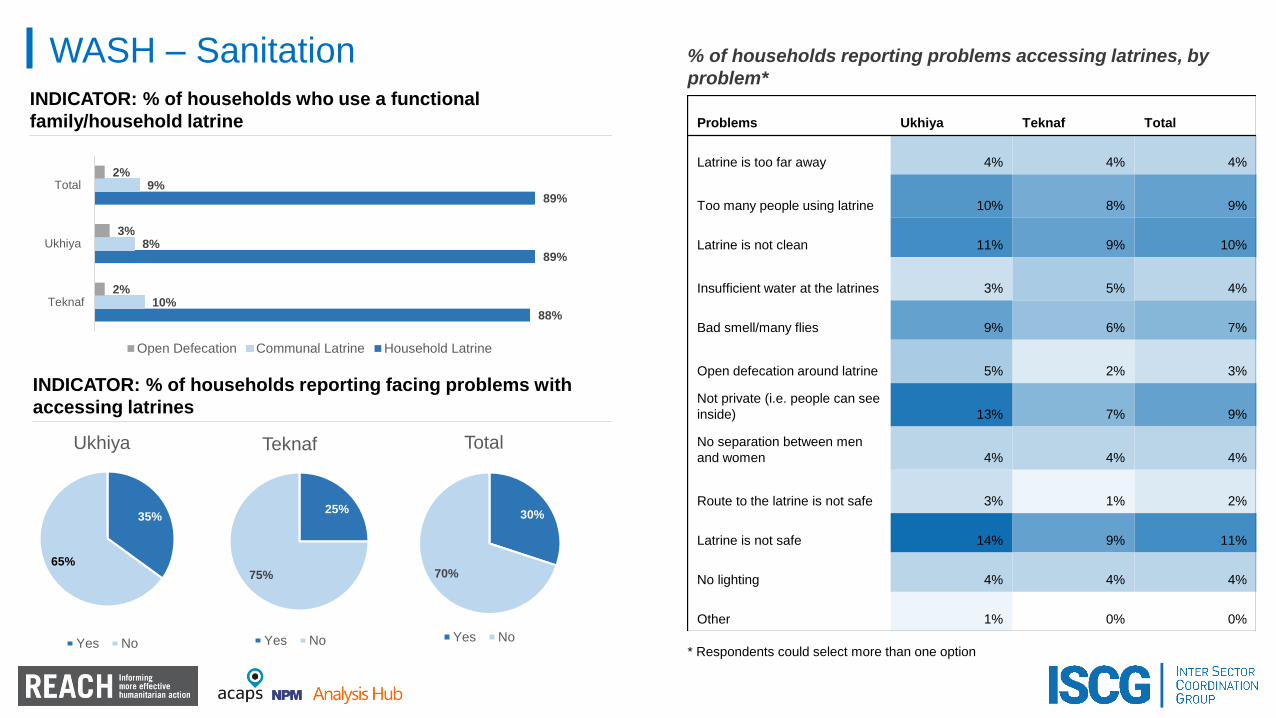
WASH – Sanitation
INDICATOR: % of households who use a functional
family/household latrine
INDICATOR: % of households reporting facing problems with
accessing latrines
* Respondents could select more than one option
88%
89%
89%
10%
8%
9%
2%
3%
2%
Teknaf
Ukhiya
Total
Open Defecation Communal Latrine Household Latrine
30%
70%
Total
Yes No
% of households reporting problems accessing latrines, by
problem*
25%
75%
Teknaf
Yes No
35%
65%
Ukhiya
Yes No
Problems Ukhiya Teknaf Total
Latrine is too far away 4% 4% 4%
Too many people using latrine 10% 8% 9%
Latrine is not clean 11% 9% 10%
Insufficient water at the latrines 3% 5% 4%
Bad smell/many flies 9% 6% 7%
Open defecation around latrine 5% 2% 3%
Not private (i.e. people can see
inside) 13% 7% 9%
No separation between men
and women 4% 4% 4%
Route to the latrine is not safe 3% 1% 2%
Latrine is not safe 14% 9% 11%
No lighting 4% 4% 4%
Other 1% 0% 0%

WASH – Sanitation
INDICATOR: % of households facing environmental sanitation problems
39%
48%
44%
18%
29%
24%
20%
27%
24%
Ukhiya Teknaf Total
Trash/solid waste Stagnant water Human faeces
% of households reporting visible presence of solid waste, stagnant water or human faeces within 30
metres of their shelter during the 30 days prior to assessment
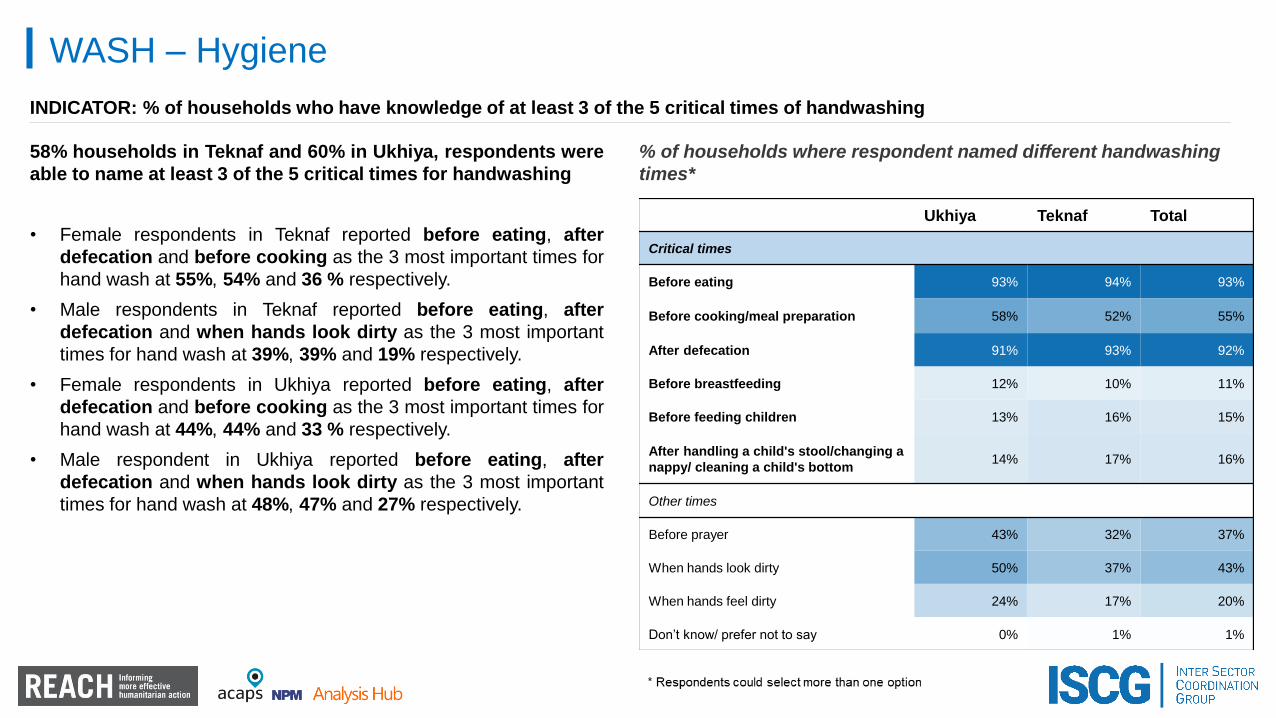
WASH – Hygiene
INDICATOR: % of households who have knowledge of at least 3 of the 5 critical times of handwashing
58% households in Teknaf and 60% in Ukhiya, respondents were
able to name at least 3 of the 5 critical times for handwashing
• Female respondents in Teknaf reported before eating, after
defecation and before cooking as the 3 most important times for
hand wash at 55%, 54% and 36 % respectively.
• Male respondents in Teknaf reported before eating, after
defecation and when hands look dirty as the 3 most important
times for hand wash at 39%, 39% and 19% respectively.
• Female respondents in Ukhiya reported before eating, after
defecation and before cooking as the 3 most important times for
hand wash at 44%, 44% and 33 % respectively.
• Male respondent in Ukhiya reported before eating, after
defecation and when hands look dirty as the 3 most important
times for hand wash at 48%, 47% and 27% respectively.
Ukhiya Teknaf Total
Critical times
Before eating 93% 94% 93%
Before cooking/meal preparation 58% 52% 55%
After defecation 91% 93% 92%
Before breastfeeding 12% 10% 11%
Before feeding children 13% 16% 15%
After handling a child's stool/changing a
nappy/ cleaning a child's bottom14% 17% 16%
Other times
Before prayer 43% 32% 37%
When hands look dirty 50% 37% 43%
When hands feel dirty 24% 17% 20%
Don’t know/ prefer not to say 0% 1% 1%
% of households where respondent named different handwashing
times*
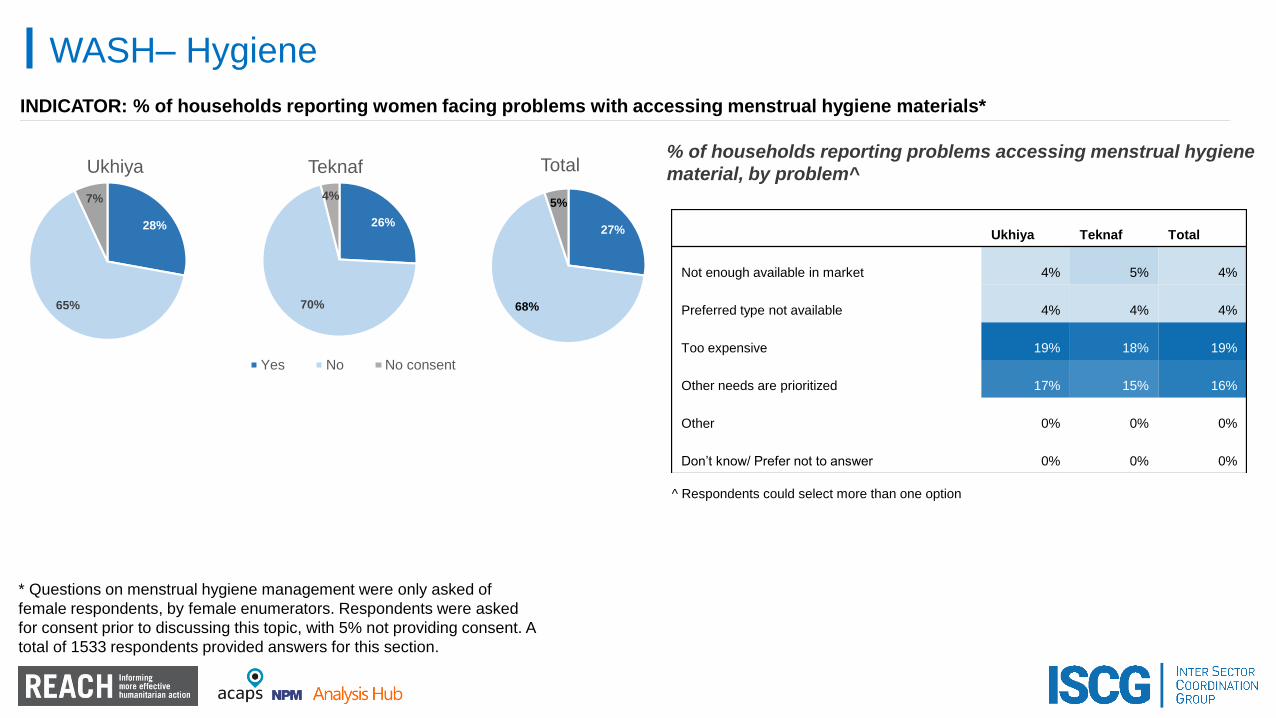
WASH– Hygiene
^ Respondents could select more than one option
INDICATOR: % of households reporting women facing problems with accessing menstrual hygiene materials*
26%
70%
4%
Teknaf
Yes No No consent
28%
65%
7%
Ukhiya
27%
68%
5%
Total% of households reporting problems accessing menstrual hygiene
material, by problem^
* Questions on menstrual hygiene management were only asked of
female respondents, by female enumerators. Respondents were asked
for consent prior to discussing this topic, with 5% not providing consent. A
total of 1533 respondents provided answers for this section.
Ukhiya Teknaf Total
Not enough available in market 4% 5% 4%
Preferred type not available 4% 4% 4%
Too expensive 19% 18% 19%
Other needs are prioritized 17% 15% 16%
Other 0% 0% 0%
Don’t know/ Prefer not to answer 0% 0% 0%
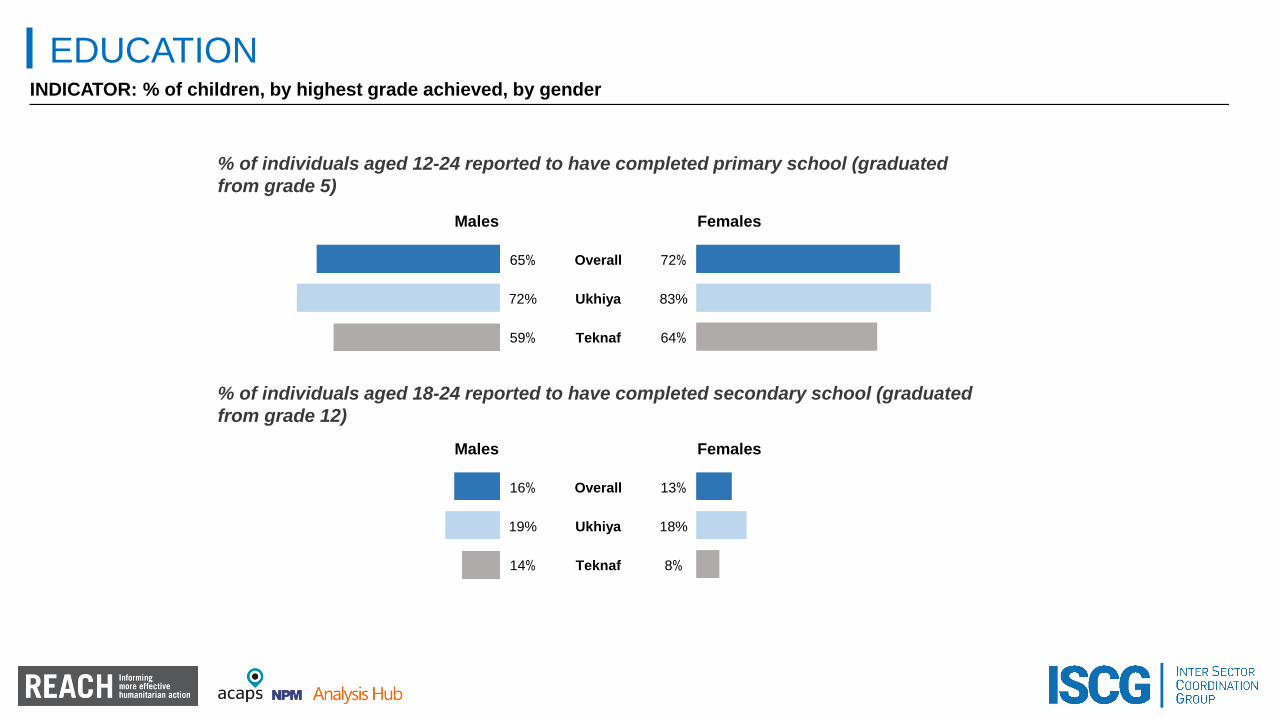
EDUCATIONINDICATOR: % of children, by highest grade achieved, by gender
Males Females
65% Overall 72%
72% Ukhiya 83%
59% Teknaf 64%
Males Females
16% Overall 13%
19% Ukhiya 18%
14% Teknaf 8%
% of individuals aged 12-24 reported to have completed primary school (graduated
from grade 5)
% of individuals aged 18-24 reported to have completed secondary school (graduated
from grade 12)
EDUCATION
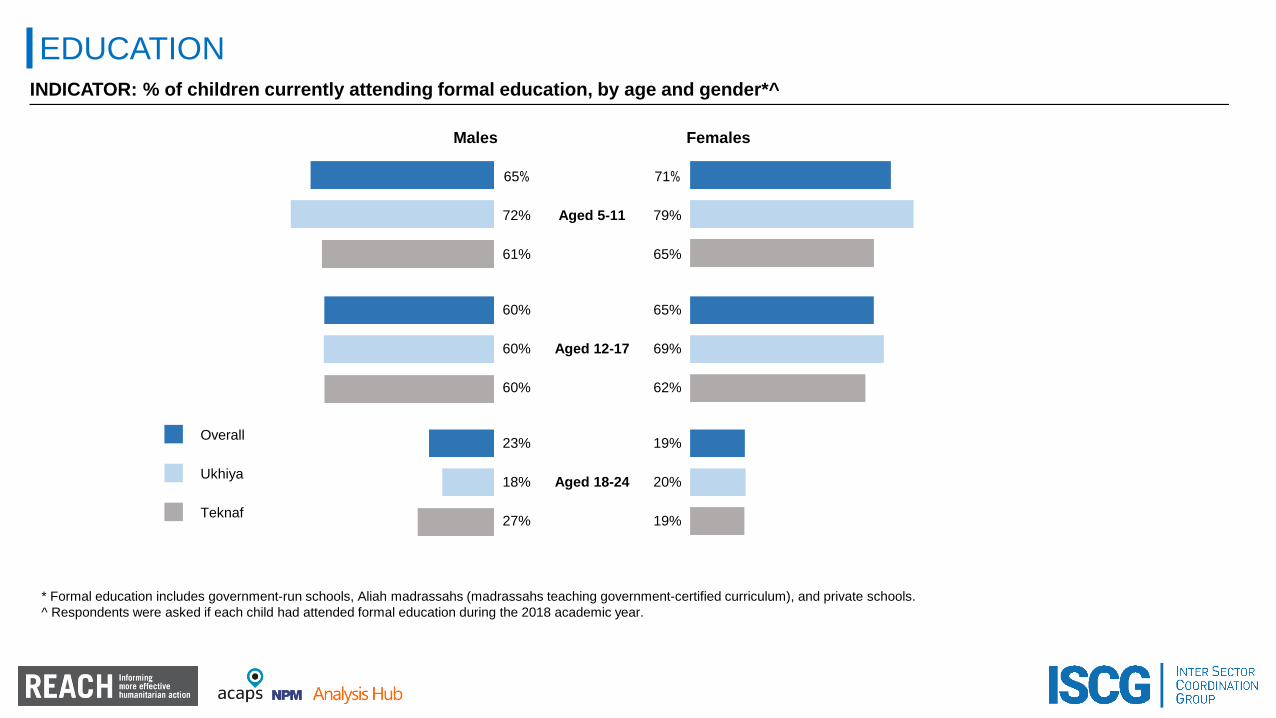
* Formal education includes government-run schools, Aliah madrassahs (madrassahs teaching government-certified curriculum), and private schools.
^ Respondents were asked if each child had attended formal education during the 2018 academic year.
Males Females
65%
Aged 5-11
71%
72% 79%
61% 65%
60%
Aged 12-17
65%
60% 69%
60% 62%
23%
Aged 18-24
19%
18% 20%
27% 19%
⬛ Overall
⬛ Ukhiya
⬛ Teknaf
INDICATOR: % of children currently attending formal education, by age and gender*^
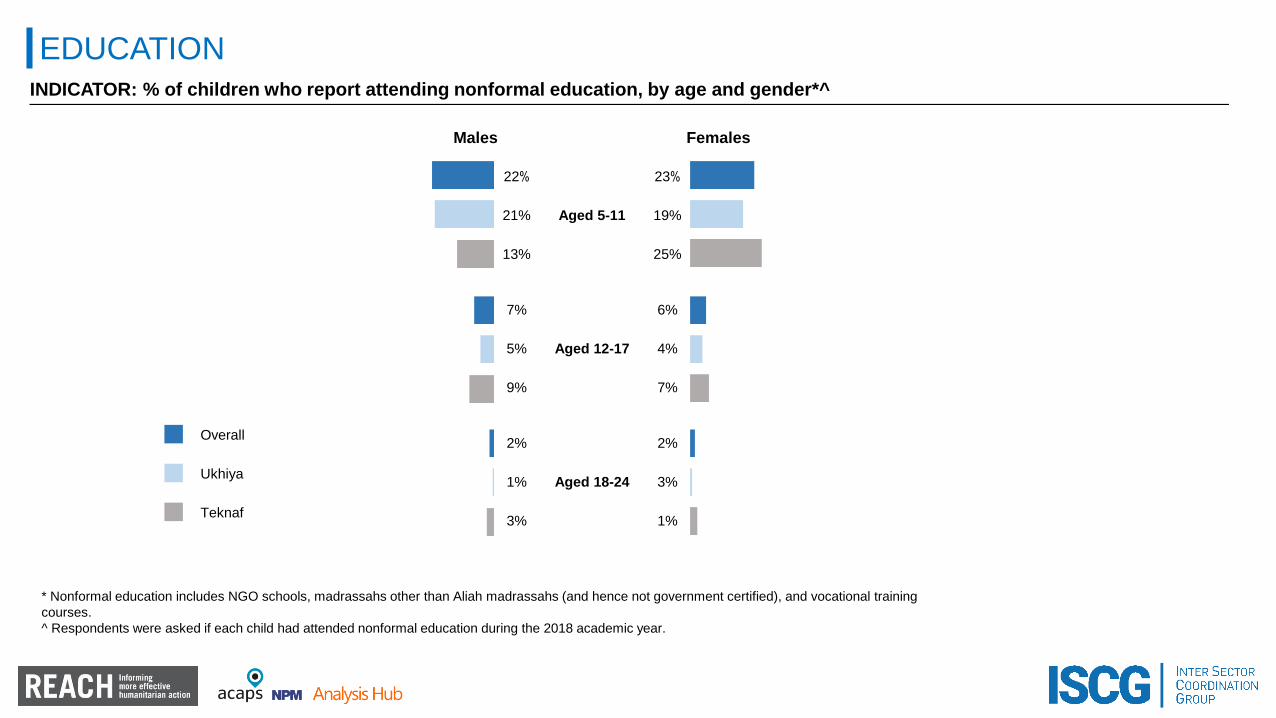
EDUCATION
* Nonformal education includes NGO schools, madrassahs other than Aliah madrassahs (and hence not government certified), and vocational training
courses.
^ Respondents were asked if each child had attended nonformal education during the 2018 academic year.
Males Females
22%
Aged 5-11
23%
21% 19%
13% 25%
7%
Aged 12-17
6%
5% 4%
9% 7%
2%
Aged 18-24
2%
1% 3%
3% 1%
⬛ Overall
⬛ Ukhiya
⬛ Teknaf
INDICATOR: % of children who report attending nonformal education, by age and gender*^
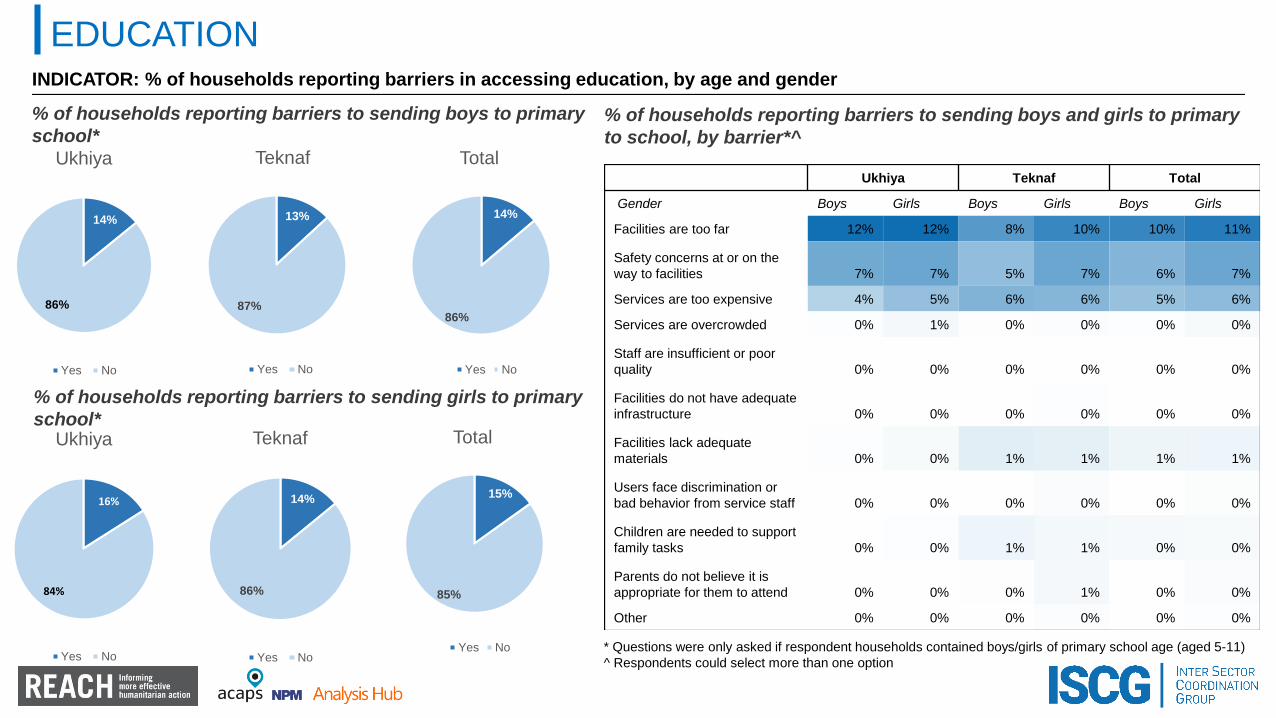
EDUCATION
* Questions were only asked if respondent households contained boys/girls of primary school age (aged 5-11)
^ Respondents could select more than one option
% of households reporting barriers to sending boys to primary
school*
% of households reporting barriers to sending girls to primary
school*
14%
86%
Ukhiya
Yes No
13%
87%
Teknaf
Yes No
16%
84%
Ukhiya
Yes No
14%
86%
Teknaf
Yes No
14%
86%
Total
Yes No
15%
85%
Total
Yes No
INDICATOR: % of households reporting barriers in accessing education, by age and gender
% of households reporting barriers to sending boys and girls to primary
to school, by barrier*^
Ukhiya Teknaf Total
Gender Boys Girls Boys Girls Boys Girls
Facilities are too far 12% 12% 8% 10% 10% 11%
Safety concerns at or on the
way to facilities 7% 7% 5% 7% 6% 7%
Services are too expensive 4% 5% 6% 6% 5% 6%
Services are overcrowded 0% 1% 0% 0% 0% 0%
Staff are insufficient or poor
quality 0% 0% 0% 0% 0% 0%
Facilities do not have adequate
infrastructure 0% 0% 0% 0% 0% 0%
Facilities lack adequate
materials 0% 0% 1% 1% 1% 1%
Users face discrimination or
bad behavior from service staff 0% 0% 0% 0% 0% 0%
Children are needed to support
family tasks 0% 0% 1% 1% 0% 0%
Parents do not believe it is
appropriate for them to attend 0% 0% 0% 1% 0% 0%
Other 0% 0% 0% 0% 0% 0%

EDUCATION
* Questions were only asked if respondent households contained boys/girls of secondary school age (12-17)
^ Respondents could select more than one option
% of households reporting barriers to sending boys to
secondary school*
% of households reporting barriers to sending girls aged to
secondary school*
INDICATOR: % of households reporting barriers in accessing education, by age and gender
% of households reporting barriers to sending girls and boys to
secondary school, by barrier*^
15%
85%
Ukhiya
Yes No
15%
85%
Teknaf
Yes No
19%
81%
Ukhiya
Yes No
16%
84%
Teknaf
Yes No
Ukhiya Teknaf Total
Gender Boys Girls Boys Girls Boys Girls
Facilities are too far 12% 15% 9% 9% 10% 12%
Saftey concerns at or on the
way to facilities 5% 7% 5% 7% 5% 7%
Services are too expensive 6% 11% 11% 10% 9% 10%
Services are overcrowded 0% 0% 1% 1% 0% 0%
Staff are insufficient or poor
quality 0% 0% 1% 0% 0% 0%
Facilities do not have
adequate infrastructure 0% 0% 0% 0% 0% 0%
Facilities lack adequate
materials 1% 1% 2% 2% 2% 1%
Users face discrimination or
bad behaviour from service
staff 0% 0% 0% 0% 0% 0%
Children are needed to
support family tasks 0% 0% 1% 0% 1% 0%
Parents do not believe it is
appropriate for them to attend 0% 0% 0% 3% 0% 2%
Other 0% 0% 0% 0% 0% 0%
17%
83%
Total
Yes No
15%
85%
Total
Yes No
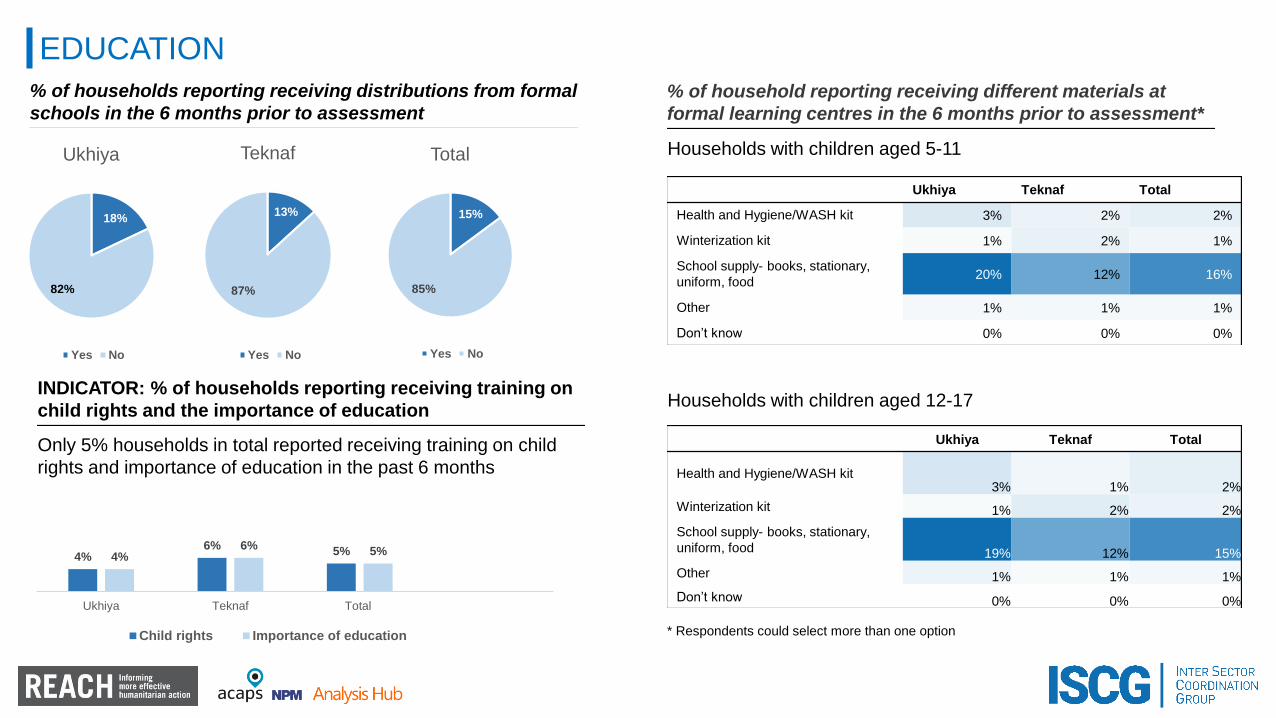
EDUCATION
INDICATOR: % of households reporting receiving training on
child rights and the importance of education
4%6%
5%4%6%
5%
Ukhiya Teknaf Total
Child rights Importance of education
18%
82%
Ukhiya
Yes No
13%
87%
Teknaf
Yes No
15%
85%
Total
Yes No
% of households reporting receiving distributions from formal
schools in the 6 months prior to assessment
Only 5% households in total reported receiving training on child
rights and importance of education in the past 6 months
* Respondents could select more than one option
% of household reporting receiving different materials at
formal learning centres in the 6 months prior to assessment*
Households with children aged 5-11
Households with children aged 12-17
Ukhiya Teknaf Total
Health and Hygiene/WASH kit 3% 2% 2%
Winterization kit 1% 2% 1%
School supply- books, stationary,
uniform, food20% 12% 16%
Other 1% 1% 1%
Don’t know 0% 0% 0%
Ukhiya Teknaf Total
Health and Hygiene/WASH kit3% 1% 2%
Winterization kit 1% 2% 2%
School supply- books, stationary,
uniform, food 19% 12% 15%
Other 1% 1% 1%
Don’t know 0% 0% 0%
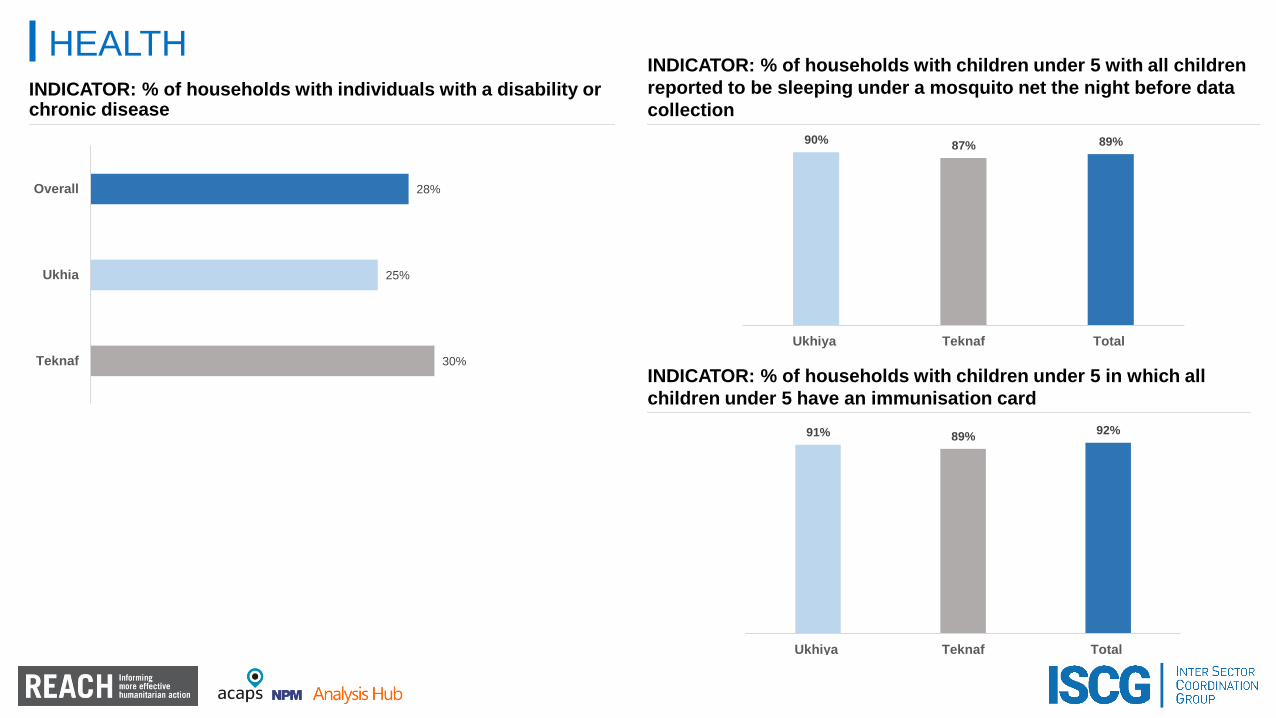
HEALTH
INDICATOR: % of households with children under 5 in which all
children under 5 have an immunisation card
91% 89%92%
Ukhiya Teknaf Total
INDICATOR: % of households with children under 5 with all children
reported to be sleeping under a mosquito net the night before data
collection
90%87% 89%
Ukhiya Teknaf Total
INDICATOR: % of households with individuals with a disability orchronic disease
28%
25%
30%
Overall
Ukhia
Teknaf

HEALTHINDICATOR: % of households with children under 5 reported to have
been ill with diarrhoea in the two weeks prior to data collection
INDICATOR: % of children born in the past year who were
delivered at home
13%
17%
16%
Ukhiya
Teknaf
Total
Of children under 5 with diarrhoea in the last two weeks prior to data
collection, % who received treatment*^
* This question was only asked about the 16% of (n=257) of children who were reported to have been ill with
diarrhoea in the two weeks prior to data collection
^ Respondents could select more than one option
62%68%
53%
TotalTeknafUkhia
87%81% 84%
Ukhiya Teknaf Total
INDICATOR: % of pregnant women reported to have attended an
NGO or Government clinic at least once since the start of their
pregnancy to get advice or treatment related to the pregnancy
Ukhiya Teknaf Total
Gender of child MALE FEMALE MALE FEMALE MALE FEMALE
Yes from a health care
provider 68% 75% 60% 56% 64% 65%
Yes, at home 28% 18% 30% 31% 29% 25%
None 8% 10% 14% 16% 11% 14%

HEALTH
INDICATOR: % of households reporting individuals
with an illness serious enough to require medical
treatment in the 30 days prior to data collection
57%55% 56%
Ukhiya Teknaf Total
Of individuals who sought treatment, % accessing different treatment sources**^
Ukhiya Teknaf Total
MALE FEMALE MALE FEMALE MALE FEMALE
Yes, sought treatment 65% 77% 62% 74% 63% 75%
No, didn’t seek treatment 35% 23% 38% 26% 37% 25%
INDICATOR: Of individuals reporting to have had an illness serious enough to
require medical treatment in the 30 days prior to data collection, % for whom
treatment was sought, by gender*
Ukhiya Teknaf Total
MALE FEMALE MALE FEMALE MALE FEMALE
NGO clinic 5% 7% 3% 3% 4% 5%
Government clinic 25% 27% 28% 25% 26% 27%
Private clinic 48% 49% 48% 48% 48% 51%
Pharmacy or drug shop in the
market44% 38% 37% 32% 40% 36%
Traditional healer 3% 1% 0% 4% 2% 3%
* This question was only asked about the 56% of individuals who had been ill
** This question was only asked about individuals who had been ill, sought treatment
^ Respondents could select more than one answer
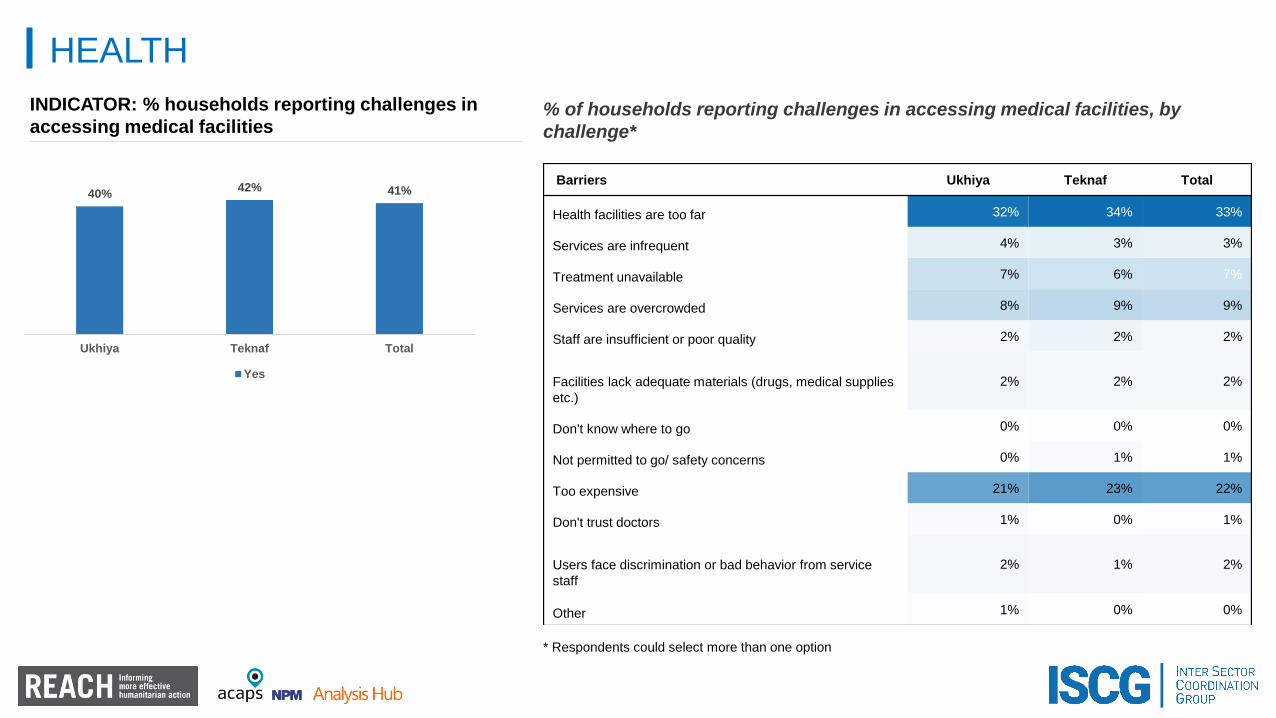
HEALTH
INDICATOR: % households reporting challenges in
accessing medical facilities
40%42% 41%
Ukhiya Teknaf Total
Yes
% of households reporting challenges in accessing medical facilities, by
challenge*
* Respondents could select more than one option
Barriers Ukhiya Teknaf Total
Health facilities are too far 32% 34% 33%
Services are infrequent 4% 3% 3%
Treatment unavailable 7% 6% 7%
Services are overcrowded 8% 9% 9%
Staff are insufficient or poor quality 2% 2% 2%
Facilities lack adequate materials (drugs, medical supplies
etc.)
2% 2% 2%
Don't know where to go 0% 0% 0%
Not permitted to go/ safety concerns 0% 1% 1%
Too expensive 21% 23% 22%
Don't trust doctors 1% 0% 1%
Users face discrimination or bad behavior from service
staff
2% 1% 2%
Other 1% 0% 0%

HEALTH
% households with members who have sought health services
from any facilities that was built in response to the Rohingya
influx in 2017
* This question was only asked to the 75% of respondents
who had not attended facilities built for the Rohingya influx
^ Respondents could select more than one option
25% 26% 25%
72% 72% 72%
3% 2% 3%
Ukhiya Teknaf Total
Yes No Don’t know
% of HH that were visited by community health workers in the 30
days prior to data collection (visitor from health unit)
13% 13% 13%
86% 86% 86%
1% 1% 1%
Ukhiya Teknaf Total
Yes No Don’t know
Ukhiya Teknaf Total
Don’t know about these services 39% 42% 41%
Services are too far 35% 29% 32%
Services are not available to
host community23% 22% 22%
Prefer the services that already
exist41% 36% 39%
Of households not using facilities built for Rohingya influx, %
reporting reasons for non-use*

NUTRITION
* This question was only asked to female respondents, by female enumerators
^ Respondents could select more than one option.
INDICATOR: % of households where women of reproductive age
report awareness of appropriate sources of support for infant and
young child feeding*^
Ukhiya Teknaf Total
Doctors 73% 74% 74%
Midwife/ Nurse 22% 17% 19%
Older relatives (grandmother,
mother, mother-in-law)21% 21% 21%
Traditional healer 2% 3% 3%
Other mothers in the neighborhood 8% 5% 6%
Friends 0% 1% 1%
Don’t know 2% 2% 2%
INDICATOR: % of households where all children 0-24 months were
put to the breast within one hour of birth*
Ukhiya Teknaf Total
MALE FEMALE MALE FEMALE MALE FEMALE
Within 1 hour 58% 53% 59% 49% 58% 50%
In the first day 33% 39% 33% 39% 33% 39%
After the first day 8% 8% 8% 10% 8% 9%
NOTE: Data on exclusive breastfeeding was collected, but requires
additional processing and cross-checking, and have therefore not been
included in this presentation
Overall, 52% of children aged 0-24 months were reported put to the
breast within one hour of birth. However, there were marked
differences according to gender of the child.

PROTECTIONINDICATOR: % of women between the age of 20-25 who are
married
• 45% of women in Teknaf and 44% in Ukhiya between the age of
20-25 years reported being married
• 18% men in Teknaf and 14% in Ukhiya between the age of 20-25
years reported being married.
29% 30% 30%
Ukhiya Teknaf Total
INDICATOR: Of women between the age of 20-24 who are married,
% married before the age of 18
INDICATOR: % households with individuals with a disability or
chronic disease
25%30% 28%
Ukhiya Teknaf Total
INDICATOR: % of persons of concern with disabilities who receive
services for their specific needs*
36%43% 40%
Ukhiya Teknaf Total
INDICATOR: % of women, girls, youth and adolescents receiving
employability and life skills opportunities
• Only 1% male within the age group 18-24 and 25-59 years
reported attending vocational training in total.
• 0% women in total reported attending any vocational training. * This question was only asked about individuals reported to have a disability or chronic
illness, and phrased as follows: “Is this person currently accessing any treatment or
support for this disability or illness?”

PROTECTIONINDICATOR: % of households by perceived levels of hospitality towards displaced population
* Respondents could select more than one option
20%
13%10%
57%
14% 14% 13%
59%
17%13% 12%
58%
Everyday Once a week Once a month Never
Ukhiya Teknaf Total
Type of interaction* Ukhiya Teknaf Total
MALE FEMALE MALE FEMALE MALE FEMALE
Social interactions (visiting
their house, having meals
together) 3% 2% 5% 7% 4% 4%
Buying goods or services from
them 16% 10% 17% 18% 17% 15%
Selling goods or services to
them 9% 4% 7% 5% 8% 4%
Working for them 5% 2% 5% 3% 5% 2%
Hiring them to work for me 24% 7% 18% 4% 21% 5%
Renting property to them 1% 1% 1% 0% 1% 1%
Casual interactions (speaking
to strangers on the street) 43% 15% 32% 14% 37% 15%
None 10% 1% 10% 4% 10% 3%
% of households reporting different levels of
interaction with Rohingya refugees
% of households reporting different types of interaction with Rohingya
refugees, by gender of respondent
0%
13%
6%1%
80%
1%
18%
5%1%
75%
0%
16%
5%1%
78%
Very good Good Bad Very bad No relationship
Ukhiya Teknaf Total
% of households reporting having different types of
relationships with Rohingya refugees
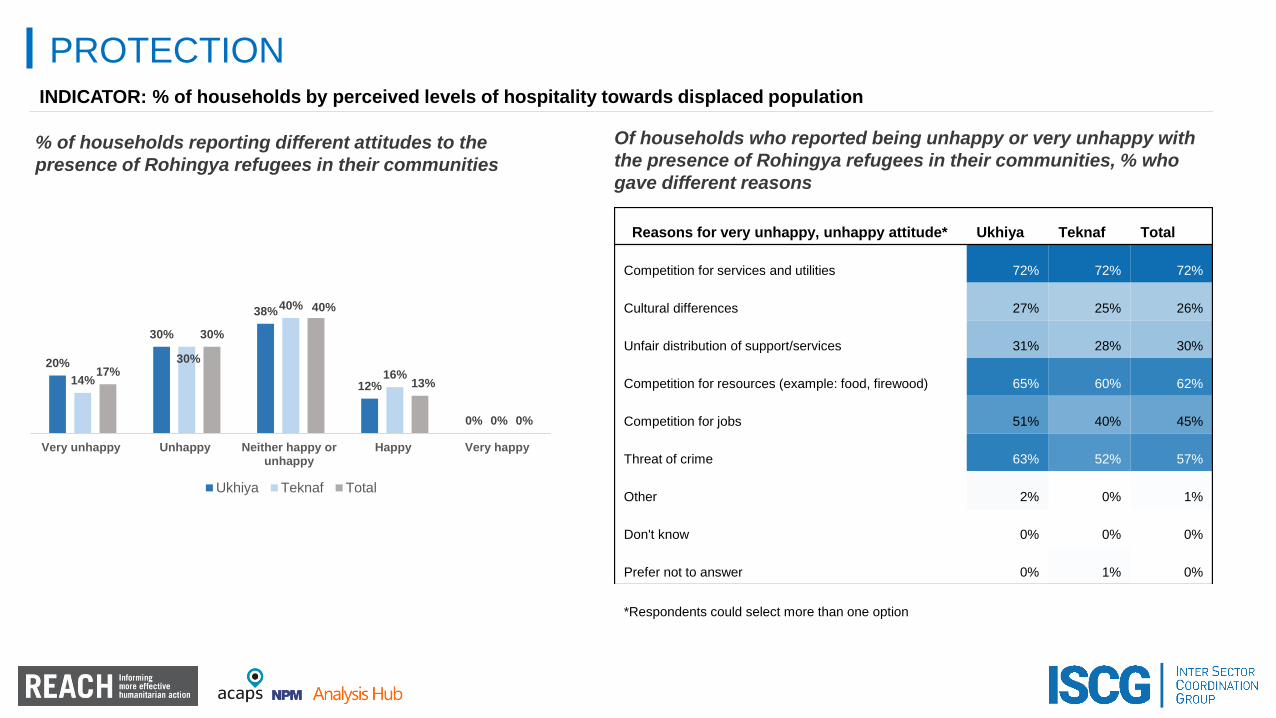
PROTECTIONINDICATOR: % of households by perceived levels of hospitality towards displaced population
*Respondents could select more than one option
Reasons for very unhappy, unhappy attitude* Ukhiya Teknaf Total
Competition for services and utilities 72% 72% 72%
Cultural differences 27% 25% 26%
Unfair distribution of support/services 31% 28% 30%
Competition for resources (example: food, firewood) 65% 60% 62%
Competition for jobs 51% 40% 45%
Threat of crime 63% 52% 57%
Other 2% 0% 1%
Don't know 0% 0% 0%
Prefer not to answer 0% 1% 0%
20%
30%
38%
12%
0%
14%
30%
40%
16%
0%
17%
30%
40%
13%
0%
Very unhappy Unhappy Neither happy orunhappy
Happy Very happy
Ukhiya Teknaf Total
% of households reporting different attitudes to the
presence of Rohingya refugees in their communities
Of households who reported being unhappy or very unhappy with
the presence of Rohingya refugees in their communities, % who
gave different reasons
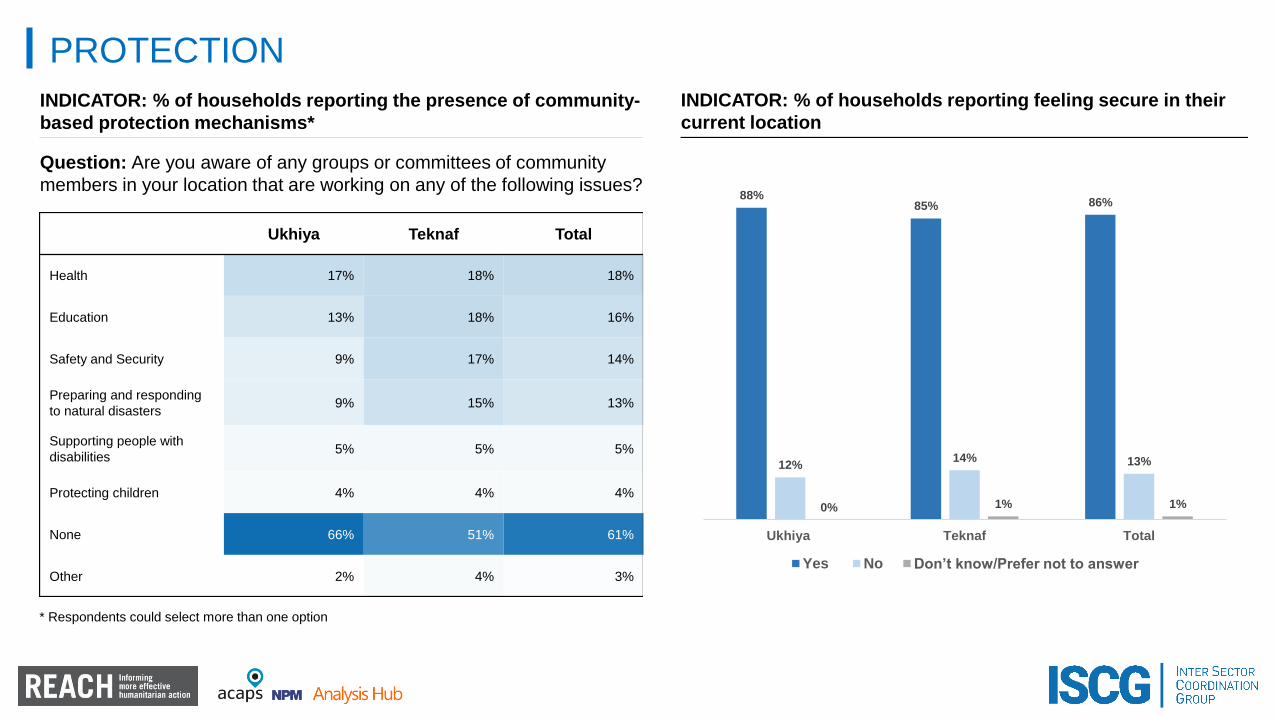
PROTECTION
INDICATOR: % of households reporting the presence of community-
based protection mechanisms*
* Respondents could select more than one option
88%85% 86%
12%14% 13%
0% 1% 1%
Ukhiya Teknaf Total
Yes No Don’t know/Prefer not to answer
INDICATOR: % of households reporting feeling secure in their
current location
Ukhiya Teknaf Total
Health 17% 18% 18%
Education 13% 18% 16%
Safety and Security 9% 17% 14%
Preparing and responding
to natural disasters9% 15% 13%
Supporting people with
disabilities5% 5% 5%
Protecting children 4% 4% 4%
None 66% 51% 61%
Other 2% 4% 3%
Question: Are you aware of any groups or committees of community
members in your location that are working on any of the following issues?
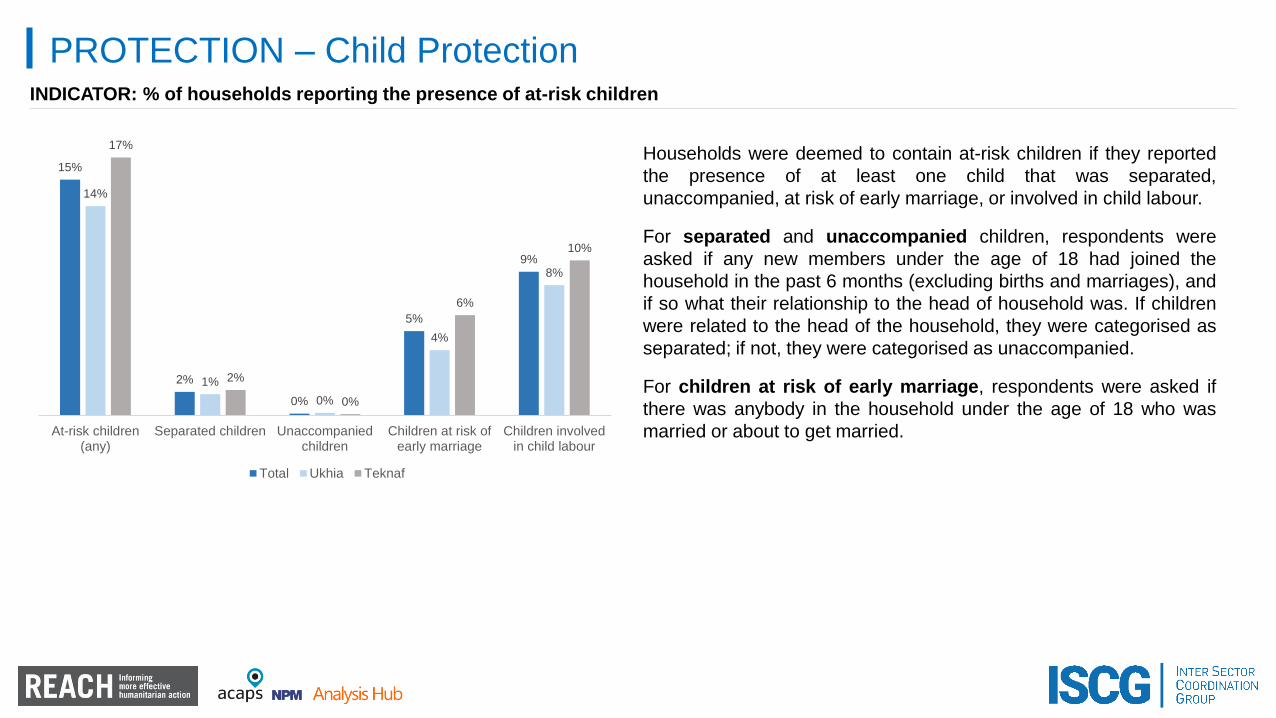
PROTECTION – Child ProtectionINDICATOR: % of households reporting the presence of at-risk children
Households were deemed to contain at-risk children if they reported
the presence of at least one child that was separated,
unaccompanied, at risk of early marriage, or involved in child labour.
For separated and unaccompanied children, respondents were
asked if any new members under the age of 18 had joined the
household in the past 6 months (excluding births and marriages), and
if so what their relationship to the head of household was. If children
were related to the head of the household, they were categorised as
separated; if not, they were categorised as unaccompanied.
For children at risk of early marriage, respondents were asked if
there was anybody in the household under the age of 18 who was
married or about to get married.
15%
2%
0%
5%
9%
14%
1%
0%
4%
8%
17%
2%
0%
6%
10%
At-risk children(any)
Separated children Unaccompaniedchildren
Children at risk ofearly marriage
Children involvedin child labour
Total Ukhia Teknaf

PROTECTION – Child ProtectionINDICATOR: % of households reporting presence of safety risks to boys and girls in their communities*
Risk Ukhiya Teknaf Total
Boys Girls Boys Girls Boys Girls
Violence within home 10% 5% 8% 6% 9% 5%
Violence in the community 20% 6% 18% 4% 19% 5%
Child labour 26% 2% 22% 2% 24% 2%
Child marriage 10% 44% 9% 48% 10% 46%
Risk of recruitment by armed group/ forces 22% 1% 24% 2% 23% 2%
Risk of kidnapping 18% 33% 23% 36% 21% 35%
Risk of detention 19% 5% 27% 6% 23% 6%
Risk of sexual abuse/ violence 2% 40% 1% 43% 2% 42%
Psychological distress or trauma 9% 10% 9% 9% 9% 10%
Lack of registration of newborn babies 7% 4% 7% 5% 7% 4%
Natural disasters or hazards 8% 4% 7% 4% 7% 4%
Don't know / no answer 31% 32% 28% 26% 30% 29%
Other 5% 2% 5% 2% 5% 2%
* Respondents could select up to three options
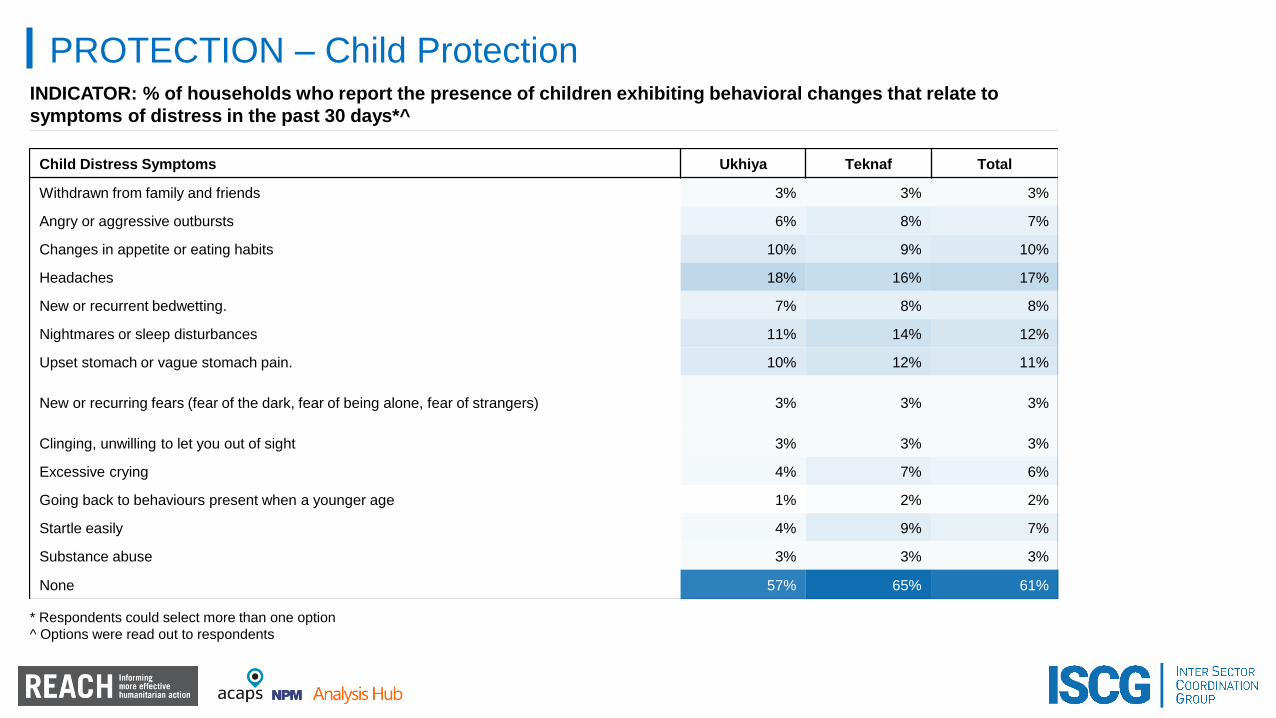
PROTECTION – Child ProtectionINDICATOR: % of households who report the presence of children exhibiting behavioral changes that relate to
symptoms of distress in the past 30 days*^
Child Distress Symptoms Ukhiya Teknaf Total
Withdrawn from family and friends 3% 3% 3%
Angry or aggressive outbursts 6% 8% 7%
Changes in appetite or eating habits 10% 9% 10%
Headaches 18% 16% 17%
New or recurrent bedwetting. 7% 8% 8%
Nightmares or sleep disturbances 11% 14% 12%
Upset stomach or vague stomach pain. 10% 12% 11%
New or recurring fears (fear of the dark, fear of being alone, fear of strangers) 3% 3% 3%
Clinging, unwilling to let you out of sight 3% 3% 3%
Excessive crying 4% 7% 6%
Going back to behaviours present when a younger age 1% 2% 2%
Startle easily 4% 9% 7%
Substance abuse 3% 3% 3%
None 57% 65% 61%
* Respondents could select more than one option
^ Options were read out to respondents
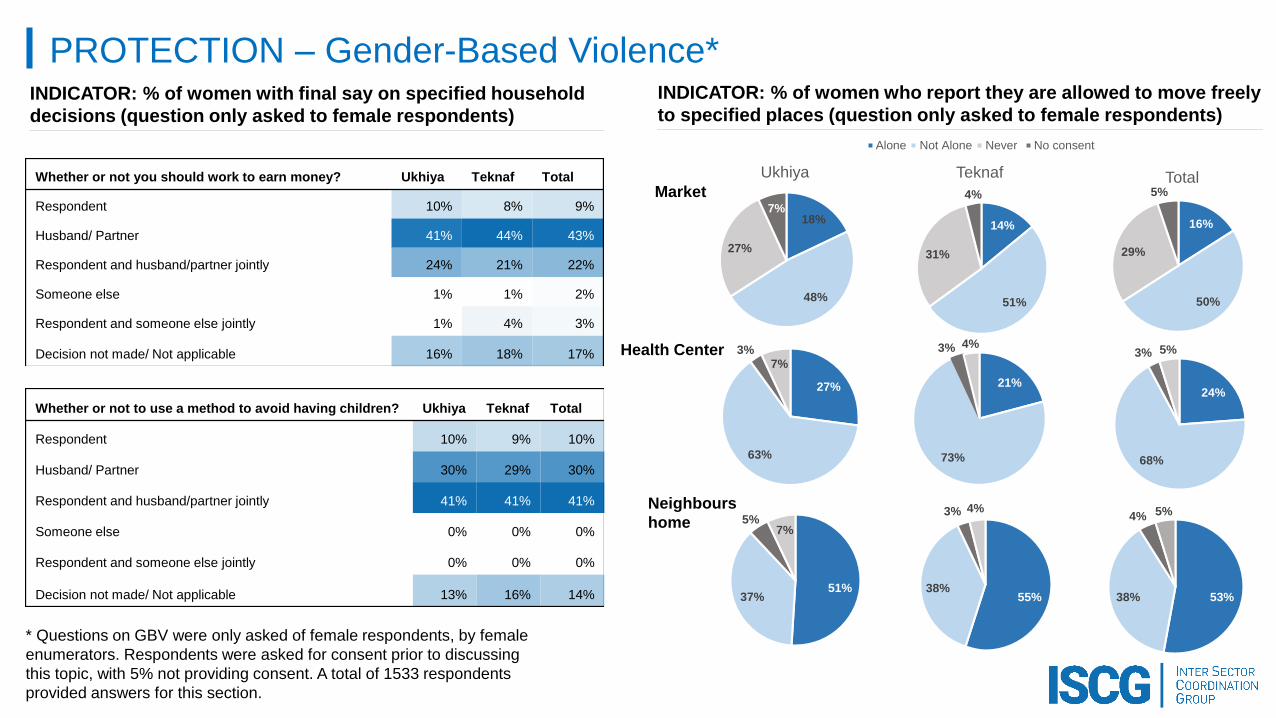
PROTECTION – Gender-Based Violence*INDICATOR: % of women with final say on specified household
decisions (question only asked to female respondents)
Whether or not to use a method to avoid having children? Ukhiya Teknaf Total
Respondent 10% 9% 10%
Husband/ Partner 30% 29% 30%
Respondent and husband/partner jointly 41% 41% 41%
Someone else 0% 0% 0%
Respondent and someone else jointly 0% 0% 0%
Decision not made/ Not applicable 13% 16% 14%
INDICATOR: % of women who report they are allowed to move freely
to specified places (question only asked to female respondents)
Market
Health Center
Neighbours
home
Whether or not you should work to earn money? Ukhiya Teknaf Total
Respondent 10% 8% 9%
Husband/ Partner 41% 44% 43%
Respondent and husband/partner jointly 24% 21% 22%
Someone else 1% 1% 2%
Respondent and someone else jointly 1% 4% 3%
Decision not made/ Not applicable 16% 18% 17%
16%
50%
29%
5%Total
14%
51%
31%
4%
Teknaf
Alone Not Alone Never No consent
18%
48%
27%
7%
Ukhiya
27%
63%
3%7%
21%
73%
3% 4%
24%
68%
3% 5%
51%37%
5%7%
55%38%
3% 4%
53%38%
4% 5%
* Questions on GBV were only asked of female respondents, by female
enumerators. Respondents were asked for consent prior to discussing
this topic, with 5% not providing consent. A total of 1533 respondents
provided answers for this section.
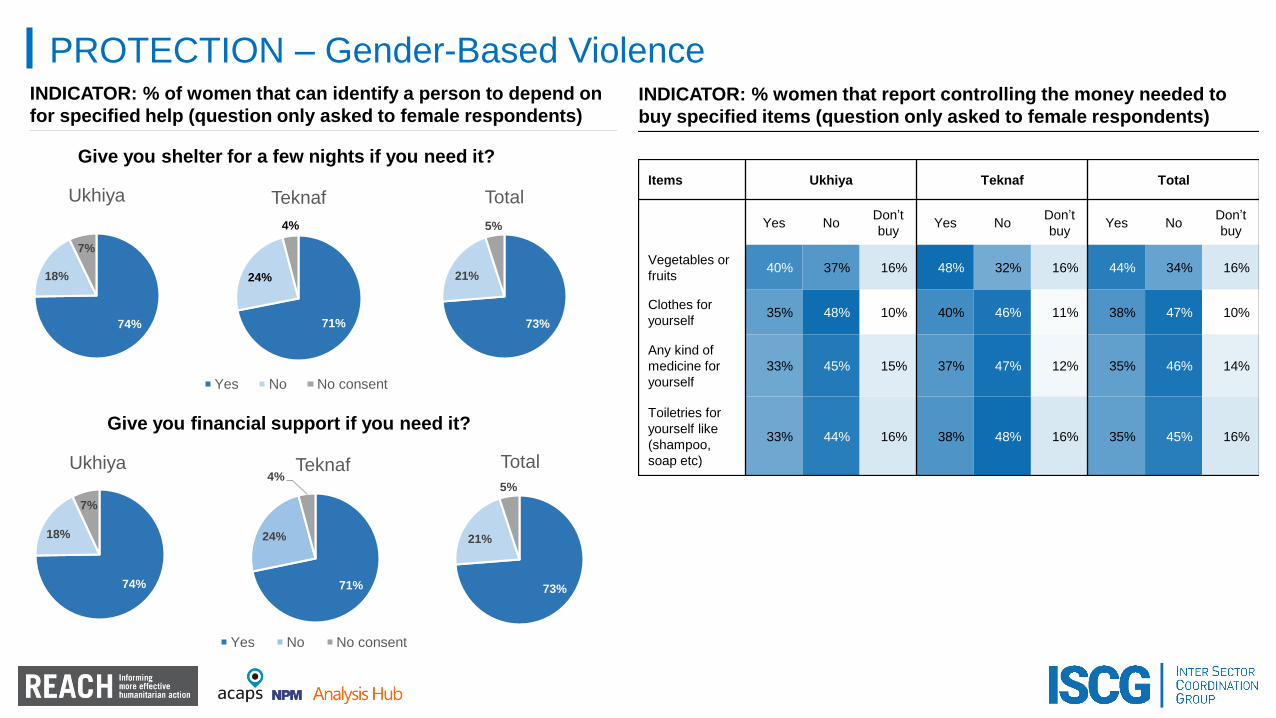
PROTECTION – Gender-Based ViolenceINDICATOR: % of women that can identify a person to depend on
for specified help (question only asked to female respondents)INDICATOR: % women that report controlling the money needed to
buy specified items (question only asked to female respondents)
74%
18%
7%
Ukhiya
71%
24%
4%
Teknaf
Yes No No consent
73%
21%
5%
Total
Give you shelter for a few nights if you need it?
74%
18%
7%
Ukhiya
71%
24%
4%Teknaf
Yes No No consent
73%
21%
5%
Total
Give you financial support if you need it?
Items Ukhiya Teknaf Total
Yes NoDon’t
buyYes No
Don’t
buyYes No
Don’t
buy
Vegetables or
fruits 40% 37% 16% 48% 32% 16% 44% 34% 16%
Clothes for
yourself 35% 48% 10% 40% 46% 11% 38% 47% 10%
Any kind of
medicine for
yourself
33% 45% 15% 37% 47% 12% 35% 46% 14%
Toiletries for
yourself like
(shampoo,
soap etc)
33% 44% 16% 38% 48% 16% 35% 45% 16%
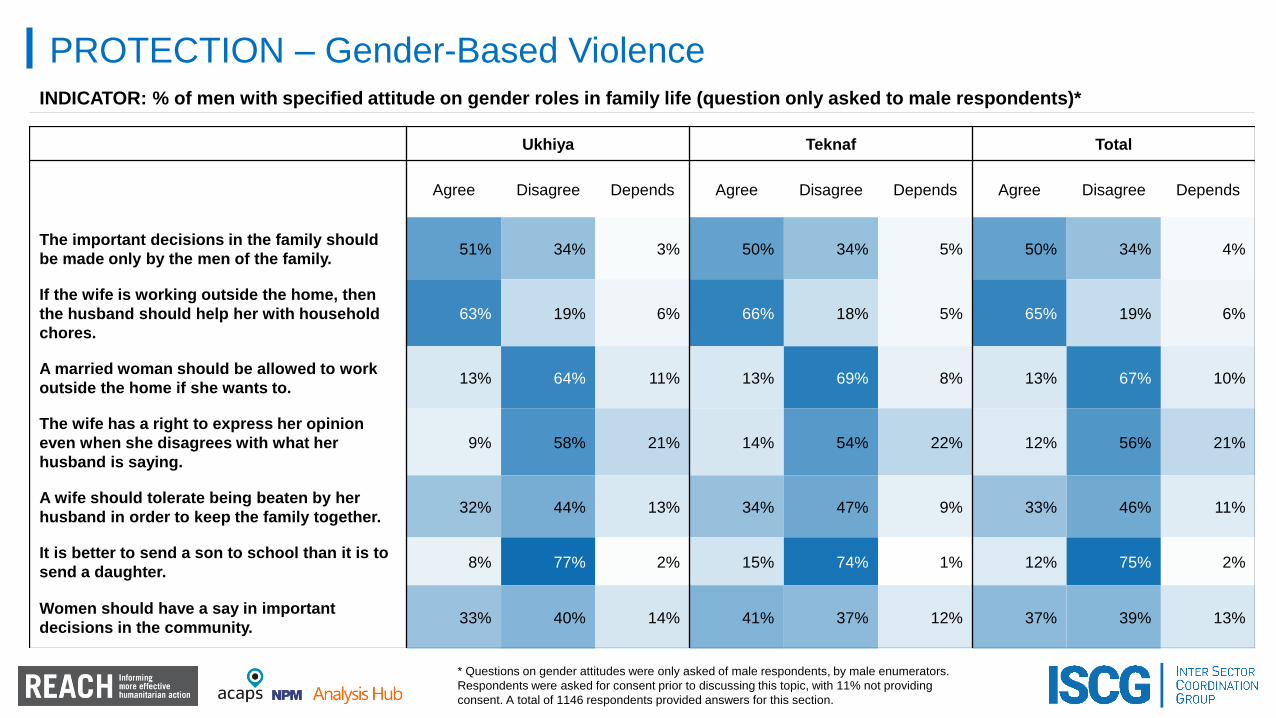
PROTECTION – Gender-Based ViolenceINDICATOR: % of men with specified attitude on gender roles in family life (question only asked to male respondents)*
Ukhiya Teknaf Total
Agree Disagree Depends Agree Disagree Depends Agree Disagree Depends
The important decisions in the family should
be made only by the men of the family. 51% 34% 3% 50% 34% 5% 50% 34% 4%
If the wife is working outside the home, then
the husband should help her with household
chores.
63% 19% 6% 66% 18% 5% 65% 19% 6%
A married woman should be allowed to work
outside the home if she wants to.13% 64% 11% 13% 69% 8% 13% 67% 10%
The wife has a right to express her opinion
even when she disagrees with what her
husband is saying.
9% 58% 21% 14% 54% 22% 12% 56% 21%
A wife should tolerate being beaten by her
husband in order to keep the family together. 32% 44% 13% 34% 47% 9% 33% 46% 11%
It is better to send a son to school than it is to
send a daughter.8% 77% 2% 15% 74% 1% 12% 75% 2%
Women should have a say in important
decisions in the community. 33% 40% 14% 41% 37% 12% 37% 39% 13%
* Questions on gender attitudes were only asked of male respondents, by male enumerators.
Respondents were asked for consent prior to discussing this topic, with 11% not providing
consent. A total of 1146 respondents provided answers for this section.
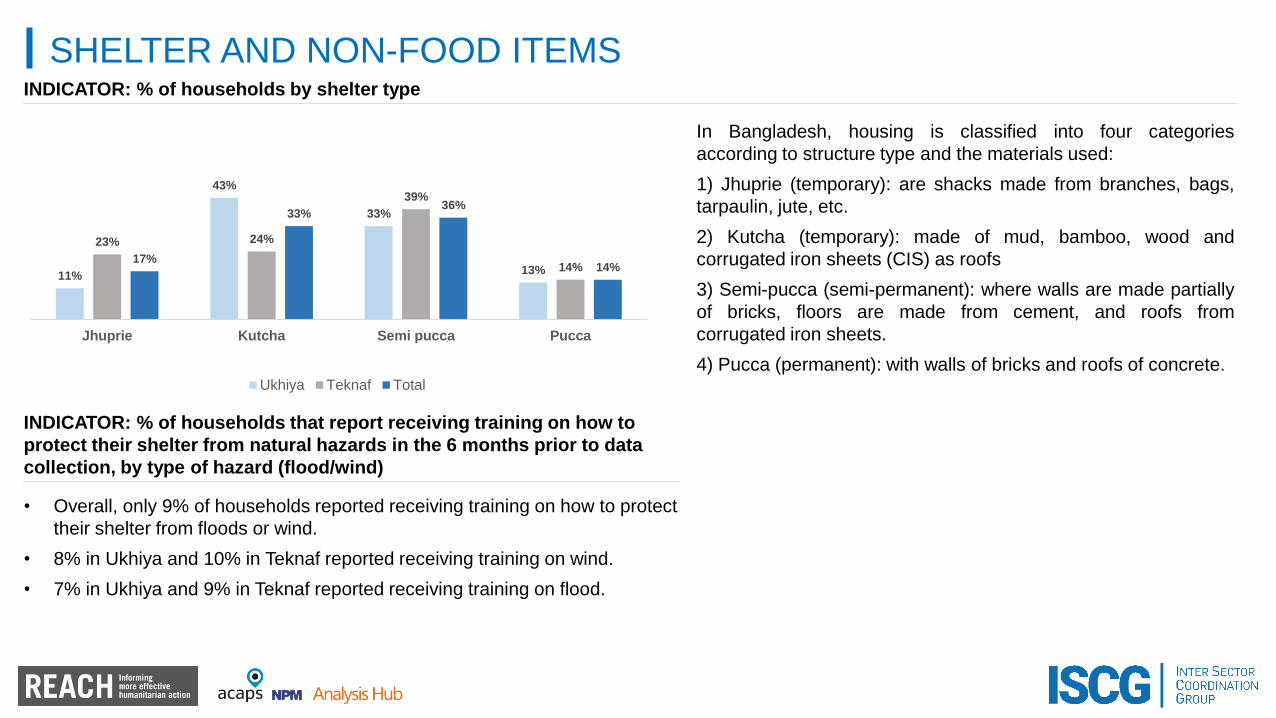
11%
43%
33%
13%
23% 24%
39%
14%17%
33%36%
14%
Jhuprie Kutcha Semi pucca Pucca
Ukhiya Teknaf Total
SHELTER AND NON-FOOD ITEMSINDICATOR: % of households by shelter type
In Bangladesh, housing is classified into four categories
according to structure type and the materials used:
1) Jhuprie (temporary): are shacks made from branches, bags,
tarpaulin, jute, etc.
2) Kutcha (temporary): made of mud, bamboo, wood and
corrugated iron sheets (CIS) as roofs
3) Semi-pucca (semi-permanent): where walls are made partially
of bricks, floors are made from cement, and roofs from
corrugated iron sheets.
4) Pucca (permanent): with walls of bricks and roofs of concrete.
• Overall, only 9% of households reported receiving training on how to protect
their shelter from floods or wind.
• 8% in Ukhiya and 10% in Teknaf reported receiving training on wind.
• 7% in Ukhiya and 9% in Teknaf reported receiving training on flood.
INDICATOR: % of households that report receiving training on how to
protect their shelter from natural hazards in the 6 months prior to data
collection, by type of hazard (flood/wind)
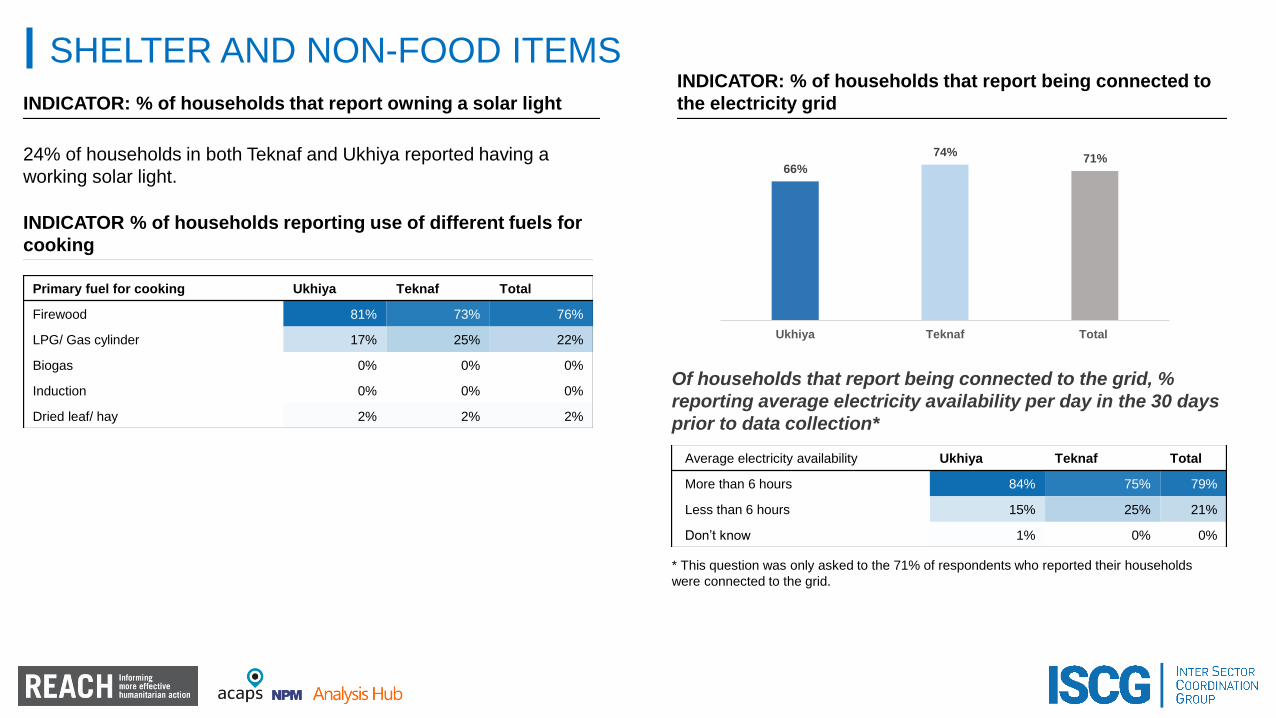
SHELTER AND NON-FOOD ITEMS
INDICATOR: % of households that report owning a solar light
INDICATOR: % of households that report being connected to
the electricity grid
66%
74%71%
Ukhiya Teknaf Total
Of households that report being connected to the grid, %
reporting average electricity availability per day in the 30 days
prior to data collection*
Primary fuel for cooking Ukhiya Teknaf Total
Firewood 81% 73% 76%
LPG/ Gas cylinder 17% 25% 22%
Biogas 0% 0% 0%
Induction 0% 0% 0%
Dried leaf/ hay 2% 2% 2%
INDICATOR % of households reporting use of different fuels for
cooking
Average electricity availability Ukhiya Teknaf Total
More than 6 hours 84% 75% 79%
Less than 6 hours 15% 25% 21%
Don’t know 1% 0% 0%
24% of households in both Teknaf and Ukhiya reported having a
working solar light.
* This question was only asked to the 71% of respondents who reported their households
were connected to the grid.
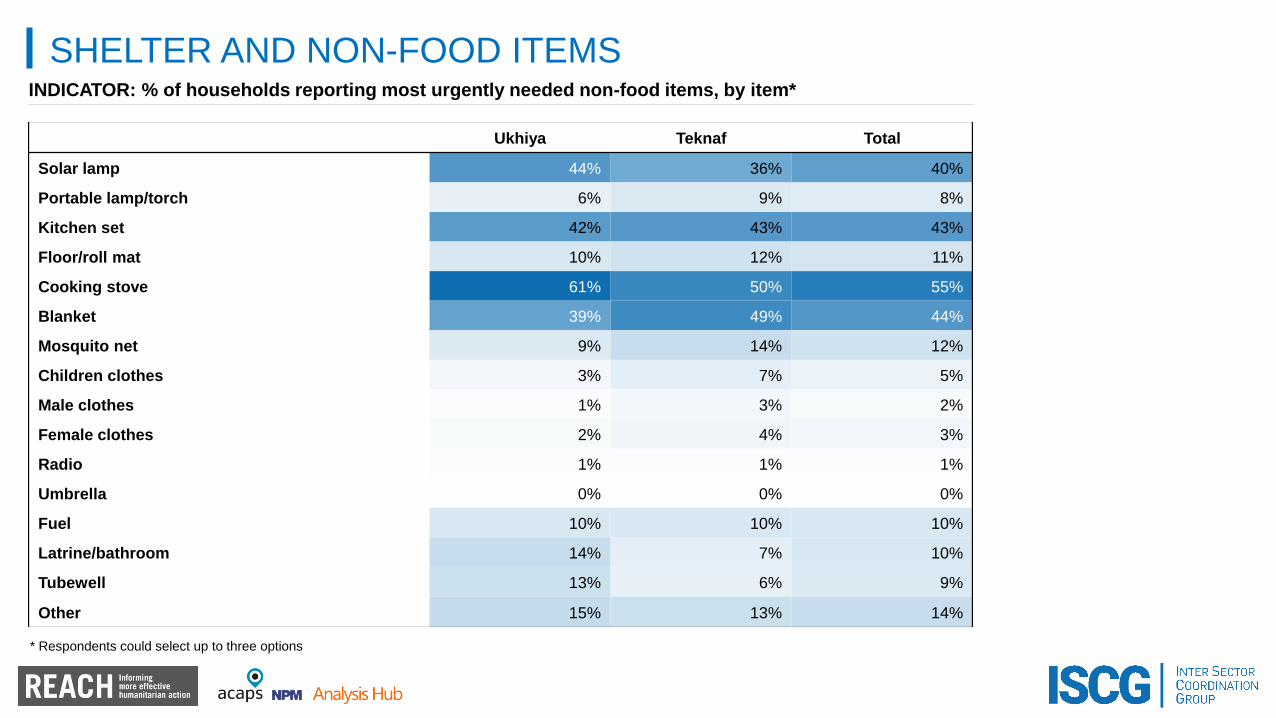
SHELTER AND NON-FOOD ITEMSINDICATOR: % of households reporting most urgently needed non-food items, by item*
Ukhiya Teknaf Total
Solar lamp 44% 36% 40%
Portable lamp/torch 6% 9% 8%
Kitchen set 42% 43% 43%
Floor/roll mat 10% 12% 11%
Cooking stove 61% 50% 55%
Blanket 39% 49% 44%
Mosquito net 9% 14% 12%
Children clothes 3% 7% 5%
Male clothes 1% 3% 2%
Female clothes 2% 4% 3%
Radio 1% 1% 1%
Umbrella 0% 0% 0%
Fuel 10% 10% 10%
Latrine/bathroom 14% 7% 10%
Tubewell 13% 6% 9%
Other 15% 13% 14%
* Respondents could select up to three options

SHELTER AND NON-FOOD ITEMSINDICATOR: % of households reporting security of tenure
91% 89% 90%
7% 8% 7%2% 3% 3%
Ukhiya Teknaf Total
Yes, I own the land. No, I don’t own the land. Its co-owned.
78%80% 79%
22%19% 20%
0% 1% 1%
Ukhiya Teknaf Total
Yes No Don’t know/ Prefer not to answer
% of households reporting ownership of their plot of land or
house
Of households who report ownership of their plot of land or
house, % who report holding the deed to it
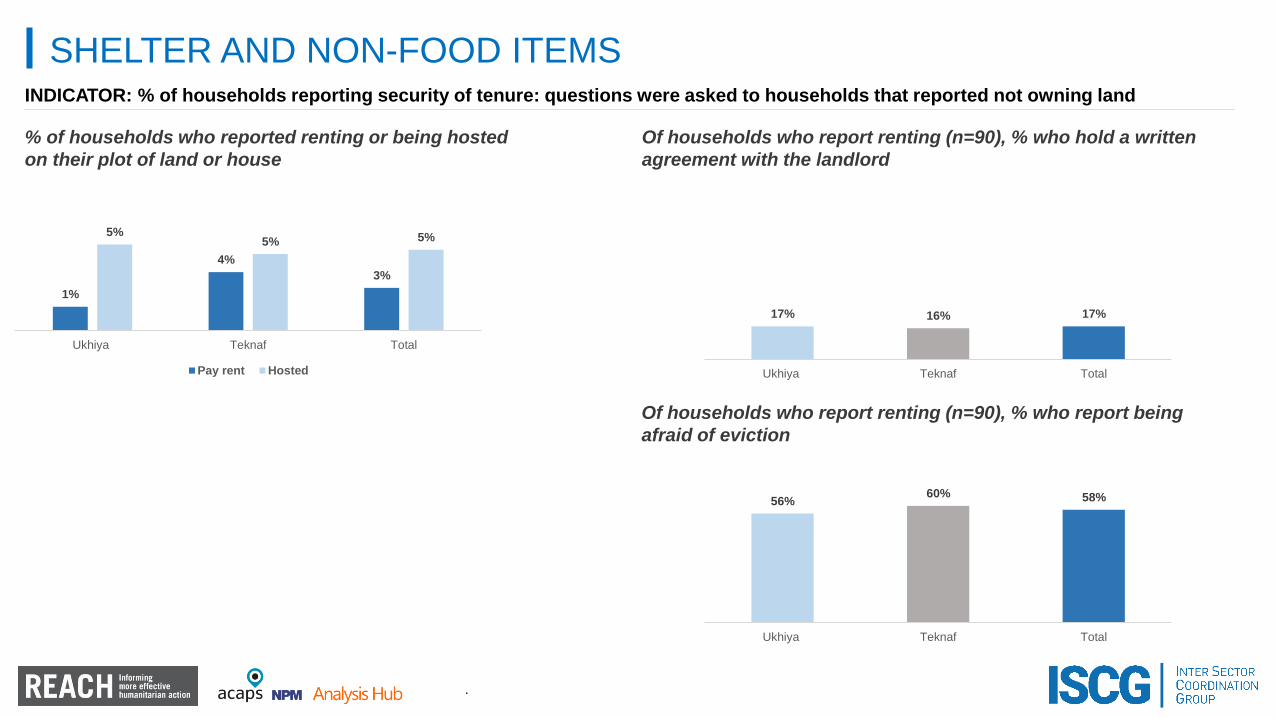
SHELTER AND NON-FOOD ITEMSINDICATOR: % of households reporting security of tenure: questions were asked to households that reported not owning land
.
1%
4%
3%
5%5% 5%
Ukhiya Teknaf Total
Pay rent Hosted
17% 16% 17%
Ukhiya Teknaf Total
56%60% 58%
Ukhiya Teknaf Total
% of households who reported renting or being hosted
on their plot of land or house
Of households who report renting (n=90), % who hold a written
agreement with the landlord
Of households who report renting (n=90), % who report being
afraid of eviction
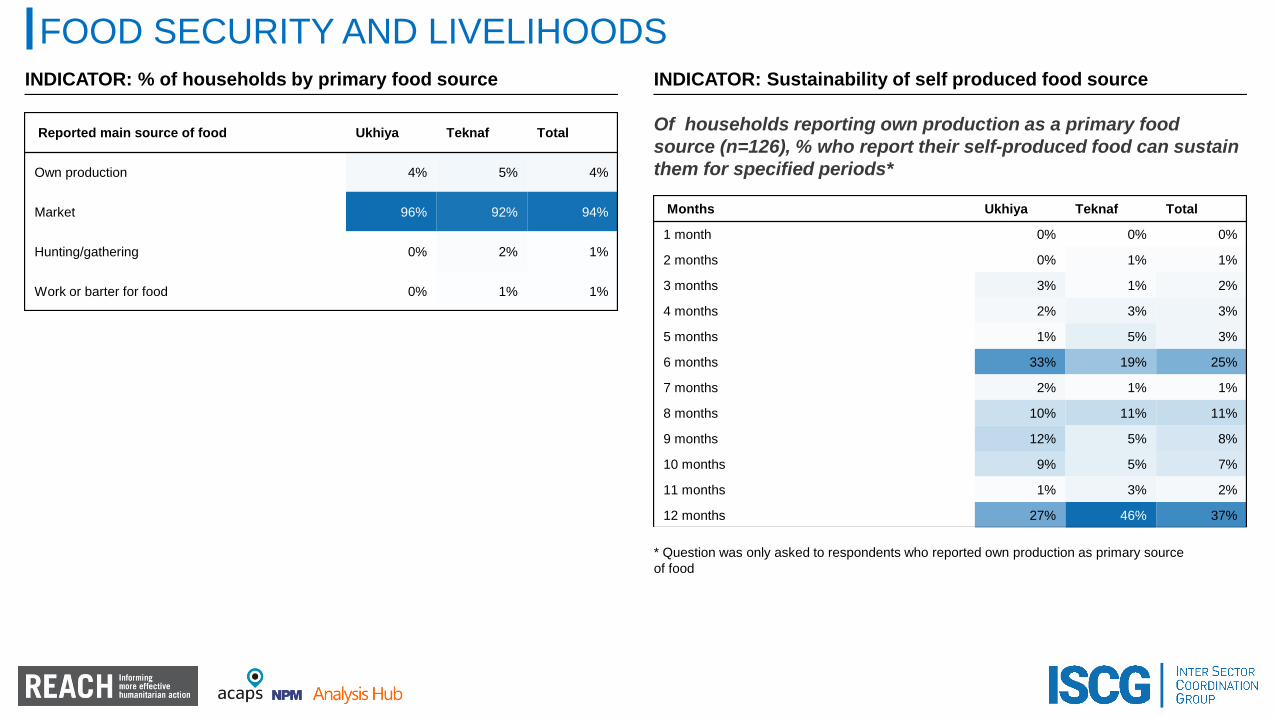
FOOD SECURITY AND LIVELIHOODSINDICATOR: % of households by primary food source
Reported main source of food Ukhiya Teknaf Total
Own production 4% 5% 4%
Market 96% 92% 94%
Hunting/gathering 0% 2% 1%
Work or barter for food 0% 1% 1%
Months Ukhiya Teknaf Total
1 month 0% 0% 0%
2 months 0% 1% 1%
3 months 3% 1% 2%
4 months 2% 3% 3%
5 months 1% 5% 3%
6 months 33% 19% 25%
7 months 2% 1% 1%
8 months 10% 11% 11%
9 months 12% 5% 8%
10 months 9% 5% 7%
11 months 1% 3% 2%
12 months 27% 46% 37%
INDICATOR: Sustainability of self produced food source
* Question was only asked to respondents who reported own production as primary source
of food
Of households reporting own production as a primary food
source (n=126), % who report their self-produced food can sustain
them for specified periods*
4%
22%
36%
27%
11%5%
22%
33%30%
10%4%
22%
35%29%
10%
Significanlyimproved
Somewhatimproved
Has not changed Somewhatdeterioirated
Significantlydeterioirated
Ukhiya Teknaf Total
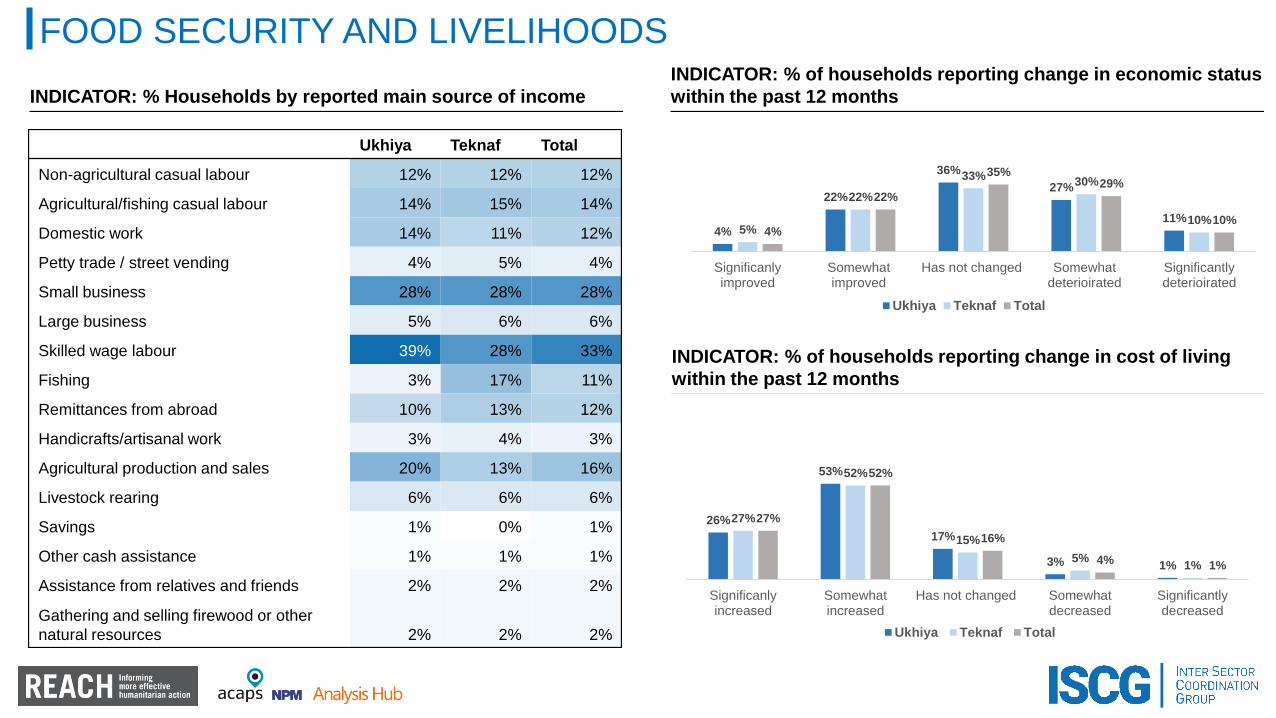
FOOD SECURITY AND LIVELIHOODS
INDICATOR: % Households by reported main source of income
Ukhiya Teknaf Total
Non-agricultural casual labour 12% 12% 12%
Agricultural/fishing casual labour 14% 15% 14%
Domestic work 14% 11% 12%
Petty trade / street vending 4% 5% 4%
Small business 28% 28% 28%
Large business 5% 6% 6%
Skilled wage labour 39% 28% 33%
Fishing 3% 17% 11%
Remittances from abroad 10% 13% 12%
Handicrafts/artisanal work 3% 4% 3%
Agricultural production and sales 20% 13% 16%
Livestock rearing 6% 6% 6%
Savings 1% 0% 1%
Other cash assistance 1% 1% 1%
Assistance from relatives and friends 2% 2% 2%
Gathering and selling firewood or other
natural resources 2% 2% 2%
INDICATOR: % of households reporting change in economic status
within the past 12 months
INDICATOR: % of households reporting change in cost of living
within the past 12 months
26%
53%
17%
3% 1%
27%
52%
15%
5%1%
27%
52%
16%
4% 1%
Significanlyincreased
Somewhatincreased
Has not changed Somewhatdecreased
Significantlydecreased
Ukhiya Teknaf Total
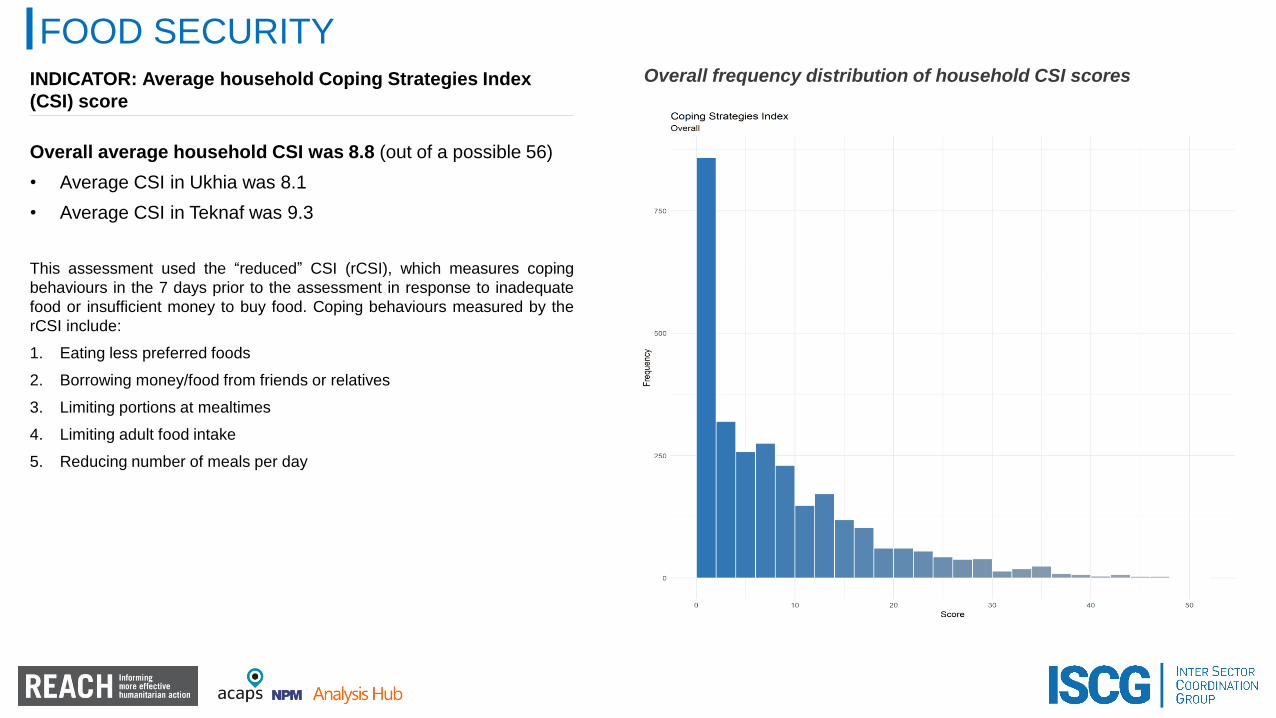
FOOD SECURITYINDICATOR: Average household Coping Strategies Index
(CSI) score
Overall average household CSI was 8.8 (out of a possible 56)
• Average CSI in Ukhia was 8.1
• Average CSI in Teknaf was 9.3
This assessment used the “reduced” CSI (rCSI), which measures coping
behaviours in the 7 days prior to the assessment in response to inadequate
food or insufficient money to buy food. Coping behaviours measured by the
rCSI include:
1. Eating less preferred foods
2. Borrowing money/food from friends or relatives
3. Limiting portions at mealtimes
4. Limiting adult food intake
5. Reducing number of meals per day
Overall frequency distribution of household CSI scores
FOOD SECURITY
8% 8% 8%
30%35% 32%
63%57% 60%
Teknaf Ukhia Overall
Poor Borderline Acceptable
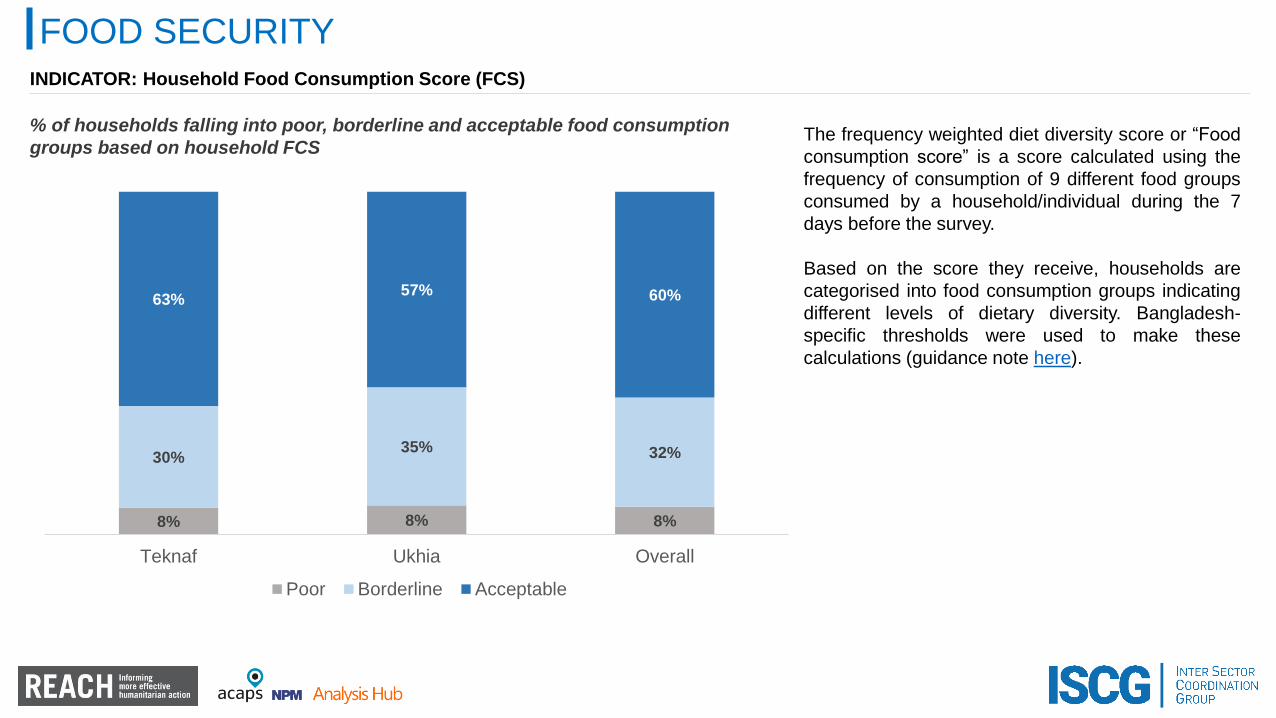
INDICATOR: Household Food Consumption Score (FCS)
The frequency weighted diet diversity score or “Food
consumption score” is a score calculated using the
frequency of consumption of 9 different food groups
consumed by a household/individual during the 7
days before the survey.
Based on the score they receive, households are
categorised into food consumption groups indicating
different levels of dietary diversity. Bangladesh-
specific thresholds were used to make these
calculations (guidance note here).
% of households falling into poor, borderline and acceptable food consumption
groups based on household FCS

COMMUNICATIONS WITH COMMUNITIES
• 66% of households in Teknaf reported receiving early warning signals
from the mosque loudspeaker, followed by cyclone preparedness
volunteer at 24% and word of mouth 21%.
• 59% of households in Ukhiya reported receiving early warning signals
from mosque loudspeakers, followed by word of mouth at 20% and
television at 21%.
• 77% in Teknaf and 74% in Ukhiya chose mosque loudspeaker as the
most preferred way of receiving early warning sign in future.
*Respondents could select more than one option.
^ Channels reported by less than 2% of households are not presented in this table
INDICATOR: % of households with awareness of early warning
mechanisms
82%
18%
Ukhiya
Yes No
85%
15%
Teknaf
Yes No
84%
16%
Total
Yes No
Information
channelsUkhiya Teknaf Total
TV 29% 24% 27%
Face-to-face
conversation79% 80% 79%
Newspaper 9% 8% 9%
Radio 1% 3% 2%
Internet 10% 9% 10%
Facebook 10% 10% 10%
Mobile phone call 44% 37% 40%
Loudspeaker/megaph
one announcements 40% 39% 39%
Community leaders 7% 5% 6%
Community meetings 2% 2% 2%
Don’t know/Prefer not
to answer4% 3% 3%
% of households reporting access to different means of
communication/information provision
% of households who reported receiving early warning messages
prior to the arrival of Cyclone Mora (2017)
% of households reporting main ways of accessing information in
the past 30 days*^

* Respondents could select more than one option.
INDICATOR: % of households reporting different information
needs*
Ukhia Teknaf Total
Finding missing people 4% 9% 7%
The security situation here 12% 13% 13%
How to register for aid 14% 14% 14%
How to get water 15% 15% 15%
How to get food 8% 9% 9%
How to get shelter/accommodation/shelter
materials 12% 13% 13%
Information about nutrition 8% 6% 7%
Food prices 9% 7% 8%
Local crop/livestock prices 10% 7% 8%
How to get cooking fuel/firewood 17% 10% 13%
The weather/natural hazards 10% 11% 10%
How to get healthcare/medical attention 24% 26% 25%
How to replace personal documentation (e.g.
birth certificate, ID) 5% 4% 4%
How to get access to education 10% 8% 9%
How to find work 16% 17% 17%
How to get more money/financial support 31% 25% 28%
Info about the aid agencies they are receiving
aid from 9% 5% 7%
INDICATOR: % of households reporting most preferred ways of
providing feedback about services in their area
Ukhiya Teknaf Total
Speak face to face with service providers 24% 27% 26%
Speak face to face with community leaders 74% 68% 71%
At a community meeting 37% 32% 35%
Call a helpline 3% 4% 3%
Submit a complaints form 1% 2% 1%
Use a suggestion box 2% 2% 2%
Use social media 3% 4% 4%
Send an SMS 0% 1% 0%
Other 1% 0% 1%
Don't know 7% 9% 8%
COMMUNICATIONS WITH COMMUNITIES
NEXT STEPS
1. Clean dataset available by 20 December.
2. Summary analysis data tables with indicators broken down by Union and
gender of respondent available by year-end.
3. Development of need indices with ACAPS in January.
4. Publication of Upazila and Union factsheets early February.
5. Report by March, including comprehensive additional analysis (e.g.
correlations of key indicators by distance from camp).