Impact Assessments of 2012 floods on Agriculture and food security ...
Multi-sector Initial Rapid
Assessment (MIRA)
Report
Pakistan Floods 2012
September 2012
Photo Credit Amjad Jamal WFP

Table of Contents
Executive Summary ............................................................................................................................................. 1
Introduction and Background .............................................................................................................................. 3
The Assessment Monitoring Framework (AMF) and MIRA Process .................................................................... 3
What does the MIRA involve? ............................................................................................................................. 3
Objectives ........................................................................................................................................................ 4
MIRA Timeline ..................................................................................................................................................... 5
Sample Selection and Sampling Methodology ................................................................................................ 6
Data Collection ................................................................................................................................................ 6
Key Findings ......................................................................................................................................................... 7
Affected Population ......................................................................................................................................... 7
Cluster Findings ................................................................................................................................................... 9
Community Restoration .................................................................................................................................. 9
Education ....................................................................................................................................................... 10
Food Security ................................................................................................................................................. 13
Crop and Livestock Losses ............................................................................................................................. 15
Health ............................................................................................................................................................ 16
Shelter ........................................................................................................................................................... 19
NFIs ............................................................................................................................................................... 21
Nutrition ........................................................................................................................................................ 22
Water Sanitation and Hygiene (WASH) ......................................................................................................... 23
Reliability of Water Sources .......................................................................................................................... 23
Protection ...................................................................................................................................................... 24

1
Executive Summary Developed over six months, in collaboration with the National Disaster Management Authority/Provincial Disaster
Management Authority (NDMA/PDMA), the MIRA is a common methodology for rapid assessment in an emergency. It is
designed to identify strategic humanitarian priorities after the onset of an emergency within 72 hours according to a timelin e
and formula that calculates sample size to reliability limits of a 5 per cent margin of error and 95 per cent confidence interval.
In September 2012, floods in Pakistan affected more than 5 million people. Balochistan, Punjab and Sindh provinces were the
hardest hit. Some districts are inundated by floodwaters for the third consecutive year. At the request of the Government,
humanitarian partners piloted the Multi-sector Initial Rapid Assessment (MIRA) in five of the most-affected districts:
Jaffarabad and Naseerabad (in Balochistan); Rajanpur (in Punjab); and Jacobabad and Kashmore (in Sindh).
Primary data collection took place in the five districts from 14 to 24 September, following the rapid training of field teams.
Data collection took place through interviews of 822 Key Informants in 523 villages/sit es and by direct observation of the
flood-affected locations and populations. A multi-cluster team analyzed and synthesized primary and secondary data with
relevant pre-crisis information to determine the scale and impact of the disaster. MIRA findings rep resent a snapshot of the
nature, severity and impact of the disaster, determined by access to the affected areas and feedback from key informants.
Approximately 15 per cent of the villages which would have been part of the sample size could not be accessed due to flooded
roads.
The MIRA found at least 2 million people in need of humanitarian assistance in the five assessed districts, according to data
cross-tabulated with land scan satellite imagery and information provided by district authorities. Achievin g consensus on the
population in need was challenging as floodwaters continued to rise and more areas became inundated during the assessment,
as did the numbers of people affected. The MIRA also revealed the movement of some 372,566 people from flooded areas
with 218,043 houses damaged. Floods completely damaged 46 per cent of the roads and 36 per cent partially.
The floods paralysed economic and social activities. Some 58 per cent of farm irrigation channels are destroyed and 24 per
cent of students are unable to go to school due to damaged roads. It will be months before the water recedes from some areas,
severely affecting crop production for the winter (Rabi) season, and the livelihoods of people whose main source of income is
farming. On average, 80 per cent of standing crops were destroyed in the affected areas. In the livestock sector, 91 per cent of
communities reported losses of fodder stocks. Non-farm workers, including shopkeepers, small traders and daily job laborers,
are the second most-affected, with 26 per cent of the households depending on non-farm livelihoods reporting losses to their
sources of income.
The MIRA found that the floods increased vulnerability to food security, with all food stocks lost for more than 88 of
surveyed communities. In addition, over 90 per cent of the flood-affected people had reduced their number of meals by one or
two per day, and child feeding had also reduced in nearly 88 per cent of the assessed communities.
The main health problems highlighted by the key informants were malaria, diarrhea, skin infections; cough, cold with
fever; and measles. Damages to health centres led to a cessation and disruption of health services. The MIRA found that 32
per cent of affected communities were without access to healthcare services.
Floodwaters have damaged many sources of safe water, increasing vulnerability to waterborne diseases like cholera. The
MIRA found that more than 80 per cent of the assessed communities depend on hand pumps that have been contaminated by
floodwaters. Only 10 per cent had access to protected water sources. Access to sanitation has been reduced where pre -existing
sanitation conditions and availability was poor prior to the floods. MIRA results revealed that over 57 per cent of the flood -
affected people were defecating outside, increasing the likelihood of disease.
Across the five assessed districts, the MIRA that identified 88 per cent of homes were either partially damaged or destroyed,
and 26 per cent of the assessed population were without any shelter, with 19 per cent in makeshift shelters. Due to standing
water, the majority of damaged sites were inaccessible, implying that the real numbers of damaged and destroyed houses are
likely to be much higher than in assessed areas. Shelter support is of critical importance in all flood-affected areas and across
all districts more than 95 per cent of the households require emergency shelter and shelter tool kits.
Stagnant water in the low plains of affected areas is expected to remain for a long period because of the topography of the
terrain and the limited drainage infrastructure. A month ago 78 per cent of the MIRA respondents anticipated that stagnant
water would be a multi-faceted problem. MIRA findings are expected to help decision makers to collectively understand the
humanitarian impact of the floods and inform their formulation of strategic humanitarian prioritie s from the identified needs
and gaps, particularly relating to life-saving activities, in order to minimize the suffering of the flood-affected people.

2

3
Introduction and Background The heavy late monsoon rain spell that began in Pakistan on 7 September 2012 caused massive flooding and inundation of land, including some areas that have been subject to flooding for three years in a row. The 2012 floods have lead to more than 400 deaths, widespread damage and loss of homes and livelihoods, destruction of standing crops, and damage to infrastructure across southern Punjab, northern Sindh, and north-eastern Balochistan.
The MIRA (Multi-sector Initial Rapid Assessment) has been developed in collaboration between the Government of Pakistan (GoP) National Disaster Management Authority/Provincial Disaster Management Authority (NDMA/PDMA) and the humanitarian community, with the intention of sharing a common methodology and assessment tools for coherent needs data collection in an emergency. The development, methodology and process associated with the MIRA tool had been undertaken over the 6-month consultation endorsed by the NDMA and PDMAs. Preparations were underway with a pilot of the MIRA about to begin when the floods occurred. The GoP decided that the MIRA could be tested in five of the most severely affected districts: Rajanpur (Punjab), Kashmore and Jacobabad (Sindh) and Jafferabad and Naseerabad (Balochistan). The Assessment Working Group (AWG), co-chaired by NDMA and UNOCHA, coordinated the process.
The Assessment Monitoring Framework (AMF) and MIRA Process
The Assessment and Monitoring Framework (AMF) was adopted as a common, consistent framework within Pakistan in-line with global guidelines. It enables measurement of trends over time and between locations, resulting in better analysis and more informed operations. This joint coordinated approach includes:
Defined cluster-level indicators to be monitored through the emergency and early recovery phases;
Standard Operational Procedures (SOPs) and guidelines for ensuring comparability and consistency in needs
data collection; and
A monitoring component, including alignment with reporting mechanisms, to track changes in needs.
The MIRA is the first step of the Assessment and Monitoring Framework. It is designed to identify strategic humanitarian priorities after the onset of natural disasters or complex emergencies by, within 72 hours, establishing a situation overview based on secondary data and other sources such as remote sensing. Then, within 7 days, a field assessment on community level is carried out to identify needs and priorities of the affected and vulnerable population.
The MIRA is comprehensive and allows identification of humanitarian priorities, including: The scale, extent and nature of the disaster;
The determination of priority areas and assist in the planning and deployment of resources; and
Identification of gaps in response and rescue.
The MIRA also relates the specific event to the preparedness and response plan scenarios, secondary data and any available Government assessments that have already been carried out. The field assessment should identify needs to at least Admin 2 level (district) with statistical significance.
What does the MIRA involve? 1. Situation Overview based on Secondary Data Analysis
Secondary data plays a crucial role in the early stages of emergencies when primary data is not available due to human resources, time and access constraints Secondary data is is valuable for determining the trends of past disasters. Thus, a sector specific situation overview based on secondary data analysis was requested from each

4
cluster immediately after the onset of rains. Quantitative and qualitative secondary information of the area, group or sectors of interest was collected and analyzed.
2. Primary data collection at the community level through key informant interviews
The primary data component of the MIRA, also known as the Community Level Assessment (CLA), was collected directly by the Joint Assessment Roster (JAR), a pool of trained assessment enumerators through interviews with key informants supported by direct observation of the affected populations. The enumerators used hand held smart phone PDA devices to make live entries into a central database at OCHA, supported by the Assessment Working Group and Assessment Technical Team at the UN together with a NDMA Technical Advisor.
3. Information synthesis
Data synthesis was completed by an Assessment Analysis team comprised of information management officers from each cluster. Relevant pre-crisis information, secondary data analysis, and primary data were synthesized to provide an overall analysis of the situation to allow the GoP and humanitarian community to assess the scale of the emergency.
Objectives
The objective of the MIRA is to help decision makers collectively appreciate and communicate the nature and dynamics of the crisis and to further define strategic humanitarian priorities on the basis of the identified needs and gaps.
To support the holistic, consistent, reliable and timely collection and analysis of the data on humanitarian needs, particularly relating to life-saving activities, to minimize the suffering of the beneficiaries.
To provide fundamental initial information on the needs of the affected population and set priorities for international support. The information should be structured to enable easy linkages to decision-making and funding mechanisms.
To support the government on initial decision-making with regards to: o Whether assistance is needed or not; and o Whether local capacity is adequate or external resources are required.
To better target immediate humanitarian interventions.
Specifically, to identify and estimate the following: o The geographical extent of the affected area; and o Number of people affected.
On Access:
What are the logistic considerations in terms of effects of the emergency and options for response?
What are the security considerations?
On Needs:
How and to what extent does the crisis affect populations (outcomes)?
How and to what extent does the crisis affect livelihoods?
How does the crisis affect access to basic services and goods?
What are the national/sub-national private sector, nongovernmental and government capacities and how have they been affected?
Whether there are basic protection concerns for the population and, in particular, vulnerable groups
Coverage and Gaps
What proportion of the population in need is reached by humanitarian interventions? These will be estimates at this early stage.
To what extent are the needs addressed?
Strategic Humanitarian Objectives
What are the priority sectors for intervention?
Other key issues to be considered (protection, environment, gender, etc.)?

5
MIRA Timeline
Primary data collection in the field took place from 14-24 September across five districts starting with Rajanpur. The Assessment Technical Team (ATT), part of the AWG, was divided into two teams. One team one was sent to the field to operate in the field and support the roll out, and one team stayed in Islamabad and supported the field team with needed coordination and technical backstopping.
Training of the field research teams was held in three stages in three districts across the three assessed provinces. For Rajanpur, a one-day refresher training was conducted in Multan. For the two districts in Sindh (Kashmore and Jacobabad), the training session was conducted in Sukkur. For the two districts in Balochistan (Naseerabad and Jafferabad), the training session was conducted in Naseerabad.
In all five districts, the ATT, together with OCHA coordination colleagues, held a meeting with the District Commissioner (DC) and other district authorities. They were briefed on the MIRA methodology and their consent was sought. After this approval, a one-day MIRA refresher training for enumerators was conducted, including questionnaire content, use of PDAs, methodology, field/logistic planning.
Punjab - Rajanpur - MIRA Timeline
14-Sep 15-Sep 16-Sep 17-Sep
Meeting DCO Rajanpur Training Refresher JAR
Primary data collection
Kashmore and Jacobabad MIRA Timeline
17-Sep 18-Sep 19-Sep 20-Sep
Meeting DCO Kashmore and Jacobabad
Training Refresher JAR
Primary data collection
Balochistan - Naseerabad & Jafferabad MIRA Timeline
20-Sep 21-Sep 22-Sep 23-Sep 24-Sep
Meeting DCO Commissioner/Deputy Commissioner Naseerabad and Jafferabad Training Refresher Primary data collection
MIRA Timeline:
14 - 20 Sep 21 - 27 Sep 28 Sep - 4 Oct 5 - 11 Oct 12 - 18 Oct
Field data Collection
Data Analysis
Data Endorsement from District Authorities
Cluster reports based on MIRA analysis
Draft consolidated report of MIRA
Endorsement of Report by HCT and
NDMA

6
Sample Selection and Sampling Methodology
The methodology for MIRA field assessment is a community-level assessment based on key informant interviews. Primary data collection (community level assessment) was undertaken using representative sampling.
The total sampling frame consisted of all the affected and notified districts. In Pakistan, the districts are geographically
further divided into Tehsils/Talukas, UCs and Villages/Wards. For the purpose of the MIRA assessment, the total population of the five assessed districts was 4,623,876 for 2012. Based on the 1998 Census data, this figure was
validated and agreed upon by the districts.
To identify the scale and extent of the floods, the following analysis was undertaken:
Remote sensing, e.g. analysis of satellite imageries;
Landscan 2010 for population density and distribution; and
Verification against government data and local authorities.
Information on the affected population for the Tehsil/Taluka (Admin3), number/names of villages were calculated by Landscan/satellite imagery. The floods extent was produced using Moderate Resolution Imaging Spectroradiometer (MODIS) satellite image and population density from Landscan. The flood extent was then overlaid on Landscan data, and the population in flood affected areas was estimated in tabular form using a statistical process in GIS software for each district.
The following formulas were used to calculate the sample of villages for the assessment to ensure statistically significant results at the district level.
Selection of affected villages per district, distributed proportionate to estimated affected population at the Tehsil/Talukha level
Appropriate sample size was drawn to give results within certain reliability limits (5% margin of error and 95% confidence interval).
Sample size calculation formula:
and
Where: SS = Sample Size Z = Z value (e.g. 1.96 for 95% confidence level) p = proportion (used 0.5 for conservative sample size) C = confidence interval, expressed as decimal (e.g., .05 = ±5) pop= population
The sample is then distributed among the Tehsils/Talukas proportional to the population size.
The sample was selected using the “simple random selection method”.
Data collection
Key Informant interviews were conducted at the community level. Key informants (KIs) were identified through a consultation process with local community/government representatives. Most of the assessment teams, but not all of them, were made up of three people: one male and one female from the humanitarian community, and one government official.
The humanitarian community used smart phones/PDAs for data collection and the government representatives filled out paper questionnaires simultaneously. Upon completion of the assessment, the paper questionnaires were presented to the respective district authorities and copies of all questionnaires were handed over to NDMA. The average interview time was 30 minutes, but in reality this fluctuated due to field conditions.
7
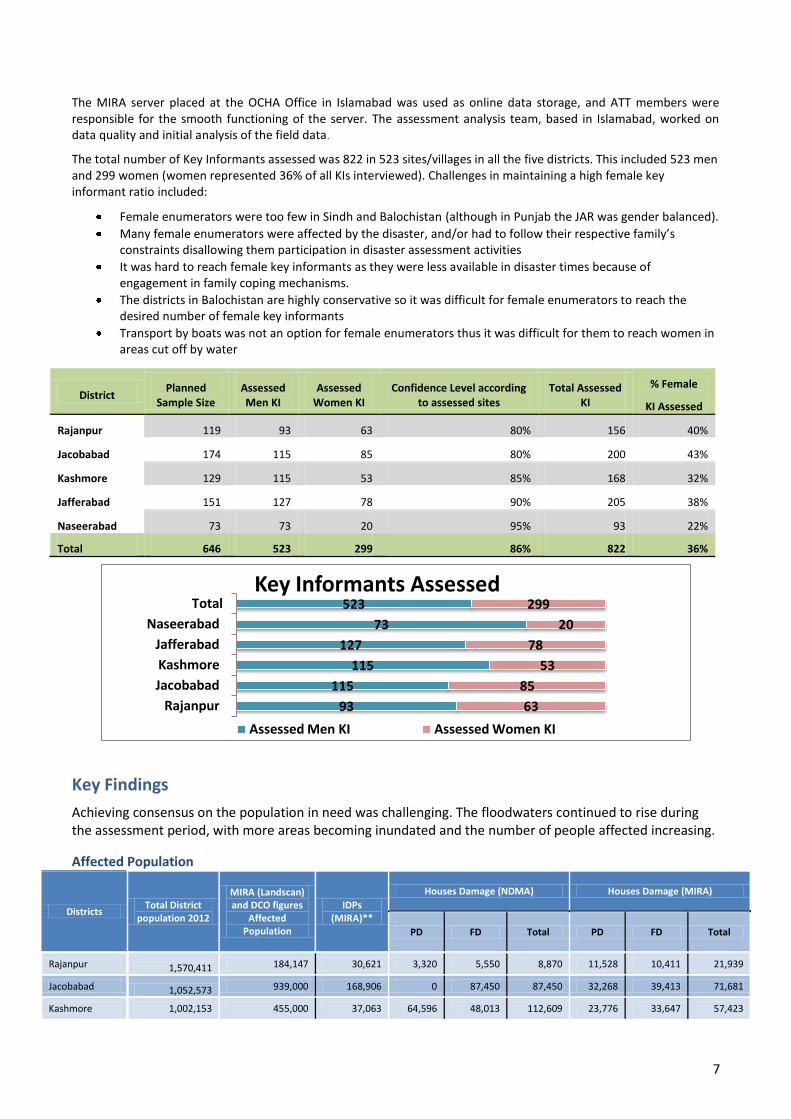
The MIRA server placed at the OCHA Office in Islamabad was used as online data storage, and ATT members were responsible for the smooth functioning of the server. The assessment analysis team, based in Islamabad, worked on data quality and initial analysis of the field data.
The total number of Key Informants assessed was 822 in 523 sites/villages in all the five districts. This included 523 men and 299 women (women represented 36% of all KIs interviewed). Challenges in maintaining a high female key informant ratio included:
Female enumerators were too few in Sindh and Balochistan (although in Punjab the JAR was gender balanced).
Many female enumerators were affected by the disaster, and/or had to follow their respective family’s constraints disallowing them participation in disaster assessment activities
It was hard to reach female key informants as they were less available in disaster times because of engagement in family coping mechanisms.
The districts in Balochistan are highly conservative so it was difficult for female enumerators to reach the desired number of female key informants
Transport by boats was not an option for female enumerators thus it was difficult for them to reach women in areas cut off by water
District Planned
Sample Size Assessed Men KI
Assessed Women KI
Confidence Level according to assessed sites
Total Assessed KI
% Female
KI Assessed
Rajanpur 119 93 63 80% 156 40%
Jacobabad 174 115 85 80% 200 43%
Kashmore 129 115 53 85% 168 32%
Jafferabad 151 127 78 90% 205 38%
Naseerabad 73 73 20 95% 93 22%
Total 646 523 299 86% 822 36%
Key Findings
Achieving consensus on the population in need was challenging. The floodwaters continued to rise during the assessment period, with more areas becoming inundated and the number of people affected increasing.
Affected Population
Districts Total District
population 2012
MIRA (Landscan) and DCO figures
Affected Population
IDPs (MIRA)**
Houses Damage (NDMA) Houses Damage (MIRA)
PD FD Total PD FD Total
Rajanpur 1,570,411 184,147 30,621 3,320 5,550 8,870 11,528 10,411 21,939
Jacobabad 1,052,573 939,000 168,906 0 87,450 87,450 32,268 39,413 71,681
Kashmore 1,002,153 455,000 37,063 64,596 48,013 112,609 23,776 33,647 57,423
93
115
115
127
73
523
63
85
53
78
20
299
Rajanpur
Jacobabad
Kashmore
Jafferabad
Naseerabad
Total Key Informants Assessed
Assessed Men KI Assessed Women KI

8
Jafferabad 611, 367 341,892 88,503 0 0 0 11,911 39,071 50,982
Naseerabad 387,372 102,715 47,473 0 0 0 4,960 11,058 16,018
Total 4,623,876 2,022,753 372,566 67,916 141,013 208,929 84,443 133,600 218,043
* The MIRA represents a snapshot based on access to some of the affected areas and feedback from key informants. MIRA estimates of people affected in Jacobabad and Kashmore are considered to be too far below actual numbers. It has been agreed with government that for Jacobabad there are 939,000 people affected and for Kashmore 455,000.
Key Figures
Individuals Households
Affected Population in five districts (LandScan Population with Satellite Imagery) 2,022,753 321,071
Minimum People Displaced based on MIRA survey 372,566 59,137
Houses fully destroyed 841,686 133,600 Houses
2,022,753
372,566
841,686
Affected Population in 5 districts (LandScan Population with
Satellite Imagery)
Minimum People Displaced based on MIRA survey
Houses fully destroyed
Key Figures - Individuals

9
Cluster Findings
Community Restoration Late season floods have badly affected human life, the economy and physical infrastructure and had a social and psychological impact on men, women and children. The NDMA’s update of 9 October 2012 indicates 451 deaths, 2,884 injured, 5,056,489 people affected, 274,713 houses fully damaged, and extensive losses to crops, irrigation and road infrastructure, in affected districts across the country.
Under the Community Restoration (CoRe), the MIRA calibrated the number and percentage of destroyed Community Basic Infrastructure (CBIs) such as link roads, bridges, culverts, people who did not receive early warning, status of the households dependent on non-farm source of income, governance functions, damaged to the government building etc. It also assessed the impact of floods on the accessibility and mobility of affected communities. Unsurprisingly, the MIRA identified that the floods have severely affected the accessibility and mobility of communities, and damaged shops, markets, public services, government buildings, and community critical infrastructure.
Inundation: Floods have inundated the majority of the areas visited and assessed by the MIRA team. Approximately 15% of the sampled villages could not be accessed due to flooded roads, damaged bridges and culverts, another 12% were inaccessible because the access roads were in such poor condition. Traffic on the national highway connecting Balochistan and Sindh was disrupted, with the highway closed for many weeks as the road had been cut in three places to allow flood waters to ease. Inundation has prevented access to the areas located away from main roads including in Naseerabad and Jafferabad districts of Balochistan where the GoP has still not been able to conduct any assessment to ascertain the magnitude of the destruction.
Damaged infrastructure: The MIRA counted 395 link roads of which only 22 roads have survived the floods. 46% (172) of the roads are completely damaged or unusable, and 36% (141) are partially damaged and can be restored with some repair. Damage to link roads along with inundation has completely paralyzed all economic and social activities. 24% of girls and boys cannot access their schools due to damaged roads. Jafferabad and Kashmore are the districts which suffered the most damage to link roads. Humanitarian operations are confined to roadside makeshift shelters due to inaccessibility to the affected villages.
Another significant impact of the flood is on the canals and irrigation network. Canal breaches at certain locations have added to the severity of floods. Most of crop fields are submerged and the off-farm and on-farm irrigation channels are choked and damaged. 58% of the channels are totally destroyed or unusable; 23% are partially damaged. Inundation of agricultural land means cropping is not possible. The damaged channel network is obstructing water flows as a result it will take months for the water to recede from the area. Across all of the assessed districts Jafferabad was the most damaged with 32% (113) of assessed channels damaged with Kashmore second with 22%.
Disrupted livelihoods and businesses: All economic activities in the districts are affected with agriculture the worst. Non-farm livelihoods including shopkeepers, small traders and daily job laborers, are the second most affected. 26% of the households depending on non-farm livelihoods have sustained losses to their source of income. The most affected are daily job laborers with 64% of the households
10
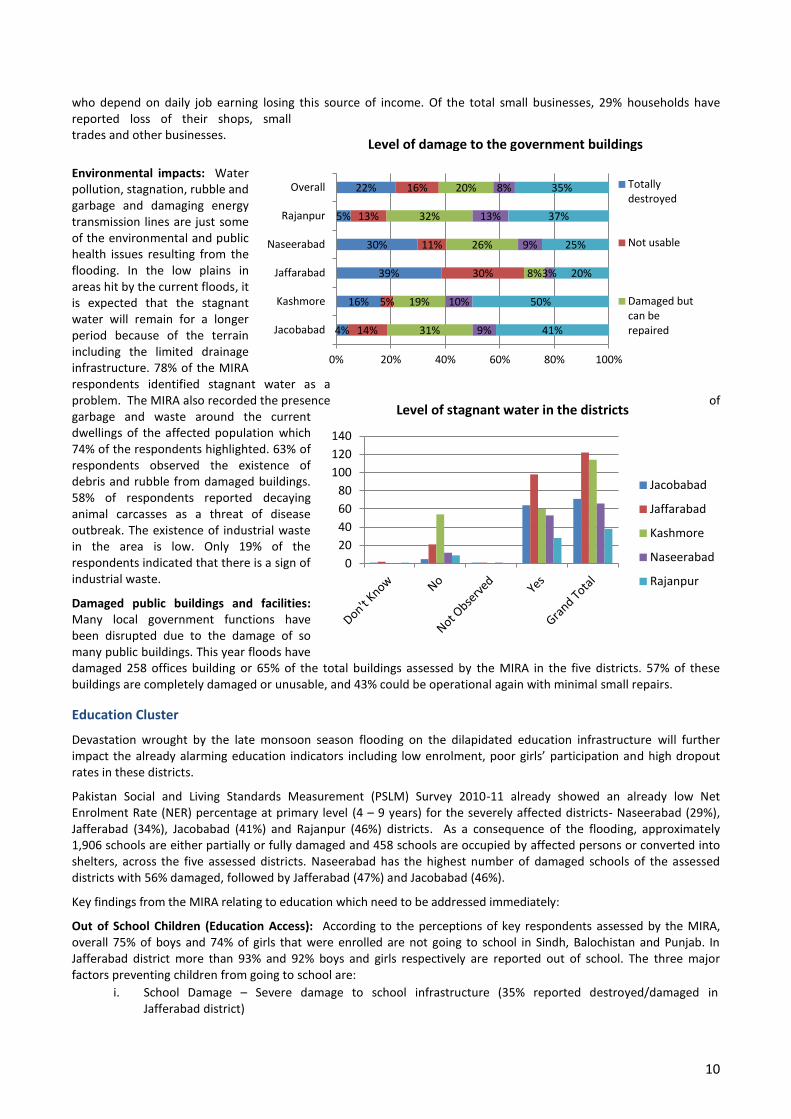
who depend on daily job earning losing this source of income. Of the total small businesses, 29% households have reported loss of their shops, small trades and other businesses.
Environmental impacts: Water pollution, stagnation, rubble and garbage and damaging energy transmission lines are just some of the environmental and public health issues resulting from the flooding. In the low plains in areas hit by the current floods, it is expected that the stagnant water will remain for a longer period because of the terrain including the limited drainage infrastructure. 78% of the MIRA respondents identified stagnant water as a problem. The MIRA also recorded the presence of garbage and waste around the current dwellings of the affected population which 74% of the respondents highlighted. 63% of respondents observed the existence of debris and rubble from damaged buildings. 58% of respondents reported decaying animal carcasses as a threat of disease outbreak. The existence of industrial waste in the area is low. Only 19% of the respondents indicated that there is a sign of industrial waste.
Damaged public buildings and facilities: Many local government functions have been disrupted due to the damage of so many public buildings. This year floods have damaged 258 offices building or 65% of the total buildings assessed by the MIRA in the five districts. 57% of these buildings are completely damaged or unusable, and 43% could be operational again with minimal small repairs.
Education Cluster
Devastation wrought by the late monsoon season flooding on the dilapidated education infrastructure will further impact the already alarming education indicators including low enrolment, poor girls’ participation and high dropout rates in these districts.
Pakistan Social and Living Standards Measurement (PSLM) Survey 2010-11 already showed an already low Net Enrolment Rate (NER) percentage at primary level (4 – 9 years) for the severely affected districts- Naseerabad (29%), Jafferabad (34%), Jacobabad (41%) and Rajanpur (46%) districts. As a consequence of the flooding, approximately 1,906 schools are either partially or fully damaged and 458 schools are occupied by affected persons or converted into shelters, across the five assessed districts. Naseerabad has the highest number of damaged schools of the assessed districts with 56% damaged, followed by Jafferabad (47%) and Jacobabad (46%).
Key findings from the MIRA relating to education which need to be addressed immediately:
Out of School Children (Education Access): According to the perceptions of key respondents assessed by the MIRA, overall 75% of boys and 74% of girls that were enrolled are not going to school in Sindh, Balochistan and Punjab. In Jafferabad district more than 93% and 92% boys and girls respectively are reported out of school. The three major factors preventing children from going to school are:
i. School Damage – Severe damage to school infrastructure (35% reported destroyed/damaged in Jafferabad district)
0
20
40
60
80
100
120
140
Jacobabad
Jaffarabad
Kashmore
Naseerabad
Rajanpur
Level of stagnant water in the districts
Level of damage to the government buildings
4%
16%
39%
30%
5%
22%
14%
5%
30%
11%
13%
16%
31%
19%
8%
26%
32%
20%
9%
10%
3%
9%
13%
8%
41%
50%
20%
25%
37%
35%
0% 20% 40% 60% 80% 100%
Jacobabad
Kashmore
Jaffarabad
Naseerabad
Rajanpur
Overall Totally destroyed
Not usable
Damaged but can be repaired

11
ii. Road Damage- Children are unable to access to schools due to severe road damage (36% cite road damage as hampering access to schools in Rajanpur)
iii. Non-availability of teachers – 18% respondents in Jafferabad and Naseerabad reported that the non-availability of teachers in schools has restricted access to schools
Status of Enrolment: According to perceptions of key respondents (Figure x), overall 75% of boys and 74% of girls that were enrolled are not going to schools in Sindh, Balochistan and Punjab. In Jafferabad more than 93% and 92% of boys and girls respectively are reported as being out of school.
Availability of Building Facilities as a Learning Space: Large numbers of children are out of school so it is imperative that alternate learning facilities be made available to provide continuity of educational services and to reduce dropout rates.
27%
31%
18%
35%
31%
28%
36%
17%
30%
19%
14%
24%
17%
15%
15%
18%
18%
16%
4%
13%
9%
6%
15%
9%
1%
8%
11%
6%
7%
6%
5%
5%
2%
3%
2%
3%
4%
1%
4%
3%
1%
3%
6%
10%
11%
10%
12%
10%
0% 10% 20% 30% 40% 50% 60% 70% 80% 90% 100%
Rajanpur
Jacobabad
Kashmore
Jafferabad
Naseerabad
Overall
Reasons for being out of school
Schools are destroyed or damaged
Roads destroyed
Teachers are not available
Schools are used as IDP shelters
Dont know
Children are working
Safety or Security concern
Other
31%
32%
37%
32%
14%
16%
7%
8%
17%
26%
25%
26%
69%
68%
63%
68%
86%
84%
93%
92%
83%
74%
75%
74%
0% 10% 20% 30% 40% 50% 60% 70% 80% 90% 100%
Boys
Girls
Boys
Girls
Boys
Girls
Boys
Girls
Boys
Girls
Boys
Girls
Raj
anp
ur
Kas
hm
ore
Ja
cob
abad
Ja
ffer
abad
N
asee
rab
ad
Ove
rall
Percentage of students going to school after the floods
Going Not Going

12
More than 80% respondents across the five districts say there is no building facility available to be converted into learning space: 94% in Jafferabad and 82% in Rajanpur. In Kashmore 23% of KIs said there is building space available.
Shortage of Teachers: Lack of available teachers is also limiting access of children to schools. In some districts, teachers’ non-availability after the flood is as high as 91% (Jafferabad), 77% (Naseerabad) and 66% (Jacobabad) as shown in this following graph. Some 47% of KIs across the five districts said that teachers are not teaching after the event. However in Rajanpur teacher availability is not an issue, with 83% of teachers available in affected schools.
Figure x : (title of graph)
Loss of School Materials: Loss of school material has a negative impact on child psychology and their ability to resume schooling. In Jafferabad, 88% of KIs reported that children have lost all educational materials.
The graph below indicates these findings. 55% of children have lost their education materials (books, pencils, etc.) or had them damaged as revealed through perception of KIs in five districts; in Jafferabad 88%, in Jacobabad 86%, Rajanpur 41%, and in Kashmore 43% reported loss of educational materials.
3%
8%
5%
0%
0%
3%
0%
0%
0%
2%
10%
2%
82%
79%
71%
94%
73%
80%
15%
13%
23%
5%
18%
14%
Rajanpur
Jacobabad
Kashmore
Jafferabad
Naseerabad
Overall
Building Facilities Available to be Used as Learning Space
Other Don’t know No Yes
83%
34%
42%
9%
23%
53%
17%
66%
58%
91%
77%
47%
0% 10% 20% 30% 40% 50% 60% 70% 80% 90% 100%
Rajanpur
Jacobabad
Kashmore
Jafferabad
Naseerabad
Overall
Still Providing Education Not Providing Education
59%
14%
57%
12%
47%
45%
41%
86%
43%
88%
53%
55%
0% 10% 20% 30% 40% 50% 60% 70% 80% 90% 100%
Rajanpur
Jacobabad
Kashmore
Jafferabad
Naseerabad
Overall
Not Lost
Material Lost

13
Food security
To provide an understanding of the food security situation of the population in flood affected areas the MIRA included a module on the food security and agriculture. This module included questions on food stocks, frequency of meals per day, capacity to buy food (income), access to markets and food availability in markets. Data collected on food security was analyzed for each indicator and further examined for the most vulnerable indicators. Some of the indicators explain vulnerability to food insecurity, while others indicate the nature/type of interventions to be launched.
Food stocks: The findings show that households lost a large proportion of their food stocks due to the floods. Figure 1 suggests that overall more than 88% of the surveyed communities lost their food stocks. Among these, 57.9% of the communities reported losing more than 70% of the household food stock, while about 10% lost 50-70% of their food stocks. Communities who lost more than 70% of their food stock include 66% in Kashmore, 65% in Naseerabad, 62% in Jafferabad and 33% in Rajanpur.
Figure 2 shows that 32% of the surveyed communities have no food stocks at all, and others also have very meagre stocks. About 35% of the key informants responded that households in their communities have sufficient food stocks only for up to one week, whereas only 21% have sufficient food stocks for up to one month. Breakdown by districts shows that in Jafferabad, Naseerabad and Jacobabad, 67%, 45% and 34% of the communities have no food stocks at all respectively. In Kashmore almost half the surveyed communities have adequate food stocks for only up to one week. The situation seems to be slightly better in Rajanpur where half of the communities have sufficient food stocks for up to one month, the food stock losses are also lower in this district compared to the other districts.
Markets and Economic Access: In terms of physical access to markets, for around 28% of the communities the nearest accessible markets are, on average, at a distance of 5 kms or more, whereas markets are within an acceptable distance of 5 kms for the rest. Communities that reported markets at a distance of 5 km or more include 38% in Naseerabad, 33% in Rajanpur, 31% in Jafferabad, 24% in Jacobabad and 18% in Kashmore (shown in Figure 3).
The availability of food in the markets seems fairly good across the surveyed districts (Figure 4). Only 7% of the KIsinformed that there is no food available at all in the markets accessible to their communities, whereas either “plenty” or “adequate” food is available in the rest of the communities. On average, 58% of the communities reported having “plenty” of food available in their markets, while 33% of them have “adequate” food in the accessible markets. In Jafferabad and Rajanpur, 14% and 12% of the communities respectively reported that food is not available in the markets. This situation reveals that overall food supply is fairly comfortable and the main markets are still integrated, however, economic access to food is another issue.
34.0%
66.9%
3.5%
45.2%
5.6%
32.0%
43.4%
24.4%
47.4%
30.1%
25.6%
34.5%
13.2%
6.3%
26.3%
13.7%
50.0%
21.0%
0% 20% 40% 60% 80% 100%
Jacobabad
Jafferabad
Kashmore
Naseerabad
Rajanpur
Total
Figure 2: Food Stock Availability - Number of Days
no stock up to 1 week 1-2 weeks upto 1 month
12.1%
2.4%
12.3%
6.8%
18.9%
10.2%
61.7%
61.4%
64.9%
65.8%
33.3%
57.9%
0% 10% 20% 30% 40% 50% 60% 70% 80% 90% 100%
Jacobabad
Jafferabad
Kashmore
Naseeraba
Rajanpur
Total
Figure 1: Percentage of Food Stock Lost
No Losses 1-10 percent 11-20 percent 21-50 percent 51-70 percent 71 & above
0% 20% 40% 60% 80% 100%
Jacoba…
Jaffera…
Kashm…
Nasee…
Rajanp…
Total
Figure 3: Access to Market - Distance in KM
<1km 1-2 km 2.1-5 km 5.1-10 >10km

14
The findings show that there is little or no disposable income available within affected households to afford food commodities from the markets (Figure 5). About 22% of households in surveyed communities reported not having any income at all to buy food commodities from the markets, whereas in another 27% of communities only 1-10% of the households have income to buy food. Households in almost 50% of the surveyed communities in Jafferabad and 23.3% in Naseerabad have no income at all to buy food commodities. In Naseerabad, Rajanpur and Kashmore 54%, 28% and 23% of the communities respectively only 1-10% of households have sufficient income to buy food from the market. The household income situation is slightly better in the other districts for purchasing of food commodities. More than 50% of the households in the surveyed communities earn their livelihood through agriculture and the floods caused heavy losses to on-farm/agriculture based livelihoods. In Kashmore, communities are relatively less dependent on agriculture compared to other districts. For this reason, in about 23% of the communities more than 50% of the households have some income to buy food from the markets.
Food Intake: The disaster badly affected the food intake of the populations Figure 6). In the districts of Jacobabad, Jafferabad, Kashmore and Naseerabad, the average number of meals consumed by adults has decreased from close to three meals per day before the floods to almost half. The reduction is less drastic in Rajanpur. This drastic reduction in food intake can be attributed to the lack of income to buy food as seen in the above section on economic access to markets. This indicates the urgency of addressing food needs of the population.
A sub-district level rapid assessment is currently being conducted by WFP VAM Unit to provide a basis for more detailed targeting and prioritization of food assistance needs at the village level within the various districts.
Impact on livelihoods: The most common economic activity in the flood affected areas is farming. Some 58% of respondents stated that they farmed their own land or share cropped as their primary source of income. This is followed by day laboring (15%), livestock (14%) and regular ‘salaried’ job (8%). Some significant
.0
1.0
2.0
3.0
4.0
Jacobabad Jafferaba Kashmore Naseeraba Rajanpur
Figure 6: Eating Patterns - Average number of meals per day
BEFORE AFTER
57.9%
15.3% 13.8%8.4%3.0% 0.9% 0.6%
46.6% (79%)
9.8% (64%)4.3% (31%)
0.9% (29%)5.8% (69%)
0.7% (76%) 0.2% (36%)
Agriculture
based -own farm
or share
cropping
Daily labourer Livestock based Shopkeeper or
trader or
Business
Regular job Fishery Other
Livelihood Losses
12.3%
49.6%
8.8%
23.3%
10.8%
21.9%
19.3%
19.7%
23.0%
54.8%
28.0%
26.7%
18.4%
11.8%
18.6%
15.1%
14.0%
15.6%
28.1%
13.4%
23.0%
1.4%
32.3%
20.4%
0% 10% 20% 30% 40% 50% 60% 70% 80% 90% 100%
Jacobabad
Jafferabad
Kashmore
Naseerabad
Rajanpur
Total
Figure 5: Percentage of HH having income to buy food
0 percent 1-10 percent 11-20 percent 21-50 percent 51-70 percent 71 & above
%
20%
40%
60%
80%
100%
Jacobabad Jafferabad Kashmore Naseerabad Rajanpur
Figure 4: Sufficient food availablilty in the markets
plenty adequate not at all dont know

15
differences were recorded between the districts, for instance in Jafferabad district, 34% of the respondents have a regular job and while only 6% do in Jacobabad. While only 10% are relying on livestock based livelihoods in Jafferabad, this share is around 18.5% in other districts.
The agriculture sector has been hit hard by the floods. Out of the agriculture based households, almost 79% reported that their source of income has been destroyed. Almost two thirds of the day laborers have also lost their livelihood, as their activities are directly linked to the agriculture calendar, and harvesting and threshing are done during this period of the year. Similarly, 31% of the livestock based households have lost their livelihood, mainly due to animal losses.
Non-farm livelihood losses were reported as being highest in Jafferabad district; with an average loss of 96% of income source for day laborers as well as for the regular job holders. An important share (5.6%) of the population active in the fisheries sector was reported in Kashmore district, where 81% of their source of income has been lost due to the floods.
Table 2: Livelihood and impact of flood
Crop and livestock losses:
Respondents from Jacobabad and Jafferabad reported extreme losses of standing crops (97% and 95% respectively). On average, 80% of the standing crops were destroyed in
affected areas.
Districts
Agriculture based -own farm or
share cropping Livestock based Fishery Daily laborer Regular job
Shopkeeper or trader or Business
% of HHs with
income source
% of H lost
their income source
% of HHs with
income source
% of H lost
their income source
% of HHs with
income source
% of H lost
their income source
% of HHs with
income source
% of H lost
their income source
% of HHs with
income source
% of H lost
their income source
% of HHs with
income source
% of H lost their
income source
Rajanpur 62.9 75.4 15.8 12.8 0.0 0.0 15.2 35.1 2.0 4.2 3.7 10.2
Jacobabad 62.4 89.5 5.6 41.9 0.7 48.0 23.1 84.3 3.9 4.0 3.8 45.5
Kashmore 53.6 80.5 15.7 32.9 4.9 81.4 18.1 74.0 3.8 41.1 3.2 39.7
Jafferabad 40.8 95.0 10.1 82.4 0.2 61.6 14.6 96.1 32.4 96.1 1.6 70.5
Naseerabad 63.8 65.2 19.0 36.5 0.9 85.7 6.9 68.1 6.4 17.3 1.7 41.9
Overall average
57.9 78.8 13.8 31.4 0.9 76.2 15.3 64.3 8.4 68.7 3.0 29.5
72%
97%
71%
95%
62%
80%
Rajanpur Jacobabad Kashmore Jafferabad Naseerabad Total
Standing crops damaged
58%
15%
14%
3%
8%1%1%
Agriculture based -ownfarm or share cropping
Daily labourer
Livestock based
Shopkeeper or trader orBusiness
Regular job
Fishery
Other

16
Therefore the results corresponding to destroyed standing crop and losses to agriculture based livelihood point toward priority areas of intervention for the upcoming Rabi season.
In the livestock sector 37% of communities reported that 100% of their fodder stocks have been lost. Another 40% reported that more than half of their fodder stock has been lost. Only 9% reported no losses of fodder stocks.
Similarly, the communities reported a higher frequency of some infectious and epidemic animal diseases. The most common diseases reported to have affected animals are external parasites (60%), internal parasites (55%), digestive problems (44%) and respiratory diseases (41%). In addition, 58% of the enumerators reported that they observed at least one dead animal during assessment and one third of them witnessed/observed distress selling of livestock over the assessment period.
To avoid further animal losses due to either emergency destocking or lack of fodder / feed and diseases in Jacobabad and Jafferabad immediate interventions are required. This would also have a direct impact on their households’ daily animal products consumption like milk, yoghurt, eggs, meat, etc.
Damage to irrigation structures: Due to the climatic conditions of the area, most agriculture is irrigated. Functionallity of irrigation systems directly influences the food security level of households. Almost all the irrigation structures were affected by the floods to different degrees. Overall, 50% of the irrigation structures were totally damaged with highest percentages recorded in Jafferabad and Jacobabad where 8% are not usuable due to silting. Other shares were damaged but could be rehabilitated.
Health
The main health problems in the communities highlighted by the key informants are malaria (95%); diarrhoea (93%); skin infections (82%); cough, cold with fever (68%); and measles (18%).
Health Issues highlighted by KIs: % from total affected communities in five districts
In addition, these health threats are magnified by: populations moving to higher ground away from damaged structures or inundation; overcrowding in temporary shelters; lack of access to safe water and sanitation facilities; low pre-existing immunization coverage;, and high level of pre-existing malnutrition.
Thes MIRA shows that less than one third of affected people are reported to have no access to functional health facilities and 130 (54%) health facilities in the assessed districts are reported to be damaged or destroyed. Secondary
95% 93% 82%
68%
18% 13% 2%
Malaria Diarrhea Skin infections (scabies)
Cough and Cold fever
Measles Other Dont know
0.0%
20.0%
40.0%
60.0%
80.0%
100.0%
Rajanpur Jacobabad Kashmore Jafferabad Naseerabad Total
Animal diseases
External parasites Internal parasites Respiratory diseases Indigestion

17
data reflects a higher figure for damaged health facilities. (Source: PDMA, Provincial and District Department of Health, PPHI, WHO)
Province District Total Health Facilities Damaged Health Facilities Percentage Affected
Balochistan Jaffarabad 75 30 40%
Naseerabad 34 30 88%
Punjab Rajanpur 41 2 5%
Sindh Jacobabad 45 37 82%
Kashmore 46 31 67%
TOTAL 241 130 54%
The disruption of access to health services delivered by community based health care providers (the lady Health Workers and the Community Midwives) and damage to health facilities has further reduced access to services in areas which already had low access.
According to the MIRA in the access five districts 68% health facilities are still functional while 32% of affected communities don’t have access to the healthcare services. Of these, 23% don not have access because of damages to their health facilities, 7% due to staff availability and 2% due to other reasons.
Percentage of communities that have access to functional health facilities – MIRA, Overall of five assessed districts
Due to the damage to health infrastructure many health facilities are unable to provide health services and are now covered by temporary health posts and mobile health units/camps. Disruption in access to health services delivered by facility-based health care providers and damage to health facilities has further reduced access to services in areas where access to health facilities was already severely limited. The flood affected populations are at more risk of communicable disease outbreaks due to environmental disruption and temporary displacement.
More than 90% of KIs highlighted malaria and diarrhea as being an issue in their communities. In Pakistan, malaria is endemic, the second most frequently clinically suspected disease entity, with almost 4.5 million probable cases reported from district health systems in WHO Disease Early Warning and Response System (DEWS) module of the surveillance functioning in the floods affected districts of Jacobabad, Kashmore, Shikarpur, Naseerabad, Jaffarabad, and Rajanpur. Currently DEWS data is collected on a daily basis through 137 health centers including mobile medical teams, medical camps and fixed health facilities.
According to DEWS some 363,628 patient consultations were reported over the last 24 days from flood affected districts in Sindh and Baluchistan provinces. DEWS teams have responded to 16 outbreaks in week 40 including 9 outbreaks of other acute diarrhea affecting 2,149 people in flood affected districts. Contaminated water was found as a possible source of infection as water samples taken in affected areas were found to be unsafe for drinking.
Still functional 68%
Damaged 23%
Staff not available
7%
Other reasons
2%
Not Functional
32%

18
Daily trend of leading priority diseases, flood affected districts, 17 Sept to 3 Oct, 2012
Most of the safe water sources are damaged this may result in a rise in water borne diseases (such as cholera) in the coming weeks. According to initial assessment findings, the main reasons of suspecting drinking water contamination in these affected districts are:
Main reasons of drinking water contamination
In the flood affected districts from August 2010 to September 2012 a total of 1,173 alerts were detected by DEWS, investigated, responded and prevented prior to becoming a major outbreak. During the same period 134 outbreaks were also identified, responded to and controlled effectively thereby preventing the major damages which might have occurred otherwise.
Also through the DEWS, children under the age of 5 years (girls 3,435, boys 4,642) and adult women and men (females 3,580 and male 4,613) are known to be most affected, including for cholera 20 (1,495 cases and 28 deaths), measles 47 (1,120 cases, 20), malaria 40 (2,648 cases and 16 deaths) dengue haemorrhagic fever 7 (76 cases), typhoid fever 1 (468 cases), and leishmaniasis (2 outbreaks 115 cases). 2,617 samples were also collected and transported to NIH Islamabad for laboratory confirmation from these districts.
DEWS is also monitoring the severity of water borne disease (Acute Diarrhea), the existing data of weekly trends of acute diarrhea from the flood affected districts is compared with the data of last year which shows a steady pattern with limited and sporadic outbreaks, which are responded effectively by MoH/DEWS teams.
0
5
10
15
20
25
30
35
40
45
Pe
rce
nta
ge AD
BD
ARI
MAL
Skin Inf
38%
41%
17%
4%
Odour/Smell
Taste
Suspended solids
Other
19
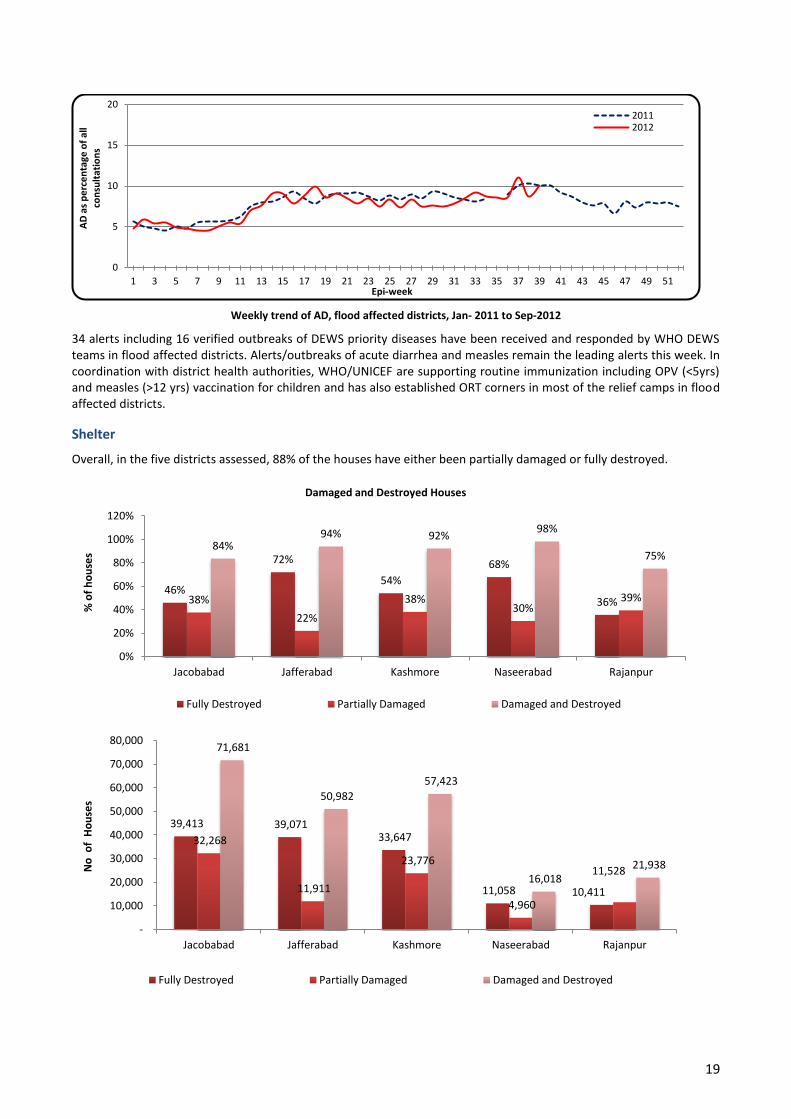
Weekly trend of AD, flood affected districts, Jan- 2011 to Sep-2012
34 alerts including 16 verified outbreaks of DEWS priority diseases have been received and responded by WHO DEWS teams in flood affected districts. Alerts/outbreaks of acute diarrhea and measles remain the leading alerts this week. In coordination with district health authorities, WHO/UNICEF are supporting routine immunization including OPV (<5yrs) and measles (>12 yrs) vaccination for children and has also established ORT corners in most of the relief camps in flood affected districts.
Shelter
Overall, in the five districts assessed, 88% of the houses have either been partially damaged or fully destroyed.
0
5
10
15
20
1 3 5 7 9 11 13 15 17 19 21 23 25 27 29 31 33 35 37 39 41 43 45 47 49 51
AD
as
pe
rce
nta
ge o
f al
l co
nsu
ltat
ion
s
Epi-week
2011 2012
46%
72%
54%
68%
36% 38%
22%
38% 30%
39%
84% 94% 92%
98%
75%
0%
20%
40%
60%
80%
100%
120%
Jacobabad Jafferabad Kashmore Naseerabad Rajanpur
% o
f h
ou
ses
Damaged and Destroyed Houses
Fully Destroyed Partially Damaged Damaged and Destroyed
39,413 39,071 33,647
11,058 10,411
32,268
11,911
23,776
4,960
11,528
71,681
50,982
57,423
16,018 21,938
-
10,000
20,000
30,000
40,000
50,000
60,000
70,000
80,000
Jacobabad Jafferabad Kashmore Naseerabad Rajanpur
No
of
Ho
use
s
Fully Destroyed Partially Damaged Damaged and Destroyed

20
The percentage of houses damaged or destroyed varies by district with the greatest proportion damaged and destroyed houses in Naseerabad (98%) and the lowest in Rajanpur (75%). Due to standing water the most damaged sites were not accessible so the numbers of damaged and destroyed houses in these affected areas are likely to be higher than in the areas assessed. Conversely, other areas in surrounding districts are likely to be less affected.
Current Living Conditions: Current living conditions of the households in the locations assessed show that overall 25.5% of the assessed population has no shelter and 18.7% are in makeshift shelters. 27.4% of the population is living in temporary shelter arrangements such as tents (11.6%), shelters using tarpaulins and bamboos (6.6%) or host families (9.8%). Only 24.6% are living in their own homes.
Across the districts shelter support is the most urgently needed in Naseerabad, Kashmore and Jafferabad where the percentage of people living without shelter or makeshift shelters are 63%, 58%, 53% respectively. In Jacobabad (33%) and Rajanpur (32%) the need is relatively less but still significant. In Jacobabad some of the worst affected areas are still inaccessible and it was not possible to assess the needs in these locations.
The MIRA primary data shows that overall 24% of the households have left their homes although this appears to underestimate the displacement figures because of a number of limitations of the assessment. Standing water did not allow access to most affected areas that are not accounted for; when people leave their villages they tend to form temporary settlements near their villages which could have been missed in the random selection of villages for this assessment; MIRA primarily assessed accessible villages as compared to any other settlements where it would be more likely to find populations that had moved due to inundation or infrastructure damage; and the proportions of people affected from the information on “Current Living conditions” and “Damaged and Destroyed Houses” are comparable (72% and 87%) and the proportion of people not in their own homes, gives a better summary of the number of people displaced than the number identified directly by MIRA.
17%
27%
38%
33%
21%
25.5%
16%
26%
20%
30%
11%
18.7%
17%
13%
10%
15%
7%
11.6%
15%
18%
5%
2%
3%
6.6%
8%
1%
2%
7%
18%
9.8%
24%
9%
23%
8%
39%
24.6%
3%
5%
1%
6%
2%
3.2%
0% 10% 20% 30% 40% 50% 60% 70% 80% 90% 100%
Jacobabad
Jafferabad
Kashmore
Naseerabad
Rajanpur
Overall
Percentage of population
Current Living Conditions
No shelter
Makeshift Shelters
Shelter using tarpaulins and bamboo Tents
98 69
113
42 81
403
2 1 3 6 14 57
2 31
8
112
Jacobabad Jafferabad Kashmore Naseerabad Rajanpur Overall
Types of Settlements
Communal Building City\Village Organised Settlement Spontaneous Settlement
21
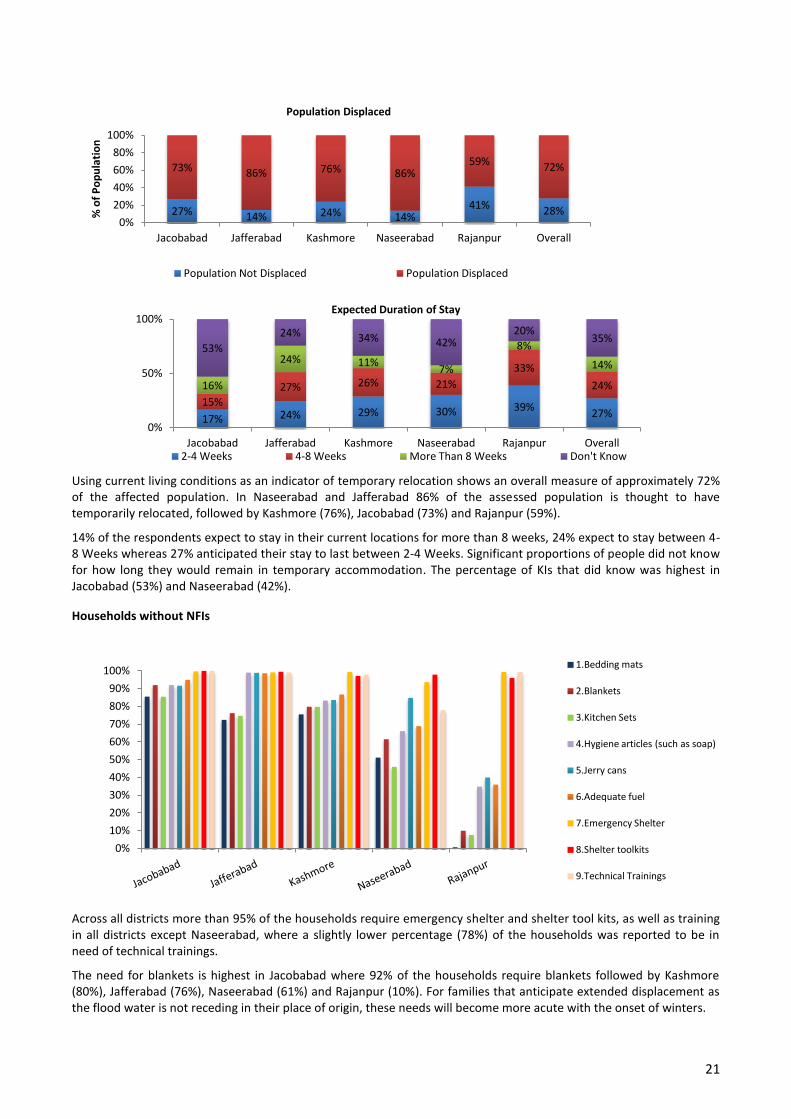
Using current living conditions as an indicator of temporary relocation shows an overall measure of approximately 72% of the affected population. In Naseerabad and Jafferabad 86% of the assessed population is thought to have temporarily relocated, followed by Kashmore (76%), Jacobabad (73%) and Rajanpur (59%).
14% of the respondents expect to stay in their current locations for more than 8 weeks, 24% expect to stay between 4-8 Weeks whereas 27% anticipated their stay to last between 2-4 Weeks. Significant proportions of people did not know for how long they would remain in temporary accommodation. The percentage of KIs that did know was highest in Jacobabad (53%) and Naseerabad (42%).
Households without NFIs
Across all districts more than 95% of the households require emergency shelter and shelter tool kits, as well as training in all districts except Naseerabad, where a slightly lower percentage (78%) of the households was reported to be in need of technical trainings.
The need for blankets is highest in Jacobabad where 92% of the households require blankets followed by Kashmore (80%), Jafferabad (76%), Naseerabad (61%) and Rajanpur (10%). For families that anticipate extended displacement as the flood water is not receding in their place of origin, these needs will become more acute with the onset of winters.
27% 14% 24% 14% 41% 28%
73% 86% 76% 86% 59% 72%
0%
20%
40%
60%
80%
100%
Jacobabad Jafferabad Kashmore Naseerabad Rajanpur Overall
% o
f P
op
ula
tio
n
Population Displaced
Population Not Displaced Population Displaced
17% 24% 29% 30% 39% 27%
15%
27% 26% 21%
33%
24% 16%
24% 11% 7%
8%
14%
53%
24% 34% 42% 20%
35%
0%
50%
100%
Jacobabad Jafferabad Kashmore Naseerabad Rajanpur Overall
Expected Duration of Stay
2-4 Weeks 4-8 Weeks More Than 8 Weeks Don't Know
0%
10%
20%
30%
40%
50%
60%
70%
80%
90%
100% 1.Bedding mats
2.Blankets
3.Kitchen Sets
4.Hygiene articles (such as soap)
5.Jerry cans
6.Adequate fuel
7.Emergency Shelter
8.Shelter toolkits
9.Technical Trainings

22
The MIRA Results also indicate that the need of bedding and mats is the highest in Jacobabad (85%) and Kashmore (76%) followed by Jafferabad (72%) and Naseerabad (51%). Only 1% of the Key Informants reported households to be in need of bedding and mats in Rajanpur.
Overall, the need of NFIs is the greatest in Jacobabad, Jafferabad, Kashmore followed by Naseerabad and Rajanpur.
Nutrition
MIRA Findings on Determinants of Malnutrition: The existing nutrition situation in the flood affected districts will be exacerbated by the following immediate and underlying factors which were determined by MIRA
Reduction in Meal Frequency: Over 90% of the total affected population has reduced their meal by once or twice a day. As a result food intake will be seriously compromised leading to calorie and other nutrient deficit and hence malnutrition. There is a reduction meal frequency in child feedings. Among the surveyed communities in the five districts, MIRA results shows that child feeding has reduced in 87.6% of the communities, whereas it remained the same in 3%.
Crop Loss and Reduced Access to Food: Overall in the five districts, more than 88% of the surveyed communities lost their food stocks. Among these, 57.9% of the communities reported losing more than 70% of the household food stock, while about 10% of lost 50-70% of their food stock. Food availability in the household will be significantly affected resulting in transient food insecurity which gives rise to inadequate intake of nutritious diet.
Burden of Infectious Diseases: More than 90% key informants highlighted malaria and diarrhoea in their community, over 60% mentioned cough and fever as problem.
Impaired Access to Basic Preventive and Curative Services: MIRA determined that about 23% of Health facilities not functional and hence access to health care will be compromised. The duration of disease could be prolonged and severity may escalate in children if access to curative and preventive services is limited. Loss of appetite and weight loss are common features of infectious diseases which directly result in acute malnutrition.
Uncontrolled Distribution of Milk Powder: Distribution of milk powder (which can be Breast Milk substituent Formula) during emergencies disrupts the normal infant and young child feeding practices. The majority (6%) of the communities receive milk powder as assistance for the children aged 6-24 months. In Rajanpur about 10% of the communities reported receiving such products.
94.7%
92.9%
95.7%
94.5%
90.3%
93.7%
5.3%
7.1%
4.3%
5.5%
9.7%
6.3%
10% 30% 50% 70% 90%
Jacobabad
Jafferaba
Kashmore
Naseeraba
Rajanpur
Total
% HH Received Powder Milk for Children
Not received Received

23
Water Sanitation and Hygiene (WASH)
To clearly recognize the water, sanitation and hygiene situation of the affected population in areas of south Punjab, north Sindh and eastern Balochistan, the MIRA included a chapter on the effect of the flood on WASH facilities and current access that is rendered by government and other institutions. The questionnaire included questions related to existing and working sources, access and availability of water at HH or communal level, sanitary facilities and water collection and storage items; and also communities whether they had hygiene items, and if there were reports of disease outbreaks at their village or community.
Data collected was analyzed for each indicator and further examined to identify vulnerable indicators. Some of the indicators explicitly complete breakdown of vital facilities, while others indicate types of response/intervention required or actionable responses that would fit cluster objectives.
Reliability of Water Sources:
A large number of people are dependent upon unprotected water supply sources as clearly indicated. Very limited number of households use protected sources that are assumed to be safe and free of contamination. Overall in the five districts; more than 80% of the surveyed communities depend on hand pumps that are contaminated by the flood waters (here a random water quality test has not been conducted nevertheless experience and quality of protection suggest hand pumps are extremely vulnerable to a high level contamination. Only 10% have access to protected water sources, that are water supply and tankering. Existing water sources though contaminated by the flood waters could be used as a source if household water treatment is enhanced.
Around 92% of people are not treating water at home or using Aquatabs, sachets or boiling, and over 53% say the water from source does not appear clean. This coupled with lack of knowledge, practice and a profound lack of safe drinking water in flooded districts and villages is putting those who are vulnerable at risk.
Physical access to water and sanitation sources: Access to sanitation has been the most problematic. The pre-existing sanitation condition and coverage was poor prior to the floods, and either open defecation or use of shallow pits has been the dominant practices among these communities. MIRA results confirm this notion and show that over 57% of people are practicing open defecation.
90%
55%
93%
15%
41%
0%
10%
20%
30%
40%
50%
60%
70%
80%
90%
100%
Jacobabad Jafferabad Kashmore Naseerabad Rajanpur
Pe
rce
nta
ge o
f H
Hs
Protected Well
Unprotected Well
Spring
Canal\River
Water Supply Scheme\Tankering Hand Pumps
Others
Don’t Know
54%
28%
53%
70% 74%
51%
% of HHs without Water Storage Pots

24
Water Collection and Storage Capacity: One of the fundamental and essential items in a HH while in camps or on transit but hard to possess is water storage or collection facilities. Communities often get to hold onto important and valuable items from their houses during displacement. Heavy and bulky items are always left behind like water containers, and traditional pots which are critical in serving as water storage. Prior to the flood communities often used traditional pots to collect and store water, Jerrycans and buckets.
Access to Sanitation: Sanitation while is a right to every person, it also tends to be a point of insecurity in crowded situations where women and girls often feel uncomfortable to use if facilities do not provide safety. The figures and the data shows that most of the affected community there are not enough latrines, sanitation options nor any exclusively for women and girls.
Overall vulnerability: Drinking water, provision of sanitation facilities that provide safety and dignity to affected population and non-food WASH items needs to be distributed to those that are in critical need. MIRA shows that over 350,000 people need urgent assistance. Union councils will be prioritized based on a gaps analysis.
Protection
The situation of women and children, the elderly and people with disabilities, along with child separation in the communities needs to be constantly monitored and addressed. These groups need to receive specific attention, largely by specialized protection actors able to provide support but also to refer cases to appropriate service providers (relief actors or Government institutions).
Women: represent 46.6% (Balochistan), 47.1% (Sindh) and 48.3% (Punjab) of the population of these provinces according to the 1998 census and nation-wide projections of the Pakistan Bureau for Statistics for 2011. Access to assistance for women taking into account women specific needs has been a consistent challenge in the post-disaster context in Pakistan.
Other Vulnerable Groups: The MIRA identifies 4% of all households to be headed by women, with a slight majority in Jacobabad (5.2%), in line with secondary data, including at provincial level.
Female Headed House Hold Ratio out of tatal HH
0.0%
1.0%
2.0%
3.0%
4.0%
5.0%
6.0%
Rajanpur Jacobabad Kashmore Jafferabad Naseerabad
F HH Ratio
District-
Province
Total HH
reported by KI
Female HH
reported by KIF HH Ratio
Rajanpur 79,412 3,014 3.80%
Jacobabad 30,647 1,609 5.25%
Kashmore 24,900 1,059 4.25%
Jafferabad 35,876 1,393 3.88%
Naseerabad 34,073 1,058 3.11%
Total 204,908 8,133 4%
97% 90%
69%
97% 96% 92%
Jacobabad Jafferabad Kashmore Naseerabad Rajanpur Overall
Percentage of HHs without Water Treatment
2% 2% 8% 7% 3% 4%
77% 84% 70% 79% 82% 79%
21% 14%
22% 14% 15% 17%
0%
20%
40%
60%
80%
100%
Jacobabad Jafferabad Kashmore Naseerabad Rajanpur Overall Pe
rce
nta
ge o
f R
esp
on
de
nts
Availability of Separate Sanitation Facilities for Women/Girls
Don’t Know No Yes
25
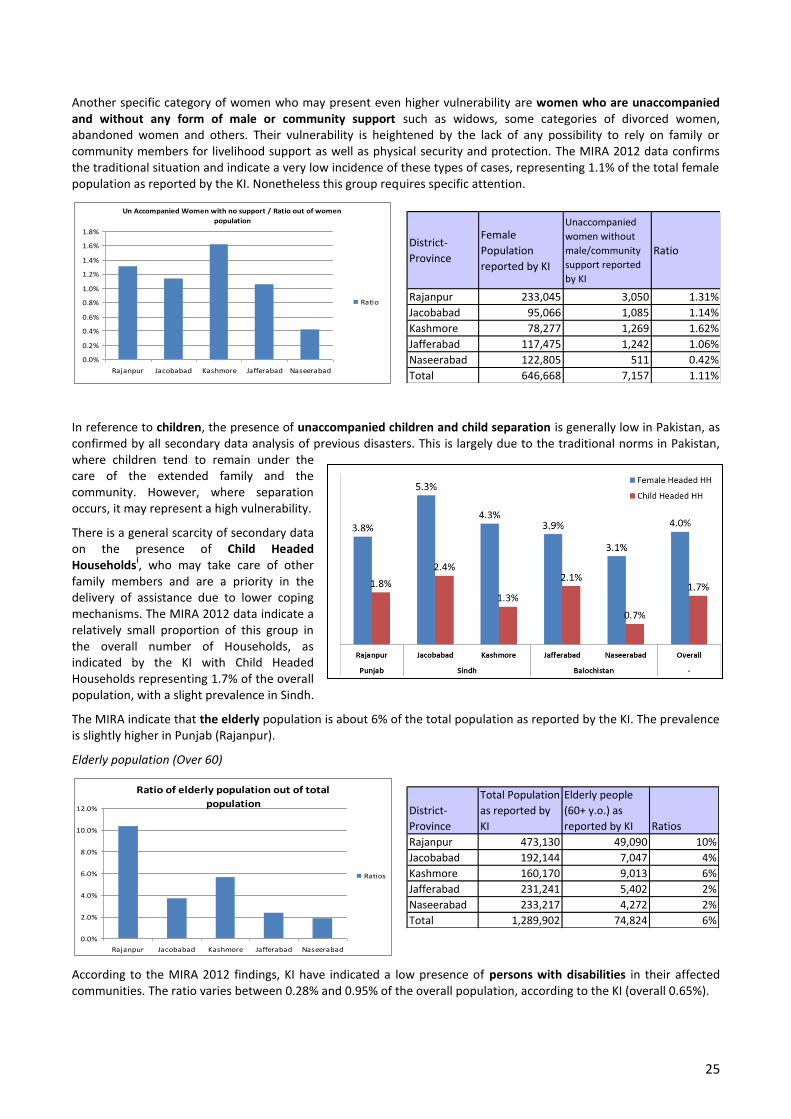
Another specific category of women who may present even higher vulnerability are women who are unaccompanied and without any form of male or community support such as widows, some categories of divorced women, abandoned women and others. Their vulnerability is heightened by the lack of any possibility to rely on family or community members for livelihood support as well as physical security and protection. The MIRA 2012 data confirms the traditional situation and indicate a very low incidence of these types of cases, representing 1.1% of the total female population as reported by the KI. Nonetheless this group requires specific attention.
In reference to children, the presence of unaccompanied children and child separation is generally low in Pakistan, as confirmed by all secondary data analysis of previous disasters. This is largely due to the traditional norms in Pakistan, where children tend to remain under the care of the extended family and the community. However, where separation occurs, it may represent a high vulnerability.
There is a general scarcity of secondary data on the presence of Child Headed Households
i, who may take care of other
family members and are a priority in the delivery of assistance due to lower coping mechanisms. The MIRA 2012 data indicate a relatively small proportion of this group in the overall number of Households, as indicated by the KI with Child Headed Households representing 1.7% of the overall population, with a slight prevalence in Sindh.
The MIRA indicate that the elderly population is about 6% of the total population as reported by the KI. The prevalence is slightly higher in Punjab (Rajanpur).
Elderly population (Over 60)
According to the MIRA 2012 findings, KI have indicated a low presence of persons with disabilities in their affected communities. The ratio varies between 0.28% and 0.95% of the overall population, according to the KI (overall 0.65%).
Un Accompanied Women with no support / Ratio out of women
population
0.0%
0.2%
0.4%
0.6%
0.8%
1.0%
1.2%
1.4%
1.6%
1.8%
Rajanpur Jacobabad Kashmore Jafferabad Naseerabad
Ratio
Ratio of elderly population out of total
population
0.0%
2.0%
4.0%
6.0%
8.0%
10.0%
12.0%
Rajanpur Jacobabad Kashmore Jafferabad Naseerabad
Ratios
District-
Province
Female
Population
reported by KI
Unaccompanied
women without
male/community
support reported
by KI
Ratio
Rajanpur 233,045 3,050 1.31%
Jacobabad 95,066 1,085 1.14%
Kashmore 78,277 1,269 1.62%
Jafferabad 117,475 1,242 1.06%
Naseerabad 122,805 511 0.42%
Total 646,668 7,157 1.11%
District-
Province
Total Population
as reported by
KI
Elderly people
(60+ y.o.) as
reported by KI Ratios
Rajanpur 473,130 49,090 10%
Jacobabad 192,144 7,047 4%
Kashmore 160,170 9,013 6%
Jafferabad 231,241 5,402 2%
Naseerabad 233,217 4,272 2%
Total 1,289,902 74,824 6%

26
Persons with disabilities
From a protection perspective, it is already evident that the above mentioned groups are again in situations that are similar to those faced in previous disasters and need adequate attention and support.
Status of affected population according to the MIRA: A series of protection-related questions were addressed in the MIRA. Some of them recalled also the analysis done in previous assessments. This made it possible to use a series of secondary data to complement the interpretation.
Existence of problems faced by the community in obtaining assistance, as reported by KI - In each case, three answer choices were provided to the KI: “yes”; “no”; and “don’t know.” Overall 37% of 822 KI reported the existence of problems faced by their community in accessing assistance
ii. Responses ranged from 25% of KI reporting problems in
Naseerabad district to more than 50% of both male and female KI reporting problems in accessing assistance in Rajanpur district (Punjab), one of the first affected by the flash flooding. Overall, there was no substantial difference overall in the percentage of female or male KI reporting such problems, but differences emerged at district level. This information was basically consistent with or more favourable than available secondary data on access to assistance, such as assessments conducted following previous natural disasters in Pakistan.
iii
Q: 29 a. Does the community face problems in obtaining the assistance? - Opinion of the Male and Female KI
Q: 29 a. Does the community face problems in obtaining the assistance? - YES responses of the KI
Ratio of People with Physical/Mental Disabilites out
of total populaton
0.0%
0.2%
0.4%
0.6%
0.8%
1.0%
1.2%
Rajanpur Jacobabad Kashmore Jafferabad Naseerabad
Ratios
Yes No Don't Know
District M F TOT M F TOT M F TOT
Jacobabad 25% 35% 30% 55% 53% 54% 20% 12% 17%
Jafferabad 37% 29% 34% 58% 51% 56% 5% 19% 10%
Kashmore 45% 38% 43% 44% 58% 49% 10% 4% 8%
Naseerabad 26% 20% 25% 59% 45% 56% 15% 35% 19%
Rajanpur 53% 54% 53% 35% 40% 37% 12% 6% 10%
Grand Total 37% 37% 37% 50% 50% 50% 12% 13% 12%
25%
37%
45%
26%
53%
37%
35%
29%
38%
20%
54%
37%
30%
34%
43%
25%
53%
37%
0% 10% 20% 30% 40% 50% 60%
Jacobabad
Jafferabad
Kashmore
Naseerabad
Rajanpur
Grand Total
Total
Female
Male
District-
Province
Total
Population
reported by KI
People with
physical/mental
disabilities
reported by KI
Ratio
Rajanpur 473,130 4,517 0.95%
Jacobabad 192,144 1,027 0.53%
Kashmore 160,170 1,335 0.83%
Jafferabad 231,241 642 0.28%
Naseerabad 233,217 815 0.35%
Total 1,289,902 8,336 0.65%

27
Type of problems reported by the KI in accessing assistance - The question was posed only to those KI who responded “yes” to the existence of problems (196 male and 111 female KI). According to those KI, the five most frequently-cited problems were: 1) fighting between recipients at distribution points (56% of the KI who reported problems in the community); 2) lack of documentation (41% of the KI reporting problems); 3) not enough assistance for all entitled (34% of the KI reporting problems); 4) political interference in aid distribution (29% of KI reporting problems); and 5) exclusion of some specific groups (16% of the KI reporting problems).
Among these five most frequently-cited problems, fighting between recipients and lack of documentation were reported somewhat more frequently by male KI (58%M/ 51%F; 44%M/ 36% F). Not enough assistance was reported more frequently by male KI (39%M/ 25% F), possibly reflecting the fact that In Pakistan male are generally the Heads of the Household entitled. Political interference was reported approximately equally by both groups. The exclusion of specific groups, on the contrary, was reported somewhat more frequently by female KI (13% m/ 21% F).
29 b. Type of problems faced by the community in obtaining the assistance - Opinion of both Male and Female KI
Looking at the type of problems identified, this seems to be largely consistent with the results of Observation Checklist Question 35a, where for a large majority of locations observed by the enumerators, no signs were seen of humanitarian assistance being distributed.
0bs 35a: Are there signs of humanitarian assistance being distributed?
Another observation requested to the enumerators related to the actors that were distributing the assistance. The majority of the observers who answered positively reported that the assistance was distributed by Local NGOs/ Charities. It needs to be said, however, that this represents an “image” of the first days of the emergency, while in the meantime the efforts of the Government have evidently intensified.
District
Figh
tin
g b
etw
een
reci
pie
nts
at
dis
trib
uti
on
po
ints
Lack
of
do
cum
enta
tio
n
No
t en
ou
gh a
ssis
tan
ce
for
all e
nti
tled
Po
litic
al in
terf
eren
ce
in d
istr
ibu
tio
n o
f ai
d
Som
e sp
ecif
ic g
rou
ps
are
excl
ud
ed
Ass
ista
nce
was
ph
ysic
ally
inad
equ
ate
for
the
mo
st
Oth
er
Dis
trib
uti
on
met
ho
ds/
lay-
ou
t
excl
ud
es w
om
en-
hea
ded
ho
use
ho
lds
No
n-a
ffec
ted
gro
up
s
are
give
n
hu
man
itar
ian
Dis
trib
uti
on
met
ho
ds/
lay-
ou
t
excl
ud
es c
hild
ren
-
hea
ded
ho
use
ho
lds
Th
e as
sist
ance
did
no
t
resp
on
d t
o t
he
actu
al
nee
ds
Peo
ple
nee
d t
o b
rib
e
for
assi
stan
ce
Dis
trib
uti
on
exc
lud
es
eld
erly
per
son
s an
d
peo
ple
wit
h
dis
abili
ties
Excl
usi
on
of
child
ren
wit
h n
o a
du
lt
sup
ervi
sio
n
Exc
lusi
on
of
fam
ilies
for
un
kno
wn
rea
son
s
Jacobabad 59% 39% 27% 8% 3% 15% 8% 5% 8% 5% 3% 10% 0% 2% 0%
Jafferabad 61% 40% 19% 19% 10% 3% 13% 0% 4% 0% 4% 6% 0% 3% 1%
Kashmore 39% 19% 43% 36% 14% 11% 17% 8% 6% 10% 10% 3% 1% 1% 3%
Naseerabad 78% 65% 35% 30% 17% 17% 0% 0% 13% 0% 4% 17% 4% 17% 0%
Rajanpur 57% 55% 43% 45% 31% 23% 10% 27% 17% 20% 16% 7% 20% 12% 7%
Grand Total 56% 41% 34% 29% 16% 14% 11% 10% 9% 9% 8% 7% 6% 6% 3%
12%
13%
6%
27%
29%
15%
88%
87%
94%
73%
71%
85%
0% 20% 40% 60% 80% 100%
Jacobabad
Jaffarabad
Kashmore
Naseerabad
Rajanpur
Grand Total
No/ Nob
Yes

28
0bs 35b: If observed, by who the assistance is/ has been distributed (multiple)
The initial findings on the concerns related to relief assistance may also be considered consistent with another series of observations related to the perception of signs of tension in the community. Of 409 observed locations, overall 70% were observed to have some signs of tension amongst the population. Signs of tension were noticed most frequently in Rajanpur (Punjab) and least frequently in Naseerabad (Balochistan). The relatively high number of locations observed with signs of tension is consistent with, for example, the MIRA Key Informant data citing fighting between recipients at distribution points as the most frequently-cited problem in accessing assistance.
Obs 37: Are there signs of tension amongst the population? % of observed locations
Lack of CNIC reported as a problem in the community; percentage of KI reporting the existence of a problem
Overall, out of the 822 KI consulted, approximately 67% reported that the lack or loss of a CNIC is a problem in their respective community (29% NO; 4% DNK). It should be noted, however, that this does not represent the percentage of persons in the community lacking a CNIC, but simply the existence of the problem in the community. In Rajanpur and Naseerabad, the problem was more frequently reported. Overall and in each assessed district, males reported the lack/loss of a CNIC as an issue more frequently than females. The perception of lack of CNIC as a problem may correspond to the frequency of citing lack of documentation as a problem faced in accessing assistance, noted above
iv.
Q30a: lack of CNIC as a problem in the Community according to KI
26%
41%
33%
67%
36%
38%
7%
18%
67%
0%
21%
18%
0%
0%
11%
11%
7%
3%
67%
44%
22%
22%
86%
53%
0% 20% 40% 60% 80% 100%
Jacobabad
Jaffarabad
Kashmore
Naseerabad
Rajanpur
Grand Total
Local NGOs/ charities
INGOs
Military
Civilian authorities
80%
70%
63%
62%
87%
70%
20%
30%
37%
38%
13%
30%
0% 20% 40% 60% 80% 100%
Jacobabad
Jaffarabad
Kashmore
Naseerabad
Rajanpur
Grand Total
No/ Nob
Yes
73%
76%
68%
86%
74%
75%
49%
42%
47%
75%
70%
53%
63%
63%
61%
84%
72%
67%
0% 20% 40% 60% 80% 100%
Jacobabad
Jafferabad
Kashmore
Naseerabad
Rajanpur
Grand Total
Total
Female
Male
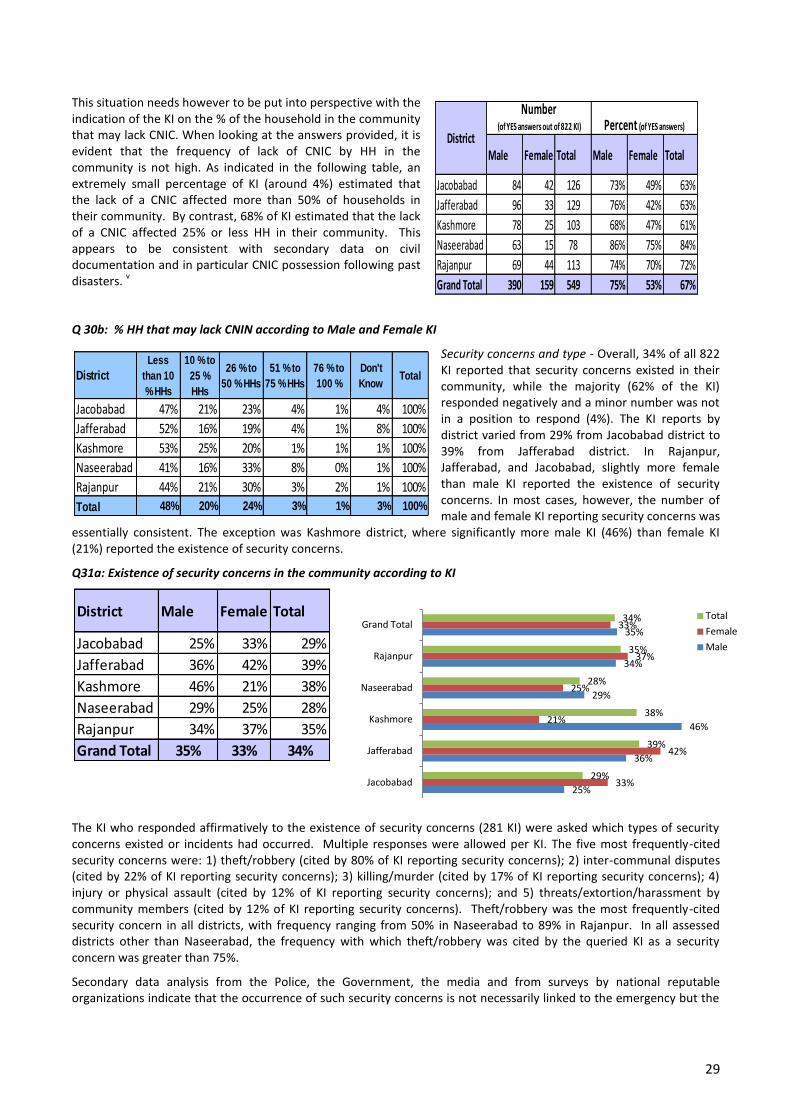
29
Male Female Total Male Female Total
Jacobabad 84 42 126 73% 49% 63%
Jafferabad 96 33 129 76% 42% 63%
Kashmore 78 25 103 68% 47% 61%
Naseerabad 63 15 78 86% 75% 84%
Rajanpur 69 44 113 74% 70% 72%
Grand Total 390 159 549 75% 53% 67%
District
Number (of YES answers out of 822 KI) Percent (of YES answers)
District
Less
than 10
% HHs
10 % to
25 %
HHs
26 % to
50 % HHs
51 % to
75 % HHs
76 % to
100 %
Don't
KnowTotal
Jacobabad 47% 21% 23% 4% 1% 4% 100%
Jafferabad 52% 16% 19% 4% 1% 8% 100%
Kashmore 53% 25% 20% 1% 1% 1% 100%
Naseerabad 41% 16% 33% 8% 0% 1% 100%
Rajanpur 44% 21% 30% 3% 2% 1% 100%
Total 48% 20% 24% 3% 1% 3% 100%
This situation needs however to be put into perspective with the indication of the KI on the % of the household in the community that may lack CNIC. When looking at the answers provided, it is evident that the frequency of lack of CNIC by HH in the community is not high. As indicated in the following table, an extremely small percentage of KI (around 4%) estimated that the lack of a CNIC affected more than 50% of households in their community. By contrast, 68% of KI estimated that the lack of a CNIC affected 25% or less HH in their community. This appears to be consistent with secondary data on civil documentation and in particular CNIC possession following past disasters.
v
Q 30b: % HH that may lack CNIN according to Male and Female KI
Security concerns and type - Overall, 34% of all 822 KI reported that security concerns existed in their community, while the majority (62% of the KI) responded negatively and a minor number was not in a position to respond (4%). The KI reports by district varied from 29% from Jacobabad district to 39% from Jafferabad district. In Rajanpur, Jafferabad, and Jacobabad, slightly more female than male KI reported the existence of security concerns. In most cases, however, the number of male and female KI reporting security concerns was
essentially consistent. The exception was Kashmore district, where significantly more male KI (46%) than female KI (21%) reported the existence of security concerns.
Q31a: Existence of security concerns in the community according to KI
The KI who responded affirmatively to the existence of security concerns (281 KI) were asked which types of security concerns existed or incidents had occurred. Multiple responses were allowed per KI. The five most frequently-cited security concerns were: 1) theft/robbery (cited by 80% of KI reporting security concerns); 2) inter-communal disputes (cited by 22% of KI reporting security concerns); 3) killing/murder (cited by 17% of KI reporting security concerns); 4) injury or physical assault (cited by 12% of KI reporting security concerns); and 5) threats/extortion/harassment by community members (cited by 12% of KI reporting security concerns). Theft/robbery was the most frequently-cited security concern in all districts, with frequency ranging from 50% in Naseerabad to 89% in Rajanpur. In all assessed districts other than Naseerabad, the frequency with which theft/robbery was cited by the queried KI as a security concern was greater than 75%.
Secondary data analysis from the Police, the Government, the media and from surveys by national reputable organizations indicate that the occurrence of such security concerns is not necessarily linked to the emergency but the
District Male Female Total
Jacobabad 25% 33% 29%
Jafferabad 36% 42% 39%
Kashmore 46% 21% 38%
Naseerabad 29% 25% 28%
Rajanpur 34% 37% 35%
Grand Total 35% 33% 34%
25%
36%
46%
29%
34%
35%
33%
42%
21%
25%
37%
33%
29%
39%
38%
28%
35%
34%
Jacobabad
Jafferabad
Kashmore
Naseerabad
Rajanpur
Grand Total Total
Female
Male

30
disruption of community structures in the post-disaster situation may provide a favorable ground for an increase of the phenomena.
vi
Q: 31 b. Type of concerns/ incidents existing in the community according to Male and Female KI
With the majority of security concerns cited, minimal difference was noted in the frequency of concerns cited by male versus female KI. Some exceptions were injury/ physical assault (cited by 9% of male KI reporting security problems but cited by and 17% female KI reporting security problems); and violence against boys and girls (cited by 6% of male KI reporting security problems and 11% of female KI reporting security problems).
Entities relied upon by the community for security, as reported by KI - Overall, the KI responded that community leaders and the police were primarily relied upon by the community for security. With multiple responses allowed per KI, 52% of KI indicated that the community relied upon community leaders for support. Across the districts, the responses ranged from 43% of KI indicating community leaders in Kashmore, to 69% in Jafferabad. This was closely followed by the Police, which was reported by 48% of overall KI as being an entity relied on for security in their community. District data ranged between 34% of Jacobabad KI and 62% of Jafferabad KI. Notably low numbers of KI indicated the military (3% overall) and religious leaders (1% overall). Based on overall totals, very little variation was seen across male and female KI for any answer choice.
Q 32 – Who the community relies on for security – according to Male and Female KI
These indications by the KI may also be put in relation to the observations of the enumerators on the presence of Law Enforcement Agents in the areas. Of 398 observed locations, in overall 24% of the locations the presence of law enforcement or security actors was observed. The presence was noticed most frequently in Jacobabad and least frequently in Jafferabad. Although these are mere observations of the assessors, they may also encourage the Government to increase further the presence at the benefit of the population.
District
The
ft, r
ob
be
ry
Inte
r-co
mm
un
al
dis
pu
tes/
co
mm
un
al
Kill
ing/
mu
rde
r
Inju
ry/
Ph
ysic
al a
ssau
lt
Thre
at/
ext
ort
ion
/
har
assm
en
t b
y
com
mu
nit
y
Ge
nd
er
Bas
ed
Vio
len
ce
(in
cl.
sexu
al/d
om
est
ic
vio
len
ce)
Kid
nap
pin
g/ a
bd
uct
ion
s/
dis
app
ear
ance
s
Vio
len
ce a
gain
st b
oys
and
gir
ls
Forc
ed
/ch
ild la
bo
ur
Forc
ed
re
cru
itm
en
t
Thre
at/
ext
ort
ion
/
har
assm
en
t b
y ar
me
d
gro
up
s
Thre
at/
ext
ort
ion
/
har
assm
en
t b
y
auth
ori
tie
s/ s
ecu
rity
Oth
er
Hu
man
tra
ffic
kin
g
Min
e /
UX
Os
inci
de
nts
Jacobabad 82% 18% 19% 9% 9% 2% 14% 4% 4% 0% 4% 0% 5% 0% 2%
Jafferabad 85% 5% 5% 3% 1% 0% 5% 3% 1% 5% 0% 4% 3% 3% 0%
Kashmore 77% 36% 22% 9% 9% 17% 6% 6% 5% 6% 3% 6% 6% 6% 6%
Naseerabad 50% 8% 15% 12% 23% 15% 0% 12% 8% 8% 8% 0% 0% 0% 0%
Rajanpur 89% 44% 27% 33% 27% 15% 13% 18% 16% 9% 11% 7% 0% 4% 4%
Grand Total 80% 22% 17% 12% 12% 9% 8% 7% 6% 5% 4% 4% 3% 3% 2%
District
Co
mm
un
ity
lea
de
rs
Po
lice
Lo
ca
l
au
th
orit
ies
Po
litic
al
lea
de
rs
No
ne
Mil
ita
ry
Oth
ers
Re
lig
iou
s
lea
de
rs
Jacobabad 45% 34% 28% 3% 9% 4% 4% 0%
Jafferabad 69% 62% 7% 2% 0% 2% 0% 0%
Kashmore 43% 43% 5% 10% 18% 0% 3% 1%
Naseerabad 46% 35% 28% 2% 1% 9% 3% 0%
Rajanpur 51% 61% 8% 30% 6% 4% 3% 6%
Grand Total 52% 48% 14% 9% 7% 3% 2% 1%
52%
48%
14%
9%
7%
3%
2%
1%
Community leaders
Police
Local authorities
Political leaders
None
Military
Others
Religious leaders
Authorities relied upon for security

31
Location considered at risks for women and children
58%
37%
34%
31%
31%
28%
28%
23%
23%
0% 10% 20% 30% 40% 50% 60% 70%
Nowhere
In camps/ settlements
At water collection points
At bathing facilities
While moving in the area
At health facilities
At assistance/ distribution points
At school
In the families GrandTotal
0bs 36: Observed law enforcement/ security actors in the area % Observed locations
Types of locations/situations in the community where women and children are at increased risk of violence/ harassment, according to KI - 724 KI answered to this question (469 M and 255 F), with multiple responses permitted per KI. Overall, 58% of the KI did not seem to consider any of the location as representing a particular risk. However, 37% of the KI mentioned camps/ settlements as the most risky location; 34% of the KI cited water collection points; 31% of the KI mentioned at bathing facilities and another 31% signaled the risk while moving in the area. No major differences existed between the male and female responses in the overall totals.
The least-frequently cited location/situation was in families (23% of KI cited).
Q33: Locations at risk for women and children according to KI
In one of the cases, the enumerators were asked to pay attention to the presence of hazardous objects in the areas, defined as stagnant water, open pit latrines, loose electric wires, amongst others. Of 400 observed locations, overall 69% were not observed to have hazardous objects located nearby. In 31% of locations enumerators observed such objects located nearby, potentially posing risks to the safety of
children in particular.
Hazardous objects/ locations around the observed site
Existence of children separated due to the emergency as reported by KI
Overall, 5% of KI reported that children separation is an issue in their communities due to the emergency. This does not represent a percentage of children who are separated, but rather the percentage of KI who were aware of such case/s in their communities. The answers ranged from a total of 1% of KI in Kashmore to 9% of KI in Rajanpur. Identification of separated and children is particularly complicated in the Pakistan context, where children are typically cared for by extended family or community members in the absence of parents or regular caregivers.
36%
11%
19%
44%
24%
24%
64%
89%
81%
56%
76%
76%
Jacobabad
Jaffarabad
Kashmore
Naseerabad
Rajanpur
Grand Total
No/ Nob
Yes
37%
27%
13%
46%
58%
31%
63%
73%
87%
54%
42%
69%
0% 10% 20% 30% 40% 50% 60% 70% 80% 90% 100%
Jacobabad
Jaffarabad
Kashmore
Naseerabad
Rajanpur
Grand Total
No/NobYes

32
9%
7%
4%
17%
3%
8%
91%
93%
96%
83%
97%
92%
0% 20% 40% 60% 80% 100%
Jacobabad
Jaffarabad
Kashmore
Naseerabad
Rajanpur
Grand Total
No/Nob
Yes
Q 35 – Children separation as a concern in the community according to male and Female KI
Another observation from the MIRA enumerator was focused on the existence of structures to take care of the well-being of children. Of 401 observed locations, overall only 8% were observed to have structures to take care of groups of children. Similar data was collected from 402 locations on orphanages, which found that 7% overall were observed to have such institutions. Of the locations where such structures were observed (31 locations), it was reported that the majority of structures were managed by Government or by private individuals.
Obs 41a: Observed existence of structures to take care of groups of children
Existence of persons with disabilities and elderly who face neglect, marginalization, abandonment, as reported by Male and Female KI - Overall, 23% of KI reported the existence of persons with disabilities or older persons facing neglect, marginalization, or abandonment in their communities. Answers from male and female KI are generally similar, with the exception of Naseerabad
district, where very few female KI cited the existence of such protection concern (20 out of 822 KI). Q 35: Existence of persons with disabilities and elderly who face neglect, marginalization, abandonment as reported by Male and Female KIs
DistrictMale yes
respondents
Female yes
respondents
Total
Jacobabad 6% 5% 6%
Jafferabad 7% 1% 5%
Kashmore 1% 2% 1%
Naseerabad 10% 0% 8%
Rajanpur 8% 11% 9%
Grand Total 6% 4% 5%
Male Female Total Male Female Total Male Female Total
Jacobabad 28 24 52 82 53 135 5 8 13
Jafferabad 15 5 20 109 70 179 3 3 6
Kashmore 30 9 39 79 36 115 6 8 14
Naseerabad 18 1 19 52 18 70 3 1 4
Rajanpur 35 28 63 56 34 90 2 1 3
Grand Total 126 67 193 378 211 589 19 21 40
District
Yes No DK
6%
7%
1%
10%
8%
6%
5%
1%
2%
0%
11%
4%
6%
5%
1%
8%
9%
5%
0% 2% 4% 6% 8% 10% 12%
Jacobabad
Jafferabad
Kashmore
Naseerabad
Rajanpur
Grand Total
Total
Female(yes)
Male (yes)

33
0bs 39: Observed signs of isolation or neglect of some persons or groups (e.g. elderly, persons with disabilities, children, and ethnic/religious minorities)
Privacy and dedicated facilities for women (Q 41)
Overall, only 15% of KI reported that in their communities, women and girls had separate access/ space for sanitation and bathing facilities. The difference between the male and female KI was greatest in Jafferabad, with 14% of male KI reporting the existence of separate facilities versus 0% of females. As the question tried to assess the existence, the lower number of reported affirmative responses for women KI is consistent with the expected results, as this implies that more women than men are aware of the lack of separate facilities. This would indicate a need to ensure that such facilities are included as part of any WASH interventions.
Q: 41: Do women and girls have separate access and space to sanitation/ bathing facilities?
Male Female Total Male Female Total Male Female Total
Jacobabad 24 13 37 89 67 156 2 5 7
Jafferabad 18 0 18 107 77 184 2 1 3
Kashmore 25 6 31 81 47 128 9 9
Naseerabad 10 1 11 58 18 76 5 1 6
Rajanpur 14 10 24 76 53 129 3 3
Grand Total 91 30 121 411 262 673 21 7 28
District
Yes No DK
DistrictMale
(yes)
Female
(yes)Total
Jacobabad 21% 15% 19%
Jafferabad 14% 0% 9%
Kashmore 22% 11% 18%
Naseerabad 14% 5% 12%
Rajanpur 15% 16% 15%
Grand Total 17% 10% 15%
21%
14%
22%
14%
15%
17%
15%
0%
11%
5%
16%
10%
0% 5% 10% 15% 20% 25%
Jacobabad
Jafferabad
Kashmore
Naseerabad
Rajanpur
Grand Total
Female (yes)
Male (yes)

34
Q 42: Access for persons with disabilities
Overall, a very small number of KI, both male and female, reported the existence of latrines/ bathing facilities which are accessible for persons with disabilities (4% of KI).
Q42: existence of any latrines/ bathing facilities suitable for use by people with disabilities
Sources of information relied upon by the community (Q 50)
Overall, with multiple responses permitted, most of the KI (84% of KI) cited that mobile phones are the most frequent sources to rely on information in the community. This was reported across all districts as well as by male and female KI. Other frequently-cited sources of information included radio (46% of KI), news (33% of KI), and community or religious leaders (10% of KI). Infrequently-cited sources included authorities (cited by 2% of KI).
Sources of information (by % of KI)
The overwhelming possession and reliance on mobile phones, and – conversely – the apparent lack of early warning for some of the affected population, as reported by the KI in the MIRA, open up a reflection as of whether mobile phones and SMSs should be more consistently used as communication tools to transmit early warning signals to the communities.
Topics on which the community is requesting information: Overall, with three responses permitted per KI, the three most frequently-cited topics on which communities requested information were information on food (cited by 84% of the KI), information on other relief assistance (65% of the KI) and information on registration (51% of the KI). Two other frequently-cited topics were how to get documentation (cited by 17% of the KI) and the weather forecast (cited by 16% of KI).This is consistent with relevant secondary data and with the results of recent rapid assessments showing that food and other relief assistance are considered priority needs of the affected communities.
Male Female Total Male Female Total Male Female Total
Jacobabad 2 9 11 111 71 182 2 5 7
Jafferabad 6 6 119 76 195 2 2 4
Kashmore 5 3 8 103 49 152 7 1 8
Naseerabad 7 7 59 20 79 7 7
Rajanpur 1 1 2 89 62 151 3 3
Grand Total 21 13 34 481 278 759 21 8 29
District
Yes No DK
Dis
tric
t
Mob
ile P
hone
s
Radi
o
New
s
Com
mun
ity/
Relig
ious
lead
ers
Oth
er
Don
't K
now
Aid
wor
kers
Aut
hori
ties
Jacobabad 86% 48% 48% 6% 3% 3% 1% 0%
Jafferabad 84% 17% 15% 8% 2% 6% 2% 1%
Kashmore 82% 69% 33% 18% 7% 2% 3% 4%
Naseerabad 90% 39% 39% 11% 8% 2% 3% 0%
Rajanpur 80% 64% 35% 9% 8% 2% 3% 5%
Grand Total 84% 46% 33% 10% 5% 3% 2% 2%

35
Infrequently-cited topics were security (cited by 6% of KI) and information on the situation in areas of origin (cited by 2% of KI). While security was not frequently cited overall, more women KI (10% of female KI) cited this than male KI (4%). The relatively infrequent citation of information about areas of origin as a topic requested by the community may indicate that communities, if displaced, are not too far from their areas of origin.
Q 51 – Topics on which the community requests information, according to KI
ENDNOTES
i A Household headed by a person below the age of 18 who is left permanently or temporarily without any adult to care for him/ her (i.e. an unaccompanied child) and therefore assumes responsibility as a Head of Household.
ii The overall percentage of KI replying “Don’t Know” was 12%.
iii For instance, in the Protection Cluster Rapid Protection Assessment 2011 in Sindh (2011), 46% of the KI reported that the communities had problems in access to assistance due to various reasons. Favouritism, often on political grounds, was reported as well as difficulties in access due to disorganized modalities of distribution. Lack of documentation was also reported as one of the barriers. In the Protection Cluster Rapid Protection Assessment 2011 for Balochistan (2011), 55% KI reported problems in access to assistance, due to various reasons including difficult access, lack of information, lack of documentation and inequalities (bribing).
iv Only the YES responses are here reported. The Percentage of KI who answered “Do Not Know” was negligible.
v While actual data on the lack of a CNIC has not been readily available from NADRA, secondary data taken both from previous natural disasters and from the recovery context indicates that in the immediate aftermath of flooding in previous years, lack or loss of documentation was cited as a significant problem; but that by the recovery phase, the percentage of people lacking documentation was smaller. This shows, among other things, the value of documentation support initiatives in restoring basic identity documentation to affected populations as well as the efforts done by the Government through NADRA. vi Citing Police Sources, Punjab Development Statistics 2010, for instance, indicate that 20.3% of the crimes were thefts or robberies; 5.2% reported as kidnapping/ abduction. The Bureau of Police Research and Development of the Ministry of Interior reported burglary and thefts amongst the major crimes in the country, with a 2.9% of kidnapping and abductions. The Gender Crime Cell of the National Police Bureau (2009); Aurat Foundation Report 2011; WHO Rapid Assessment 2011; Gender Needs assessments (UNIFEM 2010), have identified the regular occurrence of GBV, but also the possible increase in specific circumstances following a disaster.
District
Info
rmat
ion
on
fo
od
Info
rmat
ion
on
oth
er
relie
f
assi
stan
ce
Info
rmat
ion
on
re
gist
rati
on
Info
rmat
ion
on
ava
ilab
le
He
alth
se
rvic
es/
he
alth
ad
vice
Info
rmat
ion
on
ho
w t
o g
et
do
cum
en
tati
on
We
ath
er
fore
cast
Info
rmat
ion
on
loca
tio
n o
f
oth
er
fam
ily m
em
be
rs
Secu
rity
info
rmat
ion
Oth
er
Do
n't
Kn
ow
Info
rmat
ion
on
sit
uat
ion
in
are
as o
f o
rigi
n
Jacobabad 83% 55% 49% 31% 11% 8% 19% 11% 3% 4% 2%
Jafferabad 95% 78% 79% 7% 9% 0% 7% 0% 1% 4% 0%
Kashmore 83% 60% 40% 22% 17% 15% 17% 7% 13% 3% 2%
Naseerabad 80% 73% 45% 38% 35% 17% 12% 9% 4% 8% 0%
Rajanpur 75% 60% 33% 32% 22% 49% 9% 6% 7% 2% 8%
Grand Total 84% 65% 51% 24% 17% 16% 13% 6% 5% 4% 2%