Multi-scale supervised clustering-based feature selection ...
17
RESEARCH ARTICLE Open Access Multi-scale supervised clustering-based feature selection for tumor classification and identification of biomarkers and targets on genomic data Da Xu 1 , Jialin Zhang 1 , Hanxiao Xu 1 , Yusen Zhang 1* , Wei Chen 1 , Rui Gao 2 and Matthias Dehmer 3,4,5 Abstract Background: The small number of samples and the curse of dimensionality hamper the better application of deep learning techniques for disease classification. Additionally, the performance of clustering-based feature selection algorithms is still far from being satisfactory due to their limitation in using unsupervised learning methods. To enhance interpretability and overcome this problem, we developed a novel feature selection algorithm. In the meantime, complex genomic data brought great challenges for the identification of biomarkers and therapeutic targets. The current some feature selection methods have the problem of low sensitivity and specificity in this field. Results: In this article, we designed a multi-scale clustering-based feature selection algorithm named MCBFS which simultaneously performs feature selection and model learning for genomic data analysis. The experimental results demonstrated that MCBFS is robust and effective by comparing it with seven benchmark and six state-of-the-art supervised methods on eight data sets. The visualization results and the statistical test showed that MCBFS can capture the informative genes and improve the interpretability and visualization of tumor gene expression and single-cell sequencing data. Additionally, we developed a general framework named McbfsNW using gene expression data and protein interaction data to identify robust biomarkers and therapeutic targets for diagnosis and therapy of diseases. The framework incorporates the MCBFS algorithm, network recognition ensemble algorithm and feature selection wrapper. McbfsNW has been applied to the lung adenocarcinoma (LUAD) data sets. The preliminary results demonstrated that higher prediction results can be attained by identified biomarkers on the independent LUAD data set, and we also structured a drug-target network which may be good for LUAD therapy. Conclusions: The proposed novel feature selection method is robust and effective for gene selection, classification, and visualization. The framework McbfsNW is practical and helpful for the identification of biomarkers and targets on genomic data. It is believed that the same methods and principles are extensible and applicable to other different kinds of data sets. Keywords: Feature selection, Machine learning, Classification, Biomarker, Therapeutic target, Clustering © The Author(s). 2020 Open Access This article is licensed under a Creative Commons Attribution 4.0 International License, which permits use, sharing, adaptation, distribution and reproduction in any medium or format, as long as you give appropriate credit to the original author(s) and the source, provide a link to the Creative Commons licence, and indicate if changes were made. The images or other third party material in this article are included in the article's Creative Commons licence, unless indicated otherwise in a credit line to the material. If material is not included in the article's Creative Commons licence and your intended use is not permitted by statutory regulation or exceeds the permitted use, you will need to obtain permission directly from the copyright holder. To view a copy of this licence, visit http://creativecommons.org/licenses/by/4.0/. The Creative Commons Public Domain Dedication waiver (http://creativecommons.org/publicdomain/zero/1.0/) applies to the data made available in this article, unless otherwise stated in a credit line to the data. * Correspondence: [email protected] 1 School of Mathematics and Statistics, Shandong University, Weihai 264209, China Full list of author information is available at the end of the article Xu et al. BMC Genomics (2020) 21:650 https://doi.org/10.1186/s12864-020-07038-3
Transcript of Multi-scale supervised clustering-based feature selection ...

RESEARCH ARTICLE Open Access
Multi-scale supervised clustering-basedfeature selection for tumor classificationand identification of biomarkers andtargets on genomic dataDa Xu1, Jialin Zhang1, Hanxiao Xu1, Yusen Zhang1* , Wei Chen1, Rui Gao2 and Matthias Dehmer3,4,5
Abstract
Background: The small number of samples and the curse of dimensionality hamper the better application of deeplearning techniques for disease classification. Additionally, the performance of clustering-based feature selectionalgorithms is still far from being satisfactory due to their limitation in using unsupervised learning methods. Toenhance interpretability and overcome this problem, we developed a novel feature selection algorithm. In themeantime, complex genomic data brought great challenges for the identification of biomarkers and therapeutictargets. The current some feature selection methods have the problem of low sensitivity and specificity in this field.
Results: In this article, we designed a multi-scale clustering-based feature selection algorithm named MCBFS whichsimultaneously performs feature selection and model learning for genomic data analysis. The experimental resultsdemonstrated that MCBFS is robust and effective by comparing it with seven benchmark and six state-of-the-artsupervised methods on eight data sets. The visualization results and the statistical test showed that MCBFS cancapture the informative genes and improve the interpretability and visualization of tumor gene expression andsingle-cell sequencing data. Additionally, we developed a general framework named McbfsNW using geneexpression data and protein interaction data to identify robust biomarkers and therapeutic targets for diagnosis andtherapy of diseases. The framework incorporates the MCBFS algorithm, network recognition ensemble algorithmand feature selection wrapper. McbfsNW has been applied to the lung adenocarcinoma (LUAD) data sets. Thepreliminary results demonstrated that higher prediction results can be attained by identified biomarkers on theindependent LUAD data set, and we also structured a drug-target network which may be good for LUAD therapy.
Conclusions: The proposed novel feature selection method is robust and effective for gene selection, classification,and visualization. The framework McbfsNW is practical and helpful for the identification of biomarkers and targetson genomic data. It is believed that the same methods and principles are extensible and applicable to otherdifferent kinds of data sets.
Keywords: Feature selection, Machine learning, Classification, Biomarker, Therapeutic target, Clustering
© The Author(s). 2020 Open Access This article is licensed under a Creative Commons Attribution 4.0 International License,which permits use, sharing, adaptation, distribution and reproduction in any medium or format, as long as you giveappropriate credit to the original author(s) and the source, provide a link to the Creative Commons licence, and indicate ifchanges were made. The images or other third party material in this article are included in the article's Creative Commonslicence, unless indicated otherwise in a credit line to the material. If material is not included in the article's Creative Commonslicence and your intended use is not permitted by statutory regulation or exceeds the permitted use, you will need to obtainpermission directly from the copyright holder. To view a copy of this licence, visit http://creativecommons.org/licenses/by/4.0/.The Creative Commons Public Domain Dedication waiver (http://creativecommons.org/publicdomain/zero/1.0/) applies to thedata made available in this article, unless otherwise stated in a credit line to the data.
* Correspondence: [email protected] of Mathematics and Statistics, Shandong University, Weihai 264209,ChinaFull list of author information is available at the end of the article
Xu et al. BMC Genomics (2020) 21:650 https://doi.org/10.1186/s12864-020-07038-3

BackgroundGenomic data, such as gene expression data, have beenwidely utilized to explore the mechanisms underlying aseries of disorders [1]. It has the characteristics of imbal-anced class distribution, a huge number of genes and asmall number of samples. However, only a small subsetof genes is suitable for tumor classification. To addressthese issues, some feature selection algorithms have re-cently been developed for identifying informative genesfrom genomic data of cancer [2–5].Feature selection serves two purposes: to identify a
subset of features that have the most discriminative in-formation for the classification, to build rapid and robustpredictive models and reduce the dimensionality of thedata and to avoid over-fitting and improve classificationaccuracy [6, 7]; and to select relevant genes, and unravelthe underlying biological mechanisms, or to be used asbiomarkers or assess the efficacy of drugs [5, 8].Based on the availability of labels in data, feature selec-
tion methods can be broadly categorized into unsuper-vised and supervised [9]. For example, Feng et al.recently developed a new supervised discriminativesparse PCA (SDSPCA) method for multiview biologicaldata, which has been applied to cancer classification andinformative gene selection [2]. Zhao et al. presented su-pervised and unsupervised spectral feature selectionmethods for handling high-dimensional data [10]. Super-vised learning has been applied to single-cell transcrip-tion data to determine pathway activity and specific celltype. For example, Hu et al. described a novel method-ology for identifying key markers in neocortical cells,using supervised learning [11]. A neural network-basedapproach can also be used to reduce the dimensions ofsingle-cell RNA-seq data and predict cellular states andcell types [12].In the literature, feature selection algorithms can be
roughly grouped into three types: filter, wrapper, andembedded algorithms [13, 14]. The filter methods areindependent of the classification algorithm, and theyare faster than wrapper methods. Wrapper methodshave higher learning capacity and search for optimalcombinations of features. In general, filter methodscan be considered the principal or auxiliary selectionmechanisms. A better method is to use the univariatefilter method to reduce the search space, and furtherapply wrapper or embedded feature selectionmethods.In gene expression analyses, a powerful application of
feature selection is to identify complex disease genes andbiomarkers. Biomarkers can be used for disease early de-tection, prognosis, and assessment of drug efficacy [15].Some feature selection methods have been presented forthe identification of biomarkers [16, 17]. Embeddinggene expression data into the network may obtain better
interpretable gene sets and classification performance,biomarkers, or targets. Since disease development mayinvolve pathways and genes in multiple biological pro-cesses, network-based approaches could better under-stand the deregulated molecular mechanisms of cancerdevelopment and progression [18]. In biological pro-cesses, certain genes and signaling pathways play centralroles, which can be used as targets for disease therapy[19, 20]. Some network-based algorithms have been de-signed to select features or identify highly predictive bio-markers [1, 21].First, we designed a multi-scale distance function.
Then, using it, we proposed a new feature selectionmethod called MCBFS that performs feature weightingand clustering in a supervised manner for finding therelevant features and removing the redundant featuresfrom the original feature set. In addition, we developed ageneral framework named McbfsNW to identify robustbiomarkers and therapeutic targets for diagnosis andtherapy of diseases. This mixed mechanism takes advan-tage of filter method, network analysis and wrappermethod. First, candidate informative genes are selectedfrom the original gene sets through MCBFS proposed inthis work. Then, biomarkers and therapeutic targets arefurther identified by network analysis and more accuratewrappers.
ResultsDatasetsTo further assess the performance of MCBFS, the sum-mary of ten publicly gene expression data sets used inthe evaluation processes is tabulated in Table 1. Two-class cancer data sets and multi-class cancer data setswere used to compare the MCBFS method with otherpopular feature selection methods. Two-class cancerdata set DLBCL, multi-class cancer data set SRBCT andtwo single-cell data sets were visualized through theMCBFS method and principal component analysis(PCA) to demonstrate our method is effective and widelyapplicable.In order to evaluate the performance of the proposed
biomarker and therapeutic target identification frame-work, we applied McbfsNW to lung adenocarcinoma(LUAD) data sets. Three original LUAD gene expressiondata sets (GSE10072, GSE7670 and GSE43458) were re-trieved and downloaded from the Gene ExpressionOmnibus database (https://www.ncbi.nlm.nih.gov/geo/).To screen informative genes between the lung adenocar-cinoma tissues and adjacent non-tumor tissues and bal-ance the sample class sizes, we selected GSE10072 (107samples), GSE7670 (54 samples from GSM185811 toGSM185864) and GSE43458 (70 samples fromGSM1062805 to GSM1062874). In section 3.3.2, thecombination of GSE10072 and GSE7670 was served as
Xu et al. BMC Genomics (2020) 21:650 Page 2 of 17
the training set, and GSE43458 was used as an inde-pendent test set to identify and verify biomarkers.
The results of MCBFSTo obtain reliable results of MCBFS and make the re-sults more representative, in this section, the experimentis divided into four parts. First, we plotted the MCBFSaverage classification error curves. Second, we compareddifferent feature selection methods, including single dis-tance method, seven benchmark and six state-of-the-artsupervised feature selection methods. Third, the import-ance of informative genes selected was validated by vis-ual assessment. Fourth, the differential expression ofinformative genes selected was analyzed by a two-samplet-test.For the two-class cancer data sets, the average classifi-
cation performance of the feature selection method wasevaluated by several widely-used evaluation metrics, in-cluding accuracy (Acc), sensitivity (Sn), specificity (Sp)and F-score. The average classification performance ofmulti-class data sets was evaluated by Cohen’s Kappa co-efficient (Kappa) [32] and Acc. After achieving a lower-dimensional representation of the data by feature selec-tion, we adopted SVM (use RBF kernel) and kNN (k = 5)classifiers to classify the data, respectively. The cross-validation is a popular evaluation method and has beenwidely used in the field of bioinformatics and relatedstudies [8, 16, 33]. We performed 10-fold cross-validation for 10 times to obtain a statistically reliablepredictive performance. In this paper, the MCBFSmethod was tested on eight benchmark tumor data setsand compared with seven benchmark supervised featureselection methods [34], including Chi Square, FisherScore, Information Gain, mRMR, Gini Index, KruskalWallis and Relief-F. In addition, to further evaluate theperformance of MCBFS, we compared it with six state-of-the-art supervised feature selection methods, includ-ing supervised discriminative sparse PCA (SDSPCA) [2],infinite latent feature selection (ILFS) [14], Double
Kernel-Based Clustering method for Gene Selection(DKBCGS) [3], Infinite Feature Selection (infFS) [6], Su-pervised Multi-Cluster Feature Selection (SMCFS) [9]and Spectral Feature Selection (SPEC) [10].
Classification error curves of MCBFSThe average classification error rates were obtainedthrough 10-fold cross-validation with the kNN and SVMclassifiers on eight data sets respectively. Figure 1 showsthe relationship between the average classification errorrate and the genes selected by the MCBFS method.From the figure, as the number of genes increases from1 to 50, the predictable performance greatly improves.We set the range from 1 to 100 to find the best classifi-cation results. In general, most feature selection algo-rithms combine ranking genes with a specific classifierin the class prediction problems. From the figure, thekNN classifier has a better performance when fewergenes are retained. At the same time, the kNN classifiermay be the better classifier for tumor classification withlow-dimensional features [35]. In further work, to iden-tify biomarkers on LUAD data sets by McbfsNW frame-work, the kNN classifier was applied in the wrapper.
Comparison of competitive methodsIn this section, we compared MCBFS with different fea-ture selection methods. The experiment is divided intothree parts to obtain the performance of every method.The first part obtained the top 100 genes by using differ-ent methods, respectively. The second part used 10-foldcross-validation for 10 times to obtain the best featureset from retained the top 100 genes, respectively. In thispart, the first ranked gene was used as the starting pointof generating multiple gene subsets, which can save timefor the generating subsets. The third part used the bestfeature subset and the 10-fold cross-validation for 10times to obtain the average prediction performance ofdifferent methods.
Table 1 Summary of ten gene expression data sets
Types Data sets Samples Genes Classes References
Two-class cancer data sets AMLALL 72 7129 2 [22]
DLBCL 77 7129 2 [23]
Gastric cancer 40 1519 2 [24]
Colon Cancer 62 2000 2 [25]
Multi-class cancer data sets Lymphoma 62 4026 3 [26]
SRBCT 83 2308 4 [27]
Brain-Tumor1 90 5920 5 [28]
Lung-Cancer 203 12,600 5 [29]
Single-cell data sets Pollen 249 14,805 11 [30]
Usoskin 622 17,772 4 [31]
Xu et al. BMC Genomics (2020) 21:650 Page 3 of 17

To compare the performance of multi-scale distancemethod and single distance method, the average clas-sification results were obtained on two-class cancerdata sets and multi-class cancer data sets by SVMand kNN classifiers, respectively. In Fig. 2, we reportthe average performance of different distance methodsfor each type of data set. Figure 2a presents the aver-age experimental results of four two-class data sets oftwo distance methods with SVM and kNN classifiers,
respectively. From Fig. 2a, we can observe that multi-scale distance method achieves higher average resultsof four evaluation metrics. Figure 2b shows the aver-age performance of four multi-class data sets on twodistance methods with SVM and kNN classifiers, re-spectively. From Fig. 2b, we also can see a similarperformance. It can be obtained that the perfor-mances of the multi-scale distance method yield bet-ter than the single distance method on two types of
Fig. 1 The relationship between the average classification error rates and the number of selected genes
Fig. 2 Comparison results of multi-scale distance method and single distance method. a The average results of four methods on four two-classcancer data sets. b The average results of four methods on four multi-class cancer data sets
Xu et al. BMC Genomics (2020) 21:650 Page 4 of 17

data sets. These results show the ability of the pro-posed multi-scale distance function and MCBFS.To validate the classification performance of MCBFS,
we compared it with seven popular supervised featureselection methods on eight benchmark micro-array datasets. In Fig. 3, we report the average performance of thedifferent approaches for each type data set. Figure 3aand b present the average experimental results of fourtwo-class data sets of eight feature selection methodswith SVM and kNN classifiers, respectively. Figure 3cand d show the average performance of four multi-classdata sets of eight feature selection methods with SVM
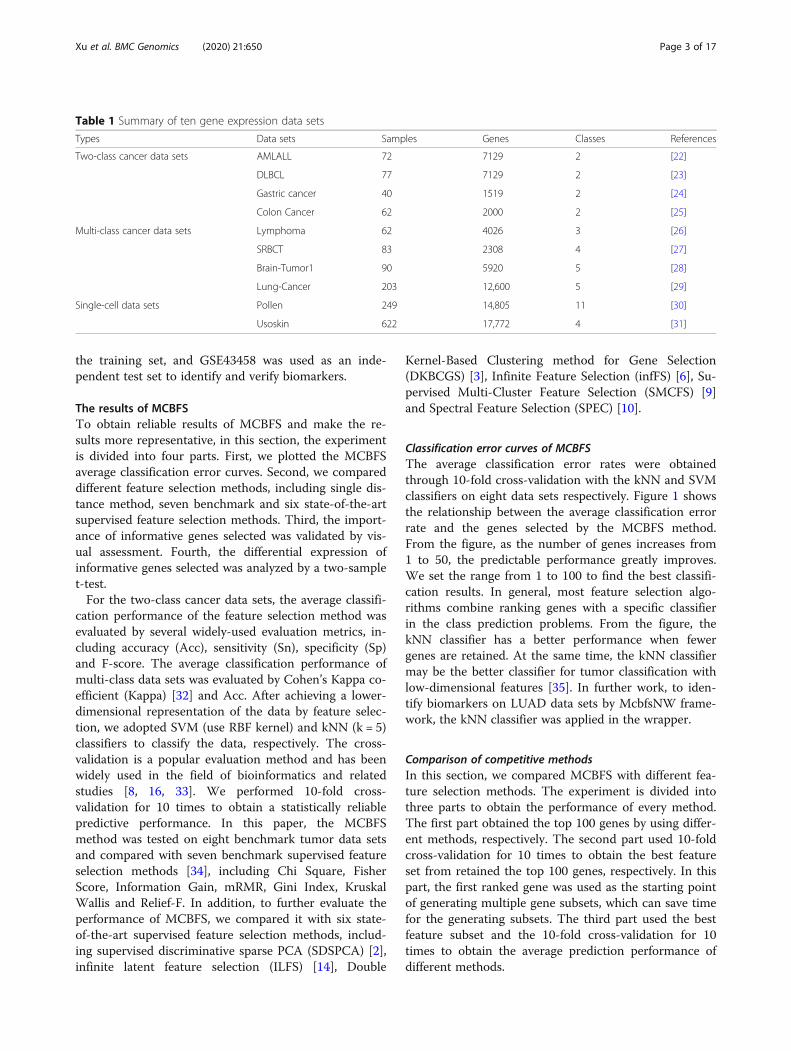
and kNN classifiers, respectively. It is noteworthy thatthe MCBFS method can achieve better prediction per-formance than other methods, except is highly competi-tive to the Information Gain method with SVM classifieron the multi-class data sets.In addition, we reproduced six state-of-the-art super-
vised feature selection methods and compared themwith our method on two-class and multi-class data sets.The experimental process is similar to Fig. 3. The com-parison results have been shown in Fig. 4. From Fig. 4,we can observe that MCBFS is superior to othermethods. The experimental results can suggest that our
Fig. 3 Comparison results of MCBFS and seven benchmark feature selections. a The average performance of four two-class data sets by differentfeature selection methods with SVM classifier. b The average performance of four two-class data sets by different feature selection methods withkNN classifier. c The average performance of four multi-class data sets by different feature selection methods with SVM classifier. d The averageperformance of four multi-class data sets by different feature selection methods with kNN classifier
Xu et al. BMC Genomics (2020) 21:650 Page 5 of 17
method is a reliable and effective method for featureselection.
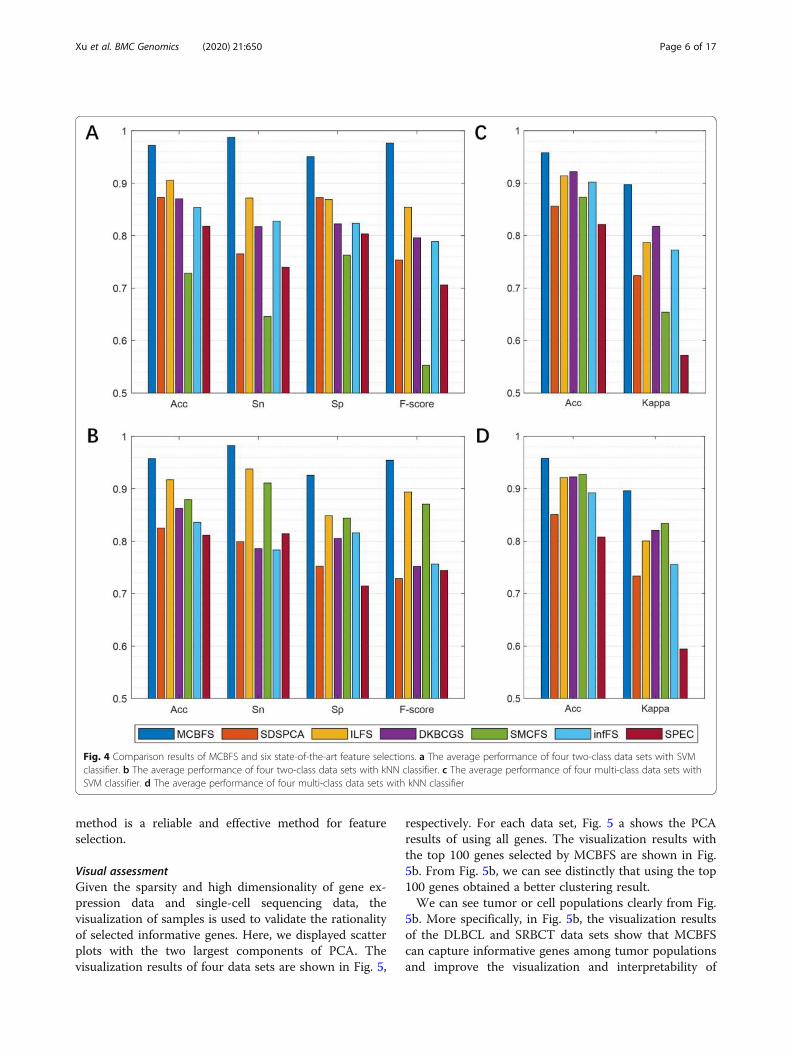
Visual assessmentGiven the sparsity and high dimensionality of gene ex-pression data and single-cell sequencing data, thevisualization of samples is used to validate the rationalityof selected informative genes. Here, we displayed scatterplots with the two largest components of PCA. Thevisualization results of four data sets are shown in Fig. 5,
respectively. For each data set, Fig. 5 a shows the PCAresults of using all genes. The visualization results withthe top 100 genes selected by MCBFS are shown in Fig.5b. From Fig. 5b, we can see distinctly that using the top100 genes obtained a better clustering result.We can see tumor or cell populations clearly from Fig.
5b. More specifically, in Fig. 5b, the visualization resultsof the DLBCL and SRBCT data sets show that MCBFScan capture informative genes among tumor populationsand improve the visualization and interpretability of
Fig. 4 Comparison results of MCBFS and six state-of-the-art feature selections. a The average performance of four two-class data sets with SVMclassifier. b The average performance of four two-class data sets with kNN classifier. c The average performance of four multi-class data sets withSVM classifier. d The average performance of four multi-class data sets with kNN classifier
Xu et al. BMC Genomics (2020) 21:650 Page 6 of 17
tumor gene expression data. Single-cell RNA sequen-cing can enable us to discover new cell subtypes ortypes, and reveal the differences in gene expressionamong multiple cell populations [36]. In Fig. 5b, thevisualization results of the Pollen and Usoskin datasets show that MCBFS is scalable, which can alsocapture informative genes among cell populations.MCBFS may be an effective tool for finding keymarkers from genomic data.
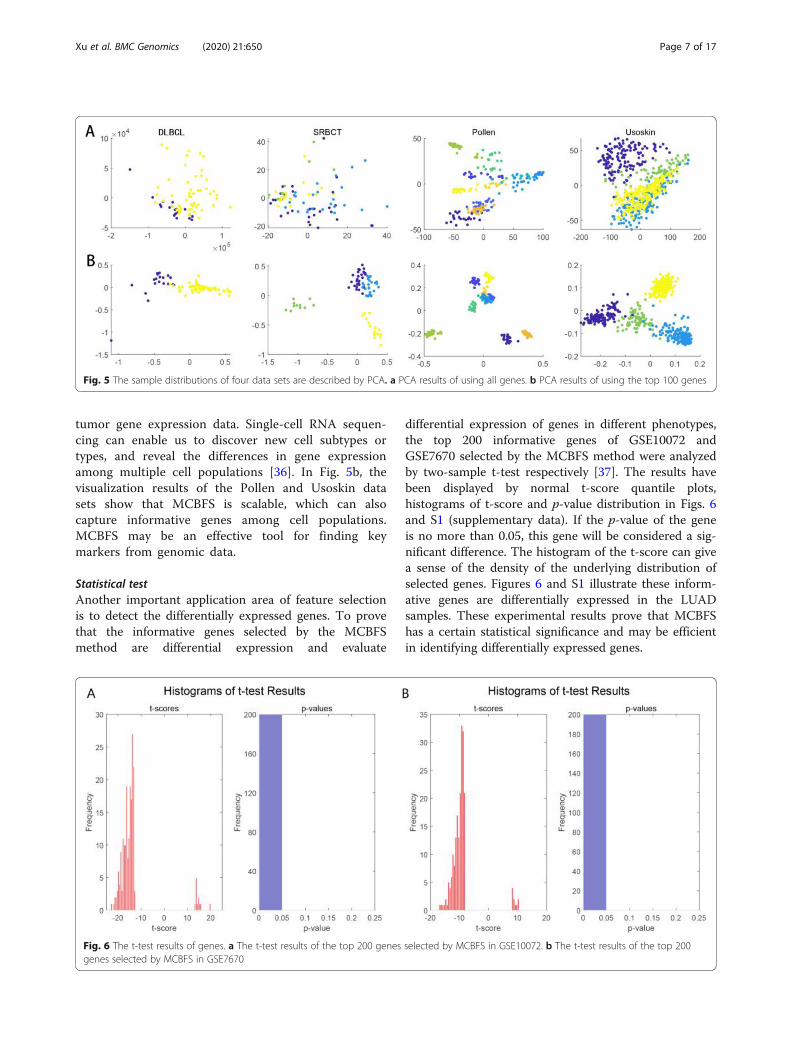
Statistical testAnother important application area of feature selectionis to detect the differentially expressed genes. To provethat the informative genes selected by the MCBFSmethod are differential expression and evaluate
differential expression of genes in different phenotypes,the top 200 informative genes of GSE10072 andGSE7670 selected by the MCBFS method were analyzedby two-sample t-test respectively [37]. The results havebeen displayed by normal t-score quantile plots,histograms of t-score and p-value distribution in Figs. 6and S1 (supplementary data). If the p-value of the geneis no more than 0.05, this gene will be considered a sig-nificant difference. The histogram of the t-score can givea sense of the density of the underlying distribution ofselected genes. Figures 6 and S1 illustrate these inform-ative genes are differentially expressed in the LUADsamples. These experimental results prove that MCBFShas a certain statistical significance and may be efficientin identifying differentially expressed genes.
Fig. 5 The sample distributions of four data sets are described by PCA. a PCA results of using all genes. b PCA results of using the top 100 genes
Fig. 6 The t-test results of genes. a The t-test results of the top 200 genes selected by MCBFS in GSE10072. b The t-test results of the top 200genes selected by MCBFS in GSE7670
Xu et al. BMC Genomics (2020) 21:650 Page 7 of 17

Application of McbfsNW on LUAD dataTo evaluate the performance of McbfsNW frameworkfor the identification of biomarkers and therapeutic tar-gets, we applied it to the LUAD data sets. In lung can-cer, there are two main pathological types: small celllung cancer (SCLC) and non-small cell lung cancer(NSCLC). NSCLC accounts for approximately 85% ofthe total number of lung cancer cases [38]. It is worthnoting that LUAD is one of the most important subtypesin NSCLC.
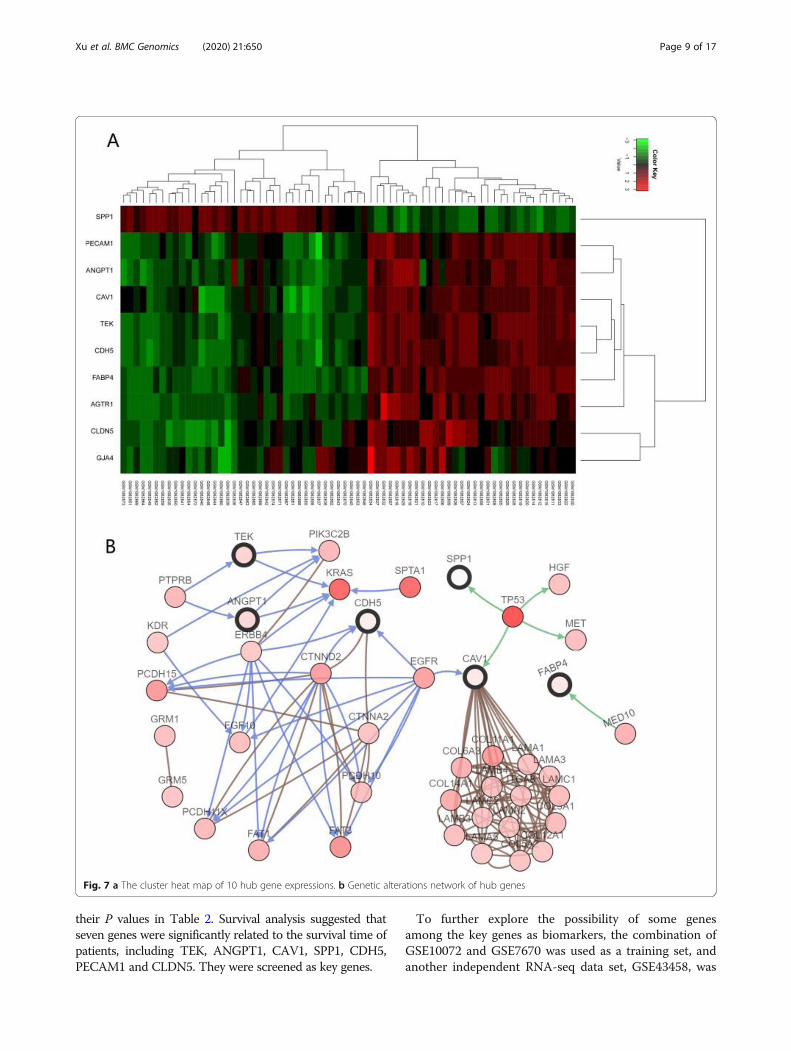
Identification of hub informative genesWe selected 200 informative genes by MCBFS in two in-dependent micro-array data sets, GSE10072 andGSE7670, respectively. There was an overlap betweentwo LUAD data sets: a total of 130 shared informativegenes. As shown in Figure S2, the overlapping areas in-dicate shared informative genes. The complex protein-protein interaction network formed by proteins encodedthrough shared informative genes is shown in Figure S3,after eliminating disconnected nodes. Ten hub inform-ative genes were screened by the network recognitionensemble algorithm, including PECAM1, CDH5, CAV1,CLDN5, SPP1, AGTR1, ANGPT1, FABP4, TEK andGJA4. They are shown in yellow in the network. Thereis mounting evidence that has reported these genes aresignificantly correlated with LUAD or NSCLC. The evi-dence of ten hub informative genes is tabulated inTable 2.Figure 7a displays the heat map of the 10 hub
genes on the GSE43458 data set. It was generated bythe R package “heatmap”. In the ten hub genes, ninelow-expression genes are related to LUAD, includingPECAM1, CDH5, CAV1, CLDN5, AGTR1, ANGPT1,FABP4, TEK and GJA4. In addition, there is a highlyexpressed gene SPP1. From the figure, we can seethat data samples from different classes have distinct-ive expression profiles that lead to a reasonable classi-fication performance.
Identification of major genetic changes leading to theinactivation of tumor suppressor genes and the activa-tion of oncogenes has the potential to elucidate molecu-lar mechanisms. We constructed a genetic alterationsnetwork with the 10 hub genes using the cBioPortal(http://www.cbioportal.org) [49]. Figure 7b demonstratesthe relationship between the 10 hub genes and the other50 most frequently altered neighbor genes (only CDH5,SPP1, CAV1, TEK, ANGPT1 and FABP4 have connec-tion with these 50 genes).From Fig. 7b, it is worth noting that (1) SPP1 and
CAV1 are relevant to TP53. TP53 is associated with avariety of human cancers and encodes a tumor suppres-sor protein. The inactivation of TP53 is one of the mostimportant genetic abnormalities in lung cancer. (2) Inaddition, CDH5 and CAV1 have a direct relationshipwith EGFR. EGFR is involved in the regulations of manyoncogenic functions, such as cell differentiation, neovas-cularization, invasion, metastasis and survival. It is worthnoting that almost all EGFR mutations occur in LUAD.(3) Beyond that, TEK and ANGPT1 are relevant toKRAS. The transforming protein of KRAS is implicatedin various malignancies, including LUAD and colorectalcarcinoma. The activating mutation of the KRAS onco-gene is the most common oncogenic alteration inLUAD, which occurs in approximately 25–40% of cases.The details of TP53, EGFR and KRAS can be found inthe lung cancer review paper [38, 50].More importantly, these results show that the ten hub
informative genes have possible biological relationshipswith the development and treatment of LUAD, whichcan provide novel insights for the pathogenesis of tumor.They can serve as candidate biomarkers or promisingtargets of LUAD.
Identification of biomarkersHub genes with P values no more than 0.05 were fur-ther screened as key genes in the survival analysis(Figure S4). We ordered 10 hub genes according to
Table 2 Summary of ten hub informative genes
Gene name Protein name P value Reference
TEK Angiopoietin-1 receptor 8.90e-10 [39]
ANGPT1 Angiopoietin-1 4.30e-05 [40]
CAV1 Caveolin-1 4.90e-05 [41]
SPP1 Osteopontin Secreted phosphoprotein 1 0.0015 [42]
CDH5 Cadherin-5 0.0034 [43]
PECAM1 Platelet endothelial cell adhesion molecule 0.0036 [44]
CLDN5 Claudin-5 0.045 [45]
AGTR1 Type-1 angiotensin II receptor 0.054 [46]
GJA4 Gap junction alpha-4 protein 0.13 [47]
FABP4 Fatty acid-binding protein 0.25 [48]
Xu et al. BMC Genomics (2020) 21:650 Page 8 of 17
their P values in Table 2. Survival analysis suggested thatseven genes were significantly related to the survival time ofpatients, including TEK, ANGPT1, CAV1, SPP1, CDH5,PECAM1 and CLDN5. They were screened as key genes.
To further explore the possibility of some genesamong the key genes as biomarkers, the combination ofGSE10072 and GSE7670 was used as a training set, andanother independent RNA-seq data set, GSE43458, was
Fig. 7 a The cluster heat map of 10 hub gene expressions. b Genetic alterations network of hub genes
Xu et al. BMC Genomics (2020) 21:650 Page 9 of 17
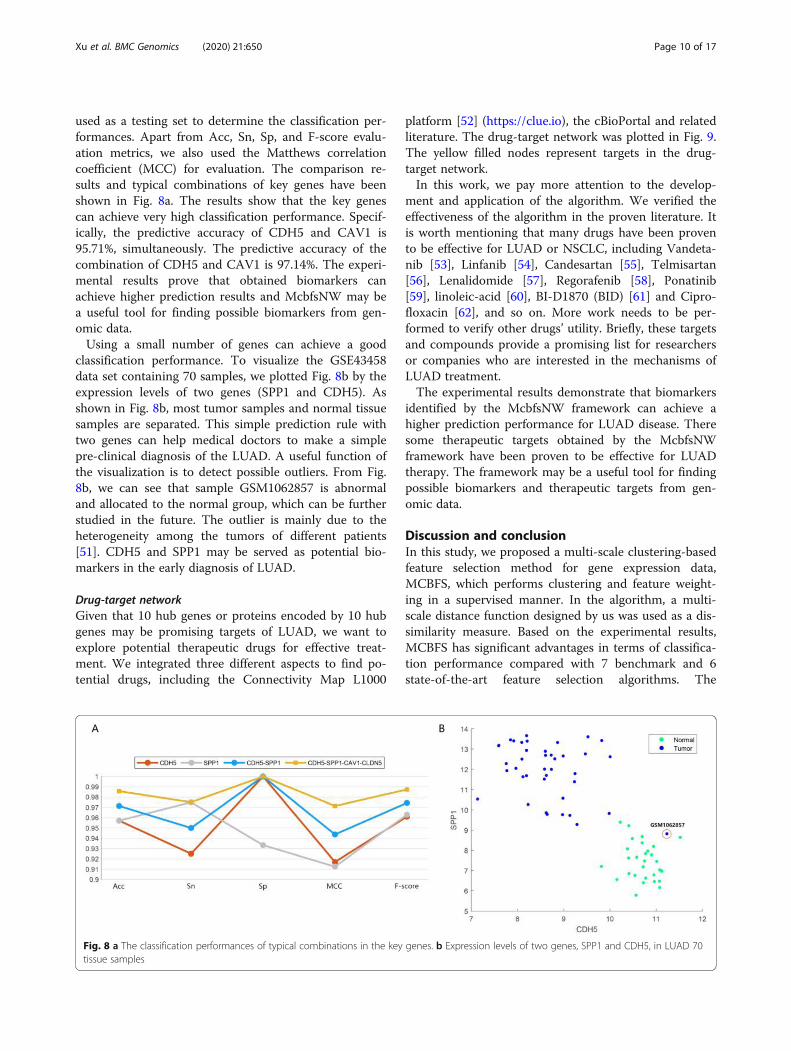
used as a testing set to determine the classification per-formances. Apart from Acc, Sn, Sp, and F-score evalu-ation metrics, we also used the Matthews correlationcoefficient (MCC) for evaluation. The comparison re-sults and typical combinations of key genes have beenshown in Fig. 8a. The results show that the key genescan achieve very high classification performance. Specif-ically, the predictive accuracy of CDH5 and CAV1 is95.71%, simultaneously. The predictive accuracy of thecombination of CDH5 and CAV1 is 97.14%. The experi-mental results prove that obtained biomarkers canachieve higher prediction results and McbfsNW may bea useful tool for finding possible biomarkers from gen-omic data.Using a small number of genes can achieve a good
classification performance. To visualize the GSE43458data set containing 70 samples, we plotted Fig. 8b by theexpression levels of two genes (SPP1 and CDH5). Asshown in Fig. 8b, most tumor samples and normal tissuesamples are separated. This simple prediction rule withtwo genes can help medical doctors to make a simplepre-clinical diagnosis of the LUAD. A useful function ofthe visualization is to detect possible outliers. From Fig.8b, we can see that sample GSM1062857 is abnormaland allocated to the normal group, which can be furtherstudied in the future. The outlier is mainly due to theheterogeneity among the tumors of different patients[51]. CDH5 and SPP1 may be served as potential bio-markers in the early diagnosis of LUAD.
Drug-target networkGiven that 10 hub genes or proteins encoded by 10 hubgenes may be promising targets of LUAD, we want toexplore potential therapeutic drugs for effective treat-ment. We integrated three different aspects to find po-tential drugs, including the Connectivity Map L1000
platform [52] (https://clue.io), the cBioPortal and relatedliterature. The drug-target network was plotted in Fig. 9.The yellow filled nodes represent targets in the drug-target network.In this work, we pay more attention to the develop-
ment and application of the algorithm. We verified theeffectiveness of the algorithm in the proven literature. Itis worth mentioning that many drugs have been provento be effective for LUAD or NSCLC, including Vandeta-nib [53], Linfanib [54], Candesartan [55], Telmisartan[56], Lenalidomide [57], Regorafenib [58], Ponatinib[59], linoleic-acid [60], BI-D1870 (BID) [61] and Cipro-floxacin [62], and so on. More work needs to be per-formed to verify other drugs’ utility. Briefly, these targetsand compounds provide a promising list for researchersor companies who are interested in the mechanisms ofLUAD treatment.The experimental results demonstrate that biomarkers
identified by the McbfsNW framework can achieve ahigher prediction performance for LUAD disease. Theresome therapeutic targets obtained by the McbfsNWframework have been proven to be effective for LUADtherapy. The framework may be a useful tool for findingpossible biomarkers and therapeutic targets from gen-omic data.
Discussion and conclusionIn this study, we proposed a multi-scale clustering-basedfeature selection method for gene expression data,MCBFS, which performs clustering and feature weight-ing in a supervised manner. In the algorithm, a multi-scale distance function designed by us was used as a dis-similarity measure. Based on the experimental results,MCBFS has significant advantages in terms of classifica-tion performance compared with 7 benchmark and 6state-of-the-art feature selection algorithms. The
Fig. 8 a The classification performances of typical combinations in the key genes. b Expression levels of two genes, SPP1 and CDH5, in LUAD 70tissue samples
Xu et al. BMC Genomics (2020) 21:650 Page 10 of 17

visualization results and the statistical test show thatMCBFS can capture informative genes among tumor pop-ulations or cell populations, which can improve the inter-pretability and visualization and of tumor gene expressiondata or single-cell data. The reasons for the effective per-formance of MCBFS are as follows: multi-scale distancefunction dissimilarity measure improves the performanceof the algorithm; the adaptive distance changes at each it-eration, which is suitable for learning the optimal weightof genes in the process of non-parametric clustering; fur-thermore, for a new data set, MCBFS does not require anyparameter to be tuned manually.Given that biomarkers should have higher specificity
and sensitivity, we developed a general frameworknamed McbfsNW, which uses gene expression and pro-tein interaction data to identify biomarkers and thera-peutic targets. The mixing mechanism of McbfsNWtakes advantage of filter, network and wrapper. First,candidate informative genes were selected from the ori-ginal gene sets by MCBFS. Then, biomarkers and thera-peutic targets were further identified by the networkrecognition ensemble algorithm and a more accuratewrapper with exhaustive best subset search. To evaluatethe performance of McbfsNW, we applied it to LUADdata sets. The experimental results showed that betterprediction results can be achieved by identified bio-markers. Many drugs in the drug-target network weresupported by published literature.The MCBFS algorithm and McbfsNW framework are
scalable and can also be applied to other genomic datafor dimension reduction, identification of differentiallyexpressed genes, sample classification or identification of
biomarkers and therapeutic targets. Although MCBFSand McbfsNW have good performances for gene expres-sion data, there are some limitations in this work.MCBFS is a method based on multi-scale, which may betime consuming. For the partial results of McbfsNW,due to the limitations of laboratory conditions, we canonly verify them in the previous literature. If the labora-tory conditions permit, we would very much like to fur-ther validate relevant findings in our later works. Thevisualization result of GSE43458 data set based on theexpression levels of two genes can discover the outlierthat does not satisfy the prediction rule. The outlier ismainly due to heterogeneity among the tumors of differ-ent patients, and the mutations of the abnormal patientare almost different from other patients in the foundercells of the tumor. We could further focus on and studythese abnormal patients in the future.It is conceivable that the same principles and methods
can be applied to other types of genomic data, for example,DNA methylation data or copy number variation data,which play important roles in tumorigenesis. It could evenbe possible to integrate all these data into a unified modelto better identify robust biomarkers and therapeutic targets.We believe that this work provides a refreshing view on theidentification of biomarkers and therapeutic targets by fea-ture selection and network analysis.
MethodsIn this paper, a novel feature selection method namedMCBFS is proposed, which simultaneously performsmodel learning and feature selection for high-dimensiondata. The details of MCBFS are presented in Fig. 10a
Fig. 9 The integrative drug-target network
Xu et al. BMC Genomics (2020) 21:650 Page 11 of 17

and b. In addition, we develop a general frameworknamed McbfsNW to identify robust biomarkers andtherapeutic targets for diagnosis and therapy of diseases,which incorporates feature selection with network ana-lysis into pattern recognition in the biological process.The workflow of McbfsNW is shown in Fig. 10.
Feature selection (MCBFS)Gene expression data set X ∈ Rs ∗ p is comprised of s sam-ples. Each sample is represented by a row vector Xj ∈ R
p,and labeled by yj ∈ Y, Y = {1, 2,…, c}, where j = 1, 2, …, s.MCBFS (Fig. 10a, b) is a supervised learning method. c
classes are taken as c known clusters, so the i th clustercenter vi = (vi1, vi2,…, vip) can be calculated as follows:
vik ¼P
x jϵcixjk
cij j ð1Þ
where i = 1, 2, …, c − 1, c; k = 1, 2, …, p − 1, p; j = 1, 2, …,
|ci| − 1, ∣ ci∣; ∣ci∣ represents the number of samples incluster ci.It is necessary to determine a better dissimilarity
measure before clustering because different measuresmay affect the results of clustering. Chen et al. pre-sented a KBCGS algorithm based on the Gaussiankernel measure and improved the classification per-formance on cancer gene expression data [63]. Wanget al. presented a SIMLR framework for analysis andvisualization of single-cell data, which greatly en-hanced clustering performance and interpretability viamulti-kernel learning [36]. In the default implementa-tion of MCBFS, we need to calculate the dissimilaritybetween expression values of gene and cluster center.Thus, to obtain a better dissimilarity measure, onepossible method is to adjust the velocity of decrementin the range of distance between two values. In thiswork, multi-scale distance function with different pa-rameters is designed to calculate the dissimilarity be-tween the k th gene expression value of the j th
Fig. 10 The flowchart of McbfsNW. a The workflow of the MCBFS algorithm. b The iterative process of the MCBFS algorithm. c The networkanalysis and wrapper of McbfsNW
Xu et al. BMC Genomics (2020) 21:650 Page 12 of 17

sample and the k th dimension expression value ofthe i th center. The n th distance function takes thefollowing form:
dn xjk ; vik� � ¼ 1 − e − γn xjk − vikð Þ2 ð2Þ
where n = 1, 2, …, m; where m is the number of dis-tance functions; the parameters γn can be calculatedas follows:
γn ¼σn � unð Þmax þ unð Þmin
� �2
;un
¼ un1; un2;…; unp� �
;unk ¼ xkð Þmax − xkð Þmin ð3Þ
where set different σn can produce different distancefunctions and k = 1, 2, …, p. xk is a vector that consistsof the k th gene expression value of samples.In the process of clustering, we calculate individually
each gene through each distance function. The generaldissimilarity measure is obtained as sum of different dis-tance results between sample and cluster center. Thenthe sample xj and cluster centroid vi can be calculatedby multi-scale distance function as follows:
d xj; vi� � ¼Xm
n¼1
Xp
k¼1dn xjk ; vik� �h i
ð4Þ
In our method, we assume that the same gene hasthe same weight in all clusters (global adaptive dis-tance), taking classes as known clusters. Different dis-tance functions and genes are assigned differentweights. To select genes that are more related to can-cer and reduce the number of genes, we introducethe parameters Pn and Wk into the optimization func-tion. Based on the clustering method, the objective ofthe MCBFS method is obtained by minimizing thefollowing function:
J ¼Xmn¼1
Pn
Xci¼1
Xx j∈ci
Xpk¼1
Wkdn xjk ; vik� �" #
þ δXpk¼1
W 2k þ ρ
Xmn¼1
PnlogPn;
s:tWk∈ 0; 1½ �Xp
k¼1Wk ¼ 1
�;
Pn∈ 0; 1½ �Xm
n¼1Pn ¼ 1
�
ð5Þwhere c represents the number of categories; δ and ρare non-negative tuning parameters; Pn represents theimportance of the n th distance function for distin-guishing tissue samples; Wk denotes the k th gene’sability to distinguish tissue samples; vi = (vi1, vi2,…, vip)is the i th class center. The above optimization prob-lem needs to solve four variables: Pn, Wk, δ and ρ.P = (P1, P2,…, Pn,…, Pm) and W= (W1, W2,…, Wk, …,Wp) are the coefficients to be estimated by optimizingthe objective function (5), which represents the rela-tive importance for classification of different distancefunctions and different genes, respectively.
The objective function has three terms in eq. (5). Thefirst term in the formula enables us to obtain compactclusters. The second term represents the sum of thesquare of the gene weights. In the third term, the weightof the distance function is constrained to avoid selectinga single distance function. This regularization can im-prove the quality of clustering [36]. By combining threeterms and choosing δ and ρ properly, the minimumvalue of the objective function, and optimal weight valueof distance function and gene can be obtained.To optimize equation (5) with respect to Wk and Pn,
we can obtain the following Lagrange function withoutconstraint:
J Pn;Wk ; λ1; λ2ð Þ ¼Xmn¼1
Pn
Xci¼1
Xx j∈ci
Xpk¼1
Wkdn xjk ; vik� �" #
þ δXpk¼1
W 2k þ ρ
Xmn¼1
PnlogPn
þλ1Xpk¼1
Wk − 1
!þ λ2
Xmn¼1
Pn − 1
!
ð6Þ
where λ1 and λ2 are the Lagrangian coefficients.Using the Lagrange multiplier method, minimization
of equation (6) with respect to Wk and Pn, we obtainedthe following equations of variables:
Wk ¼ 1pþ 12δ
Ppk¼1
Pmn¼1PnAnk
p−Xmn¼1
PnAnk
" #; ð7Þ
To conveniently describe equation (7), where
Ank ¼Xci¼1
Xx j∈ci
dn xjk ; vik� � ð8Þ
In addition, we can obtain the equation of Pn:
Pn ¼exp −
1ρ
Xc
i¼1
Xx j∈ci
Xp
k¼1Wkdn xjk ; vik
� �− 1
� �Pm
n¼1 exp −1ρ
Xc
i¼1
Xx j∈ci
Xp
k¼1Wkdn xjk ; vik
� �− 1
� � ð9Þ
Therefore, we can update Wk and Pn using equations(7) and (9). The greater the weight of genes, the greaterthe ability to provide information. Thus, top-rankedgenes may be helpful for tumor classification. In equa-tion (5), the choices of δ and ρ are important in theMCBFS algorithm. The values of δ and ρ should havethe same order of magnitude as the first term when theyare chosen [64]. We compute δ iteratively as follows:
δ tð Þ ¼ α�Pm
n¼1Pt − 1ð Þn
Pci¼1
Px j∈ci
Ppk¼1W
t − 1ð Þk dn xjk ; vik
� �h iPp
k¼1 W t − 1ð Þk
2 ð10Þ
Similar to the derivation of equation (10), we can ob-tain ρ as follows:
Xu et al. BMC Genomics (2020) 21:650 Page 13 of 17

ρ tð Þ ¼ β�Pm
n¼1Pt − 1ð Þn
Pci¼1
Px j∈ci
Ppk¼1W
t − 1ð Þk dn xjk ; vik
� �h iPm
n¼1Pt − 1ð Þn logP t − 1ð Þ
n
ð11Þ
where α and β are non-negative tuning parameters.In the experiment, we initialized the weight of distance
functions and genes into uniform distribution vectors;i.e.
P ¼ 1m;1m;…;
1m
� �;W ¼ 1
p;1p;…;
1p
� �ð12Þ
where m is an adjustable parameter and denotes thenumber of distance functions. The different scale valuesmay influence the prediction performance. Wang et at[36]. proved that the clustering accuracy will increase asthe number of kernels increase. If the number of kernelsachieves a certain, the clustering accuracy will saturate.They set 55 different kernels and greatly enhancedclustering performance. In this work, we designedsome comparison experiments to find a suitable value.The results have been shown in Figure S5. To savetime and obtain better performance, m was set to 50.p denotes the number of genes. After repeated experi-ments, we took α = 0.5, β = 0.5. In the MCBFS algo-rithm, the maximum number of iterations was set to100. The details of the workflow and iterative processare shown in Fig. 10a and b.
Network analysis identified hub informative genesIn this work, we downloaded GSE10072 and GSE7670lung adenocarcinoma data sets from the Gene Expres-sion Omnibus (GEO) database. All genes of the two datasets were ranked by MCBFS, and 200 highly rankedgenes were retained as candidate shared informativegenes, respectively. Shared informative genes werescreened using Venn analysis from candidate genes. Toidentify possible hub informative genes from shared in-formative genes, the hub proteins were identified fromthe complex protein-protein interaction (PPI) networkformed by proteins encoded through shared informativegenes.The shared informative genes were uploaded in the
Search Tool for the Retrieval of Interacting Genesdatabase (STRING) (https://string-db.org) [65]. ThePPI network data were downloaded by setting theminimum required interaction score at 0.400 and vi-sualized by Cytoscape software. A plugin app Cyto-hubba [66] was used to provide aids for furtherscreening of hub informative genes in the Cytoscape.Some different methods have been proposed to screenthe key nodes in the network [20, 67]. The ensemblealgorithm has demonstrated its effectiveness and po-tential [68]. To obtain the best integrated effect, wedeveloped an ensemble algorithm that integrates 10
individual network recognition algorithms (includingDegree, Maximal Clique Centrality, MNC, Closeness,BottleNeck, EcCentricity, Radiality, EPC, Betweennessand Stress) [66] and obtains the weighted average.Finally, the top 10 genes were screened by the
above network recognition ensemble algorithm as hubinformative genes. They may be potential biomarkersand therapeutic targets for the precise treatment anddiagnosis of diseases. In the clinical environment, thismeans that the diagnosis and prognosis of the dis-eases are possible, and the eventual treatment of thedisease is clear.
Wrapper identify biomarkersBiomarkers should have higher sensitivity and specificity,be good for classification and have an important influ-ence on the development and occurrence of the diseasesat the same time. The Kaplan Meier plotter (www.kmplot.com) [69], an online database, was used to evalu-ate the prognostic value of 10 hub informative genes.Specifically, genes with logrank P value less than 0.05were screened out as key informative genes of tumor bysurvival analysis in hub informative genes.In this work, to obtain a better classifier, two popu-
lar classifiers were used to obtain the average classifi-cation error rate by performing 10-fold cross-validation on all data sets. Figure 1 demonstrates thatthe kNN classifier is potentially better for small geneset classification problems after feature selection. Toresearch the possibility of these genes as biomarkersof identifying the occurrence of tumors, the kNNclassifier was combined as a wrapper to identify theclassification capability of genes and simple genecombinations. We obtained a small number of key in-formative genes (no more than 10 genes) by survivalanalysis. Since the number of our key informativegenes set is small, exhaustive best subset search (ES)[70] was used as the feature search algorithm to finda small subset of genes that could ensure highly reli-able classification. The results were obtained by anew data set as an independent test set for correctingthe selection bias to obtain a more reasonable resultfor the proposed method and further explore the keyinformative genes. In the application process ofMcbfsNW framework, the combination of two datasets (GSE10072 and GSE7670) served as the trainingset, and the new data set (GSE43458) served as an in-dependent testing set. First, we classified the test setwith only one gene. Then, we repeat this process withall possible 2-gene combinations in the key inform-ative genes, and so on. The results shown that it ispossible to construct prediction rules from only a fewgenes, and the prediction error rate can be negligible.
Xu et al. BMC Genomics (2020) 21:650 Page 14 of 17

Supplementary informationSupplementary information accompanies this paper at https://doi.org/10.1186/s12864-020-07038-3.
Additional file 1 :Figure S1. (A). Normal t-score quantile plot ofGSE10072 data set. (B). Normal t-score quantile plot of GSE43458 data set.Figure S2. Venn diagram of informative genes from two data sets(GSE10072, GSE7670). Figure S3. The protein-protein interaction networkdiagram of shared informative genes. Figure S4. Survival analysis of 10hub genes. Figure S5. The relationship between Acc value andparameter m.
AbbreviationsMCBFS: Multi-scale supervised clustering-based feature selection;MCBFSnw: MCBFS algorithm with network recognition ensemble algorithmand feature selection wrapper; SDSPCA: Supervised discriminative sparsePCA; GAN: Generative adversarial networks; LUAD: Lung adenocarcinoma;NSCLC: Non-small cell lung cancer; SCLC: Small cell lung cancer;Kappa: Cohen’s Kappa coefficient; BID: BI-D1870; STRING: Search Tool for theRetrieval of Interacting Genes; ES: Exhaustive best subset search
AcknowledgementsWe thank the reviewers for their reading time and constructive comments.
Authors’ contributionsDX, YSZ conceived and designed the study. JLZ obtained and processed thedata. DX, HXX and YSZ performed the experiments and analyzed the results.DX, HXX wrote the manuscript. WC, RG and MD provided suggestions andsupervised the research. The authors read and approved the final version.
FundingYSZ was supported by the National Natural Science Foundation of Chinaunder Grant (No. 61877064, U1806202). RG was supported by the NationalNatural Science Foundation of China under Grant (No. U1806202 and61533011). MD thanked the Austrian Science Funds (FWF) for financialsupport (P 30031). The funding bodies played no role in the design of thestudy and collection of data, experiments, interpretation and analysis ofresults and in the writing of the manuscript.
Availability of data and materialsThe lung adenocarcinoma data sets (GSE10072, GSE7670 and GSE43458)analysed in the work can be available at the Gene Expression Omnibus(GEO) database (https://www.ncbi.nlm.nih.gov/geo/). The datasets of Table 1used can be available from the corresponding author on reasonable request.The seven benchmark feature selection algorithms can be available at thewebsite: http://featureselection.asu.edu/old/software.php. In terms of the sixstate-of-the-art supervised feature selection methods, the codes of SDSPCAand DKBCGS method can be obtained from the corresponding author of ref-erences; The ILFS and infFS methods can be available at: Giorgio (2020), Fea-ture Selection Library (https://www.mathworks.com/matlabcentral/fileexchange/56937-feature-selection-library); The SPEC method can be avail-able at the website: http://featureselection.asu.edu/old/software.php; The Su-pervised Multi-Cluster Feature Selection method can be available at: https://github.com/ZJULearning/MatlabFunc/tree/master/FeatureSelection.
Ethics approval and consent to participateNot applicable.
Consent for publicationNot applicable.
Competing interestsThe authors declare that they have no competing interests.
Author details1School of Mathematics and Statistics, Shandong University, Weihai 264209,China. 2School of Control Science and Engineering, Shandong University,Jinan 250061, China. 3Institute for Intelligent Production, Faculty forManagement, University of Applied Sciences Upper Austria, Steyr Campus,Steyr, Austria. 4College of Computer and Control Engineering, Nankai
University, Tianjin 300071, China. 5Department of Mechatronics andBiomedical Computer Science, UMIT, Hall in Tyrol, Austria.
Received: 18 March 2020 Accepted: 30 August 2020
References1. Li CY, Li HZ. Network-constrained regularization and variable selection for
analysis of genomic data. Bioinformatics. 2008;24(9):1175–82.2. Feng CM, Xu Y, Liu JX, Gao YL, Zheng CH. Supervised discriminative sparse
PCA for com-characteristic gene selection and tumor classification onmultiview biological data. In: IEEE transactions on neural networks andlearning systems; 2019.
3. Liu S, Xu C, Zhang Y, Liu J, Yu B, Liu X, et al. Feature selection of geneexpression data for cancer classification using double RBF-kernels. BMCBioinformatics. 2018;19:1–14.
4. Nie F, Yang S, Zhang R, Li X. A general framework for auto-weighted featureselection via global redundancy minimization. IEEE Trans Image Process.2018;28:2428–38.
5. Kong YC, Yu TW. A graph-embedded deep feedforward network for diseaseoutcome classification and feature selection using gene expression data.Bioinformatics. 2018;34(21):3727–37.
6. Roffo G, Melzi S, Cristani M. Infinite feature selection. In: IEEE InternationalConference on Computer Vision (ICCV); 2015. p. 4202–10.
7. Pashaei E, Pashaei E, Aydin N. Gene selection using hybrid binary black holealgorithm and modified binary particle swarm optimization. Genomics.2019;111(4):669–86.
8. Wang Y, Li X, Ruiz R. Weighted general group lasso for gene selection incancer classification. IEEE Transact Cybernet. 2019;49(8):2860–73.
9. Cai D, Zhang C, He X. Unsupervised feature selection for multi-cluster data.In: Knowledge discovery and data mining; 2010. p. 333–42.
10. Zhao Z, Liu H. Spectral feature selection for supervised and unsupervisedlearning. In: International conference on machine learning; 2007. p. 1151–7.
11. Hu YL, Hase T, Li HP, Prabhakar S, Kitano H, Ng SK, et al. A machine learningapproach for the identification of key markers involved in braindevelopment from single-cell transcriptomic data. BMC Genomics. 2016;17(13 Supplement):1025.
12. Lin C, Jain S, Kim H, Joseph ZB. Using neural networks for reducing thedimensions of single-cell rna-seq data. Nucleic Acids Res. 2017;45(17):e156.
13. Saeys Y, Inza I, Larrañaga P. A review of feature selection techniques inbioinformatics. Bioinformatics. 2007;23(19):2507–17.
14. Roffo G, Melzi S, Castellani U, Vinciarelli A. Infinite latent feature selection: aprobabilistic latent graph-based ranking approach. In: Internationalconference on computer vision; 2017. p. 1407–15.
15. Xiong M, Fang XZ, Zhao JY. Biomarker identification by feature wrappers.Genome Res. 2001;11(11):1878–87.
16. Moon M, Nakai K. Stable feature selection based on the ensemble L1-normsupport vector machine for biomarker discovery. BMC Genomics. 2016;17(Suppl 13):1026.
17. Yang Y, Huang N, Hao LN, Kong W. A clustering-based approach forefficient identification of microRNA combinatorial biomarkers. BMCGenomics. 2017;18(Suppl 2):210.
18. Rajamani D, Bhasin MK. Identification of key regulators of pancreatic cancerprogression through multidimensional systems-level analysis. Genome Med.2016;8(1):38.
19. Gan YX, Zheng SC, Baak JPA, Zhao SL, Zheng YF, Luo NN, et al. Predictionof the anti-inflammatory mechanisms of curcumin by module-basedprotein interaction network analysis. Acta Pharm Sin B. 2015;5(6):590–5.
20. Durand S, Killian T, Arnaud U, et al. A transcriptome-based protein networkthat identifies new therapeutic targets in colorectal cancer. BMC Genomics.2017;18(1):758.
21. Netzer M, Kugler KG, Müller AJL, Weinberger KM, Graber A, Baumgartner C,et al. A network-based feature selection approach to identify metabolicsignatures in disease. J Theor Biol. 2012;310:216–22.
22. Golub TR, Slonim DK, Tamayo P, Huard C, Gaasenbeek M, Mesirov JP, CollerH, Loh ML, Downing JR, Caligiuri MA, Bloomfield CD, Lander ES. Molecularclassification of cancer: class discovery and class prediction by geneexpression monitoring. Science (Washington D C). 1999;286(5439):531–7.
23. Shipp MA, Ross KN, Tamayo P, Weng AP, Kutok JL, Aguiar RCT, et al. Diffuselarge B-cell lymphoma outcome prediction by gene expression profilingand supervised machine learning. Nat Med. 2002;8(1):68–74.
Xu et al. BMC Genomics (2020) 21:650 Page 15 of 17

24. Boussioutas A, Li H, Liu J, Waring P, Lade S, Holloway AJ, et al. Distinctivepatterns of gene expression in premalignant gastric mucosa and gastriccancer. Cancer Res. 2003;63(10):2569–77.
25. Alon U, Barkai N, Notterman DA, Gish K, Ybarra S, Mack D, et al. Broadpatterns of gene expression revealed by clustering analysis of tumor andnormal colon tissues probed by oligonucleotide arrays. Proc Natl Acad Sci US A. 1999;96(12):6745–50.
26. Alizadeh AA, Eisen MB, Davis RE, Ma C, Lossos IS, Rosenwald A, et al. Distincttypes of diffuse large B-cell lymphoma identified by gene expressionprofiling. Nature. 2000;403(6769):503–11.
27. Khan J, Wei JS, Ringnér M, Saal LH, Ladanyl M, Westermann F, et al.Classification and diagnostic prediction of cancers using gene expressionprofiling and artificial neural networks. Nat Med. 2001;7(6):673–9.
28. Pomeroy SL, Tamayo P, Gaasenbeek M, Sturla SL, Angelo M, McLaughlin ME,et al. Prediction of central nervous system embryonal tumour outcomebased on gene expression. Nature. 2002;415(6870):436–42.
29. Bhattacharjee A, Richards WG, Staunton J, Li C, Monti S, Vasa P, et al.Classification of human Lung carcinomas by mRNA expression profilingreveals distinct adenocarcinoma subclasses. Proc Natl Acad Sci U S A. 2001;98(24):13790–5.
30. Pollen AA, Nowakowski TJ, Shuga J, Wang XH, Leyrat AA, Lui JH, et al. Low-coverage single-cell mRNA sequencing reveals cellular heterogeneity andactivated signaling pathways in developing cerebral cortex. Nat Biotechnol.2014;32(10):1053–8.
31. Usoskin D, Furlan A, Islam S, Abdo H, Lönnerberg P, Lou DH, et al. Unbiasedclassification of sensory neuron types by large-scale single-cell RNAsequencing. Nat Neurosci. 2015;18(1):145–53.
32. Fleiss JL, Cohen J. The equivalence of weighted kappa and the Intraclasscorrelation coefficient as measures of reliability. Educ Psychol Meas. 1973;33(3):613–9.
33. Xu D, Xu H, Zhang Y, Chen W, Gao R. Protein-protein interactions predictionbased on graph energy and protein sequence information. Molecules. 2020;25:1841.
34. Zhao Z, Morstatter F, Sharma S, Alelyani S, Anand A, Liu H. AdvancingFeature Selection Research. ASU Feature Selection Repository Arizona StateUniversity. 2010;1–28.
35. Dudoit S, Fridlyand J, Speed TP. Comparison of discrimination methods forthe classification of tumors using gene expression data. J Am Stat Assoc.2002;97(457):77–87.
36. Wang B, Zhu JJ, Pierson E, Ramazzotti D, Batzoglou S. Visualization andanalysis of single-cell rna-seq data by kernel-based similarity learning. NatMethods. 2017;14(4):414–6.
37. Huber W, Von Heydebreck A, Sültmann H, Poustka A, Vingron M. Variancestabilization applied to microarray data calibration and to the quantificationof differential expression. Bioinformatics. 2002;18(SUPPL.1):S96–104.
38. Ramalingam SS, Owonikoko TK, Khuri FR. Lung cancer: new biological insightsand recent therapeutic advances. CA Cancer J Clin. 2011;61(2):91–112.
39. Mroz RM, Korniluk M, Panek B, Ossolinska M, Chyczewska E. sVEGF R1 andTie-2 levels during chemotherapy of Lung cancer patients. Adv Exp MedBiol. 2013;756:313–9.
40. Jin Y, Wang J, Ye XD, Su YT, Yu GJ, Yang Q, et al. Identification ofGlcNAcylated alpha-1-antichymotrypsin as an early biomarker in humannon-small-cell lung cancer by quantitative proteomic analysis with twolectins. Br J Cancer. 2016;114(5):532–44.
41. Ho CC, Huang PH, Huang HY, Chen YH, Yang PC, Hsu SM. Up-regulatedCaveolin-1 accentuates the metastasis capability of Lungadenocarcinoma by inducing Filopodia formation. Am J Pathol. 2002;161(5):1647–56.
42. Yan CH, Lv MG, Li H, Song XM, Yan F, Cao S, et al. Osteopontin is a novelprognostic biomarker in early-stage non-small cell lung cancer after surgicalresection. J Cancer Res Clin Oncol. 2015;141(8):1371–8.
43. Hung MS, Chen IC, Lung JH, Lin PY, Tsai YH, et al. Epidermal growth factorreceptor mutation enhances expression of Cadherin-5 in Lung cancer cells.PLoS One. 2016;11(6):e0158395.
44. Kuang BH, Wen XZ, Ding Y, Peng RQ, Cai PQ, Zhang MQ, et al. Theprognostic value of platelet endothelial cell adhesion molecule-1 in non-small-cell lung cancer patients. Med Oncol. 2013;30(2):536.
45. Ma SC, Li Q, Peng JY, Zhouwen JL, Diao JF, Niu JX, et al. Claudin-5 regulatesblood-brain barrier permeability by modifying brain microvascularendothelial cell proliferation, migration, and adhesion to prevent lungcancer metastasis. CNS Neurosci Ther. 2017;23(12):947–60.
46. Menon J, Soto-Pantoja DR, Callahan MF, Cline JM, Ferrario CM, Tallant EA,et al. Angiotensin-(1-7) inhibits growth of human lung adenocarcinomaxenografts in nude mice through a reduction in cyclooxygenase-2. CancerRes. 2007;67(6):2809–15.
47. Morel S, Burnier L, Roatti A, Chassot A, Roth I, Sutter E, et al. Unexpectedrole for the human Cx37 C1019T polymorphism in tumour cell proliferation.Carcinogenesis. 2010;31(11):1922–31.
48. Tang ZY, Shen Q, Xie H, Zhou XY, Li J, Feng J, et al. Elevated expression ofFABP3 and FABP4 cooperatively correlates with poor prognosis in non-smallcell lung cancer (NSCLC). Oncotarget. 2016;7(29):46253–62.
49. Cerami E, Gao JJ, Dogrusoz U, et al. The cBio cancer genomics portal: anopen platform for exploring multidimensional cancer genomics data.Cancer Discov. 2012;2(5):401–4.
50. Cooper WA, Lam DCL, O’Toole SA, Minna JD. Molecular biology of lungcancer. J Thorac Dis. 2013;5(4):S479–90.
51. Vogelstein B, Papadopoulos N, Velculescu VE, Zhou S, Diaz LA, Kinzler KW.Cancer genome landscapes. Science. 2013;339(6127):1546–58.
52. Subramanian A, Narayan R, Corsello SM, Peck DD, Natoli TE, Lu X, et al. Anext generation connectivity map: L1000 platform and the first 1,000,000profiles. Cell. 2017;171:1437–52.
53. Yoh K, Seto T, Satouchi M, et al. Vandetanib in patients with previouslytreated RET-rearranged advanced non-small-cell lung cancer (LURET):an open-label, multicentre phase 2 trial. Lancet Respir Med. 2016;5(1):42–50.
54. Tan EH, Goss GD, Salgia R, Besse B, Gandara DR, Hanna NH, et al. Phase 2trial of Linifanib (ABT-869) in patients with advanced non-small cell Lungcancer. J Thorac Oncol. 2011;6(8):1418–25.
55. Rasheduzzaman M, Park SY. Antihypertensive drug-candesartan attenuatesTRAIL resistance in human lung cancer via AMPK-mediated inhibition ofautophagy flux. Exp Cell Res. 2018;368:126–35.
56. Li J, Chen L, Yu P, Liu B, Zhu Q, Yang Y. Telmisartan exerts anti-tumoreffects by activating peroxisome proliferator-activated receptor-γ in humanLung adenocarcinoma A549 cells. Molecules. 2014;19(3):2862–76.
57. Kim K, An S, Cha HJ, Choi YM, Choi SJ, An IS, et al. Lenalidomide inducesapoptosis and alters gene expression in non-small cell lung cancer cells.Oncol Lett. 2012;5:588–92.
58. Hu X, Wen WL, Yan ZZ, Ling CM, Ling LY, Zhang C. The anti-tumor effect ofregorafenib in lung squamous cell carcinoma in vitro. Biochem Biophys ResCommun. 2018;503:1123–9.
59. Ren M, Hong M, Liu G, Wang H, Patel V, Biddinger P, et al. Novel FGFRinhibitor ponatinib suppresses the growth of non-small cell lung cancercells overexpressing FGFR1. Oncol Rep. 2013;29:2181–90.
60. Torre ADL, Debiton E, Durand D, Chardigny JM, Berdeaux O, Loreau O,et al. Conjugated linoleic acid isomers and their conjugated derivativesinhibit growth of human cancer cell lines. Anticancer Res. 2005;25(6B):3943–9.
61. Abdulrahman N, Jaballah M, Poomakkoth N, Riaz S, Abdelaziz S, Issa A, et al.Inhibition of p90 ribosomal S6 kinase attenuates cell migration andproliferation of the human lung adenocarcinoma through phospho-GSK-3βand osteopontin. Mol Cell Biochem. 2016;418(1–2):21–9.
62. Phiboonchaiyanan PP, Kiratipaiboon C, Chanvorachote P. Ciprofloxacinmediates cancer stem cell phenotypes in lung cancer cells throughcaveolin-1-dependent mechanism. Chem Biol Interact. 2016;250:1–11.
63. Chen H, Zhang Y, Gutman I. A kernel-based clustering method for geneselection with gene expression data. J Biomed Inform. 2016;62(C):12–20.
64. Frigui H, Nasraoui O. Simultaneous clustering and attribute discrimination.IEEE Int Conference Fuzzy Syst. 2000;1:158–63.
65. Szklarczyk D, Franceschini A, Wyder S, Forslund K, Heller D, et al. STRINGv10: protein-protein interaction networks, integrated over the tree of life.Nucleic Acids Res. 2015;43(Database issue):D447–52.
66. Chin CH, Chen SH, Wu HH, Ho CW, Ko MT, Lin CY, et al. CytoHubba:identifying hub objects and sub-networks from complex interactome. BMCSyst Biol. 2014;8(4 Supplement):S11.
67. Nguyen TP, Scotti M, Morine MJ, Priami C. Model-based clustering revealsvitamin D dependent multicentrality hubs in a network of vitamin-relatedproteins. BMC Syst Biol. 2011;5(1):195.
68. Nanni L, Brahnam S, Lumini A. Combining multiple approaches for genemicroarray classification. Bioinformatics. 2012;28(8):1151–7.
69. Győrffy B, Surowiak P, Budczies J, Lánczky A. Online survival analysissoftware to assess the prognostic value of biomarkers using Transcriptomicdata in non-small-cell Lung cancer. PLoS One. 2013;8(12):e82241.
Xu et al. BMC Genomics (2020) 21:650 Page 16 of 17

70. Somorjai RL, Dolenko B, Baumgartner R. Class prediction and discoveryusing gene microarray and proteomics mass spectroscopy data: curses,caveats, cautions. Bioinformatics. 2003;19(12):1484–91.
Publisher’s NoteSpringer Nature remains neutral with regard to jurisdictional claims inpublished maps and institutional affiliations.
Xu et al. BMC Genomics (2020) 21:650 Page 17 of 17


![Using Feature Clustering for GP-Based Feature Construction ...xuebing/Papers/... · feature selection methods [6,10,13,24]. However, applying feature clustering to FC is still limited.](https://static.fdocuments.in/doc/165x107/5f41d0d40cf80c01af18e155/using-feature-clustering-for-gp-based-feature-construction-xuebingpapers.jpg)