MULTI-RADIO INTERFERENCE DIAGNOSIS IN UNLICENSED BANDS ...baid/papers/baid-ms-thesis.pdf ·...
42
MULTI-RADIO INTERFERENCE DIAGNOSIS IN UNLICENSED BANDS USING PASSIVE MONITORING BY AKASH BAID A thesis submitted to the Graduate School—New Brunswick Rutgers, The State University of New Jersey in partial fulfillment of the requirements for the degree of Master of Science Graduate Program in Electrical and Computer Engineering Written under the direction of Professor Dipankar Raychaudhuri and approved by New Brunswick, New Jersey May, 2011
Transcript of MULTI-RADIO INTERFERENCE DIAGNOSIS IN UNLICENSED BANDS ...baid/papers/baid-ms-thesis.pdf ·...

MULTI-RADIO INTERFERENCE DIAGNOSIS INUNLICENSED BANDS USING PASSIVE
MONITORING
BY AKASH BAID
A thesis submitted to the
Graduate School—New Brunswick
Rutgers, The State University of New Jersey
in partial fulfillment of the requirements
for the degree of
Master of Science
Graduate Program in Electrical and Computer Engineering
Written under the direction of
Professor Dipankar Raychaudhuri
and approved by
New Brunswick, New Jersey
May, 2011

c© 2011
Akash Baid
ALL RIGHTS RESERVED

ABSTRACT OF THE THESIS
Multi-Radio Interference Diagnosis in Unlicensed Bands
using Passive Monitoring
by Akash Baid
Thesis Director: Professor Dipankar Raychaudhuri
The increasing density and data rate of unlicensed band wireless devices has led to
significant inter- and intra-radio interference problems. Multiple competing standards
such as the IEEE 802.11b/g, Bluetooth and ZigBee, all of which operate in the 2.4 GHz
ISM band, can interfere with each other when used in typical indoor environments, po-
tentially causing significant performance degradation. This thesis aims to characterize
different types of heterogeneous interference in the 2.4 GHz unlicensed band and develop
techniques to diagnose interference related problems using passive monitoring. The first
part of the thesis presents detailed experimental results (using the ORBIT radio grid
testbed) to quantify the effects of such interference in representative small office and
home (SOHO) environment. In particular, different topologies, traffic loads and num-
ber of interfering devices are emulated to show the impact of multi-radio interference
and to characterize each kind of interference. The second part of the thesis describes
a cross-layer, multi-radio interference diagnosis framework (called “spectrum MRI”)
which aims to classify and diagnose multi-radio interference problems using heuristic
and model-based methods. Validation experiments show that broad auto-classification
of multi-radio interference in terms of congestion, slow links, inter AP interference and
Bluetooth interference is possible using heuristic algorithms and passive monitoring.
ii

Acknowledgements
I would like to take this opportunity to thank my advisor Prof. Dipankar Raychaudhuri
for his guidance, motivation and constant encouragement. I have always been inspired
by the simplicity of his logic, his acute engineering insights and the relevance of his
advice - technical and otherwise.
I am also indebted to the people with whom I worked in due course of this thesis -
Dr. Sanjoy Paul for sharing his broad range of ideas around this project, Ivan Seskar
for answering endless series of questions on ORBIT and for his practical insights, and
Dr. Suhas Mathur, for his constant guidance on this project and on the art of academic
research.
Also, I would like to thank Prof. Roy Yates and Prof. Narayan Mandayam for being
a part of my thesis committee and for their invaluable comments and insights.
iii

Table of Contents
Abstract . . . . . . . . . . . . . . . . . . . . . . . . . . . . . . . . . . . . . . . . ii
Acknowledgements . . . . . . . . . . . . . . . . . . . . . . . . . . . . . . . . . iii
List of Tables . . . . . . . . . . . . . . . . . . . . . . . . . . . . . . . . . . . . . vi
List of Figures . . . . . . . . . . . . . . . . . . . . . . . . . . . . . . . . . . . . vii
1. Introduction . . . . . . . . . . . . . . . . . . . . . . . . . . . . . . . . . . . 1
1.1. Related Work . . . . . . . . . . . . . . . . . . . . . . . . . . . . . . . . . 4
2. Multi-radio Interference Experiments . . . . . . . . . . . . . . . . . . . 7
2.1. Emulation Methodology . . . . . . . . . . . . . . . . . . . . . . . . . . . 7
2.2. Slow Co-channel link in 802.11 . . . . . . . . . . . . . . . . . . . . . . . 8
2.3. 802.11-Bluetooth Interference . . . . . . . . . . . . . . . . . . . . . . . . 9
2.3.1. Co-located 802.11b/g and Bluetooth . . . . . . . . . . . . . . . . 10
2.3.2. Effect of Autorate on Bluetooth-802.11 Interference . . . . . . . 11
2.4. Complex Multi-radio Scenarios . . . . . . . . . . . . . . . . . . . . . . . 12
3. Network Measurement Techniques . . . . . . . . . . . . . . . . . . . . . 15
3.1. 802.11 Promiscuous Mode Sniffing . . . . . . . . . . . . . . . . . . . . . 15
3.2. Bluetooth Spectrum Sensing . . . . . . . . . . . . . . . . . . . . . . . . . 16
3.3. Bluetooth Sniffing . . . . . . . . . . . . . . . . . . . . . . . . . . . . . . 17
3.4. ZigBee Channel Sniffing . . . . . . . . . . . . . . . . . . . . . . . . . . . 17
3.5. Spectrum Analyzer . . . . . . . . . . . . . . . . . . . . . . . . . . . . . . 18
3.6. Device-side Logs . . . . . . . . . . . . . . . . . . . . . . . . . . . . . . . 18
3.7. Wired-end Information . . . . . . . . . . . . . . . . . . . . . . . . . . . . 18
iv

4. Interference Diagnosis Framework . . . . . . . . . . . . . . . . . . . . . 21
5. Detailed Case Study: Interference to HD Video Streams . . . . . . . 23
5.1. Topology Setup . . . . . . . . . . . . . . . . . . . . . . . . . . . . . . . . 23
5.2. Classification Parameters . . . . . . . . . . . . . . . . . . . . . . . . . . 25
Bluetooth Interference: . . . . . . . . . . . . . . . . . . . . . . . 26
Channel Congestion: . . . . . . . . . . . . . . . . . . . . . . . . 27
Slow link on Same AP: . . . . . . . . . . . . . . . . . . . . . . . 27
Slow link on Other AP: . . . . . . . . . . . . . . . . . . . . . . . 27
5.3. Threshold Selection . . . . . . . . . . . . . . . . . . . . . . . . . . . . . . 27
5.4. Experimental Verification . . . . . . . . . . . . . . . . . . . . . . . . . . 28
6. Conclusions and Future Work . . . . . . . . . . . . . . . . . . . . . . . . 30
References . . . . . . . . . . . . . . . . . . . . . . . . . . . . . . . . . . . . . . . 32
v

List of Tables
2.1. Throughput (Mbps) of Link 1 & Link 2 under different rate options for
Link 2. Link 1 rate is set to maximum. . . . . . . . . . . . . . . . . . . . 9
2.2. 802.11b & 802.11g Throughput (Mbps) with a Bluetooth interferer lo-
cated at varying distance (meters) . . . . . . . . . . . . . . . . . . . . . 10
2.3. Link Throughput (Mbps) with and without autorate enabled for different
topologies . . . . . . . . . . . . . . . . . . . . . . . . . . . . . . . . . . . 12
2.4. Traffic configurations of the links used in the topology of figure 2.4 . . . 13
5.1. Diagnosis Output for the proposed heuristic algorithm over different in-
terference cases . . . . . . . . . . . . . . . . . . . . . . . . . . . . . . . . 29
vi

List of Figures
1.1. 802.11, Bluetooth and ZigBee Channels in the 2.4 GHz ISM Band . . . 2
2.1. Topology showing the effect of a co-channel slow link . . . . . . . . . . . 9
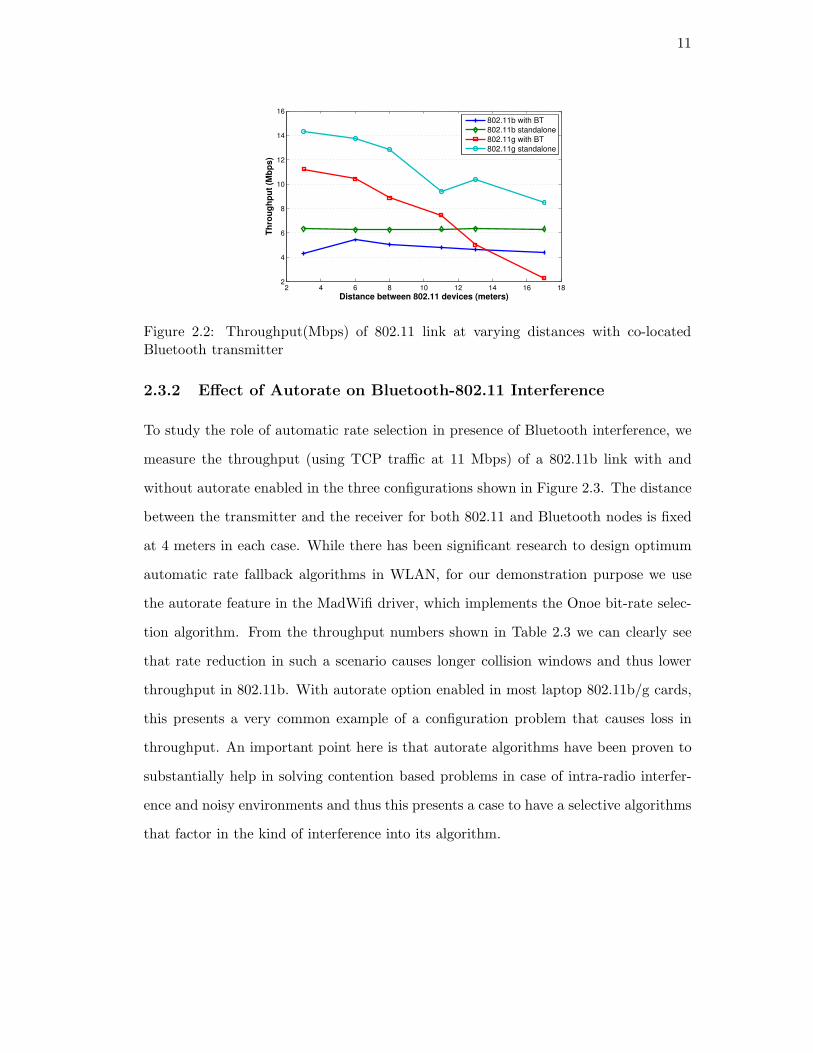
2.2. Throughput(Mbps) of 802.11 link at varying distances with co-located
Bluetooth transmitter . . . . . . . . . . . . . . . . . . . . . . . . . . . . 11
2.3. Topology for autorate effect . . . . . . . . . . . . . . . . . . . . . . . . . 12
2.4. Multi-radio Interference Topology . . . . . . . . . . . . . . . . . . . . . . 13
2.5. Throughput of links in topology of Figure 2.4 as percentage of their
nominal value for cases when: (a) Only 802.11 links are active, (b) All
802.11b and Bluetooth links are active, (c) All 802.11g and Bluetooth
links are active, (d) All links are active, . . . . . . . . . . . . . . . . . . 14
3.1. Bluetooth piconet discovery using narrow band spectrum sensing (a) 8
Mhz wide spectrogram showing Bluetooth packets, (b) Piconet Classifi-
cation based on start times of Bluetooth packets (Best viewed in color) 19
3.2. Bluetooth sniffer table snapshot . . . . . . . . . . . . . . . . . . . . . . . 20
4.1. System Level Model . . . . . . . . . . . . . . . . . . . . . . . . . . . . . 22
4.2. The OML data collection framework showing the server-client architecture 22
5.1. Representative topology for Video Streaming Example . . . . . . . . . . 24
5.2. Interference Diagnosis Regions on the Occupancy vs Retransmission plot.
(*Requires Secondary Test) . . . . . . . . . . . . . . . . . . . . . . . . . 26
5.3. Snapshot of the link table showing main columns . . . . . . . . . . . . . 26
vii

1
Chapter 1
Introduction
The evolution of wireless protocols and access technologies for the unlicensed bands has
led to the rapid proliferation of consumer grade wireless devices that require little or no
spectrum configuration by end users. The choice of the unlicensed band for tetherless
personal communications devices such as laptops, wireless speakers, sensors & alarm
systems, short range communications between devices such as cell phone and computers,
and even, media systems such as set top boxes, is a direct consequence of the the ease
with which such a system can be deployed and used, by virtue of being in the unlicensed
regime. This has meant that over the last few years, the density of wireless devices
utilizing spectrum in the unlicensed bands has constantly gone up. Unfortunately,
this has also meant that the unlicensed band is becoming interference limited, and in
many cases, overcrowded with multiple radio access technologies competing for common
spectrum. For example, the popular 802.11 standard, the Bluetooth standard and the
ZigBee standard, all share the same chunk of radio spectrum, as shown in Figure 1.1,
in addition to emitters such as cordless phones and leaking microwave ovens, also in
the same band.
Each of these wireless access technologies have their own specifications for mod-
ulation, power control, rate control, networking and mediating access to the wireless
medium with other terminals of the same type, but not across different standards. For
example the 802.11 standard specifies a set of rules in the form of a MAC protocol
that allows two or more terminals on the same 22 MHz channel to share the spec-
trum efficiently. However, the Bluetooth and ZigBee standards do not understand the
802.11 protocol and vice-versa. Furthermore, one radio-access standard consists of ra-
dios that are tuned to transmit and receive units of data that only correspond to that

2
802.11b/g
Bluetooth
ZigBee
24802402
2480
2400Mhz
2440
24622412 2437
22 MHz
2405
2485Mhz
Figure 1.1: 802.11, Bluetooth and ZigBee Channels in the 2.4 GHz ISM Band
standard, and therefore, a transmission by a different type of radio is treated simply
as noise, when it is actually interference from another family of radios. The current
generation of radio standards does not incorporate the intelligence of coordination be-
tween different radio access families. In this work we show that depending on physical
topology, transmit power levels and traffic requirements, this can lead to moderate to
severe performance degradation in the QoS of one or more links. We refer to this as
the multi-radio interference problem.
In the debate over how best the spectrum resource should be utilized, the greatest
fear among skeptics of the unlicensed spectrum model is that spectrum, if left com-
pletely unregulated, can quickly lead to a tragedy of the commons [1]. This is not a
completely theoretical concern - such a tragedy has in fact occurred in the past, for
instance in the case of citizens band radio [2], where lack of regulation led to such severe
overcrowding that poor user experience caused users to be driven away from using the
band completely.
In this thesis we study the multi-radio interference problem in detail, focusing on the
performance loss under various scenarios, and we put forward the claim that in many
cases it is possible to diagnose interference problems in a multi-radio environment by
passive observation of symptoms that interference problems produce. Our goal is to
build a system using one or more monitors that collect data passively and aggregate
their observations that are fed into a database for subsequent processing by suitable

3
algorithms for problem diagnosis. If a control channel is available between this system
and the wireless terminals causing interference, the system can then close the loop by
sending control signals recommending an alternate configuration, for example a recom-
mendation to move to a different channel. Even without such a control channel, the
system might recommend an alternate configuration to a human in the loop. We believe
that a low-cost system that can monitor transmissions on multiple radio interfaces can
dramatically improve performance degradations arising out of multi-radio co-existence
and lead to much more efficient use of the spectrum.
Let us take a few concrete examples to illustrate the multi-radio interference prob-
lem.
• Example 1: Consider a VoIP application running over an 802.11 link with the last
hop to the user on a Bluetooth link. In this example, a Bluetooth transmitter
and 802.11 receiver are co-located. As we will show, even with the lower power
of Bluetooth signals, a co-located Bluetooth transmitter and 802.11 receiver can
lead to considerable performance degradation.
• Example 2: A high speed 802.11g streaming video running in a home or office
environment can create a shortage of channel availability and starve any other
device on the same spectrum, such as a ZigBee sensor for a fire or theft alarm.
• Example 3: A high speed video link for a set-top box to a television and a set
of Bluetooth speakers in the same vicinity will create mutual interference for one
another and due to the streaming nature of both applications, an easily perceptible
drop in quality will result.
• Example 4: An 802.11b link set to operate at a rate of 1 Mbps can severely starve
a nearby high-speed 802.11g link that is set to operate on 54 Mbps. This is a
backward compatibility problem. The 802.11b link effectively hogs the channel
for a large fraction of time, thereby slowing down the 802.11g link.
The nature of unlicensed spectrum makes the problem of interference even more
complicated because terminals contending for the same spectrum in a given geographic

4
area may belong to disparate entities. For instance, the performance of an 802.11 link
in one home may be adversely affected by the use of a cordless phone or a leaking
microwave oven in the neighboring home. This type of loss in throughput due to
interference is very common and is usually realized only when there is a complete loss
in connectivity, even though there is always a substantial loss in performance in most
cases. Monitoring the spectrum for tell-tale signs of interference-related problems in
wireless networks can help mitigate poorly configured services and to pinpoint the cause
of a poorly performing link.
The rest of this thesis is organized as follows. In chapter 1.1, we present prior work
in the area of interference mitigation and wireless network diagnosis that is relevant
to our work. In chapter 2 we present results from our experiments on characterizing
the effect of interference in multi-radio scenarios. Chapter 3 highlights some of the
tools used for collecting diagnostic information from various sources. Following this, in
chapter 4 we outline our interference diagnosis framework which can help in interference
classification and diagnosis in a complex heterogeneous radio environment. A specific
example of problem diagnosis using the proposed framework is given for an indoor
802.11g video link. Chapter 6 concludes the thesis and provides an overview of the
future direction of our research.
1.1 Related Work
As radio standards in the unlicensed bands have evolved over the years, a number of
studies on inter-radio interference have been conducted typically following an approach
that seeks to characterize one standard versus another. These studies have most often
involved interference modeling and analysis of the impact of one type of radio on the
other. For example [3] and [4] analyze the impact of Bluetooth on 802.11b/g and sug-
gest some techniques to improve co-existence between these two standards. Similarly,
[5] provides a detailed analytical model for interactions between ZigBee and 802.11 and
between ZigBee and Bluetooth. In a complex multi-radio environment having simulta-
neous interactions of several competing wireless standards, the approach of modeling
and analysis becomes much harder. The IEEE 802.15.2 standard [6] addresses some

5
of the issues in this regard and presents recommended practice for the co-existence of
WLAN and WPAN devices.
A related area of research focuses on the more fundamental causes and effects of
interference on PHY and MAC layer performances with the aim of designing techniques
to overcome the problems involved (for example [7]). However, the 802.11 standard has
received most of the attention in such studies, and the prime focus has overwhelmingly
been on 802.11 wireless links being the victim of the interference. Stranne et al. [8]
goes a step further to derive closed-form throughput expressions by creating an analyt-
ical framework for interactions between heterogeneous radios using such physical layer
models. More recently, there has also been work on designing techniques to facilitate
co-existence between multiple radios using the idea of a common control channel [9].
Our work, in contrast to previous studies of heterogeneous radio interference, focuses on
the diagnosis aspect. Within a complex radio environment, there are various practical
issues that limit the use of shared spectrum knowledge under the present standards.
As a way out, we study the question of whether it is possible to infer and classify in-
terference problems with the aim of building a working system for diagnosis of such
problems in an environment with multiple heterogeneous radios.
The area of network diagnosis and management is closely related to this work and
we provide a brief overview of some of the relevant studies in this field below. Due to the
wide-scale popularity and infrastructural importance of the 802.11 WLAN standard,
most work in this domain, apart from those on wired networks, has focussed on solving
issues within this standard. Cheng et al. [10], for example, provides details on an
elaborate cross-layer trace collection and analysis system to address issues ranging from
configuration problems to interference related problems. Similar work in [11] focuses
on the framework for detecting a wide range of faults and security issues typical to
the WLAN systems. Some other approaches for 802.11 WLAN diagnosis include a
structural and behavioral model based system [12], RF energy duration based fault
detection [13], distributed physical layer anomaly detection [14], and fault diagnosis
using signal error rate and RSSI parameters [15]. With the pronounced emphasis on
802.11 systems as the point of focus, the research in [10] - [15] clumps all types of

6
interference and noise as seen by an 802.11 receiver into a single category, choosing not
to differentiate between transmissions of other radios and background noise. It is easy to
see that an important reason behind this 802.11-centric view of the unlicensed spectrum
has been the motivation for makers of management software for WLAN systems to
improve the performance of their systems.
The goal of our system on the other hand, is to improve performance of the en-
tire system, consisting of multiple heterogeneous radios. Research issues for this work
therefore also include the development of tools and a framework to collect multi-radio,
cross-layer information about the radio environment and techniques for intelligent clas-
sification and diagnosis algorithms based on such a framework.

7
Chapter 2
Multi-radio Interference Experiments
In this section, we present examples of some typical multi-radio interference problems
in home networks. We classify the interference measurement experiments into the
following categories:
• Intra 802.11 Interference
• Inter-radio Interference
– 802.11-Bluetooth Interference
– 802.11-ZigBee Interference
– Bluetooth-ZigBee Interference
• Complex Multi-radio Interference
2.1 Emulation Methodology
All the experimental evaluations described in this section were conducted on the ORBIT
testbed [16] which consists of 400 small form-factor PCs placed in a 20 x 20 regular grid
with an inter-node separation of about 3ft, spanning a total area of 3600 sq. ft. Each of
these nodes is equipped with two IEEE 802.11a/b/g wireless interfaces, with 40 nodes
also equipped with Bluetooth dongles and 30 nodes also equipped with 802.15.4 TelosB
motes [17]. The Iperf tool [18] is used for throughput measurement of TCP and UDP
data in both 802.11 and Bluetooth radios and a customized ZigBee traffic generator
built on the TinyOS platform [19] is used for performance measurement on the ZigBee
nodes. The throughput measurements in each of the experiments described in this
section were averaged over ten or more readings spread in time and location inside the

8
ORBIT grid to remove random effects of environmental changes and device specific
variance. Unless otherwise mentioned, all the 802.11 nodes in our experiments were
operated on Channel 1 which did not have any external interference as confirmed by
a spectrum analyzer. In the following sections, we identify and quantitatively analyze
some commonly occurring multi-radio interference problems:
2.2 Slow Co-channel link in 802.11
When two or more 802.11 b/g links co-exist on the same channel, the slower links have
a higher channel occupancy time causing the high rate links to undergo more backoffs
and thus suffer a large drop in throughput. To quantify this effect, three cases of single
link interference are emulated as shown in Figure 2.1. In all the three cases, the data-
rate of Link 1 is set to the highest (11 Mbps for 802.11b and 54 Mbps for 802.11g) while
the rate of Link 2 is changed in steps. All links in this experiment carry saturation
TCP traffic with a buffer size of 8 KBytes. From Table 2.1, we observe a substantial
drop in Link 1 throughput when the interfering link (Link 2) data-rate drop downs
from 11 Mbps to 1 Mbps in all the three cases. This drop is about 32% in case of
802.11b-802.11b interference and 53% in case of 802.11g-802.11g interference.
The throughput loss increases with the number of interfering slow links and decreases
with the distance between the interfering transmitter and the high rate receiver. From
a practical point of view, this scenario is very common and presents itself in a number of
ways. For example if an old laptop with a slow 1 Mbps 802.11b radio link is connected
to an AP, all the other clients connected to that AP suffer a loss in throughput because
of it. Variation in bit-rate due to signal quality variations across a home because of
propagation through walls, etc. is quite typical. In such a case, the link with reduced
rate affects other clients even though they might have a good signal reception from the
AP. The rate reduction can also be brought about if there is some sort of local interfer-
ence (like Bluetooth) near one of the links. The affected link then starts an automatic
rate reduction scheme which in turn can cause the throughput of all the other links on
the same channel to go down.

9
Link 1
Link 2
802.11b - 802.11b
~ 6 meters
Link 1
Link 2
802.11g - 802.11g
~ 6 meters
Link 1
Link 2
~ 6 meters
802.11b Node 802.11g Node
802.11g - 802.11b
Figure 2.1: Topology showing the effect of a co-channel slow link
Configuration Link 1 Mbps 2 Mbps 5.5 Mbps 11 Mbps
11b-11bLink 1 1.19 1.79 2.89 3.76Link 2 0.63 1.14 1.92 2.87
11g-11bLink 1 17.60 20.60 22.32 25.10Link 2 0.36 0.50 0.78 1.74
11g-11gLink 1 9.67 12.72 14.70 17.91Link 2 0.62 1.34 2.42 4.66
Table 2.1: Throughput (Mbps) of Link 1 & Link 2 under different rate options for Link2. Link 1 rate is set to maximum.
2.3 802.11-Bluetooth Interference
One of the most common type of and widely studied inter-radio system is the 802.11-
Bluetooth pair. With an increasing use of devices of both standards, co-existence of
these devices is a major concern in the unlicensed 2.4GHz band. The most severe
802.11-Bluetooth interference is observed in the co-located case where the Bluetooth
and 802.11b/g radios are located on the same physical device such as smart phones and
laptops. At such distances, a transmission on any of the roughly 22x1 Mhz Bluetooth
channels that overlap with a 802.11 channel will cause a packet error for the 802.11
transmission. Though there has been an introduction of Adaptive Frequency Hopping
(AFH) starting from Bluetooth version 1.2, the percentage of devices utilizing this
technique is very small [20]. Also a potential interference issue that the AFH introduces
is the intra-Bluetooth interaction problem. In the presence of 802.11b/g networks
in multiple channels, the AFH algorithm forces the Bluetooth to hop within a small
number of frequencies, thus creating a high probability of collision if there are multiple
number of such AFH Bluetooth devices. To illustrate all these interference related

10
Distance 802.11b 802.11g
0.25m 5.64 10.20
3m 5.79 11.05
6m 5.82 11.80
8m 6.15 13.90
11m 6.13 13.76
13m 6.35 13.69
16m 6.27 14.87
19m 6.42 15.40
No interference 6.61 17.65
Table 2.2: 802.11b & 802.11g Throughput (Mbps) with a Bluetooth interferer locatedat varying distance (meters)
problems, the following two simple case experiments were performed:
2.3.1 Co-located 802.11b/g and Bluetooth
Dual radio nodes were used to emulate a co-located case in which the distance between
the 802.11b/g and Bluetooth radios is about 25cm and the transmit power is 18dBm
and 4dBm(Class 2 device) for 802.11b/g and Bluetooth respectively. To create a worst-
case interference scenario in this topology, the Bluetooth transmitter and the co-located
802.11b/g receiver operate concurrently. The 802.11 transmitter is located at varying
distance which varies the received power levels at the receiver. TCP traffic is pushed
through the 802.11b/g link with the rate set at 11 Mbps for 802.11b and 24 Mbps for
802.11g. The Bluetooth interferer carries a 512 Kbps UDP load with a datagram size of
1 KB. From the observed throughput numbers in Figure 2.2 we can see that the impact
of Bluetooth is more on 802.11g link with a steeper drop with distance. And when the
802.11g transmitter and receiver are separated by a distance of 15 meters or more, the
24 Mbps connection cuts down to less than 3 Mbps.
Apart from the co-located case, in order to quantify the effect of distance between
Bluetooth interferer and 802.11 receiver, the same experiment is repeated with varying
this distance and the throughput for 802.11b and 802.11g cases are reported in Table 2.2.
As before, we can see an almost constant drop for 802.11b and a gradual deterioration
in the case of 802.11g but the percentage drop goes down as the Bluetooth interferer
moves away from the 802.11b/g transmitter.
11
2 4 6 8 10 12 14 16 182
4
6
8
10
12
14
16
Distance between 802.11 devices (meters)
Th
rou
gh
pu
t (M
bp
s)
802.11b with BT
802.11b standalone
802.11g with BT
802.11g standalone
Figure 2.2: Throughput(Mbps) of 802.11 link at varying distances with co-locatedBluetooth transmitter
2.3.2 Effect of Autorate on Bluetooth-802.11 Interference
To study the role of automatic rate selection in presence of Bluetooth interference, we
measure the throughput (using TCP traffic at 11 Mbps) of a 802.11b link with and
without autorate enabled in the three configurations shown in Figure 2.3. The distance
between the transmitter and the receiver for both 802.11 and Bluetooth nodes is fixed
at 4 meters in each case. While there has been significant research to design optimum
automatic rate fallback algorithms in WLAN, for our demonstration purpose we use
the autorate feature in the MadWifi driver, which implements the Onoe bit-rate selec-
tion algorithm. From the throughput numbers shown in Table 2.3 we can clearly see
that rate reduction in such a scenario causes longer collision windows and thus lower
throughput in 802.11b. With autorate option enabled in most laptop 802.11b/g cards,
this presents a very common example of a configuration problem that causes loss in
throughput. An important point here is that autorate algorithms have been proven to
substantially help in solving contention based problems in case of intra-radio interfer-
ence and noisy environments and thus this presents a case to have a selective algorithms
that factor in the kind of interference into its algorithm.

12
11b 11b
BT1
11b
BT1 BT2
802.11b Client
802.11b AP
Bluetooth Node
Figure 2.3: Topology for autorate effect
TopologyRate set at 11Mbps Using Autorate Option11b BT1 BT2 11b BT1 BT2
Only 11b 5.40 – – 4.92 – –
11b & BT1 3.95 0.25 – 1.92 0.25 –
11b, BT1 & BT2 2.81 0.24 0.63 0.42 0.30 0.69
Table 2.3: Link Throughput (Mbps) with and without autorate enabled for differenttopologies
2.4 Complex Multi-radio Scenarios
As a final example of multi-radio interference, we emulate a complex small office environ-
ment consisting of multiple 802.11b, 802.11g, Bluetooth and ZigBee radios distributed
throughout the premises. As is shown in Figure 2.4 an 802.11b node on channel 1 forms
the main access point to which four clients are connected. Two additional 802.11g links
on channels 1 and 11 respectively support point to point devices such as set-top box to
TV or projector links. A fifth 802.11b link on channel 11 emulates point to point file
transfer in this scenario. As is common in commercial premises, there are neighboring
APs within the interference region of the environment, here depicted by an 802.11g
AP on the top-left with two clients. Some three Bluetooth constant bit rate trans-
missions add to the radio clutter with one of the Bluetooth nodes being co-located
with the 802.11g node. A number of low cost ZigBee sensors form a part of the secu-
rity/temperature control infrastructure and relay periodic readings to a central ZigBee
concentrator in this scenario.
The aim of this experiment, consistent with the rest of the section, is to get raw
throughput numbers in order to quantify the interference problems. The topology,
number and density of the radios is typical of an office environment where a myriad of
complex interferences gives rise to loss in throughput of the entire system. In some cases
the the loss in throughput is not inherently visible due to the low data rate applications

13
Links Traffic Configuration
B1, B2, B3, B4Saturation TCP connection with
11 Mbps data rate
B5Constant Bit Rate UDP connection
with 10 Mbps offered load
G1, G2, G3, G4Saturation TCP connection with
54 Mbps data rate
BT1, BT2, BT3Constant Bit Rate UDP Connection
with 512 Kbps offered load
All ZigBee NodesPeriodic 50 Byte data transfer
every 100ms at 250 Kbps
Table 2.4: Traffic configurations of the links used in the topology of figure 2.4
Channel 1
Channel 1
Channel 11
Channel 1
B1
B2
B4
B5
G1G2
G3
BT2
Channel 11
B3
BT1
BT3
G4
802.11g Node
Bluetooth Node
Zigbee Node
802.11b Node
Figure 2.4: Multi-radio Interference Topology
that these links generally support but with a gradual increase in both the density of
radio devices as well as the data rate of the applications, there is a potential problem
that exists in such a scenario. Here we do not emulate the actual traffic characteristics
but to gather info on the throughput loss, we form a saturation load on the links with
the exact configurations listed in Table 2.4
Figures 2.5(a) - 2.5(d) show some of the throughput results from the multi-radio
experiments under different configurations where the nominal throughput is defined as
the no-interference throughput for each link. While the numbers do not completely
reflect practical scenarios since the traffic load is different for different applications,

14
(a) (b)
(c) (d)
Figure 2.5: Throughput of links in topology of Figure 2.4 as percentage of their nominalvalue for cases when: (a) Only 802.11 links are active, (b) All 802.11b and Bluetoothlinks are active, (c) All 802.11g and Bluetooth links are active, (d) All links are active,
yet it shows a comprehensive picture of the kind of inter-radio interference that we
are addressing in this thesis. For example Figure 2.5(d) clearly suggests that when
all the links are active a drop of more than 50% is observed for most links in the
network. For this case, we also measured the percentage of packets received by the
ZigBee concentrator from all the other nodes in a 5 second interval (all ZigBee nodes
are configured to channel 11 of the 802.15.4 standard in this experiment). This number
goes down from 83% in case of no-interference case to less than 2% when all the other
links are turned on, suggesting a very important problem of high importance fire, theft
or sensory information being obstructed by traffic on other radios. The aim of our
research is to identify such cases of interference related throughput reduction and to
diagnose the exact cause as far as possible.

15
Chapter 3
Network Measurement Techniques
Given the complex heterogeneous radio environment, as described in the previous sec-
tions, the effect of inter-radio and intra-radio interference is manifested at both the
physical/data link layers as well as the transport/application layers. As such, the
study of such interferences requires a multi-radio, cross-layer measurement system that
employs different data collection techniques suited to different kinds of radios. The
experiments described in the previous section used some active methods to measure
link quality and throughput which involved test transmissions and direct throughput
logging on each client. While these active measurements comprehensively show the ef-
fect of interferences, it is not a pragmatic method to diagnose and classify interferences
in a complex environment since we do not have access to run client side applications in
most real cases. As such we employ some passive methods for non-intrusive sniffing of
ongoing transmissions.
3.1 802.11 Promiscuous Mode Sniffing
Wireless monitoring of 802.11b/g networks has been employed for both network usage
collection [21] as well as security and threat management [22] as it provides an inexpen-
sive and scalable insight to the network traffic. For our purpose of fault diagnosis, it
provides a myriad of helpful information, for example, RSSI, logical topology, network
traffic, number of retransmissions, network load, etc. A modified application of the
tcpdump tool [23] using the packet capture library (libpcap) is used in our application
that logs the headers of all packets received on the wireless interface card of the node
and ports this data to the central database. The customized application also appends
client and server timestamps denoting the time of reception of a packet by the monitor

16
and the central server respectively. Using these fields, multiple logs of the same packet
received by different monitor nodes are purged, keeping only the timestamp and RSSI
from these repeat traces. Channel selection and dwell time on a channel while sniffing
multiple channels is controlled by the central server.
3.2 Bluetooth Spectrum Sensing
The Bluetooth protocol incorporates a frequency hopping scheme using a sequence
of 1 Mhz wide channels selected from the 79 channels in the ISM band. The dwell
time for each hop is 1, 3 or 5 time slots, with each time slot being 625 µs in length.
This inherent hopping mechanism makes Bluetooth monitoring a much harder problem
compared to 802.11 or ZigBee standards. Improving upon the approach in [24], we use
limited bandwidth spectrum snapshots to ascertain the number of Bluetooth piconet
that are active in the surrounding and estimate the amount of traffic by counting the
number of packets received.
Figure 3.1(a) shows the spectrogram observed from a narrow band energy capture
using the GNURadio software with the USRP hardware platform. Due to hardware lim-
itations, we can only observe a maximum of 8 Mhz of the spectrum which corresponds
to 8 Bluetooth channels, in this case from 2433 Mhz to 2441 Mhz. The Bluetooth pack-
ets can be isolated from this spectrogram using time and frequency limited windows to
identify high energy regions. Once we have all the Bluetooth packets, a time binning ap-
proach, as specified in [24], is used to find the number of piconets. The basic algorithm
of this approach involves putting the start time of each of the detected packets into 25
µs bins and then using the fact that transmissions from the same piconet are always
integral number of time slots apart. Figure 3.1(b) shows the automatic classification of
the packets into packets from different piconets by this algorithm. A similar approach
of using the USRP platform to sense the environment was used in [25], however the
main aim in that work was to localize the transmitters compared to identifying the type
of transmission in our case.
While it is not a detailed view of the Bluetooth transmissions, this method provides

17
a simple estimate of the number of active Bluetooth transmissions and their traffic load
(based on the number of packets observed). This information when used along with
802.11 packet sniffers, for example, can give a clue to a Bluetooth-802.11 interference
problem if a simultaneous transmission followed by MAC retransmissions is observed.
A more evolved algorithm than the one described here can be developed to automate
the process of real-time spectrum sensing and Bluetooth detection with time synchro-
nization with other kind of sensors. As part of our continuing research, we are working
on algorithms to adaptively change the energy thresholds and frequency band of op-
eration, and also on creating a time synchronized real time system that can feed the
Bluetooth packet sensing data to a central database.
3.3 Bluetooth Sniffing
While the spectrum sensing method provides an estimate of the number of Bluetooth
piconets and the timing information on packet transmissions, a much more detailed
view can be gathered by sniffing on an active piconet and following the frequency hops.
Once the sniffing device is connected to the Bluetooth Master, it can tabulate the
frequency of operation, timestamps, packet type, underlying baseband packet header
and more information on all the transmissions on that piconet. A simple snapshot of
the Bluetooth sniffer is given in Figure 3.2. Commercial products like the FTS4BT
Bluetooth Protocol Analyzer & Packet Sniffer [26] enable more advanced features of
real-time capturing, filtering and piconet selection.
3.4 ZigBee Channel Sniffing
We employ a passive frequency-hopping listener application built upon the TinyOS
platform to log and aggregate the packets received over the ZigBee interface. These are
then ported to the OML server keeping the tables in sync with other monitors.

18
3.5 Spectrum Analyzer
A low-cost coarse resolution spectrum analyzer like [27] can provide a means to detect
other sources of RF emissions, for example that from cordless phones, leaking microwave
ovens, etc. Since these devices are commonplace in a SOHO environment, we employ
this additional monitor to diagnose such interference problems.
3.6 Device-side Logs
Interference being a receiver side phenomenon, can be best detected from the user
device involved in the transmission. As such, we have an optional device side logging
mechanism which records the changes in throughput, delay and received power.
3.7 Wired-end Information
With some prior knowledge about the devices, the wired-side logs from the AP, for
example, can provide information about the logical topology of the system which helps
the diagnosis algorithm to narrow down on the interfering links.

19
Time Scale ( 0 −− 62.5ms )
Fre
qu
en
cy S
cale
( 2
433 −
− 2
441 M
hz)
(a)
ScanningRegion
Piconet 1
Piconet 2
Piconet 3
30x625us
20x625us
26.24x625us
Time Scale ( 0 – 62.5ms )
Fre
qu
en
cy
Sc
ale
( 2
43
3–
24
41
MH
z)
(b)
Figure 3.1: Bluetooth piconet discovery using narrow band spectrum sensing (a) 8 Mhzwide spectrogram showing Bluetooth packets, (b) Piconet Classification based on starttimes of Bluetooth packets (Best viewed in color)

20
Figure 3.2: Bluetooth sniffer table snapshot

21
Chapter 4
Interference Diagnosis Framework
We now present a framework for multi-radio interference diagnosis that uses the inter-
ference monitoring and data logging capabilities described in the previous section for
intelligent interference detection and resolution. As shown in Figure 4.1, our framework
consists of a central database that collects trace data using a network of time synchro-
nized spectrum sensors that can detect 802.11, Bluetooth and ZigBee transmissions.
Each of these sensors or network monitoring tools looks at the network from a different
viewpoint, thus each of them add an extra dimension for the diagnosis algorithm to
work with. These sensors use the Orbit Measurement Library (OML) [28] and the Or-
bit Management Framework (OMF) systems for collecting network traces. The OML
framework consists of a client application that runs on each of the sensor node and a
central server which is responsible for collection and storage of the measurements in
a database. As shown in Figure 4.2, the diagnosis inference engine parses the central
database and uses a decision tree based algorithm to make appropriate diagnosis on the
cause of interference. There is a feedback path from the inference engine to the sensors
so that measurement parameters can be changed dynamically.
While some of the techniques mentioned under network discovery tools in Figure
4.1 have been explained earlier, some others use common existing techniques to gather
data. The issue of time synchronization between these varied sensors becomes impor-
tant if the type of analysis required for diagnosis is correlative in nature. The use of
OML, as mentioned earlier also addresses this problem by maintaining a fine grained
time stamp of each packet received on each monitor. The core component of this data
driven approach is the inference algorithm engine which is designed based on proto-
col heuristics and representative problem scenarios. For example, while performing

22
Network Discovery and
Diagnosis Tools
802.11 Probing in Monitor mode
Bluetooth Spectrum sensing
Zigbee Channel Sniffing
Low-cost Spectrum Analyzer
Device side performance logs
Network Layer Info from Wired -end
Diagnosis Inference
Algorithm
Performance
Improvement &
QoS Support
Emulation Data from
Representative
Problem Scenarios
Collection &Integration
ServerFramework
Control
Channel
Direct
Configuration
Change
Use of Common
Channel for
Control
Figure 4.1: System Level Model
Monitor 1
Monitor 2
Node 1
Node 2
Home/office
Diagnosis
Inference
Algorithm
Figure 4.2: The OML data collection framework showing the server-client architecture
Bluetooth-802.11 interference experiments, we observed that the percentage of packets
requiring retransmission increases substantially. Thus a possible heuristic rule to detect
and diagnose such a case might involve the retransmission percentage as a parameter.
This case of Bluetooth and other kinds of interferences to an 802.11 link is explained in
greater detail in the next section and the main focus of the ongoing work is development
of further diagnosis algorithms and identifying further parameters that can be used for
that. The right way to use the diagnosis is yet another topic of research spanning the
entire spectrum from user notification to common control plane architecture with fine
grained control over time, frequency, rate and power of multiple transmissions.

23
Chapter 5
Detailed Case Study: Interference to HD Video Streams
In this section, we provide a detailed example of how the proposed data-centric ap-
proach can be used to diagnose possible interference related problems in a specific real
world application - that of high-rate video transmissions. Wireless HD streaming is
increasingly gaining popularity in home settings as a natural next-step after an explo-
sion in HDTV penetration. Due to its high bandwidth and low delay requirements,
this presents itself as an important problem in the SOHO environment that our work
is focussed on. As mentioned in the previous sections, many different kinds of RF in-
terference can affect the quality of the video stream, ranging from unnoticeable rate
adjustments to largely unviewable video quality. As an initial case study, we define
four possible interferences to a video stream in a home environment and subsequently
elaborate on the key parameters that can be used to characterize and diagnose each of
these problems.
5.1 Topology Setup
To emulate a small home network, we ran our experiments based on the representative
topology shown in Figure 5.1. In Figure 5.1, link 1 is the main video stream, with
the distance between the transmitter and receiver being close to 10 meters. The VLC
application [29] is used to emulate the video link and a CBR 15 Mbps video at a
transmit rate of 54 Mbps is used as the stream. The location of the 802.11 monitor
operating in the promiscuous mode, as explained in Section 3, is indicated by the blue
star. It is important to note here that it is a basic premise in our problem that we only
have access to this passive monitor and any diagnostic algorithm that we device cannot
assume the knowledge of the either the transmitter or the receiver side information on

24
Link 6
Link 5
Link 4
Link 3
Link 2
Video Link 1
Own AP
NeighborAP 2
Bluetooth
NeighborAP 1
Figure 5.1: Representative topology for Video Streaming Example
any of the links.
Links 2 and 3 represent other user devices connected to the same AP and both of
them generate approximately 1 Mbps TCP data traffic at 54 Mbps link speed with con-
stant inter-departure time and Pareto-distributed packet length with mean 450 bytes.
Links 4 and 5 are independent AP-client pairs that emulate neighboring links outside
the home, quite commonly found in such a setting. Unless mentioned otherwise, these
links carry 2 Mbps data traffic at 54 Mbps each with the same characteristics as that
of links 2 and 3. There is also a Bluetooth pair close to the video receiver which carries
a CBR UDP 512 Kbps on-off data stream. In the rest of this section, we work with the
following four types of interferences to the video link under a reasonable assumption
that only one of the four problems dominate the video quality at a given point of time:
• Bluetooth Interference
• Slow link on the same AP
• Slow link on a neighboring AP
• Channel Congestion
While this presents a small selection from the wide variety of interferers present in a
home environment, all of the listed problems are very common for home networks and

25
in this case study, we show how a passive observation of the various link transmissions
can be used to filter out signatures that can be ascribed to each of these problems.
5.2 Classification Parameters
As the case with any other kind of diagnostics, in order to say ‘Problem X occurred
due to reason Y’, we need to first identify the parameters that show the ‘symptoms’ of
the problem and then classify the multi-dimensional parameter space with appropriate
hyperplanes. After tackling a difficult problem of selecting the thresholds that define
these hyperplanes, what we finally get is a segmented multi-dimensional space and the
location of a link/network state in this space should indicate, with a sufficiently high
probability, that either the link if healthy or has problem X1, or problem X2, and so
on.
Based on these fundamentals, we found that the two most important parameters
for the problems mentioned above are the per-link percentage-retransmission and the
occupancy. Here we define link occupancy as the fraction of time for which this link
was transmitting data and includes both primary and the retransmissions. These two
and other parameters are aggregated using a variable width sliding window to avoid
unrelated artifacts and reduce storage requirement. Unless otherwise mentioned, we
use a 200ms averaging window with no overlap and as can be seen from a snapshot of
the database in Figure 5.3, each row shows the average parameter value after averaging
over all the packets received during the interval. The classification of the four problem
scenarios, primarily based on these two parameters are shown in Figure 5.2 which is
explained later in this section. To have an idea of the parameter values for a healthy
case of nominal traffic on all interfering 802.11 links and no Bluetooth interference, the
baseline operating point is marked in the figure which shows 2.8% retransmissions and
link occupancy ratio of about 0.24. In addition to this baseline traffic, the effect of each
of the four problems show up in slightly different ways as follows:

26
LinkOccupancy
Baseline
Bluetooth
CongestionSlow Link*
Slow LinkSame AP*
% Retransmissionrb 5rb
pb
3rb
0.5pb
0.3pb
1.20pb
Figure 5.2: Interference Diagnosis Regions on the Occupancy vs Retransmission plot.(*Requires Secondary Test)
Defines Window for
averaging: can be changed to
vary step size and overlap
Average Rate of all
packets in window
Fraction of time this link
occupied the channel =
(Rate*Total_bits)/window_time
Average Signal Strength
of source and destination
Each link gets a separate table
Figure 5.3: Snapshot of the link table showing main columns
Bluetooth Interference:
Since Bluetooth only corrupts some packets at random, the transmitter still sees the
channel as occupied as before and tries to counter the errors by retransmissions which
in turn increases the link occupancy. Thus in this case, there is an increase in both the
occupancy as well as the percentage retransmission. In our experiments, we create this
case by turning on the Bluetooth link along with the video link. Other 802.11 links
(2,3,4 and 5) were also turned on with their nominal traffic flow.

27
Channel Congestion:
When there are a number of high-speed 802.11 links in the same contention region,
each one gets only a fraction of the channel occupancy and also the number of colli-
sion induced errors increases substantially following Bianchi’s model. [30] Hence this
gives rise to a large drop in occupancy accompanied by an increase in the percentage
retransmission. We emulate this by turning on all the 802.11 links with 15 Mbps UDP
data traffic at 54Mbps link speed.
Slow link on Same AP:
As seen in section 2, a slow link in the network can cause problems for other high-
speed links by occupying the shared channel for a large amount of time. This is mostly
followed by a slight increase in retransmissions as the number of collisions increase
compared to the baseline case. For the emulation, link 2 of Figure 5.1 is converted to
a slow 1 Mbps link while all other links carry their normal traffic.
Slow link on Other AP:
In this case, link 4 is made a slow link by changing its transmission rate to 1 Mbps, while
the other links still carry the baseline traffic. In this case, we observed that the fall in
occupancy is less than that in case of the slow link, same AP case, but the effect on both
occupancy and percentage retransmissions is qualitatively the same. This ambiguity
between the same AP and other AP cases can be solved by using the information about
AP Mac addresses in the diagnosis algorithm.
5.3 Threshold Selection
An important point in the above discussion and in Figure 5.2 is the value of the thresh-
olds that we set to distinguish between different regions. The values specified in Figure
5.2 are heuristic bounds that we observed from repeated trials under different traffic and
rate conditions. The thresholds are also chosen relative to the baseline values, Occu-
pancy = pb and Retransmission percentage = rb, which makes the thresholds robust for

28
streaming video transmissions of any rate. However, the thresholds, being heuristically
derived, are still prone to change based on the topology and the number of interfering
devices present in the environment. To make our algorithms work in more generic envi-
ronments, our next step would be to use Support Vector Machines (SVM) [31] to derive
the hyperplanes for multidimensional parameter classification. The basic concept of
SVMs involves machine learning based on a set of training set. The training set is used
to cluster the observations into different sets to build appropriate hyperplanes. In the
online phase, these hyperplanes are used to give a judgment about the new observation
based on the model developed out of the training data. Thus the immediate next step
in the diagnosis algorithm front would be to use a large set of traces from different
topologies, varying the data rates, distance from interferers and traffic patterns, and
then setting up a SVM to come up with the required thresholds.
5.4 Experimental Verification
To get an idea about the robustness of the parameters selected and the thresholds
derived, we ran a number of experiments for each kind of interference and ran our diag-
nosis algorithm to determine the problem type in each case. Table 5.1 lists the different
configurations that we tested our algorithm on and also shows the minimum, maximum
and average values of the two relevant parameters. For the purpose of this experiment,
we used the same video link described earlier in the section as the primary link and
the baseline values of rb = 2.8%, pb = 0.24 is used to set the decision thresholds. The
interference configurations are as mentioned in the table, for example in the Bluetooth
case, we vary the distance between the video receiver and the Bluetooth pair and Table
5.1 shows the corresponding results for distances 1, 6 and 11 meters. Based on the
thresholds, the algorithm correctly diagnoses the presence of Bluetooth interference in
the first two cases while it fails in the 11m case due to the relatively less impact of the
interference on the main link. Similarly, in case of a slow link interference, when the
slow link data rate is set to 11 Mbps and its distance from the main link is 15m, the
occupancy level goes above the threshold causing the algorithm to incorrectly declare
a ‘no-problem’ case. The congestion case is emulated using varying number of extra

29
Interference Type% Retransmission Occupancy
DiagnosisMin Max Avg Min Max Avg
Bluetooth - Distance 1m 7.3 21.6 18.0 0.11 0.43 0.39 X
Bluetooth - Distance 6m 8.1 18.2 16.5 0.14 0.38 0.33 X
Bluetooth - Distance 11m 4.0 16.1 13.6 0.19 0.26 0.24 x
Slow Link - Rate 1Mbps, Dist 1m 1.7 6.2 4.9 0.01 0.14 0.07 X
Slow Link - Rate 1Mbps, Dist 15m 0.9 6.1 3.2 0.02 0.19 0.08 X
Slow Link - Rate 11Mbps, Dist 1m 1.6 8.3 6.5 0.09 0.16 0.12 X
Slow Link - Rate 11Mbps, Dist 15m 0.9 9.6 7.2 0.12 0.22 0.17 x
Congestion - 4 links, Traffic 20Mbps 11.2 18.0 16.4 0.04 0.12 0.10 X
Congestion - 4 links, Traffic 5Mbps 7.8 13.7 10.1 0.10 0.21 0.17 x
Congestion - 3 links, Traffic 20Mbps 6.1 14.2 9.8 0.05 0.18 0.12 X
Table 5.1: Diagnosis Output for the proposed heuristic algorithm over different inter-ference cases
high-speed links and also varying the amount of TCP traffic that each link carries. The
traces record an occupancy level of 0.17 in the case of 4 competing links with 5Mbps
TCP traffic each and thus fails to diagnose the problem in this case. It can be noted
here that in all the ‘missed’ diagnosis cases, due to the distance and/or the datarate
of the interfering link, its effect on the video link is reduced bringing it closer to the
baseline operating point and thus making it harder to diagnose. However in these
cases, the quality degradation in the video link is also reduced and a potential user
of such a system would care less about these cases than those of substantially higher
degradations.

30
Chapter 6
Conclusions and Future Work
Shared use of the unlicensed ISM spectrum, just like any other shared resource is only
as good as its rules for fair play and peaceful co-existence. With no means of central
control or arbitration between heterogeneous radios, the 2.4 GHz band is gradually
becoming interference limited. The experimental results in this thesis outline the impact
of inter-radio interference and show that in typical topologies, the effect of one radio
class on others causes significant reductions in the throughput. In particular, we show
in Section 2 some common scenarios like presence of a slower rate 802.11 link on the
same channel as a high rate link, co-located Bluetooth and 802.11 radios, simultaneous
transmissions of video-UDP over multiple links and a dense deployment of Bluetooth
and ZigBee radios, and benchmark the loss in usable throughput in each case. All of
these problems are fairly widespread and limit the quality of service of the applications
that run on the wireless system.
Research has outlined many techniques for better co-existence mechanisms and pro-
posals of common shared channel for cooperation. However, the widespread and diverse
deployment of different radio devices and the clause of legacy support that any feasi-
ble solution should possess, severely limits the use of such corrective systems. In such
a scenario, fault diagnosis and detailed interference analysis can lead to an improved
use of the shared spectrum and provide the end users of the system with valuable in-
sight to the myriad interference related problems. While a wide variety of tools exists
for detailed diagnosis and network monitoring in wired networks, spectrum monitoring
techniques for the wireless domain are still underdeveloped. As such, we have outlined
some techniques for trace collection and storage in Section 3 which provide a more de-
tailed view of the multi-radio environment. Based on this our work proposes the design

31
of a framework for multi-radio monitoring which provides the basis for an elaborate
system for diagnosis of interference related problems. The basic building blocks of the
system consists of a set of disparate monitors that employ different means of data col-
lection and a database server that time synchronizes the trace collection process and
maintains the different tables for use by the diagnosis algorithm. Having setup such a
framework, in future work we will apply data mining techniques that can use trace data
from multiple tables and identify problem scenarios for non-trivial cases of multi-radio
interference. As such, the design of diagnosis algorithms would first require insights on
building theoretical and heuristic models for multi-radio interference and on identifying
metrics that can be useful for the diagnosis of interference related problems. Recent
advancements in machine learning methods and intelligent algorithms can significantly
contribute to this work.
32
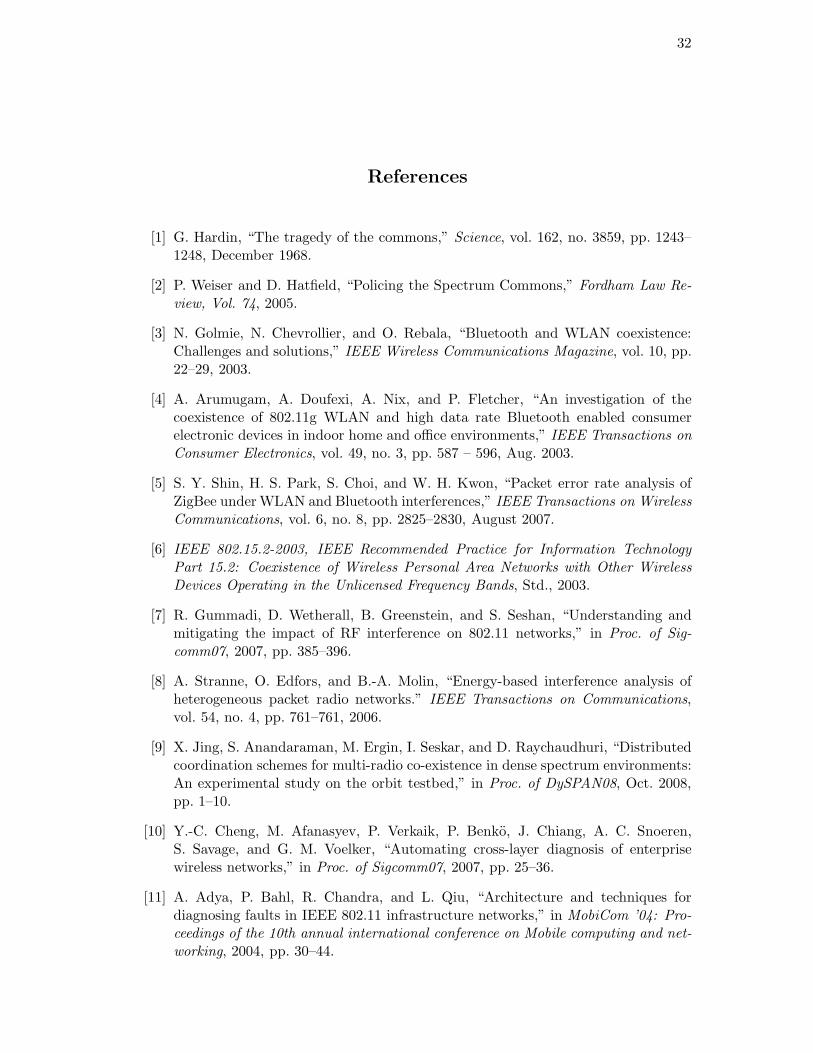
References
[1] G. Hardin, “The tragedy of the commons,” Science, vol. 162, no. 3859, pp. 1243–1248, December 1968.
[2] P. Weiser and D. Hatfield, “Policing the Spectrum Commons,” Fordham Law Re-view, Vol. 74, 2005.
[3] N. Golmie, N. Chevrollier, and O. Rebala, “Bluetooth and WLAN coexistence:Challenges and solutions,” IEEE Wireless Communications Magazine, vol. 10, pp.22–29, 2003.
[4] A. Arumugam, A. Doufexi, A. Nix, and P. Fletcher, “An investigation of thecoexistence of 802.11g WLAN and high data rate Bluetooth enabled consumerelectronic devices in indoor home and office environments,” IEEE Transactions onConsumer Electronics, vol. 49, no. 3, pp. 587 – 596, Aug. 2003.
[5] S. Y. Shin, H. S. Park, S. Choi, and W. H. Kwon, “Packet error rate analysis ofZigBee underWLAN and Bluetooth interferences,” IEEE Transactions on WirelessCommunications, vol. 6, no. 8, pp. 2825–2830, August 2007.
[6] IEEE 802.15.2-2003, IEEE Recommended Practice for Information TechnologyPart 15.2: Coexistence of Wireless Personal Area Networks with Other WirelessDevices Operating in the Unlicensed Frequency Bands, Std., 2003.
[7] R. Gummadi, D. Wetherall, B. Greenstein, and S. Seshan, “Understanding andmitigating the impact of RF interference on 802.11 networks,” in Proc. of Sig-comm07, 2007, pp. 385–396.
[8] A. Stranne, O. Edfors, and B.-A. Molin, “Energy-based interference analysis ofheterogeneous packet radio networks.” IEEE Transactions on Communications,vol. 54, no. 4, pp. 761–761, 2006.
[9] X. Jing, S. Anandaraman, M. Ergin, I. Seskar, and D. Raychaudhuri, “Distributedcoordination schemes for multi-radio co-existence in dense spectrum environments:An experimental study on the orbit testbed,” in Proc. of DySPAN08, Oct. 2008,pp. 1–10.
[10] Y.-C. Cheng, M. Afanasyev, P. Verkaik, P. Benko, J. Chiang, A. C. Snoeren,S. Savage, and G. M. Voelker, “Automating cross-layer diagnosis of enterprisewireless networks,” in Proc. of Sigcomm07, 2007, pp. 25–36.
[11] A. Adya, P. Bahl, R. Chandra, and L. Qiu, “Architecture and techniques fordiagnosing faults in IEEE 802.11 infrastructure networks,” in MobiCom ’04: Pro-ceedings of the 10th annual international conference on Mobile computing and net-working, 2004, pp. 30–44.

33
[12] B. Yan and G. Chen, “Model-based fault diagnosis for IEEE 802.11 wireless LANs,”in Proceedings of the Sixth Annual International Conference on Mobile and Ubiq-uitous Systems: Computing, Networking and Services (MobiQuitous), Toronto,Canada, Jul. 2009, to appear.
[13] J.-H. Yun and S.-W. Seo, “Collision detection based on RF energy duration inIEEE 802.11 wireless lan,” in Communication System Software and Middleware,2006. Comsware 2006. First International Conference on, 2006, pp. 1–6.
[14] A. Sheth, C. Doerr, D. Grunwald, R. Han, and D. Sicker, “MOJO: a distributedphysical layer anomaly detection system for 802.11 wlans,” in MobiSys ’06: Pro-ceedings of the 4th international conference on Mobile systems, applications andservices, 2006, pp. 191–204.
[15] S. Rayanchu, A. Mishra, D. Agrawal, S. Saha, and S. Banerjee, “Diagnosing wire-less packet losses in 802.11: Separating collision from weak signal,” in INFOCOM2008. The 27th Conference on Computer Communications. IEEE, April 2008, pp.735–743.
[16] D. Raychaudhuri, I. Seskar, M. Ott, S. Ganu, K. Ramachandran, H. Kremo, R. Sir-acusa, H. Liu, and M. Singh, “Overview of the orbit radio grid testbed for eval-uation of next-generation wireless network protocols,” in Proc. of IEEE WirelessCommunications and Networking Conference, 2005, vol. 3, March 2005, pp. 1664–1669.
[17] J. Polastre, R. Szewczyk, and D. Culler, “Telos: enabling ultra-low power wire-less research,” in IPSN ’05: Proceedings of the 4th International symposium onInformation processing in sensor networks, 2005.
[18] Iperf network testing tool, http://www.noc.ucf.edu/Tools/Iperf/.
[19] UC Berkeley, “TinyOS Community Forum,” http://www.tinyos.net.
[20] N. Golmie, O. Rebala, and N. Chevrollier, “Bluetooth adaptive frequency hoppingand scheduling,” in Military Communications Conference, 2003. MILCOM 2003.IEEE, vol. 2, 2003, pp. 1138 – 1142 Vol.2.
[21] J. Yeo, M. Youssef, and A. Agrawala, “A framework for wireless LAN monitoringand its applications,” in WiSe ’04: Proceedings of the 3rd ACM workshop onWireless security, 2004, pp. 70–79.
[22] Y. Sheng, G. Chen, H. Yin, K. Tan, U. Deshpande, B. Vance, D. Kotz, A. Camp-bell, C. McDonald, T. Henderson, and J. Wright, “MAP: A scalable monitoringsystem for dependable 802.11 wireless networks,” IEEE Wireless Communications,vol. 15, no. 5, pp. 10–18, October 2008.
[23] Tcpdump packet analyzer application, http://www.tcpdump.org.
[24] R. Miller, W. Xu, P. Kamat, and W. Trappe, “Service discovery and device identi-fication in cognitive radio networks.” in Proc. of IEEE SECON, 2007, pp. 670–677.

34
[25] C. Raman, J. Kalyanam, I. Seskar, and N. Mandayam, “Distributed Spatio-Temporal Spectrum Sensing: An Experimental Study,” in Signals, Systems andComputers, 2007. ACSSC 2007. Conference Record of the Forty-First AsilomarConference on, Nov. 2007, pp. 2063 –2067.
[26] FTS4BT Bluetooth Protocol Analyzer & Packet Sniffer, Frontline Technology,http://www.fte.com.
[27] Wi-Spy USB Spectrum Analyzer, http://www.metageek.net/products/wi-spy.
[28] M. Singh, M. Ott, I. Seskar, and P. Kamat, “Orbit measurements framework andlibrary (oml): Motivations, design, implementation, and features,” in TRIDENT-COM ’05: Proceedings of the First International Conference on Testbeds and Re-search Infrastructures for the DEvelopment of NeTworks and COMmunities, 2005,pp. 146–152.
[29] VideoLAN non-profit organisation, “VLC media player: The cross-platform open-source multimedia framework, player and server,” http://www.videolan.org/.
[30] G. Bianchi, “Performance Analysis of the IEEE 802.11 Distributed CoordinationFunction,” IEEE Journal on Selected Areas in Communications, vol. 18, no. 3, pp.535–547, October 2000.
[31] C.-C. Chang and C.-J. Lin, LIBSVM: a library for support vector machines, 2001,software available at http://www.csie.ntu.edu.tw/ cjlin/libsvm.