Multi-PIE - University of Pittsburghjeffcohn/biblio/cmu_multipie.pdf · This paper gives an...
22
Multi-PIE Ralph Gross a , Iain Matthews a , Jeffrey Cohn b , Takeo Kanade a , Simon Baker c a Robotics Institute, Carnegie Mellon University b Department of Psychology, University of Pittsburgh c Microsoft Research, Microsoft Corporation Key words: Face database, Face recognition across pose, Face recognition across illumination, Face recognition across expression 1. Introduction Facial appearance varies significantly with a number of factors, including identity, illumination, pose, and expression. To support the development and comparative evaluation of face recognition algorithms, the availability of facial image data spanning conditions of interest in a carefully controlled manner is important. Several face databases have been collected over the last decade for this reason, such as the FERET [1], AR [2], XM2VTS [3], Cohn-Kanade [4], and Yale B [5] databases. See [6] for a more comprehensive overview. To support research for face recognition across pose and illumination the Pose, Illumination, and Expression (PIE) database was collected at CMU in the fall of 2000 [7]. To date more than 450 copies of PIE have been distributed to researchers throughout the world. Despite its success the PIE database has a number of shortcomings; in particular it only contains 68 subjects that were recorded in a single session, displaying only a small range of expressions Preprint submitted to Image and Vision Computing July 12, 2009
Transcript of Multi-PIE - University of Pittsburghjeffcohn/biblio/cmu_multipie.pdf · This paper gives an...

Multi-PIE
Ralph Grossa, Iain Matthewsa, Jeffrey Cohnb, Takeo Kanadea,Simon Bakerc
aRobotics Institute, Carnegie Mellon UniversitybDepartment of Psychology, University of Pittsburgh
cMicrosoft Research, Microsoft Corporation
Key words: Face database, Face recognition across pose, Face recognition
across illumination, Face recognition across expression
1. Introduction
Facial appearance varies significantly with a number of factors, including
identity, illumination, pose, and expression. To support the development
and comparative evaluation of face recognition algorithms, the availability
of facial image data spanning conditions of interest in a carefully controlled
manner is important. Several face databases have been collected over the
last decade for this reason, such as the FERET [1], AR [2], XM2VTS [3],
Cohn-Kanade [4], and Yale B [5] databases. See [6] for a more comprehensive
overview.
To support research for face recognition across pose and illumination the
Pose, Illumination, and Expression (PIE) database was collected at CMU in
the fall of 2000 [7]. To date more than 450 copies of PIE have been distributed
to researchers throughout the world. Despite its success the PIE database
has a number of shortcomings; in particular it only contains 68 subjects that
were recorded in a single session, displaying only a small range of expressions
Preprint submitted to Image and Vision Computing July 12, 2009

POSE ILLUMINATION
SESSION
EXPRESSIONHIGH RESOLUTION
Figure 1: Variation captured in the Multi-PIE face database.
(neutral, smile, blink, and talk).
To address theses issues we collected the Multi-PIE database. The new
database improves upon the PIE database in a number of categories as shown
in Figure 1 and Table 1. Most notably the number of subjects has been
substantially increased to 337 with multiple recording sessions (4 vs. only 1
in PIE). In addition the recording environment of the Multi-PIE database
has been improved in comparison to the PIE collection through usage of a
uniform, static background and live monitors showing subjects during the
recording, allowing for constant control of the head position.
This paper gives an overview of the Multi-PIE database and provides
results of baseline face recognition experiments. Section 2 describes the
hardware setup used during the collection. Section 3 explains the record-
ing procedure and shows example images. We provide statistics on recording
session attendance and the subject population in Section 4. Section 5 shows
2

Multi-PIE PIE
# Subjects 337 68
# Recording Sessions 4 1
High-Resolution Still Images Yes No
Calibration Images Yes No
# Expressions 6 4
# Cameras 15 13
# Flashes 18 21
Total # Images 750,000+ 41,000+
DB Size [GB] 305 40
Table 1: Comparison between the Multi-PIE and PIE databases.
results of evaluations using PCA [8] and LDA [9] in experiments comparing
PIE and Multi-PIE as well as in experiments only possible on Multi-PIE.
2. Collection Setup
This section describes the physical setup and the hardware used to record
the high resolution still images (Section 2.1), the multi-pose/illumination
images (Section 2.2), and the calibration data (Section 2.3).
2.1. High Resolution Images
We recorded frontal images using a Canon EOS 10D (6.3-megapixel CMOS
camera) with a Macro Ring Lite MR-14EX ring flash. As shown in Figure 2,
subjects were seated in front of a blue background in close proximity to the
3

Figure 2: Setup for the high resolution image capture. Subjects were seated in
front of a blue background and recorded using a Canon EOS 10D camera with a
Macro Ring Lite MR-14EX ring flash.
camera. The resulting images are 3072 × 2048 in size with the inter-pupil
distance of the subjects typically exceeding 400 pixels.
2.2. Pose and Illumination Images
To systematically capture images with varying poses and illuminations
we used a system of 15 cameras and 18 flashes connected to a set of Linux
PCs. An additional computer was used as master to communicate with
the independent recording clients running in parallel on the data capture
PCs. This setup is similar to the one used for the CMU PIE database [7].
Figure 3 illustrates the camera positions. 1 Thirteen cameras were located at
head height, spaced in 15◦ intervals, and two additional cameras were located
1The camera labels are derived from the names of the computers that they are attached
to. We use the format <cc hh> with the camera number cc and the channel number hh.
4

above the subject, simulating a typical surveillance view. The majority of the
cameras (11 out of 15) were produced by Sony, model DXC-9000, and the
remaining four cameras (positions: 11 0, 08 1, 19 1, and 24 0) Panasonic
AW-E600Ps (see Figure 3). Each camera had one flash (model: Minolta
Auto 220X) attached to it; above for the 13 cameras mounted at head height
and below for the 2 cameras mounted above the subject. In addition, three
more flashes were located above the subject between the surveillance-view
cameras 08 1 and 19 1. See Figure 4 for a panoramic image of the room with
the locations of the cameras and flashes marked with red and blue circles,
respectively. All components of the system were hardware synchronized,
replicating the system in [10]. All flashes were wired directly to a National
Instruments digial I/O card (NI PCI-6503) and triggered in sync with the
image capture. This setup was inspired by the system used in the Yale dome
[5].
The settings for all cameras were manually adjusted so that the pixel
value of the brightest pixel in an image recorded without flash illumination
is around 128 to minimize the number of saturated pixels in the flash illu-
minated images. For the same reason we added diffusers in front of each
flash. We also attempted to manually color-balance the cameras so that the
resulting images look visually similar.
2.3. Calibration Data
Calibration data was recorded after the conclusion of the data collection.
During sessions 1 through 3, a number of flashes had to be replaced. As
a consequence some camera and flash positions might be slightly different
from what was measured during the collection of the calibration data. We
5

11_0
12_0
09_0
08_0
08_1
14_013_0 05_1 05_0 04_1 19_0
19_1
20_0
01_0
24_0Subject Location
Figure 3: Camera labels and approximate locations inside the collection room.
There were 13 cameras located at head height, spaced in 15◦ intervals. Two
additional cameras (08 1 and 19 1) were located above the subject, simulating
a typical surveillance camera view. Each camera had one flash attached to it with
three additional flashes being placed between cameras 08 1 and 19 1.
recorded camera calibration images as well as color calibration images show-
ing a Gretag Macbeth ColorChecker chart. We furthermore determined the
3D locations of all cameras and flashes and the approximate location of the
head of the subject using a theodolite (model: Leica TCA1105, see Figure
5).
3. Data Collection Procedure
We recorded data during four sessions over the course of six months.
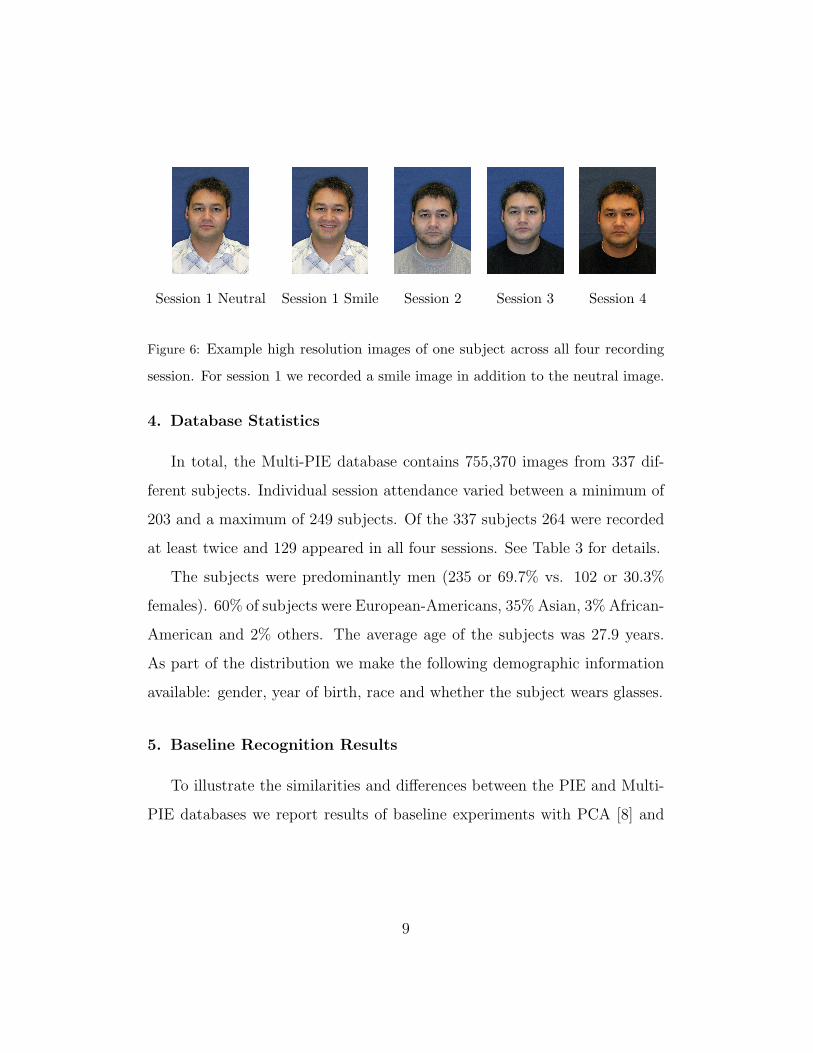
During each session we recorded a single neutral high resolution frontal image.
In addition, during the first session an additional image showing the subjects
smiling was recorded. Figure 6 shows all high resolution images from one
6

Figure 4: Panoramic image of the collection room. 14 of the 15 cameras used are
highlighted with yellow circles, 17 of the 18 flashes are highlighted with white boxes
with the occluded camera/flash pair being located right in front of the subject in
the chair. The monitor visible to the left was used to ensure accurate positioning
of the subject throughout the recording session.
subject for sessions 1 through 4.
After the recording of the high resolution images, subjects were taken
inside the collection room and seated in a chair. The height of the chair was
adjusted so that the head of the subject was between camera 11 0 and camera
24 0. We used two live monitors attached to cameras 11 0 and 05 1 to ensure
correct head location of the subjects throughout the recording procedure. In
each session, multiple image sequences were recorded, for which subjects
were instructed to display different facial expressions. Subjects were shown
example images of the various expressions from the Cohn-Kanade database
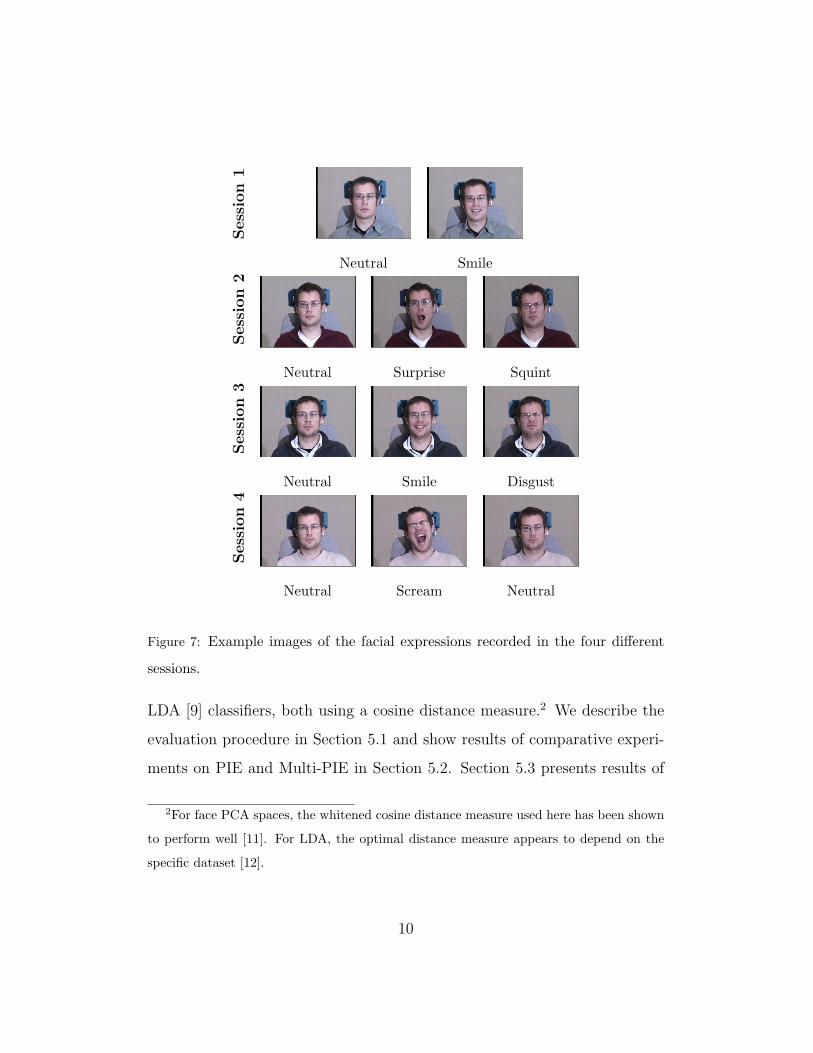
[4] immediately prior to the recording. Table 2 lists the expressions captured
in each session. Figure 7 shows example images for all facial expressions
contained in the database.
For each camera 20 images were captured within 0.7 seconds: one image
7
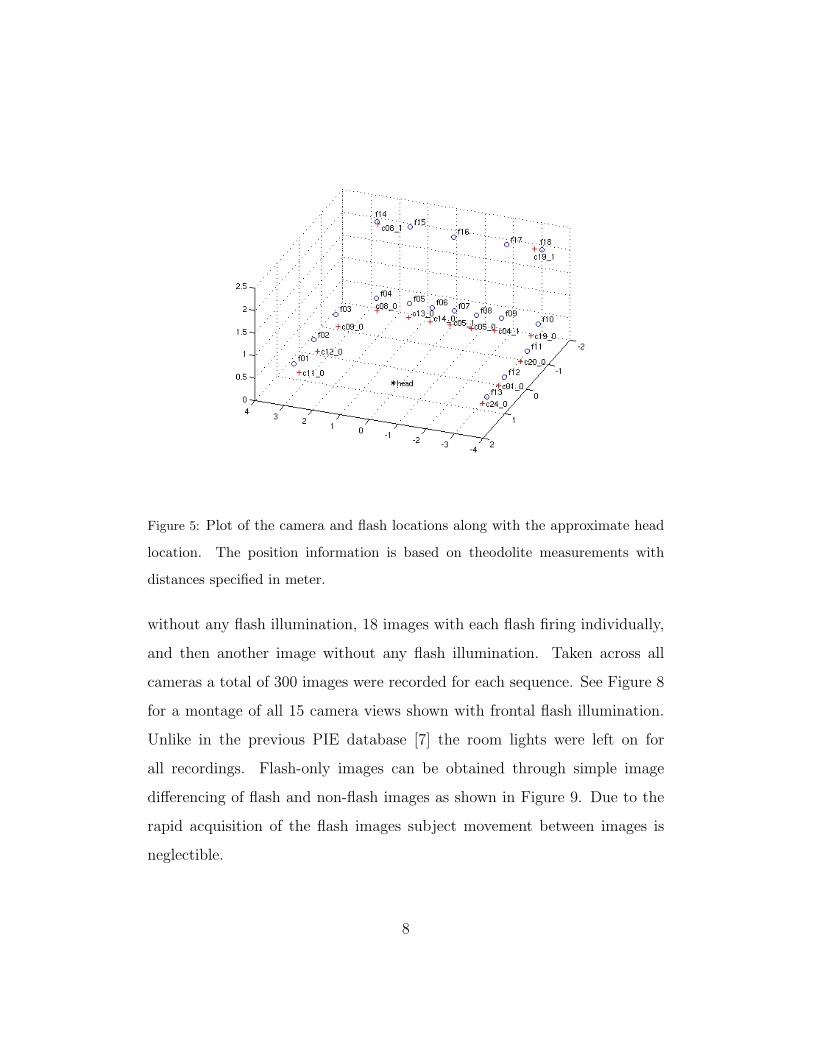
Figure 5: Plot of the camera and flash locations along with the approximate head
location. The position information is based on theodolite measurements with
distances specified in meter.
without any flash illumination, 18 images with each flash firing individually,
and then another image without any flash illumination. Taken across all
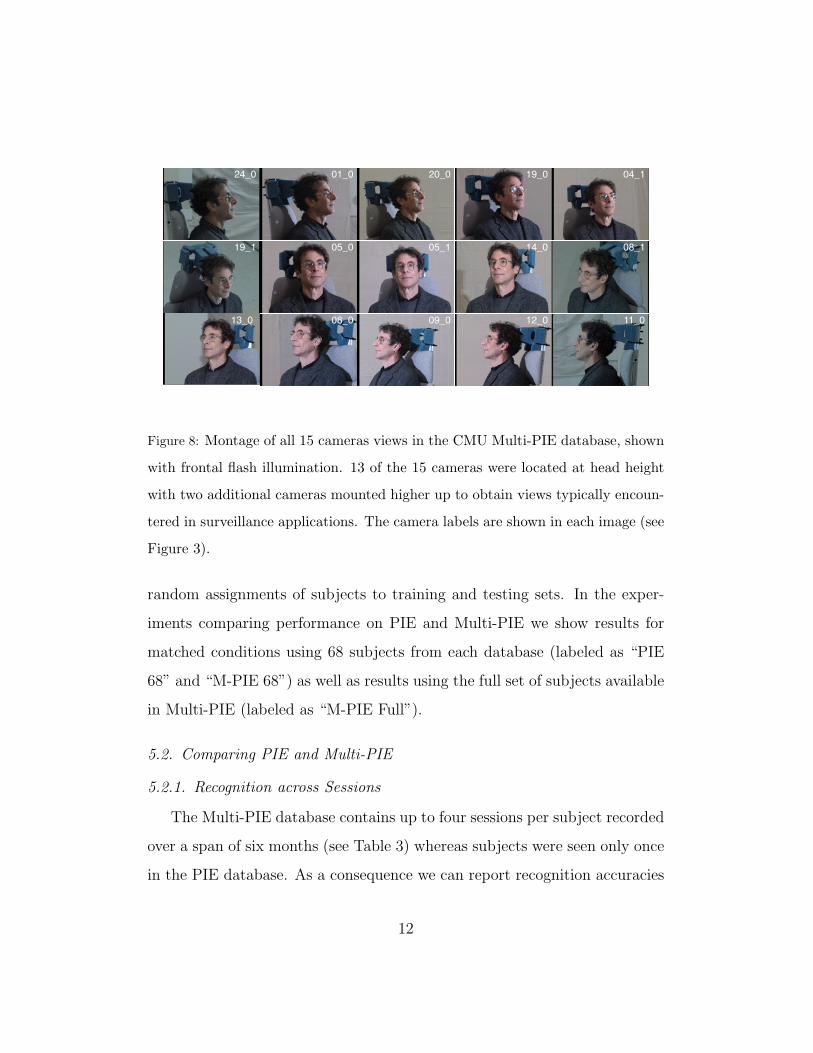
cameras a total of 300 images were recorded for each sequence. See Figure 8
for a montage of all 15 camera views shown with frontal flash illumination.
Unlike in the previous PIE database [7] the room lights were left on for
all recordings. Flash-only images can be obtained through simple image
differencing of flash and non-flash images as shown in Figure 9. Due to the
rapid acquisition of the flash images subject movement between images is
neglectible.
8
Session 1 Neutral Session 1 Smile Session 2 Session 3 Session 4
Figure 6: Example high resolution images of one subject across all four recording
session. For session 1 we recorded a smile image in addition to the neutral image.
4. Database Statistics
In total, the Multi-PIE database contains 755,370 images from 337 dif-
ferent subjects. Individual session attendance varied between a minimum of
203 and a maximum of 249 subjects. Of the 337 subjects 264 were recorded
at least twice and 129 appeared in all four sessions. See Table 3 for details.
The subjects were predominantly men (235 or 69.7% vs. 102 or 30.3%
females). 60% of subjects were European-Americans, 35% Asian, 3% African-
American and 2% others. The average age of the subjects was 27.9 years.
As part of the distribution we make the following demographic information
available: gender, year of birth, race and whether the subject wears glasses.
5. Baseline Recognition Results
To illustrate the similarities and differences between the PIE and Multi-
PIE databases we report results of baseline experiments with PCA [8] and
9
Sess
ion
1
Neutral Smile
Sess
ion
2
Neutral Surprise Squint
Sess
ion
3
Neutral Smile Disgust
Sess
ion
4
Neutral Scream Neutral
Figure 7: Example images of the facial expressions recorded in the four different
sessions.
LDA [9] classifiers, both using a cosine distance measure.2 We describe the
evaluation procedure in Section 5.1 and show results of comparative experi-
ments on PIE and Multi-PIE in Section 5.2. Section 5.3 presents results of
2For face PCA spaces, the whitened cosine distance measure used here has been shown
to perform well [11]. For LDA, the optimal distance measure appears to depend on the
specific dataset [12].
10

Expression S1 S2 S3 S4
Neutral x x x xx
Smile x x
Surprise x
Squint x
Disgust x
Scream x
Table 2: Overview of the facial expressions recorded in the different sessions. Note
that we recorded two neutral expressions during session four, one before and one
after the scream expression.
new experiments on Multi-PIE that could not be conducted using PIE data.
5.1. Evaluation Procedure
For all experiments, frontal faces were normalized using the location of
68 manually established facial feature points. These points are triangulated
and the image warped with a piecewise affine warp onto a coordinate frame
in which the canonical points are in fixed locations. This process is similar
to the preprocessing used prior to the computation of Active Appearance
Models (AAMs) [13, 14]. The resulting images are approximately 90 × 93
in size (with slight variations for the different data subsets). Throughout
we use the data of 14 subjects (20% of the 68 subjects available in PIE)
to compute the PCA or LDA subspaces and evaluate performance on the
remaining subjects. In all cases we report rank-1 accuracy rates.
We report rank-1 accuracies computed as averages over 20 independent
11
24_0 01_0 20_0 19_0 04_1
19_1 05_0 14_005_1 08_1
11_012_009_008_013_0
Figure 8: Montage of all 15 cameras views in the CMU Multi-PIE database, shown
with frontal flash illumination. 13 of the 15 cameras were located at head height
with two additional cameras mounted higher up to obtain views typically encoun-
tered in surveillance applications. The camera labels are shown in each image (see
Figure 3).
random assignments of subjects to training and testing sets. In the exper-
iments comparing performance on PIE and Multi-PIE we show results for
matched conditions using 68 subjects from each database (labeled as “PIE
68” and “M-PIE 68”) as well as results using the full set of subjects available
in Multi-PIE (labeled as “M-PIE Full”).
5.2. Comparing PIE and Multi-PIE
5.2.1. Recognition across Sessions
The Multi-PIE database contains up to four sessions per subject recorded
over a span of six months (see Table 3) whereas subjects were seen only once
in the PIE database. As a consequence we can report recognition accuracies
12
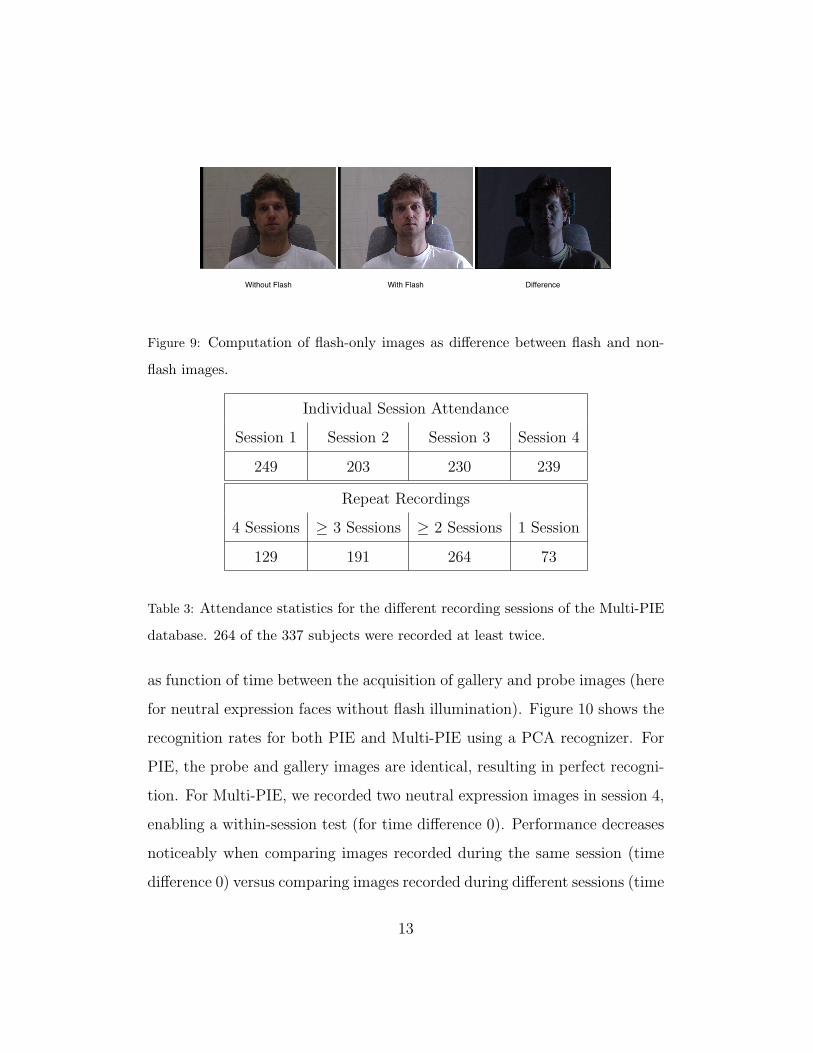
With Flash DifferenceWithout Flash
Figure 9: Computation of flash-only images as difference between flash and non-
flash images.
Individual Session Attendance
Session 1 Session 2 Session 3 Session 4
249 203 230 239
Repeat Recordings
4 Sessions ≥ 3 Sessions ≥ 2 Sessions 1 Session
129 191 264 73
Table 3: Attendance statistics for the different recording sessions of the Multi-PIE
database. 264 of the 337 subjects were recorded at least twice.
as function of time between the acquisition of gallery and probe images (here
for neutral expression faces without flash illumination). Figure 10 shows the
recognition rates for both PIE and Multi-PIE using a PCA recognizer. For
PIE, the probe and gallery images are identical, resulting in perfect recogni-
tion. For Multi-PIE, we recorded two neutral expression images in session 4,
enabling a within-session test (for time difference 0). Performance decreases
noticeably when comparing images recorded during the same session (time
difference 0) versus comparing images recorded during different sessions (time
13
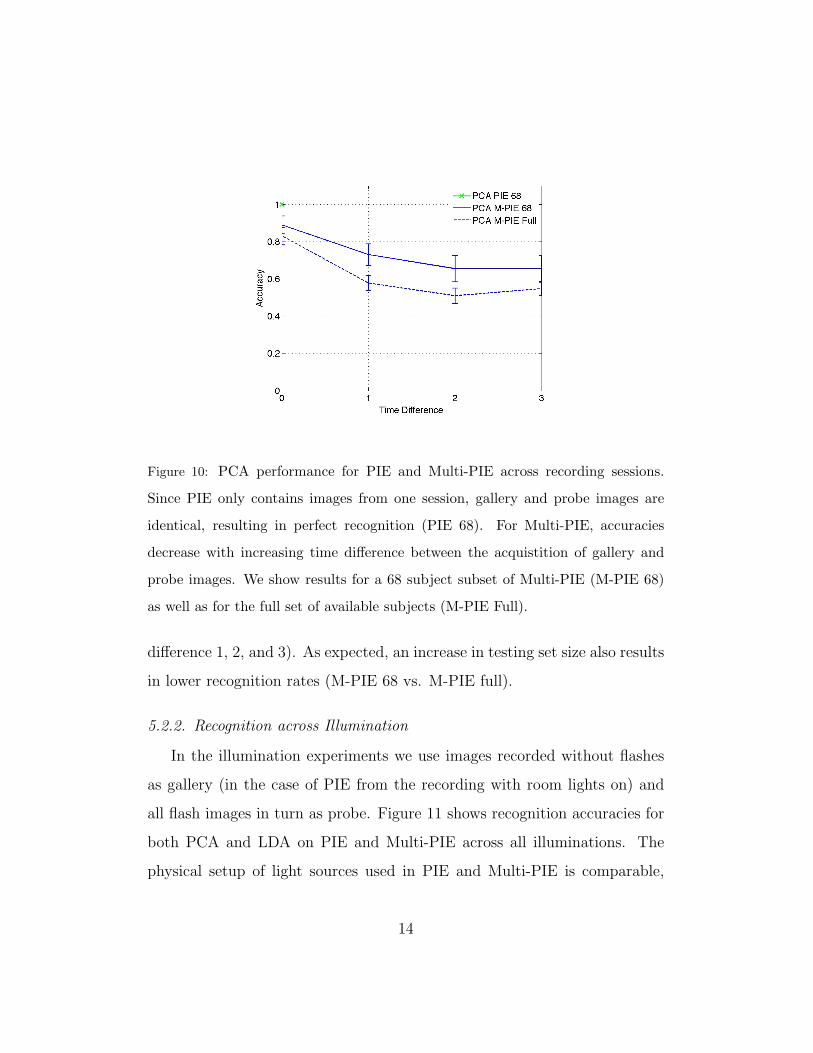
Figure 10: PCA performance for PIE and Multi-PIE across recording sessions.
Since PIE only contains images from one session, gallery and probe images are
identical, resulting in perfect recognition (PIE 68). For Multi-PIE, accuracies
decrease with increasing time difference between the acquistition of gallery and
probe images. We show results for a 68 subject subset of Multi-PIE (M-PIE 68)
as well as for the full set of available subjects (M-PIE Full).
difference 1, 2, and 3). As expected, an increase in testing set size also results
in lower recognition rates (M-PIE 68 vs. M-PIE full).
5.2.2. Recognition across Illumination
In the illumination experiments we use images recorded without flashes
as gallery (in the case of PIE from the recording with room lights on) and
all flash images in turn as probe. Figure 11 shows recognition accuracies for
both PCA and LDA on PIE and Multi-PIE across all illuminations. The
physical setup of light sources used in PIE and Multi-PIE is comparable,
14
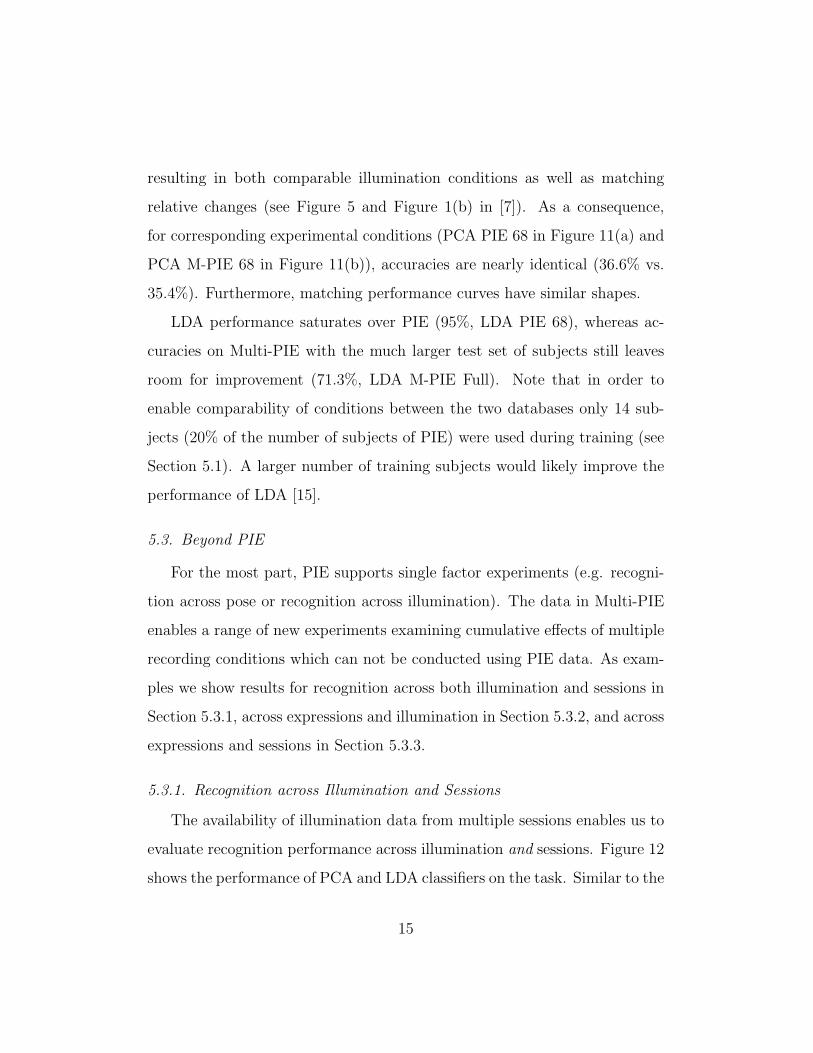
resulting in both comparable illumination conditions as well as matching
relative changes (see Figure 5 and Figure 1(b) in [7]). As a consequence,
for corresponding experimental conditions (PCA PIE 68 in Figure 11(a) and
PCA M-PIE 68 in Figure 11(b)), accuracies are nearly identical (36.6% vs.
35.4%). Furthermore, matching performance curves have similar shapes.
LDA performance saturates over PIE (95%, LDA PIE 68), whereas ac-
curacies on Multi-PIE with the much larger test set of subjects still leaves
room for improvement (71.3%, LDA M-PIE Full). Note that in order to
enable comparability of conditions between the two databases only 14 sub-
jects (20% of the number of subjects of PIE) were used during training (see
Section 5.1). A larger number of training subjects would likely improve the
performance of LDA [15].
5.3. Beyond PIE
For the most part, PIE supports single factor experiments (e.g. recogni-
tion across pose or recognition across illumination). The data in Multi-PIE
enables a range of new experiments examining cumulative effects of multiple
recording conditions which can not be conducted using PIE data. As exam-
ples we show results for recognition across both illumination and sessions in
Section 5.3.1, across expressions and illumination in Section 5.3.2, and across
expressions and sessions in Section 5.3.3.
5.3.1. Recognition across Illumination and Sessions
The availability of illumination data from multiple sessions enables us to
evaluate recognition performance across illumination and sessions. Figure 12
shows the performance of PCA and LDA classifiers on the task. Similar to the
15
(a) PIE (b) Multi-PIE
Figure 11: Comparison of PCA and LDA recognition across illumination condi-
tions in PIE and Multi-PIE. For matched experimental conditions (PCA PIE 68
in (a) and PCA M-PIE 68 in (b)), performance is comparable, experimentally
veryifying the similarity in the physical setup of the two collections. Whereas
LDA performance over PIE nearly saturates at 95%, the average accuracy over
Multi-PIE using the largest test set (LDA M-PIE Full) indicates further room for
improvement.
results in Section 5.2.1 there is a noticeable drop in performance between time
difference 0 and time differences 1, 2, and 3. However, overall performance
levels are much lower than in Figure 10 due to the influence of the illumination
differences.
5.3.2. Recognition across Expression and Illumination
The range of facial expressions captured in Multi-PIE (neutral, smile, sur-
prise, squint, disgust, and scream) is much larger than the subtle expressions
contained in PIE (neutral, smile, blink, and talk). Furthermore, Multi-PIE
16

Figure 12: PCA and LDA performance on Multi-PIE across illumination and ses-
sions. Results shown are averages over all illumination conditions. Performance
decreases with increasing time difference between the recording of gallery and
probe images. Performance overall is lower than in Figure 10 due to the influence
of the illumination differences.
contains images from all illuminations conditions for all facial expressions.
We are therefore able to evaluate the cumulative effect of changes in illumi-
nation and expression on recognition accuracies. Figure 13 shows PCA and
LDA accuracies for different probe expressions, averaged over all illumination
conditions. In all cases, a neutral expression image recorded in the same ses-
sion without flash illumination was used as gallery image. As comparison we
also show results of PCA recognition with identical illumination conditions
for gallery and probe (PCA M-PIE). The combined influence of illumination
and expression reduces accuracies drastically, with PCA rates varying be-
tween 13.7% (for scream) and 21.1% (for squint). LDA accuracies are higher
on average (41.4% vs. 18.5%), peaking at 50.1% (again for squint).
17
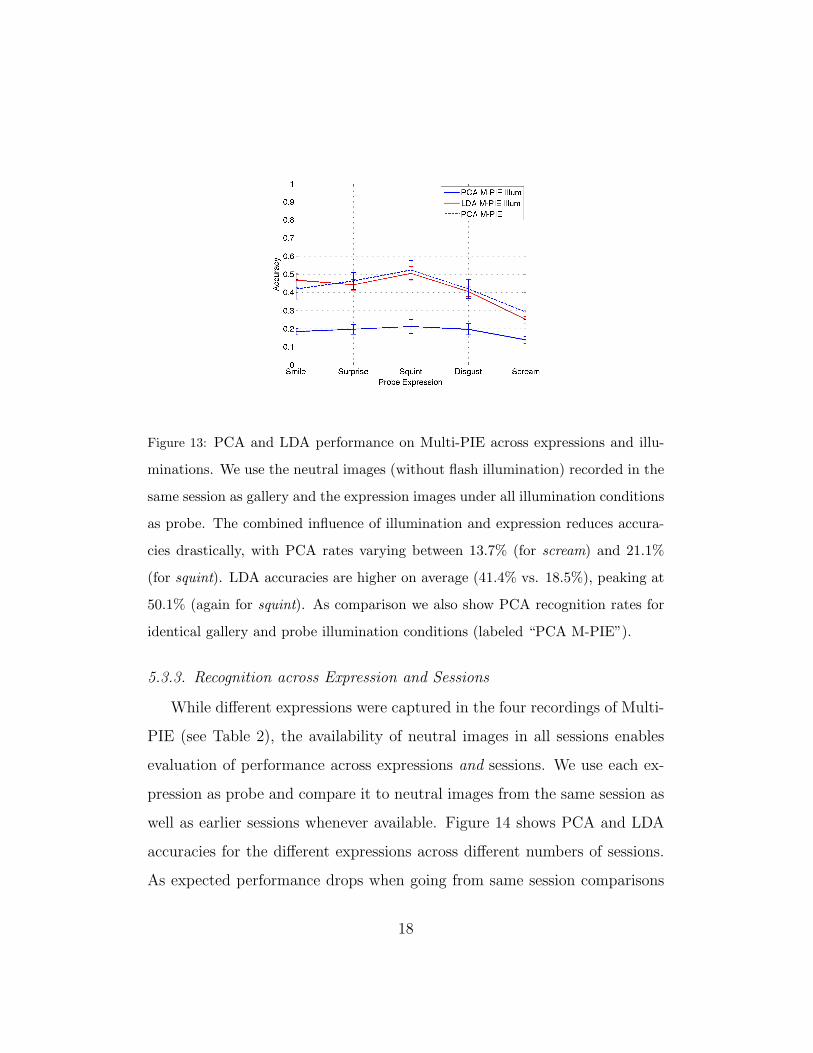
Figure 13: PCA and LDA performance on Multi-PIE across expressions and illu-
minations. We use the neutral images (without flash illumination) recorded in the
same session as gallery and the expression images under all illumination conditions
as probe. The combined influence of illumination and expression reduces accura-
cies drastically, with PCA rates varying between 13.7% (for scream) and 21.1%
(for squint). LDA accuracies are higher on average (41.4% vs. 18.5%), peaking at
50.1% (again for squint). As comparison we also show PCA recognition rates for
identical gallery and probe illumination conditions (labeled “PCA M-PIE”).
5.3.3. Recognition across Expression and Sessions
While different expressions were captured in the four recordings of Multi-
PIE (see Table 2), the availability of neutral images in all sessions enables
evaluation of performance across expressions and sessions. We use each ex-
pression as probe and compare it to neutral images from the same session as
well as earlier sessions whenever available. Figure 14 shows PCA and LDA
accuracies for the different expressions across different numbers of sessions.
As expected performance drops when going from same session comparisons
18
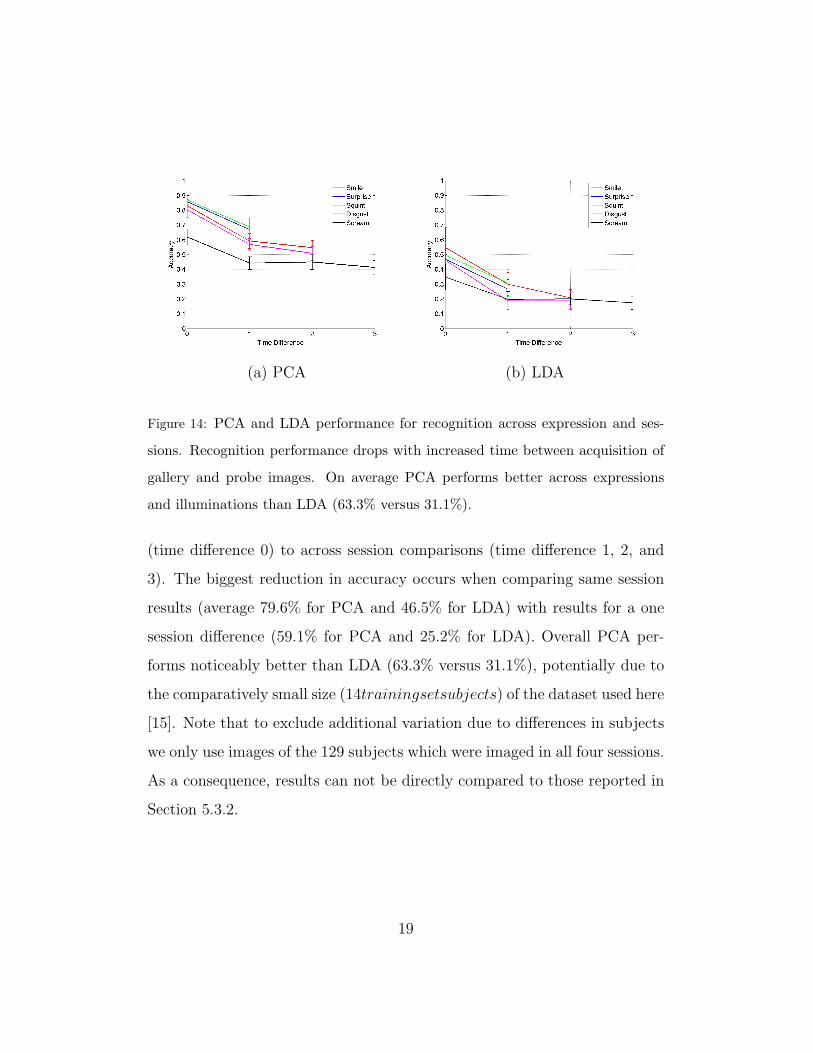
(a) PCA (b) LDA
Figure 14: PCA and LDA performance for recognition across expression and ses-
sions. Recognition performance drops with increased time between acquisition of
gallery and probe images. On average PCA performs better across expressions
and illuminations than LDA (63.3% versus 31.1%).
(time difference 0) to across session comparisons (time difference 1, 2, and
3). The biggest reduction in accuracy occurs when comparing same session
results (average 79.6% for PCA and 46.5% for LDA) with results for a one
session difference (59.1% for PCA and 25.2% for LDA). Overall PCA per-
forms noticeably better than LDA (63.3% versus 31.1%), potentially due to
the comparatively small size (14trainingsetsubjects) of the dataset used here
[15]. Note that to exclude additional variation due to differences in subjects
we only use images of the 129 subjects which were imaged in all four sessions.
As a consequence, results can not be directly compared to those reported in
Section 5.3.2.
19

6. Availability
Multi-PIE is available to all interested researchers for the cost of media
(a 400GB hard drive) and shipping. Details of the distribution procedure are
published at http://multipie.org. On the web page, we will also make the
experimental protocols used in this paper, normalized images, and 3-point
feature data available.
7. Conclusion
In this paper we introduced the CMU Multi-PIE face database. Multi-
PIE improves upon the highly successful PIE database in a number of aspects:
a larger set of subjects, more recording sessions, more facial expressions, and
the inclusion of high resolution images. We reported results of baseline ex-
periments using PCA and LDA classifiers discussing both the similarities and
as well as the differences between the two databases. All experiments shown
here only used frontal face images. In future work we plan on expanding the
evaluations across pose as well.
Acknowledgment
We would like to thank Jonathon Phillips, James Wayman, and David
Herrington for discussions and support and the anonymous reviewers for
comments. We furthermore would like to thank Athinodoros Georghiades
and Peter Belhumeur for providing us with the setup details of the Yale “flash
system.” Collection of the Multi-PIE database was supported by United
States Government’s Technology Support Working Group (TSWG) through
award N41756-03-C-402 and by Sandia National Laboratories.
20
References
[1] P. J. Phillips, H. Wechsler, J. S. Huang, P. J. Rauss, The FERET
database and evaluation procedure for face-recognition algorithms., Im-
age and Vision Computing 16 (5) (1998) 295–306.
[2] A. Martinez, R. Benavente, The AR face database, Tech. Rep. 24, Com-
puter Vision Center (CVC), Barcelona (1998).
[3] K. Messer, J. Matas, J. Kittler, J. Luettin, G. Maitre, XM2VTSDB:
the extended M2VTS database, in: Second International Conference
on Audio and Video-based Biometric Person Authentication (AVBPA),
1999.
[4] T. Kanade, J. Cohn, Y.-L. Tian, Comprehensive database for facial
expression analysis, in: Proceedings of the 4th IEEE International Con-
ference on Automatic Face and Gesture Recognition, 2000, pp. 46–53.
[5] A. Georghiades, D. Kriegman, P. Belhumeur, From few to many: gener-
ative models for recognition under variable pose and illumination, IEEE
Transaction on Pattern Analysis and Machine Intelligence 23 (6) (2001)
643–660.
[6] R. Gross, Face databases, in: S. Li, A. Jain (Eds.), Handbook of Face
Recognition, Springer Verlag, 2005.
[7] T. Sim, S. Baker, M. Bsat, The CMU pose, illumination, and expression
database, IEEE Transaction on Pattern Analysis and Machine Intelli-
gence 25 (12) (2003) 1615–1618.
21
[8] M. Turk, A. Pentland, Eigenfaces for recognition, Journal of Cognitive
Neuroscience 3 (1) (1991) 71–86.
[9] P. Belhumeur, J. Hespanha, D. Kriegman, Eigenfaces vs. Fisherfaces:
Recognition using class specific linear projection, IEEE Transactions on
Pattern Analysis and Machine Intelligence 19 (7) (1997) 711–720.
[10] T. Kanade, H. Saito, S. Vedula, The 3D room: digitizing time-varying
3d events by synchronizing multiple video streams, Tech. Rep. CMU-
RI-TR-98-34, Robotics Institute, Carnegie Mellon University (1998).
[11] R. Beveridge, D. Bolme, B. Draper, M. Teixeira, The CSU face identi-
fication evaluation system, Machine Vision and Applications 16 (2005)
128–138.
[12] K. Delac, M. Grgic, S. Grgic, Independent comparative study of PCA,
ICA, and LDA on the FERET data set, International Journal of Imaging
Systems and Technology 15 (5) (2005) 252–260.
[13] T. Cootes, G. Edwards, C. Taylor, Active appearance models, IEEE
Transaction on Pattern Analysis and Machine Intelligence 23 (6).
[14] I. Matthews, S. Baker, Active appearance models revisited, International
Journal of Computer Vision 60 (2) (2004) 135–164.
[15] A. Martinez, A. Kak, PCA versus LDA, IEEE Transaction on Pattern
Analysis and Machine Intelligence 23 (2) (2001) 228–233.
22