Multi-objective parametric optimization using the Grey...
12
Indian Journal of Engineering & Materials Sciences Vol. 24, October 2017, pp. 339-350 Multi-objective parametric optimization using the Grey-Taguchi approach for powder mixed electric discharge machining of grade-II titanium alloy with cryogenically treated electrodes Sanjeev Kumar a *, Rupinder Singh b , Ajay Batish c & T P Singh d a Department of Mechanical Engineering, Chandigarh Engineering College, Landran 140 307, India b Department of Production Engineering, Guru Nanak Dev Engineering College, Ludhiana 141 006, India c Department of Mechanical Engineering, Thapar University, Patiala 147 004, India d Symbiosis Institute of Technology, Pune 412 115, India Received 14 December 2015; accepted 6 April 2017 Electric discharge machining (EDM) is a widely accepted non-conventional machining process used for machining hard and difficult-to-machine materials by ordinary machining process. In the present work, powder mixed electric discharge machining (PMEDM) of titanium alloy (grade-II) with cryogenically treated electrodes was performed. In this paper, an attempt has been made to optimize the EDM process parameters of titanium work-piece using Grey-Taguchi approach. Experiments have been conducted under different conditions of pulse-on-time, peak current, electrode materials (copper, copper-chromium and copper-tungsten) and cryogenic treatment of electrode material. The machining characteristics such as metal removal rate (MRR), tool wear rate (TWR), surface roughness (SR) and micro-hardness (MH) are selected as the quality targets. Nine experimental runs based on L9 orthogonal array of the Taguchi design of experiment are performed. An optimal parameter combination of the EDM was obtained through grey relational analysis (GRA). The analysis of variance (ANOVA) as applied to determine the level of significance of process parameters and it is found that peak current is the most significant factor for the machining of titanium. A confirmation experiment is performed to verify the optimum process parameter condition. Experimental results show that multi-response characteristics can be improved significantly through grey relational analysis. The validation experiment show an improved material removal rate of 5.2%, surface roughness of 4.92% and micro- hardness of 12.84% when Grey-Taguchi approach is used. Though, slightly increase of 2.95% in tool wear rate is observed. Keywords: EDM, Powder, Titanium, Cryogenic treatment, Taguchi method, GRA, ANOVA. Titanium and its alloys are being used in several manufacturing industries such as aerospace, automobile, medical, defense, because of their high strength, light in weight, resistance to corrosion, and low wear rate. On the other hand, poor electrical conductivity, thermal conductivity, chemical reactivity, alloying tendency with cutting tool at high temperature make extremely difficult-to-machine with traditional machining processes 1 . It is well known that electric discharge machining (EDM) is an advanced thermo-electric machining process, which can machine any type of conductive material, irrespective of its high hardness. A series of rapid, repetitive, and randomly dispersed isolated electric sparks occur within a smallest gap between the two electrodes, i.e., work-piece and tool. At a suitable voltage the ionization of the dielectric take place due to generated sparks, known as plasma channel 1 . Due to formation of plasma channel heat energy is produced, which raise the temperature in the range of 8,000°C to 12,000°C causing melting and vaporization of the job material 2 . The types of tool material and their properties highly affect the machining performance. The high electrical conductivity, thermal conductivity, high melting point and less wear ratio are important requirements of any tool material. Copper, copper- tungsten, copper-chromium, brass, tungsten, silver tungsten and graphite are commonly used as electrode material in EDM process. The complex nature of EDM process is demanding to improve machining efficiency continuously. Therefore, to improve machining efficiency of EDM process some powder is suspended in the dielectric fluid to enhance the machining capabilities. This type of EDM process is known as powder mixed electric discharge machining (PMEDM) process. In spite of this, researchers in the past increased machining performance of traditional EDM, when the tool and work-piece are subjected to cryogenic treatment 3-4 . —————— *Corresponding author (E-mail: [email protected])
Transcript of Multi-objective parametric optimization using the Grey...
Indian Journal of Engineering & Materials Sciences Vol. 24, October 2017, pp. 339-350
Multi-objective parametric optimization using the Grey-Taguchi approach for powder mixed electric discharge machining of grade-II titanium alloy with
cryogenically treated electrodes Sanjeev Kumara*, Rupinder Singhb, Ajay Batishc & T P Singhd
aDepartment of Mechanical Engineering, Chandigarh Engineering College, Landran 140 307, India bDepartment of Production Engineering, Guru Nanak Dev Engineering College, Ludhiana 141 006, India
cDepartment of Mechanical Engineering, Thapar University, Patiala 147 004, India dSymbiosis Institute of Technology, Pune 412 115, India
Received 14 December 2015; accepted 6 April 2017
Electric discharge machining (EDM) is a widely accepted non-conventional machining process used for machining hard and difficult-to-machine materials by ordinary machining process. In the present work, powder mixed electric discharge machining (PMEDM) of titanium alloy (grade-II) with cryogenically treated electrodes was performed. In this paper, an attempt has been made to optimize the EDM process parameters of titanium work-piece using Grey-Taguchi approach. Experiments have been conducted under different conditions of pulse-on-time, peak current, electrode materials (copper, copper-chromium and copper-tungsten) and cryogenic treatment of electrode material. The machining characteristics such as metal removal rate (MRR), tool wear rate (TWR), surface roughness (SR) and micro-hardness (MH) are selected as the quality targets. Nine experimental runs based on L9 orthogonal array of the Taguchi design of experiment are performed. An optimal parameter combination of the EDM was obtained through grey relational analysis (GRA). The analysis of variance (ANOVA) as applied to determine the level of significance of process parameters and it is found that peak current is the most significant factor for the machining of titanium. A confirmation experiment is performed to verify the optimum process parameter condition. Experimental results show that multi-response characteristics can be improved significantly through grey relational analysis. The validation experiment show an improved material removal rate of 5.2%, surface roughness of 4.92% and micro-hardness of 12.84% when Grey-Taguchi approach is used. Though, slightly increase of 2.95% in tool wear rate is observed.
Keywords: EDM, Powder, Titanium, Cryogenic treatment, Taguchi method, GRA, ANOVA.
Titanium and its alloys are being used in several manufacturing industries such as aerospace, automobile, medical, defense, because of their high strength, light in weight, resistance to corrosion, and low wear rate. On the other hand, poor electrical conductivity, thermal conductivity, chemical reactivity, alloying tendency with cutting tool at high temperature make extremely difficult-to-machine with traditional machining processes1.
It is well known that electric discharge machining (EDM) is an advanced thermo-electric machining process, which can machine any type of conductive material, irrespective of its high hardness. A series of rapid, repetitive, and randomly dispersed isolated electric sparks occur within a smallest gap between the two electrodes, i.e., work-piece and tool. At a suitable voltage the ionization of the dielectric take place due to generated sparks, known as plasma channel1. Due to
formation of plasma channel heat energy is produced, which raise the temperature in the range of 8,000°C to 12,000°C causing melting and vaporization of the job material2. The types of tool material and their properties highly affect the machining performance. The high electrical conductivity, thermal conductivity, high melting point and less wear ratio are important requirements of any tool material. Copper, copper-tungsten, copper-chromium, brass, tungsten, silver tungsten and graphite are commonly used as electrode material in EDM process. The complex nature of EDM process is demanding to improve machining efficiency continuously. Therefore, to improve machining efficiency of EDM process some powder is suspended in the dielectric fluid to enhance the machining capabilities. This type of EDM process is known as powder mixed electric discharge machining (PMEDM) process. In spite of this, researchers in the past increased machining performance of traditional EDM, when the tool and work-piece are subjected to cryogenic treatment3-4.
—————— *Corresponding author (E-mail: [email protected])

INDIAN J. ENG. MATER. SCI., OCTOBER 2017
340
Chow et al.5 studied the effect of three dielectric fluids; (i) kerosene mixed with Al powder, (ii) kerosene mixed with SiC powder and (iii) simple kerosene oil in micro-slit machining of Ti-6Al-4V with thin Cu diskette electrodes and reported the significant improvement. Yan et al.6 explored the effect of urea solution (10 g/L) mixed distilled water dielectric on the pure titanium by using Cu electrode and concluded that urea mixed dielectric increased the MRR, EWR with good wear resistance surface6. Kibria et al.7 addressed the issues of various dielectrics in micro-EDM of Ti-6Al-4V and observed higher MRR when boron-carbide (B4C) powder was mixed with deionized water, but TWR decreased with B4C powder mixed kerosene. Kuriachen and Mathew8 studied the effect of suspended SiC powder in dielectric on Ti-6Al-4V work material machined with tungsten carbide tool. Significant improvement in MRR and TWR were observed with powder concentration of 0.5 g/L. Erden and Belgin9 studied the effect of impurities namely copper, aluminum, iron and carbon during EDM of brass steel and copper steel and concluded that machining rates were increased with increase in concentration of the impurities in dielectric medium. Mohri et al.10,11 and Narumiya et al.12 studied the concentration effect of Silicon (Si), Aluminum (Al) and Graphite (Gr) powders on the machining performance. Furutani et al.13 modified the surface properties of carbon steel (AISI-1049) with green compact electrode by adding Ti powder in the dielectric medium. Pecas and Henriques14 reported the significant improvement in surface quality of AISI H13 die steel using Si powder mixed dielectric. Kansal et al.15,16 investigated that Si powder mixed dielectric increased the MRR and surface finish and further reported that current and concentration of powder highly affected the performance criteria. Kumar and Singh17 examined the surface properties of OHNS die steel parts and obtained incredible improvement in machined surface hardness by 73% with no micro-cracks in Mn powder mixed kerosene liquid. Batish et al.18 reported that surface modification of parts can be achieved through the material deposition process in powder suspended dielectric. Kumar19 improved the surface finish and micro-hardness of hot die steel material H13 by using graphite powder suspended dielectric and observed significant improvement of 42% in micro-hardness and 68% in surface finish.
From the literature it is clear that machining performance can be improved by the use of powder
mixed dielectric. In spite of that material properties also affected the EDM performance. Introduction of cryogenic treatment in EDM is a new advancement to improve the properties of the electrode material. Sundaram et al.20 studied the effect of cold treated (around -150°F) and deep cryo-treated (around -300°F) copper electrode on machining performance in EDM and reported significant improvement in MRR with cryogenically treated electrode. Abdulkareem et al.21-23 conducted the experiments in cryogenic environment by introducing liquid nitrogen through the special design electrode and observed significant improvement in electrode wear, MRR and surface finish. Kumar et al.24,25 investigated the effect of cryogenically treated titanium alloys and electrodes on the EDM performance. Both work-piece of titanium alloys and electrodes of copper and their alloys were subjected to two different treatments, namely, shallow cryogenic treatment (around -110°C) and deep cryogenic treatment (around -184°C) and observed significant improvement in experimental results. Kumar et al.26 reported the effect of cryogenically treated and non treated copper electrode on Inconel 718 in additive mixed EDM and observed significant improvement in tool wear rate and wear ratio with cryogenically treated electrode.
After the comprehensive review of available literature on EDM, it is observed that few studies have been carried out using the shallow and deep cryogenically treated electrodes (copper, copper-chromium and copper-tungsten) on EDM of pure titanium (Grade II) alloy using manganese (Mn) powder mixed dielectric. Many advanced mathematical techniques have been applied by the researchers to determine optimal setting of input parameters. The main objective of this study is to optimize the process parameters namely peak current (p), pulse-on-time (on), electrode material (copper, copper-chromium and copper-tungsten) and cryogenic treatment of electrodes (untreated, shallow treated and deep treated) to maximize the material removal rate (MRR)/ surface micro-hardness (MH) and minimize the tool wear rate (TWR)/ surface roughness (SR). In this paper, optimization of parameters considering multiple machining characteristics of the EDM process to commercial available titanium alloy Ti-15 the Grey-Taguchi approach is reported. Performance characteristics such as material removal rate, tool wear rate, surface roughness and micro-hardness are chosen to evaluate the machining effects.
KUMAR et al.: POWDER MIXED ELECTRIC DISCHARGE MACHINING
341
Experimental Procedure In this experimental study, it was decided to study the
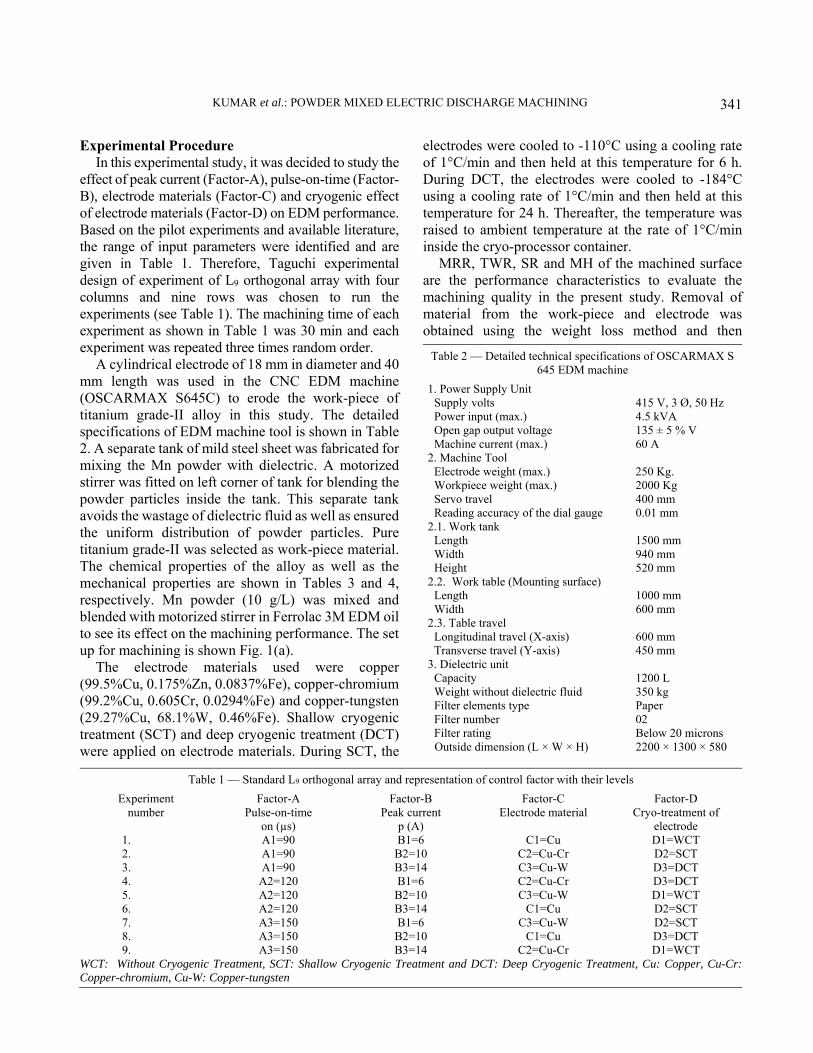
effect of peak current (Factor-A), pulse-on-time (Factor-B), electrode materials (Factor-C) and cryogenic effect of electrode materials (Factor-D) on EDM performance. Based on the pilot experiments and available literature, the range of input parameters were identified and are given in Table 1. Therefore, Taguchi experimental design of experiment of L9 orthogonal array with four columns and nine rows was chosen to run the experiments (see Table 1). The machining time of each experiment as shown in Table 1 was 30 min and each experiment was repeated three times random order.
A cylindrical electrode of 18 mm in diameter and 40 mm length was used in the CNC EDM machine (OSCARMAX S645C) to erode the work-piece of titanium grade-II alloy in this study. The detailed specifications of EDM machine tool is shown in Table 2. A separate tank of mild steel sheet was fabricated for mixing the Mn powder with dielectric. A motorized stirrer was fitted on left corner of tank for blending the powder particles inside the tank. This separate tank avoids the wastage of dielectric fluid as well as ensured the uniform distribution of powder particles. Pure titanium grade-II was selected as work-piece material. The chemical properties of the alloy as well as the mechanical properties are shown in Tables 3 and 4, respectively. Mn powder (10 g/L) was mixed and blended with motorized stirrer in Ferrolac 3M EDM oil to see its effect on the machining performance. The set up for machining is shown Fig. 1(a).
The electrode materials used were copper (99.5%Cu, 0.175%Zn, 0.0837%Fe), copper-chromium (99.2%Cu, 0.605Cr, 0.0294%Fe) and copper-tungsten (29.27%Cu, 68.1%W, 0.46%Fe). Shallow cryogenic treatment (SCT) and deep cryogenic treatment (DCT) were applied on electrode materials. During SCT, the
electrodes were cooled to -110°C using a cooling rate of 1°C/min and then held at this temperature for 6 h. During DCT, the electrodes were cooled to -184°C using a cooling rate of 1°C/min and then held at this temperature for 24 h. Thereafter, the temperature was raised to ambient temperature at the rate of 1°C/min inside the cryo-processor container.
MRR, TWR, SR and MH of the machined surface are the performance characteristics to evaluate the machining quality in the present study. Removal of material from the work-piece and electrode was obtained using the weight loss method and then
Table 1 — Standard L9 orthogonal array and representation of control factor with their levels Experiment
number Factor-A Factor-B Factor-C Factor-D
Pulse-on-time on (µs)
Peak current p (A)
Electrode material Cryo-treatment of electrode
1. A1=90 B1=6 C1=Cu D1=WCT 2. A1=90 B2=10 C2=Cu-Cr D2=SCT 3. A1=90 B3=14 C3=Cu-W D3=DCT 4. A2=120 B1=6 C2=Cu-Cr D3=DCT 5. A2=120 B2=10 C3=Cu-W D1=WCT 6. A2=120 B3=14 C1=Cu D2=SCT 7. A3=150 B1=6 C3=Cu-W D2=SCT 8. A3=150 B2=10 C1=Cu D3=DCT 9. A3=150 B3=14 C2=Cu-Cr D1=WCT
WCT: Without Cryogenic Treatment, SCT: Shallow Cryogenic Treatment and DCT: Deep Cryogenic Treatment, Cu: Copper, Cu-Cr: Copper-chromium, Cu-W: Copper-tungsten
Table 2 — Detailed technical specifications of OSCARMAX S 645 EDM machine
1. Power Supply Unit Supply volts 415 V, 3 Ø, 50 Hz Power input (max.) 4.5 kVA Open gap output voltage 135 ± 5 % V Machine current (max.) 60 A
2. Machine Tool Electrode weight (max.) 250 Kg. Workpiece weight (max.) 2000 Kg Servo travel 400 mm Reading accuracy of the dial gauge 0.01 mm
2.1. Work tank Length 1500 mm Width 940 mm Height 520 mm
2.2. Work table (Mounting surface) Length 1000 mm Width 600 mm
2.3. Table travel Longitudinal travel (X-axis) 600 mm Transverse travel (Y-axis) 450 mm
3. Dielectric unit Capacity 1200 L Weight without dielectric fluid 350 kg Filter elements type Paper Filter number 02 Filter rating Below 20 microns Outside dimension (L × W × H) 2200 × 1300 × 580

INDIAN J. ENG. MATER. SCI., OCTOBER 2017
342
converted into volumetric loss (mm3/min). Precision digital weighing machine as shown in Fig. 1(b) was used to measure the weight of worn electrode and work-piece material to determine the MRR and TWR. The MRR is defined by the volume of work-piece in the period of machining time in minute (refer Eq.(1)). TWR uses the same weighing machine that accounts for volumetric loss of electrode material per unit machining time as shown by Eq. (2).
To assess MRR and TWR, Eqs (1) and (2), are used respectively:
3
3
Loss in weight of workpiece (g) ×1000mm /min =
Density of workpiece material
(g/cm ) Machining time (min)
MRR
… (1)
33
Loss in weight of tool material (g) ×1000mm /min =
Density of tool material (g/cm ) Machining time (min)
TWR
… (2)
In the experiments, the surface roughness was measured in terms of arithmetic average deviation (Ra in microns) of the machined parts using MITUTOYO Surface Roughness Tester (model: Surf test SJ-400) at a cut off length of 0.8 mm as shown in Fig. 1(c). The micro-hardness of the machined surface was measured on micro-hardness tester, Model HVS-1000B as shown in Fig. 1(d). During the micro-hardness test, the indentation was made using a diamond indenter of pyramid shape under a test force of 9.807 N and dwell time of 10 s. Three sets of nine experiments were performed in random order to reduce the effect of variability according to L9 orthogonal array (refer Table 1) and observed results are given in Table 5.
Results and Discussion Basically, the MRR and micro-hardness are the
category of ‘higher-the-better’ performance characteristic in the Taguchi method, and both TWR and SR are that of the ‘smaller-the-better’ quality characteristic in EDM process. Thereafter, the loss function was converted in to signal-to-noise (S/N) ratio. The S/N ratio of the higher-the-better and
Table 3 — Chemical composition of grade-II titanium alloy
Element Wt% C 0.015 N 0.0052 H 0.0005 Fe 0.04 O 0.106 Ti Balance
Table 4 — Mechanical properties of grade-II titanium alloy Properties Value Atomic number 22 Atomic weight 47.9 Density (g/cm3) 4.54 Ultimate tensile strength (MPa) 345 Yield strength (MPa) 276 Elongation (%) at break 20 Hardness (Rockwell) 80 Hardness (Vickers) 145 Modulus of elasticity (GPa) 105 Fatigue Strength (MPa) 300 Melting point (°C) 1668 Boiling point (°C) 3260
Fig.1 – (a) PMEDM set up, (b) digital weighing machine, (c)surface roughness tester and (d) micro-hardness tester
Table 5 — Experimental results for MRR, TWR, SR and MH for machining tests Exp. No.
Material removal rate (mm3/min)
Tool wear rate (mm3/min)
Surface roughness (Ra in micron)
Micro-hardness (HVN)
R1 R2 R3 R1 R2 R3 R1 R2 R3 R1 R2 R3 1 0.545 0.536 0.552 0.1156 0.1054 0.1192 3.75 4.45 3.52 350 335 315 2 1.005 1.107 0.985 0.2154 0.2342 0.2476 4.91 5.31 4.75 435 480 468 3 1.425 1.417 1.435 0.4174 0.3987 0.4097 5.92 5.65 5.63 564 505 492 4 0.903 0.915 0.895 0.0746 0.0725 0.0710 3.69 4.12 3.95 410 432 445 5 1.315 1.296 1.305 0.3589 0.3675 0.3785 5.69 5.75 5.85 486 465 495 6 1.426 1.445 1.45 0.4095 0.4107 0.4124 5.67 5.75 6.25 545 575 564 7 0.825 0.805 0.815 0.0478 0.0502 0.0495 4.95 5.05 4.85 455 474 440 8 1.417 1.435 1.443 0.1776 0.1682 0.1576 5.15 4.25 4.52 505 495 542 9 1.405 1.435 1.396 0.4564 0.4325 0.4267 8.35 7.35 8.75 535 545 490

KUMAR et al.: POWDER MIXED ELECTRIC DISCHARGE MACHINING
343
smaller-the-better quality characteristics can be expressed by Eqs (3) and (4), respectively.
… (3)
… (4)
Where yi represent the experimentally observed value of the ith experiment, n is the repeated number of each experiment. The unit of calculated S/N ratio from the observed values is the decibel (dB) and is denoted by η. Material removal rate (MRR)
Table 5 shows the experimental results in terms of R1, R2 and R3 (three observation) for MRR. Based on three observations, ANOVA has been performed and corresponding results are given in Table 6, where the contribution of each machining parameter was calculated. It can be seen that peak current significantly affects the MRR with 78.21% of the contribution ratio,
and followed the pulse-on-time with 13.14% contribution. Significant effect of cryogenic treatment of electrode materials was observed on MRR with 7.02% contribution. A little effect of electrode material was observed on MRR (1.63%). Neglecting effect of electrode material pooled ANOVA is performed and results are given in Table 7.
The main effects plot for S/N ratios and means of MRR were derived using Minitab 17 software. The S/N response graph and means graph are plotted in Figs 2 and 3, respectively. For the response characteristic MRR, the A2B3C3D3 parameters including a pulse-on-time 120 µs, peak current of 14 amp, copper-tungsten electrode and deep cryogenic treatment of electrode as shown in Figs 2 and 3 can lead to higher MRR. From Figs 2 and 3, it can be clearly seen that peak current (factor B) highly affect the MRR in EDM of titanium alloy. Figures 2 and 3 show that the MRR increases with an increase in the peak current. High value of peak current strengthens the discharge energy, thus, remove more metal easily form work-piece surface in form of craters. As current increases from 6 A, MRR sharply increases up to 10 A, thereafter, at higher values of
Table 6 — ANOVA results of S/N ratio for response parameter MRR Control factors DOF Seq. SS Adj. SS Adj. MS Percent
contribution Remarks
Pulse-on-time 2 9.206 9.2063 4.603 13.14 Significant Peak current 2 54.796 54.796 27.398 78.21 Most significant Electrode material 2 1.1410 1.141 0.570 1.63 Less significant Cryo-treatment of electrode 2 4.917 4.917 2.458 7.02 Significant Residual error 0 Total 8 70.061
Table 7 — Pooled ANOVA results of S/N ratio for response parameter MRR Control factors DOF Seq. SS Adj. SS Adj. MS Percent
contribution Remarks
Pulse-on-time 2 9.206 9.2063 4.603 13.14 Significant Peak current 2 54.796 54.796 27.398 78.21 Most significant Cryo-treatment of electrode 2 4.917 4.917 2.458 7.02 Significant Residual error 2 1.1410 1.141 0.570 Total 8 70.061
Fig. 2 — Main effect plots for S/N ratios of MRR
Fig. 3 — Main effect plots for means of MRR

INDIAN J. ENG. MATER. SCI., OCTOBER 2017
344
current, i.e., from 10 A to 14 A, the rate of MRR decreases as compared to 6 A to 10 A. It means MRR is less when machining was performed in the range of 10 A to14 A. The thermal energy in the machining zone increases up to a certain limit. MRR was also affected by the pulse duration, because during this period electric energy in the form of current was applied in the spark zone. MRR increases with increase in pulse-on-time from 90 µs to 120 µs and at longer pulse duration it decreases. Machining with higher current and longer
on-time leads to arcing, resulting in unstable machining, resulting in low MRR. Further, at high current and longer on-time, more carbon cracked from the dielectric fluid and formed hard titanium carbide (TiC) compound on the machined surface, which has a higher melting point than titanium, thus, reducing the MRR. DCT Cu-W electrode shows higher MRR than Cu and Cu-Cr electrode as shown in Figs 2 and 3. DCT electrode highly influences the MRR followed by SCT electrodes; because DCT process increased the thermo-electrical properties of electrode material resulted in less TWR and higher MRR. Tool wear rate (TWR)
Table 5 shows the experimental values of TWR based on orthogonal array after machining of Ti alloy, whose ANOVA results are given in Table 8. After seeing the contribution of individual process parameter listed in ANOVA Table 8, as expected peak current dominates the TWR with contribution of 87.65% followed by cryogenic treatment of electrode with contribution of 7.3%. The electrode material had negligible effect on TWR and pulse-on-time has little effect (5%) on TWR in comparison of other parameters. Table 9 shows the pooled ANOVA after neglecting the effect of electrode material. The S/N response graph and means graph of TWR against input parameters are shown in Figs 4 and 5, respectively.
In EDM, the discharge energy is increased by increasing the amount of current and pulse-on-time. Due to this increased spark energy, more metal is removed from the bottom surface of the tool in form of small craters as compared to work-piece surface, resulting in higher tool wear. The S/N response graph
Fig. 4 – Main effect plots for S/N ratios of TWR
Fig. 5 – Main effect plots for means of TWR
Table 8 — ANOVA results of S/N ratio for response parameter TWR Control factors DOF Seq. SS Adj. SS Adj. MS Percent
contribution Remarks
Pulse-on-time 2 20.340 20.340 10.170 5.01 Significant Peak current 2 355.839 355.839 177.920 87.65 Most significant Electrode material 2 0.052 0.052 0.026 0.01 Not significant Cryo-treatment of electrode 2 29.775 29.775 14.888 7.33 Significant Residual error 0 Total 8 406.006
Table 9 — Pooled ANOVA results of S/N ratio for response parameter TWR Control factors DOF Seq. SS Adj. SS Adj. MS Percent
contribution Remarks
Pulse-on-time 2 20.340 20.340 10.170 5.01 Significant Peak current 2 355.839 355.839 177.920 87.65 Most significant Cryo-treatment of electrode 2 29.775 29.775 14.888 7.33 Significant Residual error 2 0.052 0.052 0.026 Total 8 406.006

KUMAR et al.: POWDER MIXED ELECTRIC DISCHARGE MACHINING
345
in Fig. 4 and means graph in Fig. 5 show that the TWR decreases upon decreasing the peak current. In other words, lower value of peak current is the key factor for low TWR in EDM of Ti grade-II alloy. By observing slope of TWR in Figs 4 and 5, it can be seen that in higher range of on-time from 120 µs to 150 µs, value of TWR decreases. It is because of the expansion of plasma channel. The means graph in Fig. 5 shows that the TWR decreases with deep cryogenic treatment of tool material as compared to without cryogenic treatment of electrode. It means DCT electrode wear less. The significant effect of cryo-treatment of the electrode was observed as it can be seen in Figs 4 and 5, and ANOVA Table 8. Figure 5 shows the combination of process parameters A3B1C1D3 including the pulse-on-time 150 µs, peak current 6 A and deep cryogenic treated copper electrode contribution in low TWR.
Surface roughness (SR) Surface roughness with its experimental values and
the corresponding ANOVA results are respectively given in Tables 5 and 10. The results of ANOVA table shows the peak current (66.92%), cryogenic treatment of electrode material (13.10%), pulse-on-time (11.08%) and electrode material (8.90%) contribute significantly. From the ANOVA results, it is found that peak current has a leading effect on surface roughness.
The S/N response plots (Fig. 6) and means graph (Fig. 7) the surface roughness increases upon increasing the amperes of peak current and duration of on-time. It directs that better surface finish can be obtained under a lower peak current with smaller pulse duration due to the lower power erosion process. Furthermore, positive polarity electrode causes a removal of the material in the form of small craters. Thus, surface roughness of machined parts improved. Low current (6 A), smaller pulse-on-time (90 µs) and DCT copper electrode material can results in an optimal outcome which gives better surface finish. In other words, EDM with low current, shorter pulse duration and DCT electrode material is removed material from surface in smaller size of craters, thereby improving the surface finish. Micro-hardness (MH)
Micro-hardness directly influences the life of machined parts. Micro-hardness is an appropriate indicator of the changes taking place in the machined surface after EDM process. For low wear of machined surface, higher micro-hardness of machined surface is required. Therefore, a ‘higher-the-better’ quality characteristic of loss function micro-hardness is chosen. The micro-hardness of titanium work-piece for each of the nine trials is listed in Table 5. The ANOVA results based on “larger the better” response characteristic was completed using Minitab 17 and results are given in Table 11. Tables 5 and 11 show the discharge current (65.32%), pulse-on-time (19.56%), cryogenic treatment of electrode material (12.5%) and electrode material (2.63%) contribute significantly.
Fig. 6 — Main effect plots for S/N ratios of SR
Fig. 7 — Main effect plots for means of SR
Table 10 — ANOVA results of S/N ratio for response parameter SR Control factors DOF Seq. SS Adj. SS Adj. MS Percent
Contribution Remarks
Pulse-on-time 2 3.4670 3.4670 1.7335 11.08 Significant Peak current 2 20.9332 20.9332 10.4666 66.92 Most significant Electrode material 2 2.7827 2.7827 1.3913 8.90 Less significant Cryo-treatment of electrode 2 4.0973 4.0973 2.0486 13.10 Significant Residual error 0 Total 8 31.2801
INDIAN J. ENG. MATER. SCI., OCTOBER 2017
346
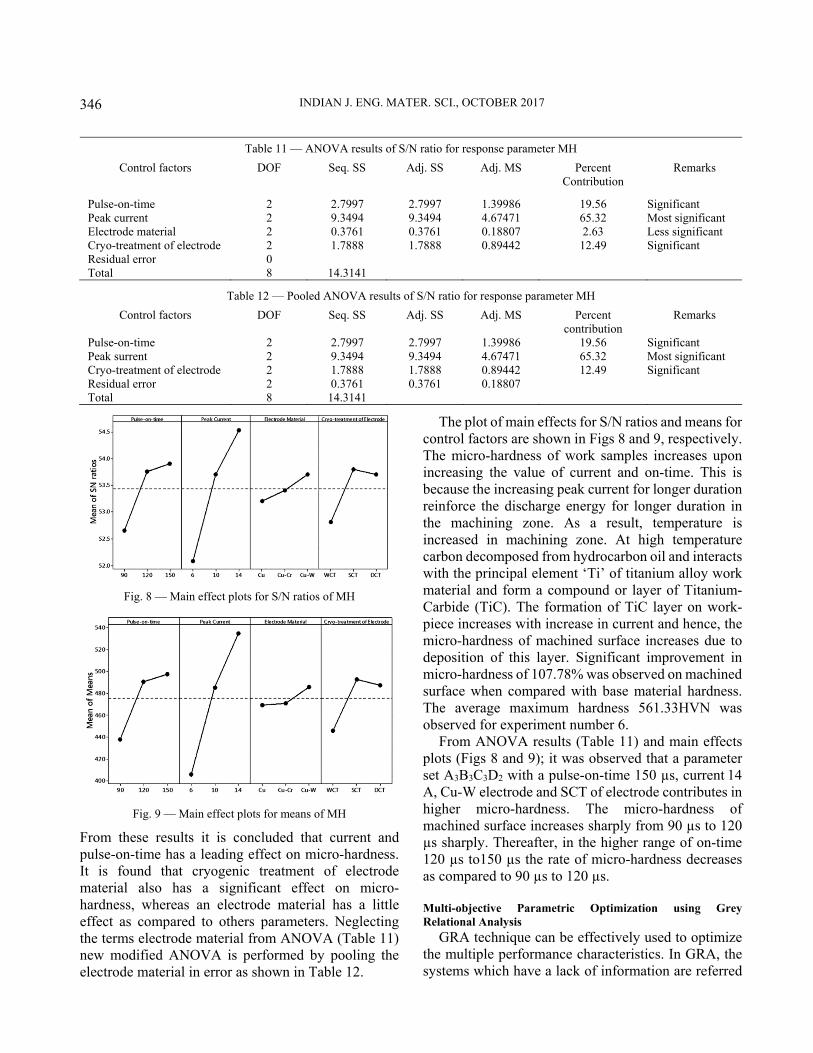
From these results it is concluded that current and pulse-on-time has a leading effect on micro-hardness. It is found that cryogenic treatment of electrode material also has a significant effect on micro-hardness, whereas an electrode material has a little effect as compared to others parameters. Neglecting the terms electrode material from ANOVA (Table 11) new modified ANOVA is performed by pooling the electrode material in error as shown in Table 12.
The plot of main effects for S/N ratios and means for control factors are shown in Figs 8 and 9, respectively. The micro-hardness of work samples increases upon increasing the value of current and on-time. This is because the increasing peak current for longer duration reinforce the discharge energy for longer duration in the machining zone. As a result, temperature is increased in machining zone. At high temperature carbon decomposed from hydrocarbon oil and interacts with the principal element ‘Ti’ of titanium alloy work material and form a compound or layer of Titanium-Carbide (TiC). The formation of TiC layer on work-piece increases with increase in current and hence, the micro-hardness of machined surface increases due to deposition of this layer. Significant improvement in micro-hardness of 107.78% was observed on machined surface when compared with base material hardness. The average maximum hardness 561.33HVN was observed for experiment number 6.
From ANOVA results (Table 11) and main effects plots (Figs 8 and 9); it was observed that a parameter set A3B3C3D2 with a pulse-on-time 150 µs, current 14 A, Cu-W electrode and SCT of electrode contributes in higher micro-hardness. The micro-hardness of machined surface increases sharply from 90 µs to 120 µs sharply. Thereafter, in the higher range of on-time 120 µs to150 µs the rate of micro-hardness decreases as compared to 90 µs to 120 µs.
Multi-objective Parametric Optimization using Grey Relational Analysis
GRA technique can be effectively used to optimize the multiple performance characteristics. In GRA, the systems which have a lack of information are referred
Table 11 — ANOVA results of S/N ratio for response parameter MH Control factors DOF Seq. SS Adj. SS Adj. MS Percent
Contribution Remarks
Pulse-on-time 2 2.7997 2.7997 1.39986 19.56 Significant Peak current 2 9.3494 9.3494 4.67471 65.32 Most significant Electrode material 2 0.3761 0.3761 0.18807 2.63 Less significant Cryo-treatment of electrode 2 1.7888 1.7888 0.89442 12.49 Significant Residual error 0 Total 8 14.3141
Table 12 — Pooled ANOVA results of S/N ratio for response parameter MH Control factors DOF Seq. SS Adj. SS Adj. MS Percent
contribution Remarks
Pulse-on-time 2 2.7997 2.7997 1.39986 19.56 Significant Peak surrent 2 9.3494 9.3494 4.67471 65.32 Most significant Cryo-treatment of electrode 2 1.7888 1.7888 0.89442 12.49 Significant Residual error 2 0.3761 0.3761 0.18807 Total 8 14.3141
Fig. 8 — Main effect plots for S/N ratios of MH
Fig. 9 — Main effect plots for means of MH
KUMAR et al.: POWDER MIXED ELECTRIC DISCHARGE MACHINING
347
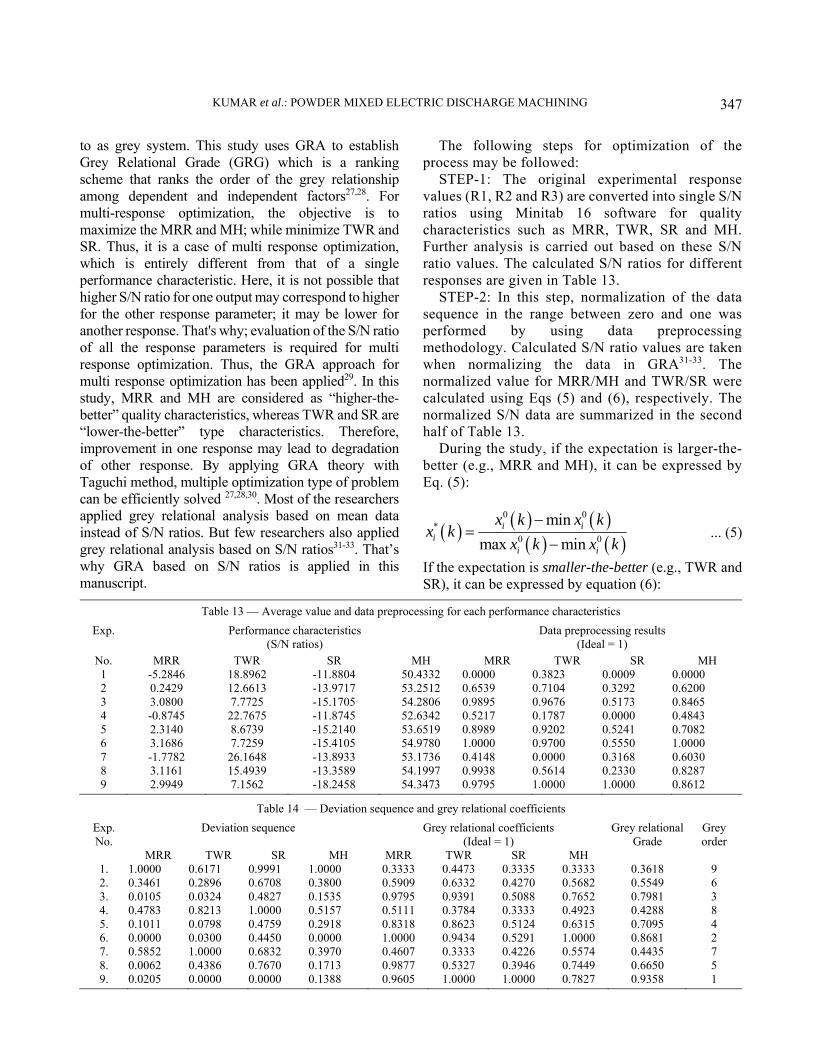
to as grey system. This study uses GRA to establish Grey Relational Grade (GRG) which is a ranking scheme that ranks the order of the grey relationship among dependent and independent factors27,28. For multi-response optimization, the objective is to maximize the MRR and MH; while minimize TWR and SR. Thus, it is a case of multi response optimization, which is entirely different from that of a single performance characteristic. Here, it is not possible that higher S/N ratio for one output may correspond to higher for the other response parameter; it may be lower for another response. That's why; evaluation of the S/N ratio of all the response parameters is required for multi response optimization. Thus, the GRA approach for multi response optimization has been applied29. In this study, MRR and MH are considered as “higher-the-better” quality characteristics, whereas TWR and SR are “lower-the-better” type characteristics. Therefore, improvement in one response may lead to degradation of other response. By applying GRA theory with Taguchi method, multiple optimization type of problem can be efficiently solved 27,28,30. Most of the researchers applied grey relational analysis based on mean data instead of S/N ratios. But few researchers also applied grey relational analysis based on S/N ratios31-33. That’s why GRA based on S/N ratios is applied in this manuscript.
The following steps for optimization of the process may be followed:
STEP-1: The original experimental response values (R1, R2 and R3) are converted into single S/N ratios using Minitab 16 software for quality characteristics such as MRR, TWR, SR and MH. Further analysis is carried out based on these S/N ratio values. The calculated S/N ratios for different responses are given in Table 13.
STEP-2: In this step, normalization of the data sequence in the range between zero and one was performed by using data preprocessing methodology. Calculated S/N ratio values are taken when normalizing the data in GRA31-33. The normalized value for MRR/MH and TWR/SR were calculated using Eqs (5) and (6), respectively. The normalized S/N data are summarized in the second half of Table 13.
During the study, if the expectation is larger-the-better (e.g., MRR and MH), it can be expressed by Eq. (5):
0 0*
0 0
minmax min
i ii
i i
x k x kx k
x k x k
... (5)
If the expectation is smaller-the-better (e.g., TWR and SR), it can be expressed by equation (6):
Table 13 — Average value and data preprocessing for each performance characteristics Exp. Performance characteristics
(S/N ratios) Data preprocessing results
(Ideal = 1) No. MRR TWR SR MH MRR TWR SR MH 1 -5.2846 18.8962 -11.8804 50.4332 0.0000 0.3823 0.0009 0.0000 2 0.2429 12.6613 -13.9717 53.2512 0.6539 0.7104 0.3292 0.6200 3 3.0800 7.7725 -15.1705 54.2806 0.9895 0.9676 0.5173 0.8465 4 -0.8745 22.7675 -11.8745 52.6342 0.5217 0.1787 0.0000 0.4843 5 2.3140 8.6739 -15.2140 53.6519 0.8989 0.9202 0.5241 0.7082 6 3.1686 7.7259 -15.4105 54.9780 1.0000 0.9700 0.5550 1.0000 7 -1.7782 26.1648 -13.8933 53.1736 0.4148 0.0000 0.3168 0.6030 8 3.1161 15.4939 -13.3589 54.1997 0.9938 0.5614 0.2330 0.8287 9 2.9949 7.1562 -18.2458 54.3473 0.9795 1.0000 1.0000 0.8612
Table 14 — Deviation sequence and grey relational coefficients Exp. No.
Deviation sequence Grey relational coefficients (Ideal = 1)
Grey relational Grade
Grey order
MRR TWR SR MH MRR TWR SR MH 1. 1.0000 0.6171 0.9991 1.0000 0.3333 0.4473 0.3335 0.3333 0.3618 9 2. 0.3461 0.2896 0.6708 0.3800 0.5909 0.6332 0.4270 0.5682 0.5549 6 3. 0.0105 0.0324 0.4827 0.1535 0.9795 0.9391 0.5088 0.7652 0.7981 3 4. 0.4783 0.8213 1.0000 0.5157 0.5111 0.3784 0.3333 0.4923 0.4288 8 5. 0.1011 0.0798 0.4759 0.2918 0.8318 0.8623 0.5124 0.6315 0.7095 4 6. 0.0000 0.0300 0.4450 0.0000 1.0000 0.9434 0.5291 1.0000 0.8681 2 7. 0.5852 1.0000 0.6832 0.3970 0.4607 0.3333 0.4226 0.5574 0.4435 7 8. 0.0062 0.4386 0.7670 0.1713 0.9877 0.5327 0.3946 0.7449 0.6650 5 9. 0.0205 0.0000 0.0000 0.1388 0.9605 1.0000 1.0000 0.7827 0.9358 1
INDIAN J. ENG. MATER. SCI., OCTOBER 2017
348
0 0*
0 0
maxmax min
i ii
i i
x k x kx k
x k x k
… (6)
Where *
ix k is the value after grey relational generation;
0min ix k is the smallest value of 0ix k ;
0max ix k is the largest value of 0ix k .
STEP-3: In this step, the deviation sequence was calculated by subtracting respective normalized value from one, and is listed in the first half of Table 14.
STEP-4: In this step, from the deviation sequence, a grey relational coefficient can be calculated using Eq. (7). The calculated grey relational coefficient is summarized in Table 14 for each response.
The grey relational coefficient [ i k ] can be calculated by using Eq. (7):
min max
0 maxi
i
kk
… (7)
Where , *ix k denotes the reference sequence; *( )jx k
denotes the comparability sequence; 0 1 is the distinguishing coefficient, 0.5 is widely accepted;
* *0 0i ix k x k is the difference in absolute value
between *0x k and *
ix k ;
* *min 0min min j
j i kx k x k
is the smallest value of
0i ; * *max 0max max j
j i kx k x k
is the
largest value of 0i .
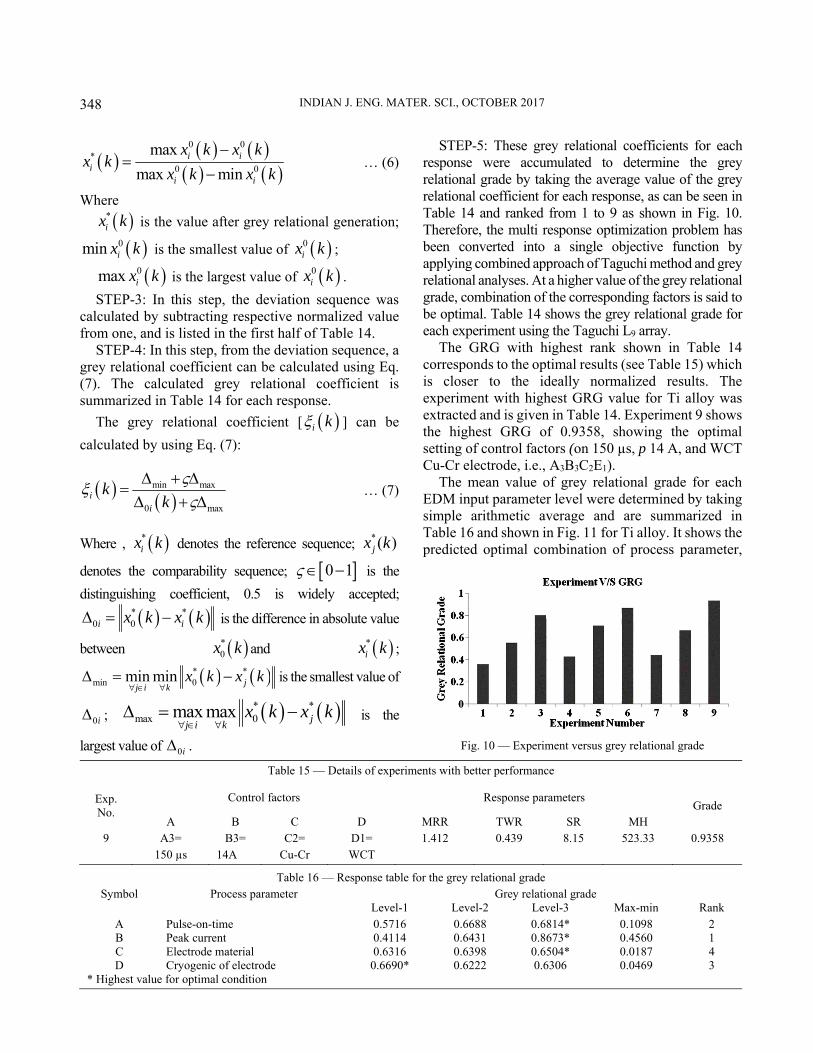
STEP-5: These grey relational coefficients for each response were accumulated to determine the grey relational grade by taking the average value of the grey relational coefficient for each response, as can be seen in Table 14 and ranked from 1 to 9 as shown in Fig. 10. Therefore, the multi response optimization problem has been converted into a single objective function by applying combined approach of Taguchi method and grey relational analyses. At a higher value of the grey relational grade, combination of the corresponding factors is said to be optimal. Table 14 shows the grey relational grade for each experiment using the Taguchi L9 array.
The GRG with highest rank shown in Table 14 corresponds to the optimal results (see Table 15) which is closer to the ideally normalized results. The experiment with highest GRG value for Ti alloy was extracted and is given in Table 14. Experiment 9 shows the highest GRG of 0.9358, showing the optimal setting of control factors (on 150 µs, p 14 A, and WCT Cu-Cr electrode, i.e., A3B3C2E1).
The mean value of grey relational grade for each EDM input parameter level were determined by taking simple arithmetic average and are summarized in Table 16 and shown in Fig. 11 for Ti alloy. It shows the predicted optimal combination of process parameter,
Table 15 — Details of experiments with better performance
Exp. No.
Control factors Response parameters Grade
A B C D MRR TWR SR MH 9 A3=
150 µs B3=
14A C2=
Cu-Cr D1= WCT
1.412 0.439 8.15 523.33 0.9358
Table 16 — Response table for the grey relational grade Symbol Process parameter Grey relational grade
Level-1 Level-2 Level-3 Max-min Rank A Pulse-on-time 0.5716 0.6688 0.6814* 0.1098 2 B Peak current 0.4114 0.6431 0.8673* 0.4560 1 C Electrode material 0.6316 0.6398 0.6504* 0.0187 4 D Cryogenic of electrode 0.6690* 0.6222 0.6306 0.0469 3
* Highest value for optimal condition
Fig. 10 — Experiment versus grey relational grade

KUMAR et al.: POWDER MIXED ELECTRIC DISCHARGE MACHINING
349
and it is A3 (pulse-on-time, 150 µs), B3 (current, 14 A), C3 (electrode material, Cu-W) and D1 (cryogenic treatment of electrode, WCT). Table 17 shows the ANOVA results based on grey relational grade. It indicates that peak current is the most influential process parameter in EDM of titanium alloy affecting performance characteristics followed by pulse-on-time. Confirmation Tests
As the combination of optimal parameter was obtained, the confirmation test was performed to verify the improvement in the selected performance characteristics. The results of confirmation experiments were compared with the outcome of the orthogonal array and grey predicted results of the identified parameters. Table 18 shows the comparative results using of the initial results from the Table 15 (A3B3C2D1) for trial 9 and grey theory optimal design shown in Table 16 (A3B3C3D1) process parameters and actual experimental results obtained at grey theory predicted optimal parameters setting in EDM of Ti alloy work-piece material. Table 18 shows the MRR
increased from 1.412 mm3/min to 1.485 mm3/min, the TWR slightly increased from 0.439 mm3/min to 0.452 mm3/min, SR decreased from 8.150 Ra (micron) to 7.750 Ra (micron) and MH increased from 523.33 HVN to 590.5 HVN, respectively. The main effects plot based on grey relational grade derived using Minitab software is shown in Fig. 11. The predicted value and experimental value of each response are given in Table 9, and the obtained results are found within the acceptable limit. Conclusions
This paper presents the multi-objective optimization of EDM machining parameters of pure titanium (ASTM grade-II). An application of Taguchi method and grey relational analysis has been reported in this paper to optimize the process parameters with multiple performance characteristics namely MRR, TWR, SR and MH. GRA technique converts the multi response variable to a single response, termed as grey relational grade. Consequently, combination of Taguchi methodology and grey relational approach really simplifies the critical multi performance characteristics. Set of process parameters A2B3C3D3 including a pulse-on-time 120 µs, peak current of 14 A, copper-tungsten electrode and deep cryogenic treatment of electrode can lead to higher MRR. Combination of process parameters A3B1C1D3 including the pulse-on-time 150 µs, peak current 6 A and deep cryogenic treated copper electrode contribution in low TWR. Low current (6 A), smaller pulse-on-time (90 µs) and DCT copper electrode material can results in an optimal outcome which gives better surface finish. A parameter set A3B3C3D2 with a
Table 17 — ANOVA results based on grey relational grade Control factors DOF Seq. SS Adj. SS Adj. MS Remarks
Pulse-on-time 2 0.02167 0.02167 0.01083 Significant Peak current 2 0.31188 0.31188 0.15594 Most significant Electrode material 2 0.00053 0.00053 0.00026 Less significant Cryo-treatment of electrode 2 0.00374 0.00374 0.00187 Less Significant Residual error 0 Total 8 0.33783
Table 18 — Performance results using the initial orthogonal array and optimal grey predicted process parameter Response
parameters Optimal process parameters
Orthogonal array results
Grey theory prediction Experimental
A3B3C2D1 A3B3C3D1 A3B3C3D1 MRR (mm3/min) 1.412 1.477 1.485 TWR (mm3/min) 0.439 0.467 0.452 SR (Ra in micron) 8.15 7.945 7.750
MH (HVN) 523.33 578.83 590.500
Fig. 11 — Grey relational grade plot

INDIAN J. ENG. MATER. SCI., OCTOBER 2017
350
pulse-on-time 150 µs, current 14 A, Cu-W electrode and SCT of electrode contributes in higher micro-hardness.
The optimal process parameters (A3B3C3D1) based on GRA include 150 µs pulse-on-time, 14 A peak current, Cu-W electrode and without cryogenic treated. The experimental result for the optimal setting shows good agreement with the predicted results. The comparative results revealed that MRR increased from 1.412 mm3/min to 1.485 mm3/min (5.2%), the TWR slightly increased from 0.439 mm3/min to 0.452 mm3/min (2.95%), SR decreased from 8.150 Ra (micron) to 7.750 Ra (micron) (4.92%) and MH increased from 523.33HVN to 590.5HVN (12.82%) respectively. From experimental results it is concluded that peak current has the stronger effect followed by pulse-on-time in EDM of titanium. Cryogenic treatment of electrode also shows significant effect on multi performance characteristics. Electrode material had little effect on machining performance as indicated by the results. DCT copper-tungsten electrode affects MRR and DCT, while copper electrode affects surface roughness in a positive manner. References 1 Hascalik A & Caydas U, Appl Surf Sci, 253 (2007) 9007-9016. 2 Ho K H and Newman S T, Int J Mach Tools Manuf, 43 (2003)
1287-1300. 3 Hong S Y, Ding Y & Jeong W, Int J Mach Tools Manuf,
41 (2001) 2271-2285. 4 Venugopal K A, Paul S & Chattopadhyay A B, Cryogenics,
47 (2007) 12-18. 5 Chow H M, Yan B H, Huang F Y & Hung J C, Mater Process
Technol, 101 (2000) 95-103. 6 Yan B H, Tsai H C & Huang F Y, Int J Mach Tools Manuf ,
45 (2005) 194–200. 7 Kibria G, Sarkar B R, Pradhan B B & Bhattacharyya B, Int J
Adv Manuf Technol, 48 (2010) 557-570. 8 Kuriachen B & Mathew J, (2015) DOI:
10.1080/10426914.2015.1004705. 9 Erden A & Bilgin S, Proc 21st Int Machine Tool Design and
Research Conf., (Macmillan, London), (1980) 345-350. 10 Mohri N, Saito N & Higashi M, Ann CIRP, 40(1) (1980)
207-210.
11 Mohri N, Saito N & Suzuki M, in Proc Winter Annual Meeting of the ASME- Research and Technological Development in Nontraditional Machining, Chicago, 34 (1988) 21-30.
12 Narumiya H, Mohri N, Saito N, Ootake H, Tsunekawa Y, Takawashi T & Kobayashi K, in EDM Technology Transfer (ed) Proc 9th Int Symp for Electro machining – ISEM IX, Nagoya, (1989) 5-8.
13 Furutani K, Saneto A, Takezawa H, Mohri N & Miyake H, Prec Eng, 25 (2001) 138-144.
14 Pecas P & Henriques E, Int J Mach Tools Manuf, 43 (2003) 1465-1471.
15 Kansal H K, Singh S & Kumar P, Indian J Eng Mater Sci, 13 (2006) 209-216.
16 Kansal H K, Singh S & Kumar P, J Mater Process Technon, 169(3) (2005) 427-436.
17 Kumar S & Singh R, Int J Adv Manuf Technol 50 (2010) 625–633.
18 Batish A, Bhattacharya A, Singla V K & Singh G Mater Manuf Process, 27 (2012) 449-456.
19 Kumar S ASME 2014 Int Mechanical Engineering Congress and Exposition, (2014) DOI: 10.1115/IMECE2014-37890.
20 Sundaram M M, Yildiz Y & Rajurkar K P, in Int Manufacturing Science and Engineering Conf, West Lafayette, IN, October 4–7, 2009.
21 Abdulkareem S, Khan A A & Konneh M, Int J Adv Manuf Technon, 45 (11-12) (2009) 1146-1151.
22 Abdulkareem S, Khan A A & Konneh M, Adv Mater Res, 83-86 (2010) 672–679.
23 Abdulkareem S Khan A A & Konneh M, Mater Manuf Process, 25(6) (2010) 462–466.
24 Kumar S, Batish A, Singh R & Singh T P, J Mech Sci Technol, 28(7) (2014) 2831-2844.
25 Kumar S, Batish A, Singh R & Singh T P, Proc Inst Mech Eng, Part B: J Eng Manuf, 229(2) (2015) 214-228.
26 Kumar A, Maheshwari S, Sharma C & Beri N, Mater Manuf Process, 27 (2012) 1051-1058.
27 Deng J, Syst Control Lett, 1 (1982) 288-294. 28 Deng J, J Grey Syst, 1 (1989) 1-24. 29 Lin J L & Lin C L, Int J Mach Tools Manuf, 42 (2002)
237-244. 30 Meena V K & Azad M S, Mater Manu Process, 27 (2012)
973-977. 31 Jaswin M A & Lal D M, Mater Manuf Process, 25 (2010)
842-850. 32 Raghuraman S, Thiruppathi K, Panneerselvam T & Santosh S,
Int J Innov Res Sci, Eng and Technol, 2(7) (2013) 3095-3104. 33 Jailani H S, Rajadurai A, Mohan B, Kumar A S & Sornakumar
T, Int J Adv Manuf Technol, 45 (2009) 362-369.