Multi-modal User Authentication Using Biometrics William ...
61
Multi-modal User Authentication Using Biometrics by William Cheung BSc, Stony Brook University, 2016 DISSERTATION SUBMITTED IN PARTIAL FULFILLMENT OF THE REQUIREMENTS FOR THE DEGREE OF MASTERS OF DATA SCIENCE IN THE DEPARTMENT OF COMPUTER AND INFORMATION SCIENCE AT FORDHAM UNIVERSITY NEW YORK February, 2021
Transcript of Multi-modal User Authentication Using Biometrics William ...
Multi-modal User Authentication Using Biometrics
by
William Cheung
BSc, Stony Brook University, 2016
DISSERTATION
SUBMITTED IN PARTIAL FULFILLMENT OF THE REQUIREMENTS
FOR THE
DEGREE OF MASTERS OF DATA SCIENCE
IN THE DEPARTMENT OF COMPUTER AND INFORMATION
SCIENCE AT
FORDHAM UNIVERSITY
NEW YORK
February, 2021

ACKNOWLEDGEMENTS
I am grateful to Fordham University for this opportunity to study here. I
would like to give special thanks to Prof. Sudip Vhaduri my thesis advisor
and Graduate Assistant mentor. He provided endless support and help grow
my knowledge as well as my self-motivation. A particular thank you to the
Fordham WISDM team for gathering data included in this thesis. Lastly,
but most importantly, I would like to thank my family and friends for their
relentless support.
William Cheung
Fordham University
Date: 1/10/2021
ii

Table of Contents
Acknowledgements ii
Table of Contents iii
1 Introduction 1
1.1 Motivation . . . . . . . . . . . . . . . . . . . . . . . . . . . . . 1
1.1.1 The Digital World Explosion . . . . . . . . . . . . . . . 1
1.1.2 Password Issue . . . . . . . . . . . . . . . . . . . . . . 2
1.1.3 Growth of Internet of Things . . . . . . . . . . . . . . 2
1.1.4 The Introduction of Implicit Authentication . . . . . . 4
1.2 Contributions . . . . . . . . . . . . . . . . . . . . . . . . . . . 5
2 Related Work 7
2.1 Wearable Constraints . . . . . . . . . . . . . . . . . . . . . . . 7
2.2 Multi-modal Biometric Authentication . . . . . . . . . . . . . 8
2.3 Wearable Authentication . . . . . . . . . . . . . . . . . . . . . 9
3 Datasets and Preprocessing 11
3.1 Datasets . . . . . . . . . . . . . . . . . . . . . . . . . . . . . . 11
3.2 Data Pre-Processing . . . . . . . . . . . . . . . . . . . . . . . 12
3.2.1 Data Segmentation . . . . . . . . . . . . . . . . . . . . 13
3.2.2 Audio Data Augmentation . . . . . . . . . . . . . . . . 13
iii
4 Feature Engineering 15
4.1 Feature Computation . . . . . . . . . . . . . . . . . . . . . . . 15
4.2 Feature Selection . . . . . . . . . . . . . . . . . . . . . . . . . 16
4.3 Methods . . . . . . . . . . . . . . . . . . . . . . . . . . . . . . 19
5 Experiment Methodology and Metrics 25
5.1 Training-Testing Set . . . . . . . . . . . . . . . . . . . . . . . 25
5.2 Performance Measures . . . . . . . . . . . . . . . . . . . . . . 26
5.3 Hyper-Parameter Optimization . . . . . . . . . . . . . . . . . 28
6 Evaluation 29
6.1 Authentication Model Evaluation . . . . . . . . . . . . . . . . 29
6.1.1 Full Scheme performance . . . . . . . . . . . . . . . . . 29
6.1.1.1 Error Analysis . . . . . . . . . . . . . . . . . 31
6.1.2 Balanced Scheme . . . . . . . . . . . . . . . . . . . . . 33
6.1.2.1 Error Analysis . . . . . . . . . . . . . . . . . 39
6.1.3 Scheme Comparison . . . . . . . . . . . . . . . . . . . 40
7 Conclusion and Future Work 45
Bibliography 47
Abstract
Vita
iv

List of Figures
1.1 The most common smartwatch wearable locks . . . . . . . . . 3
4.1 Top 25 heart rate and gait features selected (top 20 green bars
are used for modeling) using the SelectKBest approach. . . . . 19
4.2 Authentication model development. For Balanced scheme train-
ing only the blue arrows are considered . . . . . . . . . . . . . 21
4.3 Proposed deployment scheme for the Full Scheme . . . . . . . 22
4.4 Proposed deployment scheme for the Balanced Scheme . . . . 24
6.1 The change of FAR and FRR with varying confidence thresh-
olds (HRB model with the k-NN classifier) . . . . . . . . . . . 34
6.2 The change of FAR and FRR with varying confidence thresh-
olds (HRGB model with the k-NN classifier) . . . . . . . . . . 35
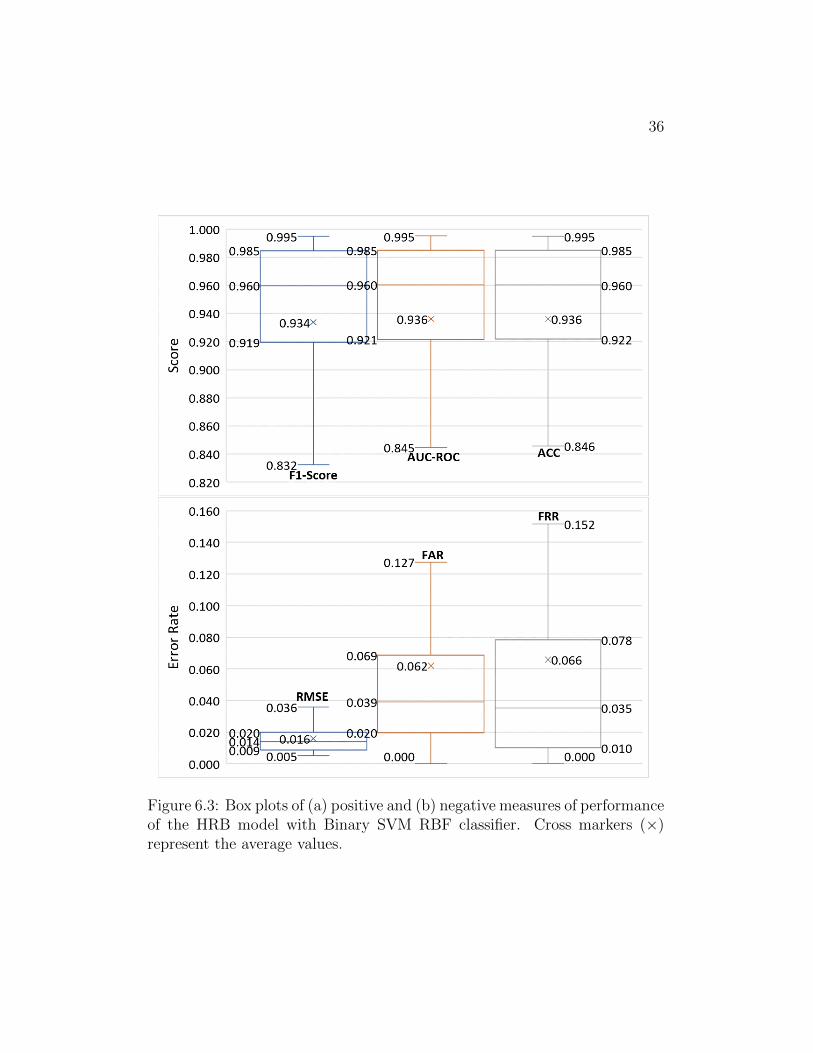
6.3 Box plots of (a) positive and (b) negative measures of perfor-
mance of the HRB model with Binary SVM RBF classifier.
Cross markers (×) represent the average values. . . . . . . . . 36
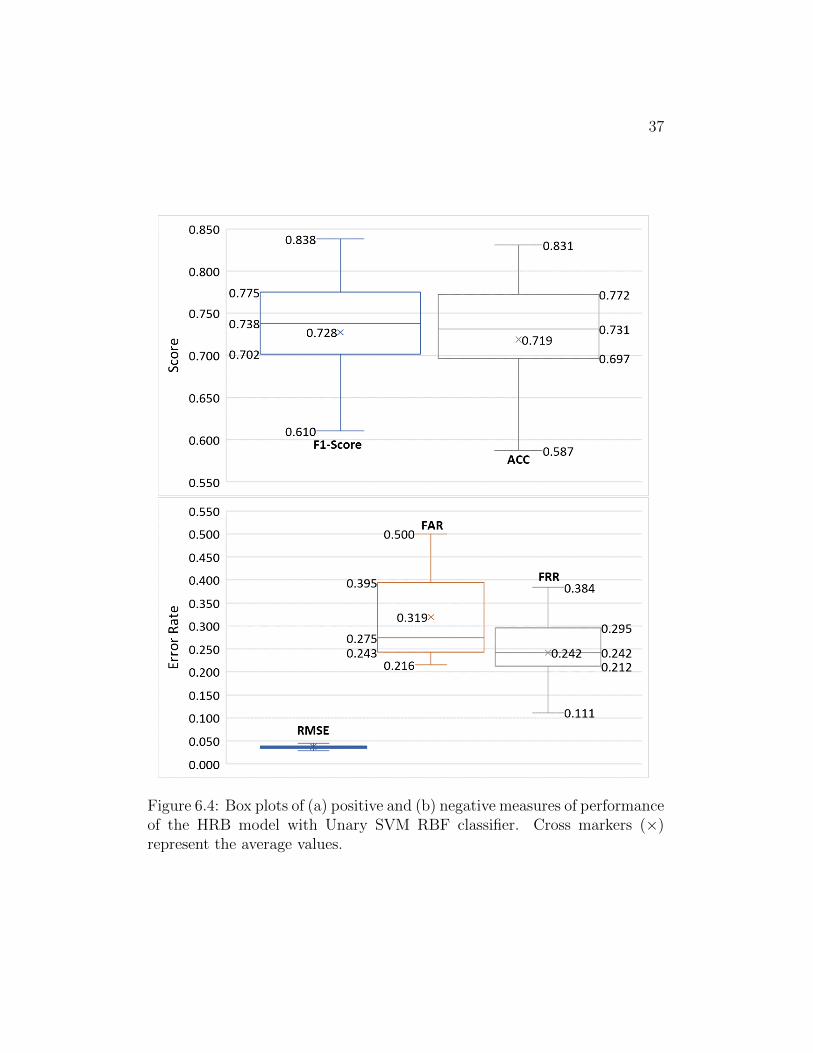
6.4 Box plots of (a) positive and (b) negative measures of per-
formance of the HRB model with Unary SVM RBF classifier.
Cross markers (×) represent the average values. . . . . . . . . 37
6.5 PDF and CDF with error bars of binary HRB SVM (RBF)
model performance. . . . . . . . . . . . . . . . . . . . . . . . . 38
6.6 PDF and CDF with error bars of unary HRB SVM (RBF)
model performance . . . . . . . . . . . . . . . . . . . . . . . . 38
v

6.7 Change of error rates with varying confidence thresholds using
the binary HRB SVM (RBF) model. . . . . . . . . . . . . . . 40
vi

Chapter 1
Introduction
1.1 Motivation
1.1.1 The Digital World Explosion
The internet is becoming increasingly accessible with 4.5 billion users, an
annual growth rate of seven percent over just the last year. This coincides
with the fact that the global average active time using the internet is 6 hours
and 43 minutes per day (1). Active meaning direct interaction between users
and the internet. Businesses also recognize this transition and many are in-
creasing their online presence. Companies that have gone through digital
transformation are 26% more profitable than their peers in an MIT study
(2). With this much time spent on the web, people create many accounts
from banking and shopping. In addition to normal transactions activity,
social media has expanded greatly as well. From 2010 social media users
accounted for less than a billion users to almost 4 billion today in 2020 (3).
With the recent Covid-19 virus outbreak an increased reliance on the internet
and investments in digitization increased by 79% (2). Usage has expanded
to encompasses the sharing of much private information from financial infor-
mation, personal life information, health information, and more. This makes
security an ever-increasingly important issue as there are more vulnerabil-
ities for people to be hacked and exploited. Many companies secure only
1
2
the private information their workers or customers use on their sites. This
results in the user having to interact with many accounts and creating large
numbers of passwords.
1.1.2 Password Issue
Using knowledge-based authentication approaches can be easy to implement.
However, many implementations using passwords also bring additional chal-
lenges, such as the hassle to memorize and reset passwords regularly. The in-
creased involvement of users often leads to weaker password selection. Of the
passwords in the survey, about 80% of them are found as weak in a McAfee
survey (4). There might be some thought that the newer generations are
more emersed in technology than their predecessors. That passwords they
produce would be more secure and that the new generation is more used
to the use of passwords. However, a study shows that 78% of adults be-
low the age of 40 find difficulty in remembering passwords, while a similar
amount of adults (75%) above 40 and below 65 have the same issue. Using
the same age divisions its found that there are little differences in the number
of unique passwords 4.04 average unique passwords for the older group while
the younger group averages 4.32 even though there are about a 20% increase
in the number of passwords from the older to the young group (5). However,
the digital footprints that the IoT connected devices are collecting continu-
ously can be used to authenticate and secure individuals in an implicit and
user-friendly manner. They also eliminate the need to memorize or create
your password removing the problem altogether.
1.1.3 Growth of Internet of Things
As the usage of the internet of things (IoT) is ever increasing and becom-
ing integrated into everyday life. Applications including access to physical
objects remotely may be granted through wearables. From 2000 to today,
the number of internet users has grown more than tenfold (413 million to
3
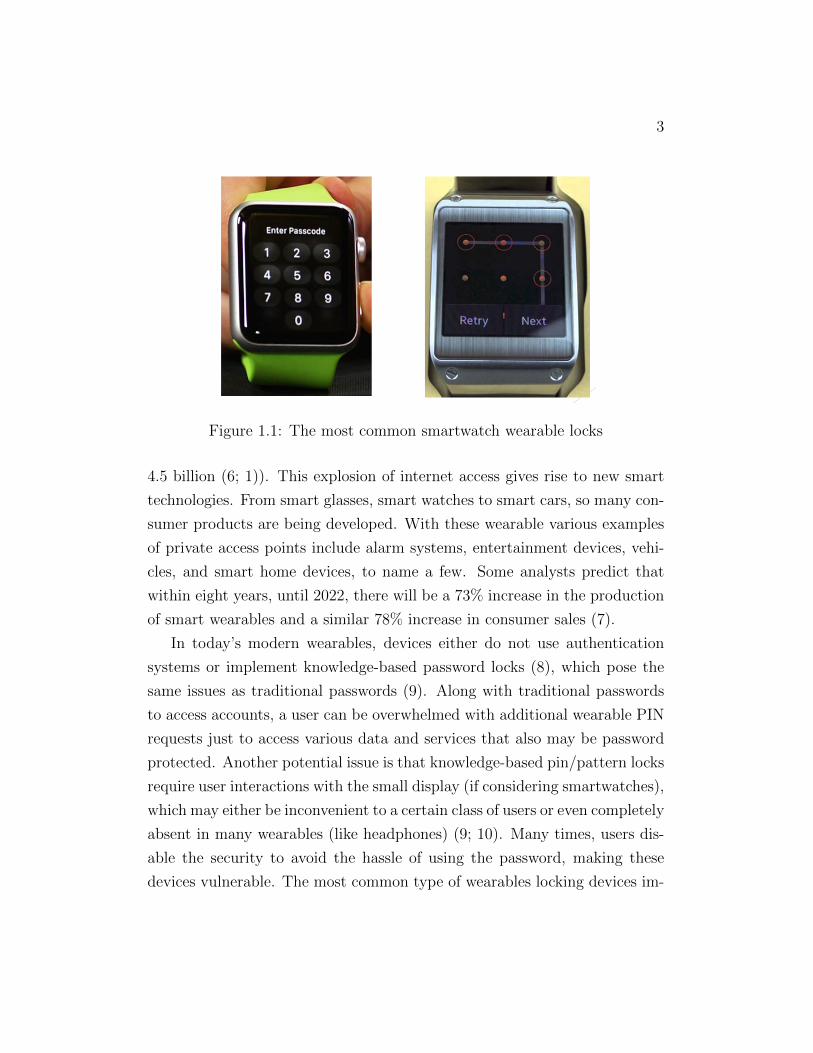
Figure 1.1: The most common smartwatch wearable locks
4.5 billion (6; 1)). This explosion of internet access gives rise to new smart
technologies. From smart glasses, smart watches to smart cars, so many con-
sumer products are being developed. With these wearable various examples
of private access points include alarm systems, entertainment devices, vehi-
cles, and smart home devices, to name a few. Some analysts predict that
within eight years, until 2022, there will be a 73% increase in the production
of smart wearables and a similar 78% increase in consumer sales (7).
In today’s modern wearables, devices either do not use authentication
systems or implement knowledge-based password locks (8), which pose the
same issues as traditional passwords (9). Along with traditional passwords
to access accounts, a user can be overwhelmed with additional wearable PIN
requests just to access various data and services that also may be password
protected. Another potential issue is that knowledge-based pin/pattern locks
require user interactions with the small display (if considering smartwatches),
which may either be inconvenient to a certain class of users or even completely
absent in many wearables (like headphones) (9; 10). Many times, users dis-
able the security to avoid the hassle of using the password, making these
devices vulnerable. The most common type of wearables locking devices im-
4
plements either a regular numeric PIN or pattern lock shown in figure 1.1.
Nguyen and Memon show that these methods along with others have high
error rates even given that the users remember the password. ”Fat finger”
effects cause Numeric PIN, voice PIN, draw PIN, and pattern lock each to
suffer error rates of 7.5%, 14.0%, 20.7%, and 9.3% respectively (11). How-
ever, IoT generally measures a person’s biometrics leading to access to an
implicit digital footprint from a user and potential alternate security solution.
1.1.4 The Introduction of Implicit Authentication
As mentioned in the introduction, implicit authentication can be done through
biometrics. To develop an implicit and continuous authentication mechanism
for IoT-connected devices we have to consider the limitations of the device.
There are trade-offs among various parameters/constraints, such as types of
data, the granularity of data, computation power of the device, among sev-
eral others that need to be balanced to get optimal performance along with
usability. Some of the many biometrics researchers use are gait, gesture,
keystroke, voice, faces, palm prints, fingerprints, finger veins, electrocardio-
gram, or heart rate (12).
Additionally, different biometric have an inherent weakness, not from
the model itself but the nature of the biometrics Therefore, authentication
mechanisms are developed for specific devices as they used biometrics, and
application scenarios may not hold for continuous use. For example, while a
gait-based authentication system can achieve an accuracy of 92% (13), this
approach fails when a user is sedentary. Similarly, while the key-phrase-based
voice authentication approaches are highly accurate, they impose a burden
on users to remember the key-phase and requires the user to speak (14).
Multi-model schemes can provide a solution to these collections to fill the
gaps that each biometric may have.
5
1.2 Contributions
The main contribution of this paper is the exploration of two contrasting
hierarchical continuous implicit authentication system for wearables using
coarse-grained soft-biometrics. Compared to previous work (15; 16), where
we use hybrid-biometrics, such as calorie burn that can be affected by a user’s
self-reported input, e.g., age, height, and weight, in this work we focus on
three different soft-biometrics, i.e., heart rate, gait, and breathing that
can be measured without a user’s self-reported input and can be easily ob-
tained from the market wearables. While minute-level coarse-grained heart
rate samples can be less informative, they are available almost all the time
when a user wears the device. Adding another biometric, such as gait, can
improve the performance. However, unlike the heart rate data, gait is avail-
able only when a user moves. Compared to gait, breathing audio signal can
have better availability, but it also suffers from various issues, such as a user’s
distance from the microphone, the presence of other sounds. Therefore, it
is important to develop a multi-biometric-based approach that can be easy
to implement on wearables and can have a way to decide which modalities
should be used based on contexts or scenarios.
In this work, we present two multi-biometric-based hierarchical context-
driven approaches (discussed in Section 4.3) that flexibly works in sedentary
and non-sedentary periods. We include both binary and unary models to
reflect the circumstances of the availability of other people’s data in addi-
tion to a valid user’s data. From our detailed analysis, we can authenticate
a user with an average accuracy 0.94 ± 0.07 and F1 score of 0.93 ± 0.08,
(Section 6.1), with a false acceptance rate of about 0.06 ± 0.07 while de-
veloping the binary SVM model in a sedentary state using heart rate and
breathing biometrics together (Section 6.1.2.1). We are also able to validate
users in a non-sedentary state with similar performances with an average ac-
curacy of 0.93 ± 0.06 and F1 score of 0.93 ± 0.03 using k- Nearest Neighbors
(k=2).Considering the situation where we do not have other users’ data, we
6
develop unary models that allow for offline training since other users data
do not need to be downloaded. In the case of unary modeling, we obtain an
average accuracy of 0.72±0.10 and a F1 score 0.73±0.06 when sedentary and
0.72± 0.10 and a F1 score 0.72± 0.09 respective scores when non-stationary
using the SVM model (Sections 6).
Chapter 2
Related Work
2.1 Wearable Constraints
Wearable device user authentication is a relatively newer field of research
than mobile authentication (17; 18; 19; 9). The limited display sizes of wear-
ables limit the choices of authentication mechanisms (17; 15). Recently more
biometrics become available as more sensors are included in devices. Un-
fortunately, there still hold accuracy concerns. Apple ECG sensors are one
example of this. Researchers have found that, although for people over the
age of 85 Apple’s watches accurately detects atrial fibrillation at a rate of
96%, for people under 55 it only correctly diagnoses atrial fibrillation 19.6%
of the time (20). As in many of the other works in this field, there is con-
stant change in available technology pushing what is both optimal and most
available.
Availability of the sensor data is also a consideration we want to consider
in a continuous case. We can illustrate this issue by looking into one of many
identification schemes using vein imaging. Toygers work focused on using
the image of the veins in the wrist which produced an impressive 99% accu-
racy (21). Current wearable typically does not have cameras. Even if they
eventually do, continuous image capture has high battery consumption. The
data would also only available sporadically when the camera lens happens to
7

8
graze over the intended body part (or in the wrist case, mostly covered by
the wrist wearable itself) or require active involvement from the user.
Finally, the security of data for wearables is also of great concern. Just
as when the first mobile phones came out, wearables sufferer from com-
putational capability. Training and updating machine learning models for
wearables currently need to be done outside the wearable itself. Storing data
outside of the used device invites hackers to stage middleman attacks (22).
This dilemma will subside as the wearables become more powerful as mobile
phones do now. Generally the current solution short range pairing solutions.
This reduces the chance of an attack while enabling the supporting device to
supplement the capabilities of the wearable (23).
2.2 Multi-modal Biometric Authentication
No matter how strong a single biometric may be, they have underlying weak-
nesses and blind spots. Gait implementation is a very popular single bio-
metric system but have difficulty when users are sedentary. Even with speed
adaptive gait cycle segmentation to achieve 92% accuracy (13). Other strate-
gies include indicating activity when using gait to authenticate (24). A per-
son’s gait movement is very different when a person is walking compared to
eating to writing. Adding more features can generate even higher perfor-
mance. Combining security measures typically increases the integrity of the
system. In Baughman’s work, he incorporates biometrics as one of the com-
ponents in a virtual wallet (25). This type of system while robust hinders
users from easily using the system with a multitude of security checks to au-
thenticate themselves. With increasingly more powerful cameras multi-modal
systems including imaging have become increasingly popular but difficult to
implement in an implicit system as previously mentioned. One such example
is a system using speech, fingerprint, and facial recognition. Each individ-
ual biometric may face noise: background noise for speech, dirty finger for

9
fingerprint, and poor lighting in facial recognition (26). However together
they compensate for each other’s weaknesses. Collectively they are able to
produce a genuine acceptance rate for a valid user of 98.7% (27).
A better solution is using a multitude of implicit authentication methods
that together can strengthen the system against intruders but not suffer from
usability issues. Combinations of biometrics used to form multi-modal bio-
metric authentication systems for increased reliability compared to unimodal
systems, which often suffer from noisy data, intra-class variations, inter-class
similarities, and spoof attacks (28). Researchers have utilized different hard-
and soft-biometrics from these systems. However, due to accuracy concerns
the low computational power of wearables, these multi-modal approaches
are typically not implemented for implicit and continuous authentication on
state-of-the-art wearables. One of the primary goals and challenges of multi-
modal authentication systems is the handling of multiple physiological states.
One approach seeks to separate stationary and moving datasets to test on.
That way they can optimize data usage to achieve better results (29; 30).
However, with Fit-bit and other commonly used wrist wearable devices, we
can use activity state along with gait variability to determine the sedentary
state.
2.3 Wearable Authentication
A lot of biometric authentication schemes reside on mobile devices. This
suffers from the fact that mobile phones are not constantly on the human
body but need to be authenticated at any given time. Wearables, such as a
smartwatch are constantly on the user’s wrist and are only used when they
are on the user’s wrist. Sensors not on a wearable also have to deal with more
noise. An accelerometer on a mobile phone captures data that is affected by
the type of pants they wear or whether its in the user’s hand or pocket. An
10
accelerometer on a smartwatch, although not completely immune to noise,
does not suffer from the major issues one would on the mobile device (31).
A lot of recent focus is on techniques that are more suitable for wearables,
focusing more on approaches based on behavioral biometrics. While other
projects have addressed some of the limitations of gait-based approaches by
considering different types of gestures (32) or activities (17; 10). All of these
models are based on movement and fail to work properly when the subject
is sedentary (33; 15). Authentication approaches using physiological biomet-
ric data, such as heart rate and bioimpedance (19) require very fine-grained
samples and sensor readings are easily affected by noise, motion, etc. but
are constantly available. There are many types of wearable sensors that
can gather diverse sets of data. We limit those that are readily available
in the market and are commonly used. One study used google glasses to
analyze ”functional biometrics” and included the movement and vibrations
of the head during certain functions. However, IoT glasses that were once
considered a potential fad is currently not commonly used (34). Focusing
on one or a particular set of biometrics restricts the usability of a contin-
uous authentication model. But with a collection of various combinations,
it is possible to build a more robust authentication process, adjusting when
certain biometrics become unavailable or available.
Other techniques involve the use of implicit after explicit authentication
system. Where a fingerprint is used as a stronger password and weaker bio-
metric signatures such as heart rate are used as continuous check afterwords
(35). Even though this is one of the strongest implementation schemes so far
we wish to push the boundaries with a completely implicit system.
Chapter 3
Datasets and Preprocessing
The goal of this paper is to demonstrate the effectiveness of a multi-step
biometric model in authenticating wearable device users with the help of
different machine learning models. Because we are using a multi-biometric
scheme, there is a multitude of sources we intend to use. We first explore
the datasets and data pre-processing strategies before looking into feature
generation. We went with two separate approaches that are further explained
in Section 4.3. In summary, the approaches are the Full scheme (maximizing
biometric combinations) and the Balanced scheme (optimizing performance
while ensuring an equal amount of biometrics).
3.1 Datasets
In this work, we use the following three different datasets, BMP for heart
rate, meters per second2 or degree per second for gait, and kHz per second
for breathing.
• Heart Rate dataset: With the use of a Fitbit Charge HR device, we
collected heart rate data at a rate of one sample per minute from 10
subjects just as in (12; 36), similar to our previous work (15; 37; 30;
16; 38; 39).
11
12
• Gait dataset: We obtained gyroscope and accelerometer readings at a
rate of one sample in 50 milliseconds or 50 Hz using the LG G Watch
(running Wear 1.5 operating system) from the WISDM dataset (40).
Ten subject count data was used.
• Audio dataset: For the Full Scheme we sourced breathing audio from
the ESC-50 Dataset for Environmental Sound Classification. For the
Balanced scheme, from 10 subjects, we gathered breathing audio clips.
Each provided six distinct inhalation breathing events per clip using the
Evistr digital voice recorder (12) at a rate of 44.1 kHz per second. Data
is collected from the subjects in their rest state with the recording de-
vice within arms length of the subject’s mouth. Audio from wearables
is difficult to obtain due to security and this simulates close range audio
that can be collected from wearables such as headphones and glasses.
As per the noise clips for audio data augmentation, we collected clips
from the ESC-50 database. Noises consisted of vacuum and washing
machine sounds each containing five unique clips (41). The noise was
included in the balanced scheme in order to increase the strength of
audio training.
3.2 Data Pre-Processing
The raw datasets needed to be cleansed before using them. Following the
cleaning, we segment the continuous stream of biometrics, such as heart
rate and gait information into windows of information, while selecting de-
sired audio events (i.e., breathing). The next process is to add noise and
augmentations to audio events in order to simulate various environmental,
physical, and emotional circumstances users may be in increased robustness
of training similar to other audio works (42). We do this to then be better
able to compute and select the most influential features before constructing
authentication models.
13
3.2.1 Data Segmentation
Because heart rate and gait data were sampled at different frequencies, we
need to segment the heart rate and gait samples into 10-sample windows to
obtain stable and rich information before feature generation. We use a 50%
sliding window to obtain 800 heart rate windows and 720 gait windows, i.e.,
instances from each subject. Windowing allows for increased data volume as
well as decreasing necessary latency time between authentication attempts.
Audio data comes with other types of sounds in addition to desired
breathing sounds or can contain multiple events in one clip. Additionally,
some clips come with multiple breathing events separated by silence or noisy
parts. For our authentication scheme, we defined inhalation as the authenti-
cation key. Therefore, we segment the audio clips into individual inhalation
breathing events. We were able to obtain around six inhalation breathing
events per subject. For the Full scheme and Balance scheme, each event is
then modified in 22 and 102 ways respectively mentioned in the next sec-
tion (Section 3.2.2) to further increase data volume. The resulting dataset
is magnified to a total of 612 instances from each subject. We consider the
same 132 or 612 instances from each of the three biometric while utilizing
the different biometrics to develop different models discussed in the Methods
section, i.e., Section 4.3. As a result, all testing regardless of what biometrics
consisted of the same amount of data was used.
3.2.2 Audio Data Augmentation
As stated a person’s breathing is affected and influenced by the change of
mood, the environment, or a person’s physical state. The alternations we
add to the breathing events are intended to simulate these variations. We
use pitch shifts, speed changes, and noise strategies to achieve this is an
augmentation of the original audio breathing events.

14
• Pitch shift: For pitch shift, we consider 15 pitch shifts ranging from
-3.5 to 3.5 with 0.5 half-step increments.
• Speed change: We consider seven-speed changes ranging from .25x to
2x times the speed of an original clip with an increment of .25x, skipping
1x since that would represent the original clip, which is already included
as a pitch shift with value 0.
• Noise Superposition: We use 10 vacuum and washing machine sound
clips, obtained from the environmental sound classification database (41),
as background noises to modify original breathing event clips. In addi-
tion to this eight different signal-to-noise ratio levels ranging from 10−4
to 104, incremented by magnitudes of 10 while skipping 1 were used
as various volumes of background noises. This noise superposition is
implemented in a Balanced scheme.
As a result, each original breathing clip is modified 22 times without noise
superposition and 102 times with noise superposition.
Chapter 4
Feature Engineering
After gathering and cleaning the data we have to format it to be processed
properly. We will go through the feature computation process as long with
how we select the most impactful to optimize performance.
4.1 Feature Computation
In order for the machine learning models to understand the data being feed
to them the data must be translated into understandable features. These
features are an expression of the data and we compute the following sets of
candidate features.
• Heart rate features: From each 10 sample window we compute 21 sta-
tistical features: mean (µ), median (Mdn), standard deviation (σ),
variance (σ2), coefficient of variance (cov), range (ran), coefficient of
range (coran), first quartile or 25th percent (p25), third quartile or
75th percent (p75), max (max), interquartile range (iqr), coefficient of
interquartile (coi), mean absolute deviation (mad Mdn), median ab-
solute deviation (mad µ), energy (E), power (P ), root mean square
(rms), root sum of squares (rss), signal to noise ratio (snr), skewness
(γ), and kurtosis (κ), described in (16).
15
16
• Gait features: We compute the same above mentioned 21 features from
each window of x-, y-, z-axis readings obtained from both gyroscope
and accelerometer.
• Audio features: From each inhalation breathing event (original and
augmented), we computed three categories of audio features. Of the
cepstral coefficients, 40 Mel-frequency cepstral coefficients (MFCCs).
Details on audio feature calculation can also be found on the Librosa
main page (43).
Thereby, we obtain 21 and 168 (21 from each of the six axes and two fusion
values) features from a single window of heart rate and gait data, respectively,
and 40 features from every breathing clip. When describing the combined
biometric models in Section 4.3, we take the features from the separate bio-
metrics and combine the unique subjects together. Having time and subject
synced data is ideal, however as a trial test the results from this method will
provide a baseline performance.
4.2 Feature Selection
When considering the training of models we have developed two types: unary
and binary which will be discussed more in Section 4.3. Overall there were
three types of feature selections used.
In the correlation approach, We wanted to get rid of features that had a lot
of similarity between with other features as it shows that they provide similar
information, thus redundant. If a feature was found to have a correlation
value with a high absolute value, then that feature was excluded.
A SelectFromModel the idea is that certain algorithms can produce weights
of significance. For example decision trees branching from the original dataset
and are split on a computed ”best” feature. In our case, one of the classifiers
we use is a random forest. With random forest being a bagging implemen-
tation of decision trees we used it as the basis for feature selection. The tree
17
uses Gini criteria to select feature importance. The tree quickly builds its
structure and ranks features. From here we can establish a threshold with
which we consider the features important. We talk about the top features
that hold 90% explainability as the selected features.
When there is not an opportunity to use the classifier to prune features,
we use another Sci-kit learn feature selection package “Select the K Best
Features” (SelectKBest). SelectKBest provides an importance score for each
feature and based on that score we rank the features. The scoring is based
on a univariate statistical test checking the predictive power of individual
features with the label. In our case, we use ANOVA F-value as the evaluation
metric. We try with different numbers of features, i.e., K, to find the best
model performance.
In the case of unary models feature selection process uses a different
approach. Unary models were trained with the same data as the binary
models with the imposter data left out in the training phase. As a result,
SelectKBest nor SelectFromModel are not effective. We use the least variance
check. The main idea is that given a set of biometric features of only one
class/valid user, features that vary the least are more likely to be identifying
features. Just like in the binary case it is optimal to select the top x number
of features lowest variance based on the number of biometrics considered.
In summary, the four strategies detail the selection process:
• Correlation approach: We apply this approach to select the most influ-
ential heart rate and gait features. We find that mean, variance, and
skewness are the three uncorrelated features from both heart rate and
gait. Therefore, we remain with three heart rate features and 18 gait
features obtained from the three axes of acceleration and gyroscope
readings. This method was used in both strategies.
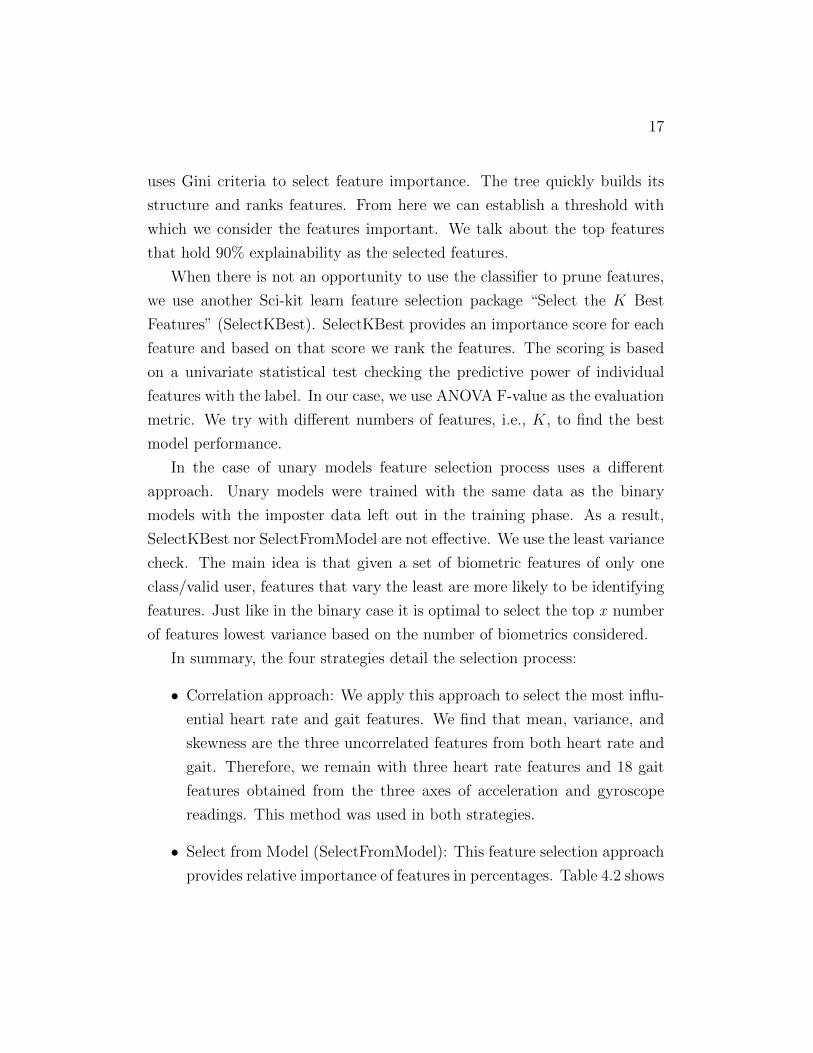
• Select from Model (SelectFromModel): This feature selection approach
provides relative importance of features in percentages. Table 4.2 shows

18
an example set of features selected using the SelectFromModel (with
the explanation threshold, p = 0.90) approach. In the figure, green
bars represent the features selected for modeling when used in the full
comparison.
• Select the K Best (SelectKBest): This is our last feature selection
approach that also provides an importance score for each feature and
based on that score we rank the features. Then, we try with different
numbers of features, i.e., K, to find the best model performance. In this
work, we find K = 10 was optimal when considering full comparison
then k = 20 performs the best scheme when considering a Balanced
comparison. An example of this can be seen in Figure 4.1
• Low Variance: Used in univariate or one-class classification. We took
the top 20 lowest variance features as those most important in the
Balanced scheme and the top 10 in the Full scheme. An example of
this can be seen in Table 4.3.
In each iteration of the leave-one-out validation, described in Section 5.1,
we select different feature sets, which are essentially similar to changes in
order.
Tables 4.1 presents the list of best feature sets obtained from different
biometrics using different selection approaches. Table 4.2 presents the lists of
selected features obtained using different selection approaches during one of
the leave-one-out training-testing cases (Section 5.1) considering heart rate,
gait, and breathing features together. Little variation between runs occurred
and the table is displayed with the 1st iteration for simplicity.

19
Figure 4.1: Top 25 heart rate and gait features selected (top 20 green barsare used for modeling) using the SelectKBest approach.
Table 4.1: Summary of features selected from different biometricsBiometrics Selector Selected features
(parameters)Heart rate SelectKBest p25, µ, rss, rms, max, Mdn, p75, κ, γ, P
(K = 10)Heart rate SelectFromModel Z-gy κ, Y-gy κ, Y-acc µ, µ, Z-gy σ2, Z-acc κ,and gait (p = 0.90) X-acc κ, Y-gy σ2, Y-acc κ, X-acc µ, X-acc
σ2, Z-acc σ2, Y-acc σ2
Heart rate SelectKBest MFCC3, MFCC7, MFCC4, MFCC6,and breathing (K = 10) MFCC9, MFCC11, MFCC15, MFCC38,
MFCC13, MFCC40
4.3 Methods
Generally, any given normal daily activity can be put as either a sedentary
or non-sedentary state. This is essentially describing a person in motion or
not in motion. As mentioned before we had two approaches, the Full scheme,
and the Balanced scheme. The idea behind the Full scheme is that we want
20
Table 4.2: Summary of features selected from heart rate, gait, and breathingbiometrics togetherSelector (parameters) Selected featuresSelectFromModel MFCC3, MFCC4, MFCC7, MFCC1, MFCC6, Z-gy κ,(c = 0.90) MFCC9, Y-acc µ, MFCC13, Y-gy κ, Z-acc κ, MFCC10,
MFCC15, X-acc κ, MFCC11, MFCC18, MFCC36,MFCC38, MFCC26, MFCC17, MFCC12, MFCC14, Z-gy σ2, µ
SelectKBest MFCC3, MFCC7, MFCC4, MFCC6, MFCC1, Y-acc µ,(K = 10) MFCC9, MFCC38, MFCC2, MFCC11
Table 4.3: Summary of features selected as per low variance uniary modelsmodel (Breathing features dominated Heart Rate features)Unary Classifier (parameters) features selectedHeart Rate ModelSVM (RBF kernel, nu = 0.5) coran, mad µ, σ, coi, mad Mdn, p25,
ran, cov, iqr, µHeart Rate and Gait ModelSVM (RBF kernel, nu = 0.5) coran, X-gy snr, Y-gy coi, Y-gy snr, Y-
acc snr, X-acc coran, Y-gy mad µ, Y-gymad Mdn, Z-acc mad Mdn, Z-acc coran
Heart Rate and BreathingModelSVM (RBF kernel, nu = 0.5) coran, mad µ, σ, coi, mad Mdn,
MFCC39, MFCC26, MFCC30, MFCC36,MFCC40
Heart Rate, Gait, andBreathing ModelSVM (RBF kernel, nu = 0.5) coran, X-gy snr, Y-gy coi, Y-gy snr, Y-
acc snr, X-acc coran, Y-gy mad µ, Y-gymad Mdn, Z-acc mad Mdn, Z-acc coran
to see the full utilization of the biometric within the scheme. The full scheme
uses all combinations of biometrics in a given state. The Balanced scheme
is based on trying to ensure that there are equal amounts of biometrics in a
21
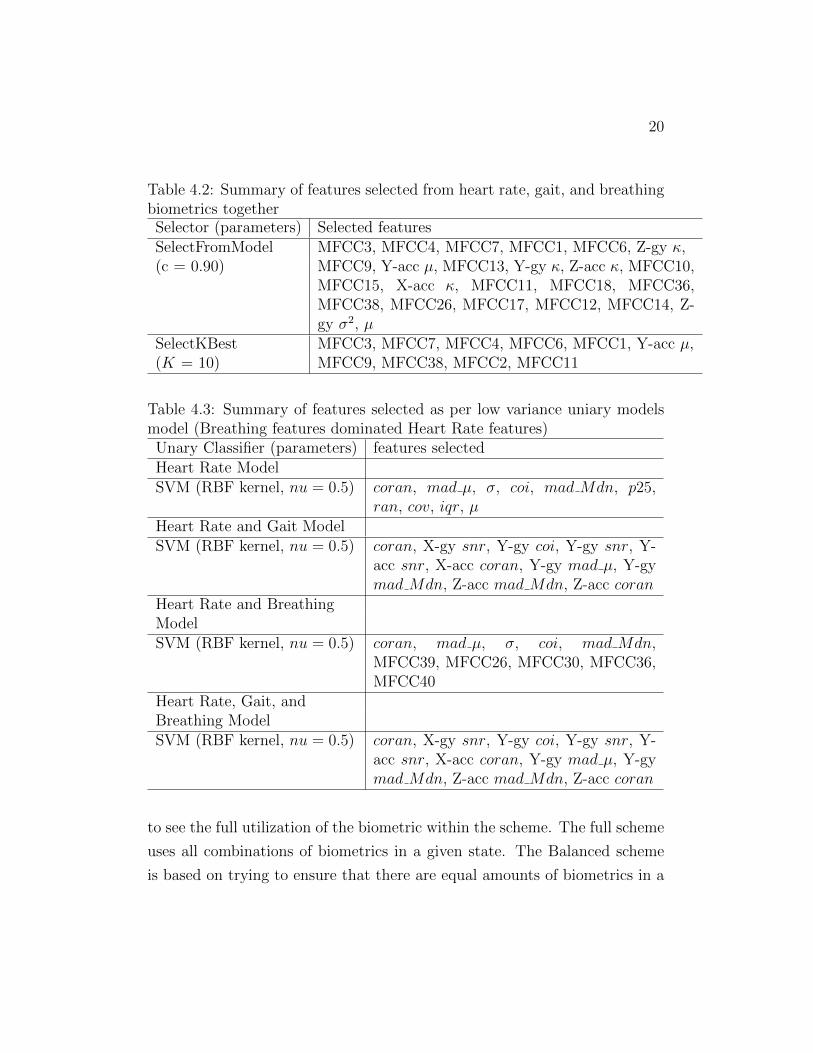
Figure 4.2: Authentication model development. For Balanced scheme train-ing only the blue arrows are considered
given state.
A high-level illustration of the implicit authentication process of the full
comparison method can be described through Figure 4.2. When looking at
the Balanced scheme we do not include the HRGB model and therefore omit-
ting the arrow from the audio signal and the non-sedentary state. In order to
strengthen the HRB model, we include noise augmentation as mentioned in
4.1. In the binary case both the subject classified as the valid user and those
considered imposters are used in training. For unary models, only data from
the valid user is included in the training. The primary sensors focused on this
study is the PPG sensor, accelerometer, gyroscope, and microphone. From
each senors, we draw raw signal data and interpret them with the features
listed in 4.1. Although we are collecting sensory data constantly based on the
physical state of the individual strength we will select a fusion model com-
prised of one or more biometrics. From the sedentary perspective, we can fuse
heart rate and breathe in model combinations. In the non-sedentary state,
we can fuse combinations from any of the three heart rate, gait, and breath-
ing. We train each of the fusion level models with various algorithms. In
practice, the decision and confidence of that model will determine if another
22
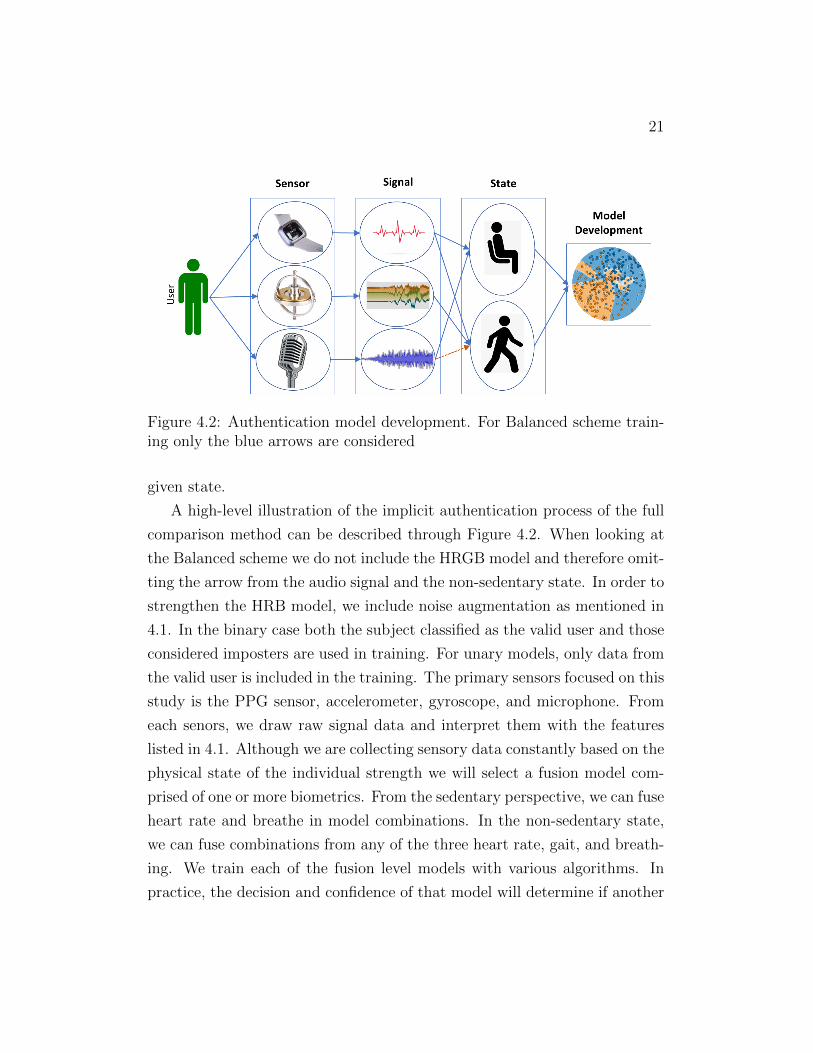
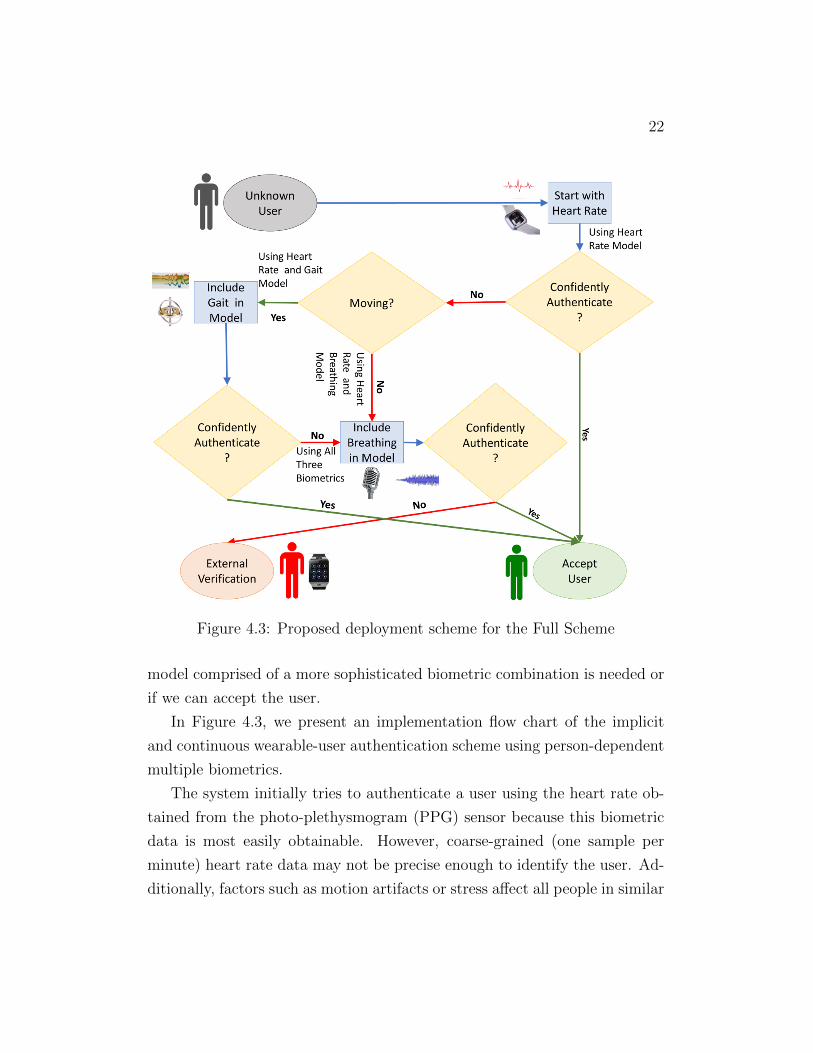
Figure 4.3: Proposed deployment scheme for the Full Scheme
model comprised of a more sophisticated biometric combination is needed or
if we can accept the user.
In Figure 4.3, we present an implementation flow chart of the implicit
and continuous wearable-user authentication scheme using person-dependent
multiple biometrics.
The system initially tries to authenticate a user using the heart rate ob-
tained from the photo-plethysmogram (PPG) sensor because this biometric
data is most easily obtainable. However, coarse-grained (one sample per
minute) heart rate data may not be precise enough to identify the user. Ad-
ditionally, factors such as motion artifacts or stress affect all people in similar
23
enough ways to cause confusion. Therefore, if the system cannot authenticate
the user with enough confidence, it checks the next authentication module
that increases the amount of biometrics used.
The system then tries to check whether the user is moving to utilize
the on-device accelerometer and gyroscope data. If so, the system tries to
authenticate the user based on a combination of gait and heart rate bio-
metrics. The user can access the device if the system can authenticate the
user with enough confidence. In the sedentary states, although gait is not
available, audio recordings from wearables still are. Therefore, the breathing
audio recordings could be a good biometric to identify users during sedentary
states.
Given that the system still can not authenticate a non-sedentary user
from two biometrics a three biometric combination of heart rate, gait and
breathing will be tested. If the system can authenticate the user with enough
confidence, it allows the user to access the device. Otherwise, the user’s access
to the device is revoked and require some sort of external verification, such
as pin locks or passwords.
Based on the various combinations of the three biometrics that we use in
our approach, we define the following models:
• Heart rate data-driven model (HR model)
• Heart rate and gait data-driven model (HRG model)
• Heart rate and breathing data-driven model (HRB model)
• Heart rate, gait, and breathing data-driven model (HRGB model)
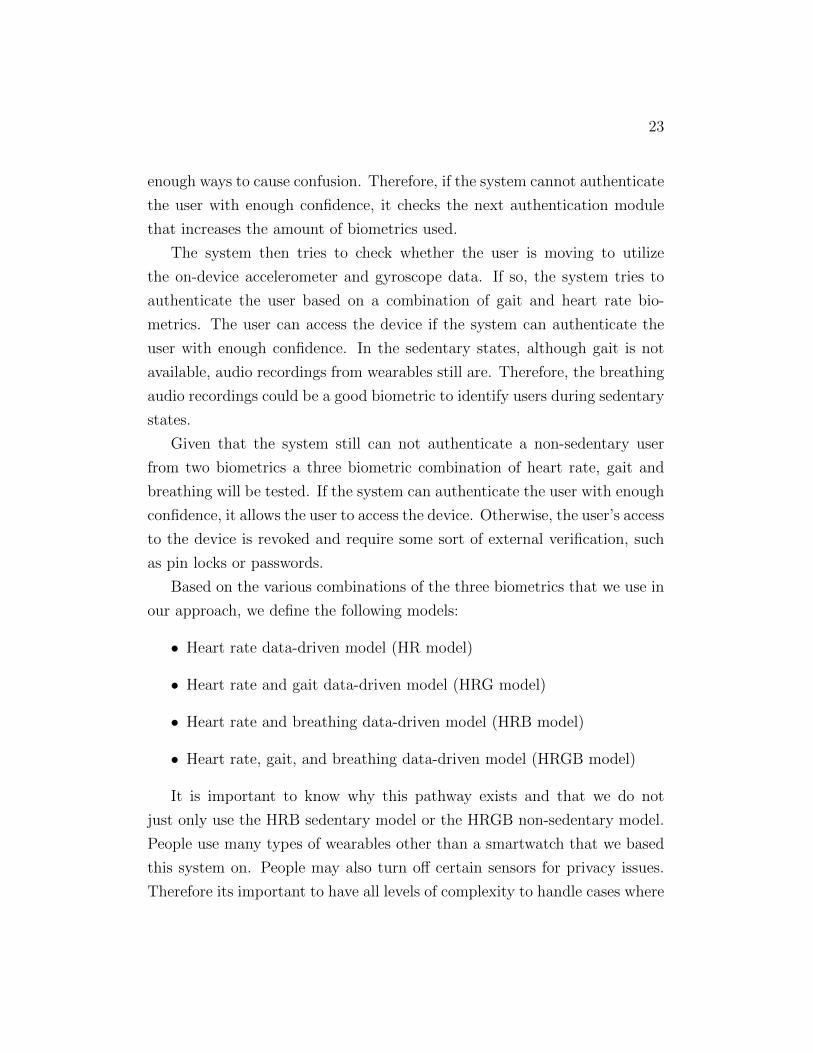
It is important to know why this pathway exists and that we do not
just only use the HRB sedentary model or the HRGB non-sedentary model.
People use many types of wearables other than a smartwatch that we based
this system on. People may also turn off certain sensors for privacy issues.
Therefore its important to have all levels of complexity to handle cases where
24
sensors are not available. The Balanced scheme has a similar system flow
but without the HRGB model as seen in Figure 4.4.
In the development of the above models, we consider various classifiers.
These include Random Forest (RF), k-Nearest Neighbor (k-NN), Naive Bayes
(NB), and Support Vector Machine (SVM) with binary and unary schemes
using the Sci-kit learn libraries. Compared to binary, unary models are
available only for the SVM classifiers.
Figure 4.4: Proposed deployment scheme for the Balanced Scheme
Chapter 5
Experiment Methodology andMetrics
Now we present how the training-testing set split and our modeling schemes,
followed by the performance measures we use to compare the learners and
hyper-parameter optimization.
5.1 Training-Testing Set
In our binary modeling, we separate data into two classifications: a valid user
(class-0) from the impostors (class-1). A common procedure to avoid over-
fitting is to consider at least 10 times more feature windows, i.e., the number
of instances than the number of features. Additionally, when performing
training-testing, we follow the leave-one-out strategy. This means when we
train and test N unique models one-by-one for each user with N number
of instances. During each training-testing, we keep the N th instance/audio
event for testing and use the rest of the nonN th orN−1 instances for training.
In the Full scheme, we used 3 subjects and in the Balanced scheme we have
10 subjects and perform 6 leave-one-out testings for each subject; thereby,
all aggregated performance measures presented in this paper are based on 18
and 60 performance measures for Full and Balanced schemes respectively.
25
26
For class balancing, in the case of binary models, we consider the same
N − 1 number of instances from each class. Given that our imposter class
consists of M person data, we pick (N −1)/M instances from each imposter.
Using the balanced scheme for example, while training an HR model, we
consider 510 heart rate windows from a target/valid user and 510/9 ≈ 56
windows from each of the nine imposters. In the test set, we consider 102
windows from the valid user and 102/9 ≈ 11 windows from each imposter.
Similarly, while training an HRB model, we use 510 windows, i.e., breathing
events from a valid user in addition to 510 heart rate windows. Where,
510 breathing events are obtained from the five original breathing events
and their 102 augmented events, i.e., 5 × 102 = 510. To keep the training
and test set separate, to use the remaining one breathing event and its 102
augmented events, i.e., 102 events/windows. For imposter, we uniformly
select the windows to ensure a balanced classification. In the case of unary
models, we also follow the leave-one-out strategy. However, compared to the
binary, unary models are developed with only a valid user’s data with an
outlier rate (ν), which is used to split the user’s data into valid and outlier
groups. In the case of our experiments, we find ν = 0.5 as the optional outlier
rate.
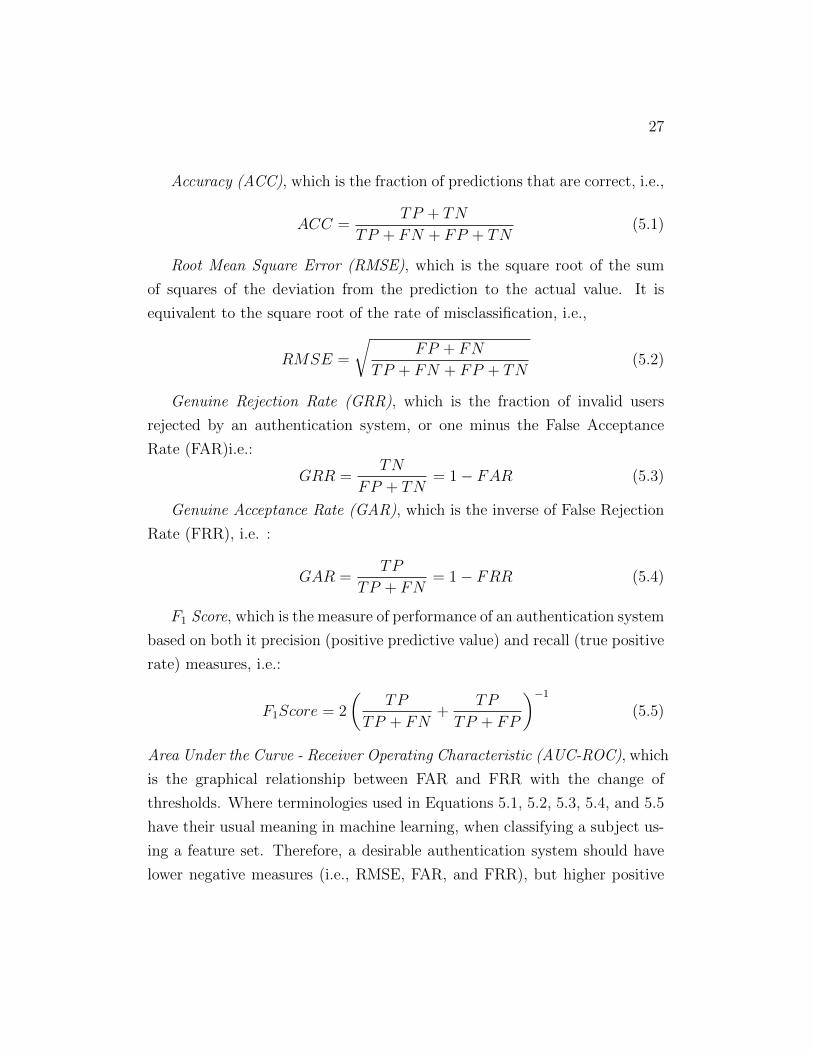
5.2 Performance Measures
To evaluate the performance of different modeling approaches, we consider
the Accuracy (ACC), Root Mean Square Error (RMSE), Genuine Rejection
Rate (GRR) (an inverse measure of the False Acceptance Rate (FAR)), Gen-
uine Acceptance Rate (GAR) (an inverse measure of the False Rejection Rate
(FRR)), F1 Score, Area Under the Curve - Receiver Operating Characteristic
(AUC-ROC). Where terminologies of the measures are defined in the follow-
ing:
27
Accuracy (ACC), which is the fraction of predictions that are correct, i.e.,
ACC =TP + TN
TP + FN + FP + TN(5.1)
Root Mean Square Error (RMSE), which is the square root of the sum
of squares of the deviation from the prediction to the actual value. It is
equivalent to the square root of the rate of misclassification, i.e.,
RMSE =
√FP + FN
TP + FN + FP + TN(5.2)
Genuine Rejection Rate (GRR), which is the fraction of invalid users
rejected by an authentication system, or one minus the False Acceptance
Rate (FAR)i.e.:
GRR =TN
FP + TN= 1 − FAR (5.3)
Genuine Acceptance Rate (GAR), which is the inverse of False Rejection
Rate (FRR), i.e. :
GAR =TP
TP + FN= 1 − FRR (5.4)
F1 Score, which is the measure of performance of an authentication system
based on both it precision (positive predictive value) and recall (true positive
rate) measures, i.e.:
F1Score = 2
(TP
TP + FN+
TP
TP + FP
)−1
(5.5)
Area Under the Curve - Receiver Operating Characteristic (AUC-ROC), which
is the graphical relationship between FAR and FRR with the change of
thresholds. Where terminologies used in Equations 5.1, 5.2, 5.3, 5.4, and 5.5
have their usual meaning in machine learning, when classifying a subject us-
ing a feature set. Therefore, a desirable authentication system should have
lower negative measures (i.e., RMSE, FAR, and FRR), but higher positive
28
measures (i.e., ACC, F1 Score, and AUC-ROC) of performance. In design-
ing security there is a trade-off between FAR and FRR. FAR represents the
strength of the authentication system and is the key goal where the lower the
score the better. However, if you sacrifice too much of FRR (by increasing
FRR to lower FAR) than the usability of the system suffers, pushing users
to opt-out of using the system.
We also use Equal Error Rate (EER), which is defined as the point when
FRR and FAR are equal, i.e., a trade-off between the two error measures
(i.e., FRR and FAR) and with the k-NN Heart Rate model shown in figure
6.7 the EER is at the confidence threshold of 52%.
5.3 Hyper-Parameter Optimization
To avoid creating boiler-plate code, we used the Sci-kit Learn library grid
search function to find the optimal hyper-parameter sets. For each leave-
one-out modeling, we separately perform the hyper-parameter optimization
using various ranges of values. From the different iterations of the leave-one-
out approach, we obtain similar values for the hyper-parameters which are
reflected in Tables in Chapter 6.
Chapter 6
Evaluation
6.1 Authentication Model Evaluation
Here we will discuss the various performances of the Full scheme models and
the Balanced scheme models. Then we will take a look at the what the
differences are and their significance.
6.1.1 Full Scheme performance
We present the performance of the performances of the best classifiers and
their optimal parameter sets for one and two biometric combinations in Table
6.1. We can see that the best HR model (i.e., model that only uses features
from heart rate data) can provide an average accuracy of 0.61± 0.18 and an
average AUC-ROC 0.54 ± 0.07. As we stated previously in Section 4.3, if
the HR model cannot authenticate a user with enough confidence or fails to
authenticate and the user is considered to be non-sedentary, we move on and
consider an additional gait biometric (i.e., HRG model).
Table 6.1 shows that the addition of the gait biometric (when available
and the user is considered non-stationary) along with heart rate, all measures
improve. When observing performance measures of the best HRG model (i.e.,
model that uses heart rate and gait biometrics), ACC increased by 38%, F1
score increased by 218%, and AUC-ROC increased by 56% compared to the
29
30
best HR model. The FAR also improves (i.e., drops) from 0.70 ± 0.20 to
0.26 ± 0.10. While gait data is only available while a user is moving, its
inclusion can be considered available, it can significantly boost the authenti-
cation performance when comparing to a model that uses only less accurate
minute-level heart rate data.
From Table 6.1, we can also observe that the two biometric level seden-
tary model: the HRB model (i.e., model that uses heart rate and breathing
biometrics) achieves even better performance compared to the HRG model.
We achieve a significant 35% drop in the FAR while comparing the HRB with
the HRG model. Along with this, we observe that there is ≈ 8% increases,
while comparing the ACC, F1 score, and AUC-ROC when comparing the
to its two biometric non-stationary counterpart. However, when comparing
the HRB model to the HR model, we observe a much larger performance
improvement. Compared to the HR model, the HRB model performs better
with a F1 score (an increase of 241%) and AUC-ROC (an increase of 68%)
with high accuracy of 0.91± 0.02. This shows that is breathing audio is also
available it greatly strengthens the performance of the sedentary model from
just heart rate.
Lastly we present the performance comparison among all the different
classification models we considered. Their optimal parameter sets using the
heart rate, gait, and breathing biometrics together can be seen in Table 6.2,.
From the table, we observe that there is a modest performance improvement
when comparing the HRGB model with the HRB model, i.e., an accuracy
increase of accuracy by 2% (0.91 to 0.93). Similar pattern of small im-
provements are observed in the case of other performance metrics. Although
improvements to scores are minimal, in the case of the HRGB model, we
obtain a simpler and faster classifier, i.e., the k-NN with k = 2 (number of
neighbors needed for classification), when compared to the HRB model that
uses the k-NN model with k = 6. Therefore, if we consider the implemen-
tation feasibility on limited power devices, i.e., a wearable, that has energy
31
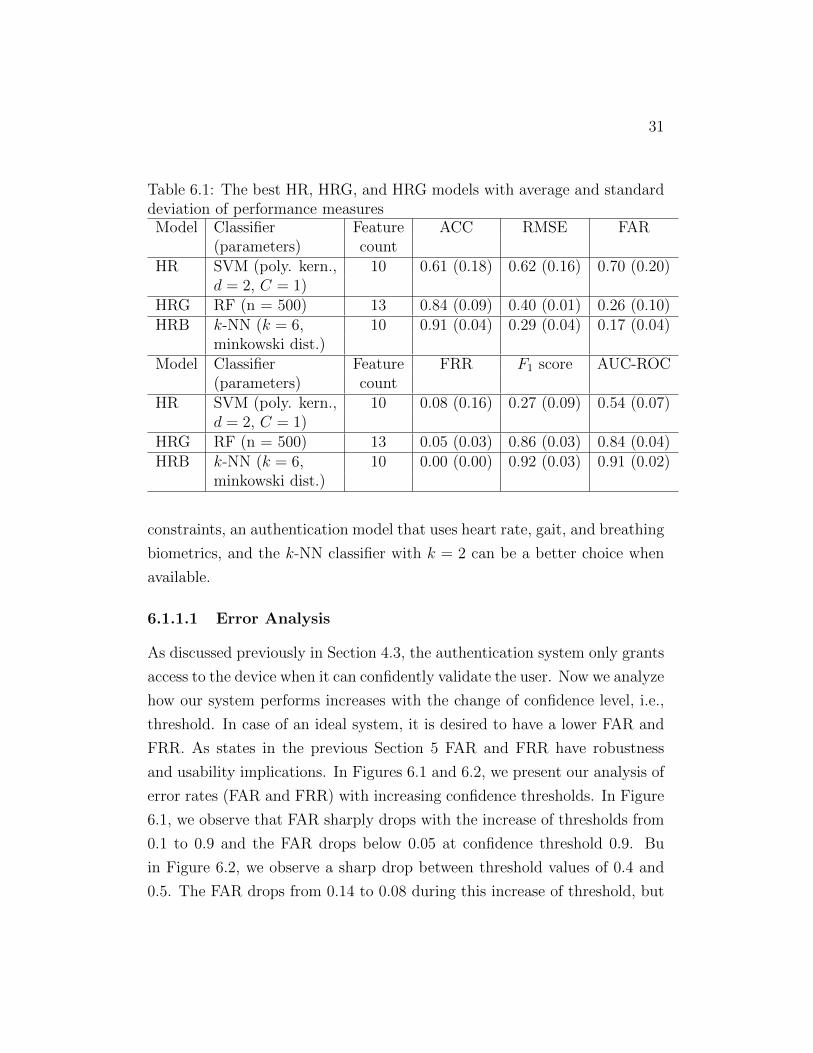
Table 6.1: The best HR, HRG, and HRG models with average and standarddeviation of performance measuresModel Classifier Feature ACC RMSE FAR
(parameters) countHR SVM (poly. kern., 10 0.61 (0.18) 0.62 (0.16) 0.70 (0.20)
d = 2, C = 1)HRG RF (n = 500) 13 0.84 (0.09) 0.40 (0.01) 0.26 (0.10)HRB k-NN (k = 6, 10 0.91 (0.04) 0.29 (0.04) 0.17 (0.04)
minkowski dist.)Model Classifier Feature FRR F1 score AUC-ROC
(parameters) countHR SVM (poly. kern., 10 0.08 (0.16) 0.27 (0.09) 0.54 (0.07)
d = 2, C = 1)HRG RF (n = 500) 13 0.05 (0.03) 0.86 (0.03) 0.84 (0.04)HRB k-NN (k = 6, 10 0.00 (0.00) 0.92 (0.03) 0.91 (0.02)
minkowski dist.)
constraints, an authentication model that uses heart rate, gait, and breathing
biometrics, and the k-NN classifier with k = 2 can be a better choice when
available.
6.1.1.1 Error Analysis
As discussed previously in Section 4.3, the authentication system only grants
access to the device when it can confidently validate the user. Now we analyze
how our system performs increases with the change of confidence level, i.e.,
threshold. In case of an ideal system, it is desired to have a lower FAR and
FRR. As states in the previous Section 5 FAR and FRR have robustness
and usability implications. In Figures 6.1 and 6.2, we present our analysis of
error rates (FAR and FRR) with increasing confidence thresholds. In Figure
6.1, we observe that FAR sharply drops with the increase of thresholds from
0.1 to 0.9 and the FAR drops below 0.05 at confidence threshold 0.9. Bu
in Figure 6.2, we observe a sharp drop between threshold values of 0.4 and
0.5. The FAR drops from 0.14 to 0.08 during this increase of threshold, but
32
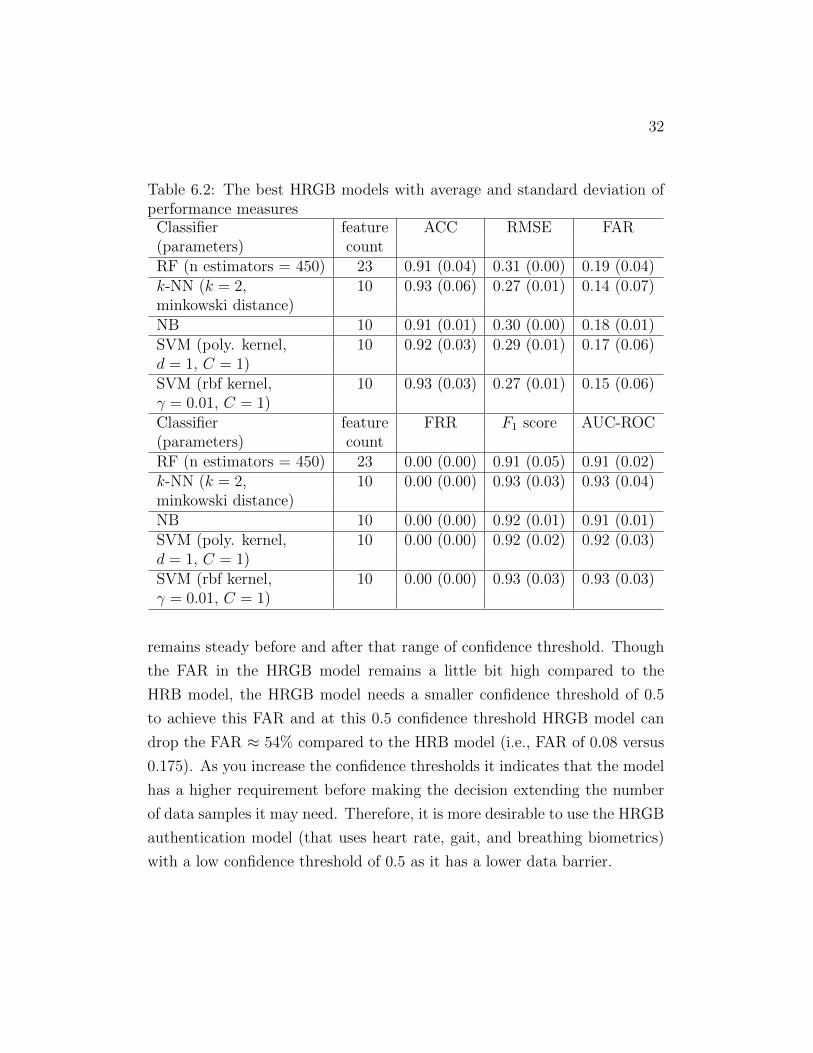
Table 6.2: The best HRGB models with average and standard deviation ofperformance measures
Classifier feature ACC RMSE FAR(parameters) countRF (n estimators = 450) 23 0.91 (0.04) 0.31 (0.00) 0.19 (0.04)k-NN (k = 2, 10 0.93 (0.06) 0.27 (0.01) 0.14 (0.07)minkowski distance)NB 10 0.91 (0.01) 0.30 (0.00) 0.18 (0.01)SVM (poly. kernel, 10 0.92 (0.03) 0.29 (0.01) 0.17 (0.06)d = 1, C = 1)SVM (rbf kernel, 10 0.93 (0.03) 0.27 (0.01) 0.15 (0.06)γ = 0.01, C = 1)Classifier feature FRR F1 score AUC-ROC(parameters) countRF (n estimators = 450) 23 0.00 (0.00) 0.91 (0.05) 0.91 (0.02)k-NN (k = 2, 10 0.00 (0.00) 0.93 (0.03) 0.93 (0.04)minkowski distance)NB 10 0.00 (0.00) 0.92 (0.01) 0.91 (0.01)SVM (poly. kernel, 10 0.00 (0.00) 0.92 (0.02) 0.92 (0.03)d = 1, C = 1)SVM (rbf kernel, 10 0.00 (0.00) 0.93 (0.03) 0.93 (0.03)γ = 0.01, C = 1)
remains steady before and after that range of confidence threshold. Though
the FAR in the HRGB model remains a little bit high compared to the
HRB model, the HRGB model needs a smaller confidence threshold of 0.5
to achieve this FAR and at this 0.5 confidence threshold HRGB model can
drop the FAR ≈ 54% compared to the HRB model (i.e., FAR of 0.08 versus
0.175). As you increase the confidence thresholds it indicates that the model
has a higher requirement before making the decision extending the number
of data samples it may need. Therefore, it is more desirable to use the HRGB
authentication model (that uses heart rate, gait, and breathing biometrics)
with a low confidence threshold of 0.5 as it has a lower data barrier.
33
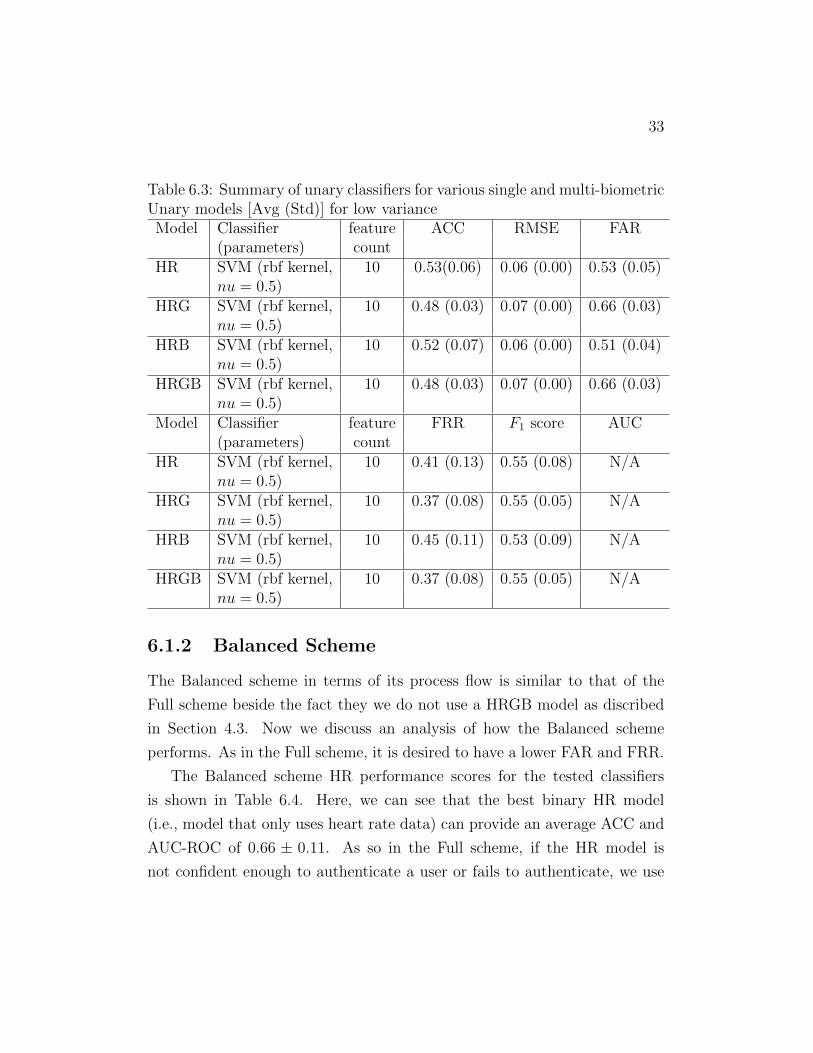
Table 6.3: Summary of unary classifiers for various single and multi-biometricUnary models [Avg (Std)] for low varianceModel Classifier feature ACC RMSE FAR
(parameters) countHR SVM (rbf kernel, 10 0.53(0.06) 0.06 (0.00) 0.53 (0.05)
nu = 0.5)HRG SVM (rbf kernel, 10 0.48 (0.03) 0.07 (0.00) 0.66 (0.03)
nu = 0.5)HRB SVM (rbf kernel, 10 0.52 (0.07) 0.06 (0.00) 0.51 (0.04)
nu = 0.5)HRGB SVM (rbf kernel, 10 0.48 (0.03) 0.07 (0.00) 0.66 (0.03)
nu = 0.5)Model Classifier feature FRR F1 score AUC
(parameters) countHR SVM (rbf kernel, 10 0.41 (0.13) 0.55 (0.08) N/A
nu = 0.5)HRG SVM (rbf kernel, 10 0.37 (0.08) 0.55 (0.05) N/A
nu = 0.5)HRB SVM (rbf kernel, 10 0.45 (0.11) 0.53 (0.09) N/A
nu = 0.5)HRGB SVM (rbf kernel, 10 0.37 (0.08) 0.55 (0.05) N/A
nu = 0.5)
6.1.2 Balanced Scheme
The Balanced scheme in terms of its process flow is similar to that of the
Full scheme beside the fact they we do not use a HRGB model as discribed
in Section 4.3. Now we discuss an analysis of how the Balanced scheme
performs. As in the Full scheme, it is desired to have a lower FAR and FRR.
The Balanced scheme HR performance scores for the tested classifiers
is shown in Table 6.4. Here, we can see that the best binary HR model
(i.e., model that only uses heart rate data) can provide an average ACC and
AUC-ROC of 0.66 ± 0.11. As so in the Full scheme, if the HR model is
not confident enough to authenticate a user or fails to authenticate, we use
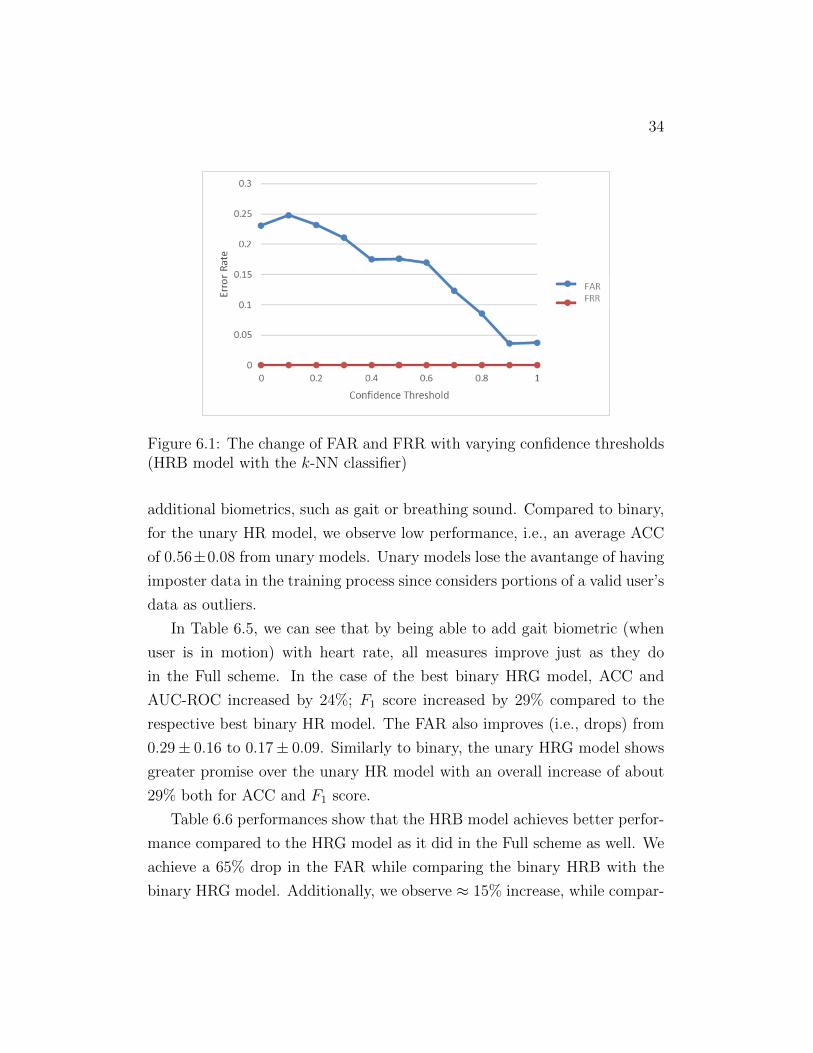
34
Figure 6.1: The change of FAR and FRR with varying confidence thresholds(HRB model with the k-NN classifier)
additional biometrics, such as gait or breathing sound. Compared to binary,
for the unary HR model, we observe low performance, i.e., an average ACC
of 0.56±0.08 from unary models. Unary models lose the avantange of having
imposter data in the training process since considers portions of a valid user’s
data as outliers.
In Table 6.5, we can see that by being able to add gait biometric (when
user is in motion) with heart rate, all measures improve just as they do
in the Full scheme. In the case of the best binary HRG model, ACC and
AUC-ROC increased by 24%; F1 score increased by 29% compared to the
respective best binary HR model. The FAR also improves (i.e., drops) from
0.29 ± 0.16 to 0.17 ± 0.09. Similarly to binary, the unary HRG model shows
greater promise over the unary HR model with an overall increase of about
29% both for ACC and F1 score.
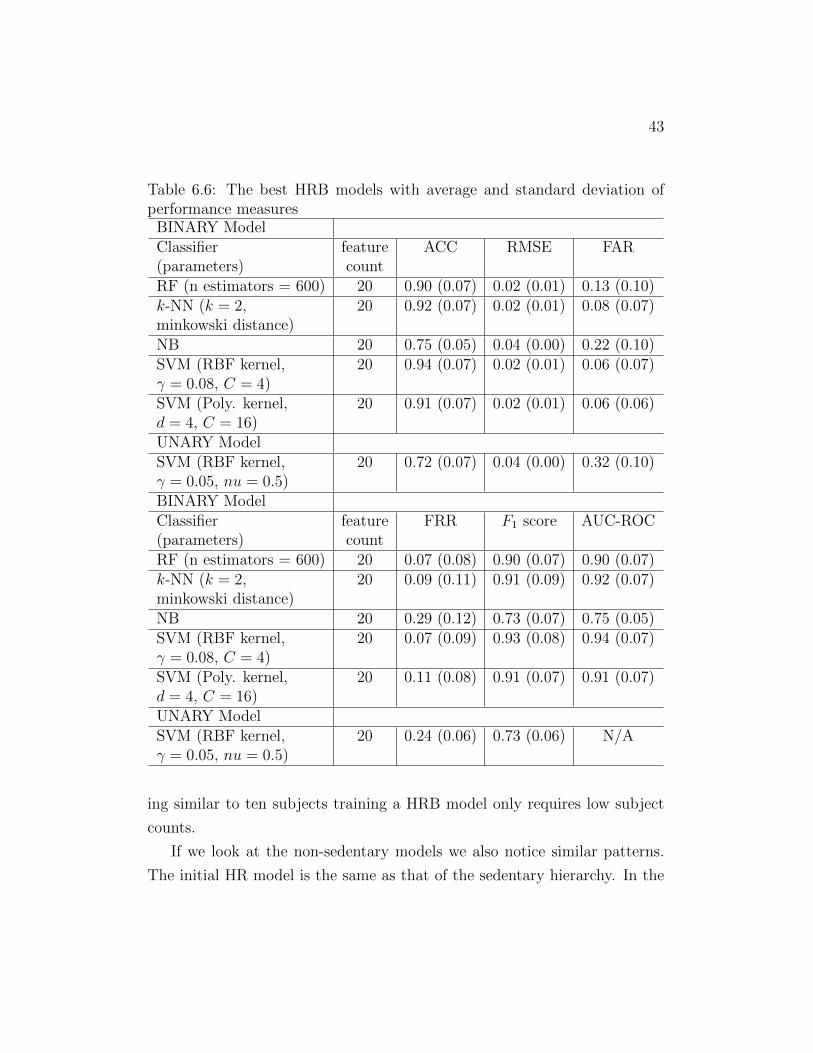
Table 6.6 performances show that the HRB model achieves better perfor-
mance compared to the HRG model as it did in the Full scheme as well. We
achieve a 65% drop in the FAR while comparing the binary HRB with the
binary HRG model. Additionally, we observe ≈ 15% increase, while compar-

35
Figure 6.2: The change of FAR and FRR with varying confidence thresholds(HRGB model with the k-NN classifier)
ing the ACC, F1 score, and AUC-ROC of the binary HRB model with the
binary HRG model. While comparing the HRB model to the HR model, we
observe a similar huge performance improvement. Compared to the binary
HR model, the binary HRB model performs better in terms of F1 score (an
increase of 48%) and AUC-ROC (an increase of 42%) with high accuracy of
0.94 ± 0.07. The unary HRB model performs similarly to the unary HRG
model with a lower standard deviation, i.e., higher consistency, in terms of
ACC (0.10 vs. 0.07) and F1 score (0.09 vs. 0.06).
Since the performances between Full scheme and Balance scheme echo
each other, we want to take a different view of the Balanced scheme’s perfor-
mance measures to see what we can observe from both. In Figure 6.3and 6.4,
we present the visualization of different performance measures. In addition
to the traditional five measures of a box plot, we also present the average
value.
In Figure 6.3and 6.4, we revisit the performances in Table 6.6. The plot
36
Figure 6.3: Box plots of (a) positive and (b) negative measures of performanceof the HRB model with Binary SVM RBF classifier. Cross markers (×)represent the average values.
37
Figure 6.4: Box plots of (a) positive and (b) negative measures of performanceof the HRB model with Unary SVM RBF classifier. Cross markers (×)represent the average values.

38
Figure 6.5: PDF and CDF with error bars of binary HRB SVM (RBF) modelperformance.
Figure 6.6: PDF and CDF with error bars of unary HRB SVM (RBF) modelperformance
39
shows that the median of each performance measure is better than average
since the average metric is easily affected by outliers, which we left out for
the simplicity of visualization. We obtain 2.6% better ACC, 2.8% better F1
score, 59% better FAR, and 89% better FRR, while comparing the median
with average values. Additionally, we observe that the interquartile ranges
ofdifferent performance measures are about 0.07 (Upper Figure 6.3) and 0.05
(Lower Figure 6.3). Similarly, unary models in Upper Figures 6.4 and Lower
Figure 6.4 show in the case of unary modeling, we obtain tighter interquar-
tile ranges. These narrow interquartile ranges represent the consistency of
performance measures.
Another view is that of the distribution scores through buckets. Figure
6.5 and 6.6 present the Probability Distribution Function (PDF) and Cu-
mulative Distribution Function (CDF) with error bars of performance of the
best binary and unary models, respectively. In Figure 6.5, around 65% of
the performance values (both ACC and F1 scores) fall in the range of 0.95–1,
which shows that our models perform very well for the most of the cases.
In the case of unary modeling, we observe that ≈ 66% (23) of the values fall
in the range of 0.7–0.8, which is also a reasonable performance for unary
model (16). Additionally, in the figure, we observe that both binary and
unary errors bars are very short, i.e., achieved performance values are highly
consistent. Therefore, our developed models consistently perform well.
6.1.2.1 Error Analysis
Now we present an analysis on how Balanced scheme performs with the
change of confidence levels, i.e., thresholds, preferring to have a lower FAR
and FRR. In Figures 6.7, we present our analysis of error rates (FAR and
FRR) with varying confidence thresholds for the binary HRB SVM (RBF)
model. We observe that at confidence threshold 0.52 FAR and FRR intersects
with an equal error rate (EER) of about 0.06. After this point, error rates
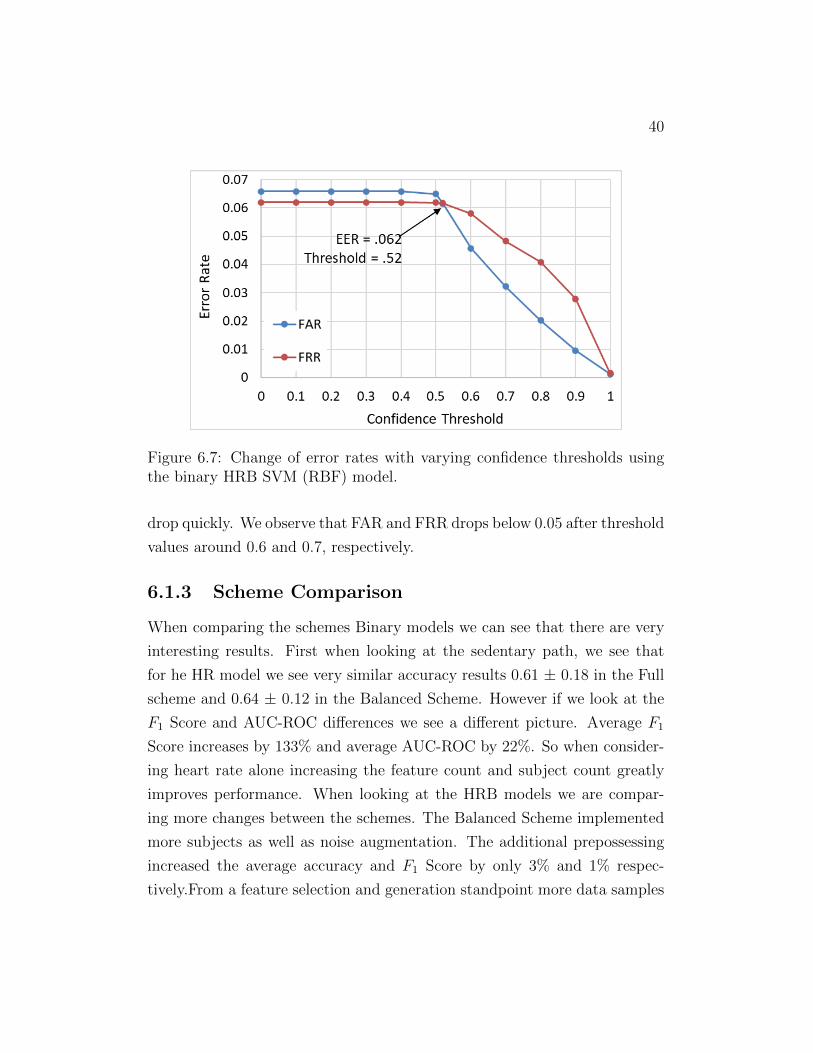
40
Figure 6.7: Change of error rates with varying confidence thresholds usingthe binary HRB SVM (RBF) model.
drop quickly. We observe that FAR and FRR drops below 0.05 after threshold
values around 0.6 and 0.7, respectively.
6.1.3 Scheme Comparison
When comparing the schemes Binary models we can see that there are very
interesting results. First when looking at the sedentary path, we see that
for he HR model we see very similar accuracy results 0.61 ± 0.18 in the Full
scheme and 0.64 ± 0.12 in the Balanced Scheme. However if we look at the
F1 Score and AUC-ROC differences we see a different picture. Average F1
Score increases by 133% and average AUC-ROC by 22%. So when consider-
ing heart rate alone increasing the feature count and subject count greatly
improves performance. When looking at the HRB models we are compar-
ing more changes between the schemes. The Balanced Scheme implemented
more subjects as well as noise augmentation. The additional prepossessing
increased the average accuracy and F1 Score by only 3% and 1% respec-
tively.From a feature selection and generation standpoint more data samples
41
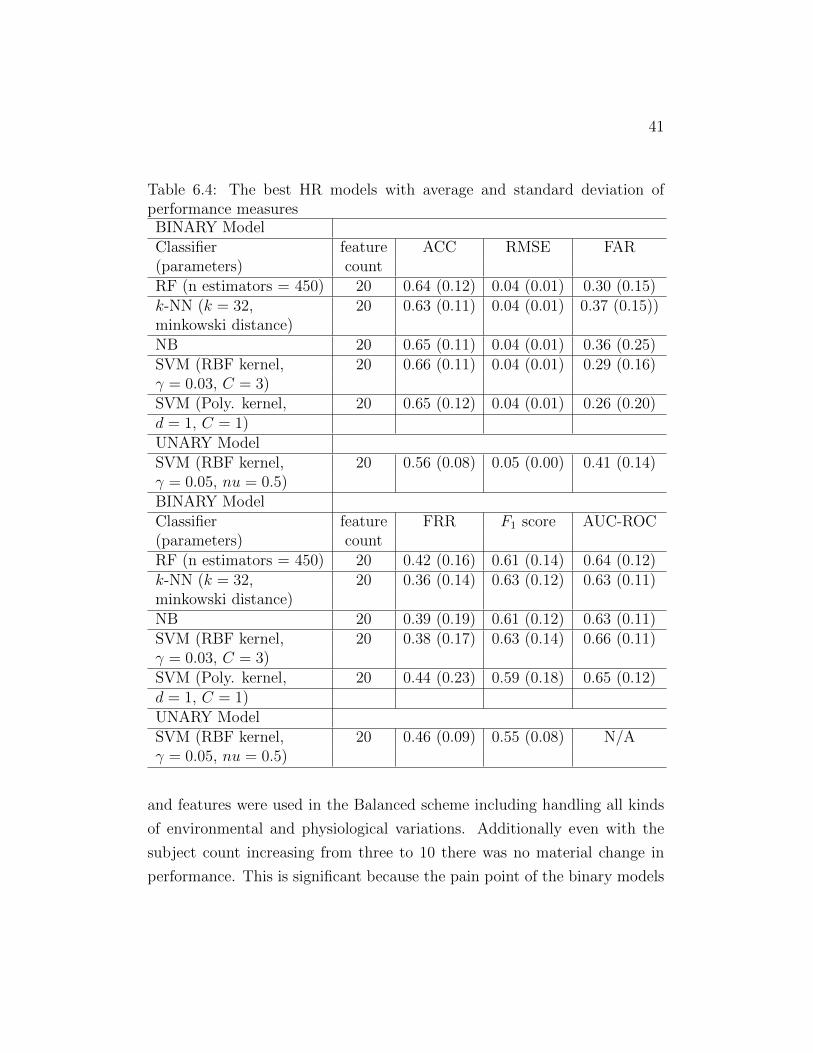
Table 6.4: The best HR models with average and standard deviation ofperformance measuresBINARY ModelClassifier feature ACC RMSE FAR(parameters) countRF (n estimators = 450) 20 0.64 (0.12) 0.04 (0.01) 0.30 (0.15)k-NN (k = 32, 20 0.63 (0.11) 0.04 (0.01) 0.37 (0.15))minkowski distance)NB 20 0.65 (0.11) 0.04 (0.01) 0.36 (0.25)SVM (RBF kernel, 20 0.66 (0.11) 0.04 (0.01) 0.29 (0.16)γ = 0.03, C = 3)SVM (Poly. kernel, 20 0.65 (0.12) 0.04 (0.01) 0.26 (0.20)d = 1, C = 1)UNARY ModelSVM (RBF kernel, 20 0.56 (0.08) 0.05 (0.00) 0.41 (0.14)γ = 0.05, nu = 0.5)BINARY ModelClassifier feature FRR F1 score AUC-ROC(parameters) countRF (n estimators = 450) 20 0.42 (0.16) 0.61 (0.14) 0.64 (0.12)k-NN (k = 32, 20 0.36 (0.14) 0.63 (0.12) 0.63 (0.11)minkowski distance)NB 20 0.39 (0.19) 0.61 (0.12) 0.63 (0.11)SVM (RBF kernel, 20 0.38 (0.17) 0.63 (0.14) 0.66 (0.11)γ = 0.03, C = 3)SVM (Poly. kernel, 20 0.44 (0.23) 0.59 (0.18) 0.65 (0.12)d = 1, C = 1)UNARY ModelSVM (RBF kernel, 20 0.46 (0.09) 0.55 (0.08) N/Aγ = 0.05, nu = 0.5)
and features were used in the Balanced scheme including handling all kinds
of environmental and physiological variations. Additionally even with the
subject count increasing from three to 10 there was no material change in
performance. This is significant because the pain point of the binary models

42
Table 6.5: The best HRG models with average and standard deviation ofperformance measures
BINARY ModelClassifier feature ACC RMSE FAR(parameters) countRF (n estimators = 450) 20 0.69 (0.13) 0.04 (0.01) 0.47 (0.32)k-NN (k = 24, 20 0.79 (0.07) 0.03 (0.01) 0.19 (0.10)minkowski distance)NB 20 0.65 (0.10) 0.04 (0.01) 0.28 (0.26)SVM (RBF kernel, 20 0.82 (0.08) 0.03 (0.01) 0.17 (0.09)γ = 0.05, C = 5)SVM (Poly. kernel, 20 0.78 (0.09) 0.03 (0.01) 0.19 (0.12)d = 3, C = 14) 20UNARY ModelSVM (RBF kernel, 20 0.72 (0.10) 0.04 (0.01) 0.28 (0.16)γ = 0.05, nu = 0.5)BINARY ModelClassifier feature FRR F1 score AUC-ROC(parameters) countRF (n estimators = 450) 20 0.15 (0.21) 0.73 (0.21) 0.71 (0.13)k-NN (k = 24, 20 0.23 (0.09) 0.79 (0.08) 0.79 (0.07)minkowski distance)NB 20 0.42 (0.27) 0.62 (0.20) 0.66 (0.10)SVM (RBF kernel, 20 0.19 (0.10) 0.81 (0.08) 0.82 (0.08)γ = 0.05, C = 5)SVM (Poly. kernel, 20 0.25 (0.13) 0.77 (0.10) 0.78 (0.09)d = 3, C = 14) 20UNARY ModelSVM (RBF kernel, 20 0.29 (0.08) 0.72 (0.09) N/Aγ = 0.05, nu = 0.5)
is that it required other person’s data when considering implementation. If
large verity of subjects data is needed it becomes more difficult to implement
as there does not need to be as many user’s data exposed when training
and can be scaled to a small user base. With three subject count perform-
43
Table 6.6: The best HRB models with average and standard deviation ofperformance measures
BINARY ModelClassifier feature ACC RMSE FAR(parameters) countRF (n estimators = 600) 20 0.90 (0.07) 0.02 (0.01) 0.13 (0.10)k-NN (k = 2, 20 0.92 (0.07) 0.02 (0.01) 0.08 (0.07)minkowski distance)NB 20 0.75 (0.05) 0.04 (0.00) 0.22 (0.10)SVM (RBF kernel, 20 0.94 (0.07) 0.02 (0.01) 0.06 (0.07)γ = 0.08, C = 4)SVM (Poly. kernel, 20 0.91 (0.07) 0.02 (0.01) 0.06 (0.06)d = 4, C = 16)UNARY ModelSVM (RBF kernel, 20 0.72 (0.07) 0.04 (0.00) 0.32 (0.10)γ = 0.05, nu = 0.5)BINARY ModelClassifier feature FRR F1 score AUC-ROC(parameters) countRF (n estimators = 600) 20 0.07 (0.08) 0.90 (0.07) 0.90 (0.07)k-NN (k = 2, 20 0.09 (0.11) 0.91 (0.09) 0.92 (0.07)minkowski distance)NB 20 0.29 (0.12) 0.73 (0.07) 0.75 (0.05)SVM (RBF kernel, 20 0.07 (0.09) 0.93 (0.08) 0.94 (0.07)γ = 0.08, C = 4)SVM (Poly. kernel, 20 0.11 (0.08) 0.91 (0.07) 0.91 (0.07)d = 4, C = 16)UNARY ModelSVM (RBF kernel, 20 0.24 (0.06) 0.73 (0.06) N/Aγ = 0.05, nu = 0.5)
ing similar to ten subjects training a HRB model only requires low subject
counts.
If we look at the non-sedentary models we also notice similar patterns.
The initial HR model is the same as that of the sedentary hierarchy. In the

44
two biometric form we have HRG. The performances tell the same story of
that of HRB. This time Balance scheme is outperforming the Full scheme in
average accuracy and average F1 Score by 3% and 1%. Here there is no change
in data features and augmentation but there is no significant difference in
performance when increasing feature count. Along with the same conclusion
drawn in HRB, we see that regardless of activity state (i.e. sedentary or
non-sedentary) low levels if imposter data is needed. When looking at the
highest non-sedentary model in the Full scheme we see that we have a much
greater performance in the HRGB model than the HRG model of that of the
Balanced scheme. The HRGB outperforms in average accuracy by 11%. This
indicates that increasing the biometrics is the biggest boost to performance
and this can be done with low subject count in the training process.
Uniary models only need to train with the user’s own data and thus does
not worry about the subject count in terms of imposter data to train on.
When looking at the unary results we see something else. For unary HR
models between the schemes the only difference is feature count and, but
there is no substantial different performance with the same average F1 score
and a difference of 0.03 in average accuracy. However when looking at the
two biometric combinations the feature count makes a big difference. For
the full scheme HRG provided close to guessing at 0.48 ± 0.03 accuracy and
0.55 ± 0.05 but then the balanced scheme rose to 0.72 ± 0.10 and 0.72 ±0.09. HRB has similar results with the Balance scheme outperforming the
Full scheme 38% and 36% for average accuracy and F1 score respectively.
When considering three biometrics performance actually does not improve
much with no improvement in accuracy or F1 score from HRG to HRGB. So
increasing to many biometrics is not as advantageous in unary training.
Chapter 7
Conclusion and Future Work
In the work we present, we tested the feasibility of authenticating users im-
plicitly based on the three separate biometrics, i.e., heart rate, gait, and
breathing sounds, which are easily obtainable in most of the market wear-
ables. We tried two authentication schemes: the Full scheme and the Balance
scheme. Between the two we found that in the binary case there does not need
to be a high diversity of imposter data to provide high accuracy results and
that increasing the available biometrics in a model increases performance.
For unary cases, we found that increased features to 20 provided the best
performance while increasing biometric only helped up to a point. Through
our detailed analysis, we show that we can authenticate a user with an av-
erage accuracy of 0.94 ± 0.07 and F1 score of 0.93 ± 0.08 using SVM (RBF
kernel) when the user is sedentary. When non-sedentary, average accuracy
of 0.93 ± 0.06 and F1 score of 0.93 ± 0.03, using k Nearest Neighbors (k=2).
When considering the lack of availability of other subject’s data, unary mod-
els and obtain an average accuracy of 0.72 ± 0.10 and a F1 score 0.73 ± 0.06
when sedentary and 0.72 ± 0.10 and a F1 score 0.72 ± 0.09 respective scores
in the non-stationary state.
Things to consider in the future is a complex multi-layered feature se-
lection method and using deep neural networks. This shows the promise to
develop a continuous implicit-authentication system for the market wearables
45

46
utilizing their limited sensing and computational capability in order to se-
cure our valuable information as well as to create a safe gateway to unlocking
cars, access online accounts, etc.
Acknowledgement
This work combines data from multiple sources with the consideration of
the independence of among the data types. So the virtual humans we have
mimiced in this work to test the feasibility of this multi-modal research may
not resemble the same result as when the multiple data originates from a
single person. Therefore to finalize this work for a specific individual multi-
modal data should be collected from that individual and models should be
trained accordingly. Thereby the system will generate the performance from
a specific user.
Bibliography
[1] “Digital trends 2020: Every single stat you need to know
about the internet,” Accessed: December 2020. [Online]. Available:
https://rb.gy/5nq4j1
[2] “How customer experience drives digital transformation,” Accessed:
December 2020. [Online]. Available: https://rb.gy/ikzoos
[3] “Social network usage growth statistics: How many people use
social media in 2020?” Accessed: December 2020. [Online]. Available:
https://rb.gy/gxd9wk
[4] “Mcafee research finds troubling use of insecure cloud passwords,”
Accessed: June 2020. [Online]. Available: https://rb.gy/7fnde8
[5] D. R. Pilar, A. Jaeger, C. F. Gomes, and L. M. Stein, “Passwords usage
and human memory limitations: A survey across age and educational
background,” PloS one, vol. 7, no. 12, p. e51067, 2012.
[6] “Internet,” Accessed: October 2020. [Online]. Available:
https://ourworldindata.org/internet
[7] “Forecasted value of the global wearable devices market,” Accessed:
February 2018. [Online]. Available: https://goo.gl/C682Rv
47
48
[8] M. Guerar, L. Verderame, A. Merlo, F. Palmieri, M. Migliardi, and
L. Vallerini, “Circlepin: A novel authentication mechanism for smart-
watches to prevent unauthorized access to iot devices,” ACM Transac-
tions on Cyber-Physical Systems, vol. 4, no. 3, pp. 1–19, 2020.
[9] J. Unar, W. C. Seng, and A. Abbasi, “A review of biometric technology
along with trends and prospects,” Pattern recognition, vol. 47, no. 8, pp.
2673–2688, 2014.
[10] Y. Zeng, A. Pande, J. Zhu et al., “Wearia: Wearable device implicit au-
thentication based on activity information,” in IEEE A World of Wire-
less, Mobile and Multimedia Networks (WoWMoM), 2017.
[11] T. Nguyen and N. Memon, “Smartwatches locking methods: A compar-
ative study,” in Symposium on Usable Privacy and Security, 2017.
[12] W. Cheung and S. Vhaduri, “Continuous authentication of wearable de-
vice users from heart rate, gait, and breathing data,” in IEEE RAS &
EMBS International Conference on Biomedical Robotics and Biomecha-
tronics, 2020.
[13] F. Sun, C. Mao, X. Fan, and Y. Li, “Accelerometer-based speed-adaptive
gait authentication method for wearable iot devices,” IEEE Internet of
Things Journal, vol. 6, no. 1, pp. 820–830, 2018.
[14] H. Dai, W. Wang, A. X. Liu et al., “Speech based human authentica-
tion on smartphones,” in IEEE International Conference on Sensing,
Communication, and Networking (SECON), 2019.
[15] S. Vhaduri and C. Poellabauer, “Wearable device user authentication
using physiological and behavioral metrics,” in 2017 IEEE 28th Annual
International Symposium on Personal, Indoor, and Mobile Radio Com-
munications (PIMRC). IEEE, 2017, pp. 1–6.
49
[16] ——, “Multi-modal biometric-based implicit authentication of wearable
device users,” IEEE Transactions on Information Forensics and Secu-
rity, vol. 14, no. 12, pp. 3116–3125, 2019.
[17] A. Bianchi and I. Oakley, “Wearable authentication: Trends and oppor-
tunities,” it-Information Technology, vol. 58, no. 5, pp. 255–262, 2016.
[18] J. Blasco, T. M. Chen, J. Tapiador et al., “A survey of wearable bio-
metric recognition systems,” ACM Computing Surveys, vol. 49, no. 3,
p. 43, 2016.
[19] C. Cornelius, J. Sorber, R. A. Peterson et al., “Who wears me?
bioimpedance as a passive biometric.” in HealthSec, 2012.
[20] “Apple watch ekg not as accurate for younger people, physician says,”
Accessed: January 2020. [Online]. Available: shorturl.at/cnwS7
[21] O. Toygar, F. O. Babalola, and other, “Fyo: A novel multimodal vein
database with palmar, dorsal and wrist biometrics,” IEEE Access, vol. 8,
pp. 82 461–82 470, 2020.
[22] V. Kapoor, R. Singh, R. Reddy, and P. Churi, “Privacy issues in wear-
able technology: An intrinsic review,” Available at SSRN 3566918, 2020.
[23] M. Caprolu, S. Sciancalepore, and R. Di Pietro, “Short-range audio
channels security: Survey of mechanisms, applications, and research
challenges,” IEEE Communications Surveys & Tutorials, 2020.
[24] G. M. Weiss, K. Yoneda, and T. Hayajneh, “Smartphone and
smartwatch-based biometrics using activities of daily living,” IEEE Ac-
cess, vol. 7, pp. 133 190–133 202, 2019.
[25] A. K. Baughman, C. J. Dawson, B. M. Graham, and D. J. Kamalsky,
“System and method for virtual world biometric analytics through the
50
use of a multimodal biometric analytic wallet,” Jun. 9 2020, uS Patent
10,679,749.
[26] Y. Liang, S. Samtani, B. Guo, and Z. Yu, “Behavioral biometrics for
continuous authentication in the internet of things era: An artificial
intelligence perspective,” IEEE Internet of Things Journal, 2020.
[27] D. Kumari, U. Sharma et al., “A novel approach for secure multimodal
biometric system using multiple biometric traits,” IJRAR-International
Journal of Research and Analytical Reviews (IJRAR), vol. 7, no. 1, pp.
62–67, 2020.
[28] M. Ghayoumi, “A review of multimodal biometric systems: Fusion
methods and their applications,” in IEEE/ACIS Computer and Infor-
mation Science (ICIS), 2015.
[29] T. Zhu, Z. Qu, H. Xu, J. Zhang, Z. Shao, Y. Chen, S. Prabhakar, and
J. Yang, “Riskcog: Unobtrusive real-time user authentication on mobile
devices in the wild,” IEEE Transactions on Mobile Computing, vol. 19,
no. 2, pp. 466–483, 2019.
[30] S. Vhaduri and C. Poellabauer, “Biometric-based wearable user authen-
tication during sedentary and non-sedentary periods,” arXiv preprint
arXiv:1811.07060, 2018.
[31] M. Rybnicek, C. Lang-Muhr, and D. Haslinger, “A roadmap to con-
tinuous biometric authentication on mobile devices,” in 2014 Inter-
national Wireless Communications and Mobile Computing Conference
(IWCMC). IEEE, 2014, pp. 122–127.
[32] S. Davidson, D. Smith, C. Yang et al., “Smartwatch user identification
as a means of authentication,” Department of Computer Science and
Engineering Std, 2016.
51
[33] Y. Li, H. Hu, and G. Zhou, “Using data augmentation in continuous au-
thentication on smartphones,” IEEE Internet of Things Journal, vol. 6,
no. 1, pp. 628–640, 2018.
[34] J. Liebers and S. Schneegass, “Introducing functional biometrics: Using
body-reflections as a novel class of biometric authentication systems,”
in Extended Abstracts of the 2020 CHI Conference on Human Factors
in Computing Systems, 2020, pp. 1–7.
[35] D. Ekiz, Y. S. Can, Y. C. Dardagan, and C. Ersoy, “Can a smartband
be used for continuous implicit authentication in real life,” IEEE Access,
vol. 8, pp. 59 402–59 411, 2020.
[36] W. Cheung and S. Vhaduri, “Context-dependent implicit authentication
for wearable device users,” in IEEE Personal, Indoor and Mobile Radio
Communications (PIMRC), 2020.
[37] S. Vhaduri and C. Poellabauer, “Towards reliable wearable-user identi-
fication,” in 2017 IEEE International Conference on Healthcare Infor-
matics (ICHI). IEEE, 2017, pp. 329–329.
[38] ——, “Opportunistic discovery of personal places using multi-source sen-
sor data,” IEEE Transactions on Big Data, 2018.
[39] ——, “Hierarchical cooperative discovery of personal places from loca-
tion traces,” IEEE Transactions on Mobile Computing, vol. 17, no. 8,
pp. 1865–1878, 2018.
[40] “Wisdm: Wireless sensor data mining,” Accessed: November 2019.
[Online]. Available: https://bit.ly/37fwI7j
[41] “Esc-50: Dataset for environmental sound classification,” Accessed:
November 2019. [Online]. Available: https://bit.ly/2uT9Ddc

52
[42] S. Vhaduri, “Nocturnal cough and snore detection using smartphones in
presence of multiple background-noises,” in Proceedings of the 3rd ACM
SIGCAS Conference on Computing and Sustainable Societies, 2020, pp.
174–186.
[43] B. McFee and S. Balke, “Librosa: Python tools for music and audio
analysis.” [Online]. Available: https://github.com/librosa
ABSTRACT
William Cheung
Bsc, Stony Brook University
MS, Fordham University
Multi-modal User Authentication Using Biometrics
Dissertation directed by Sudip Vhaduri, Ph.D.
The connectivity of smart technology is ever increasing with the expan-
sion of internet availability. Emerging applications such as financial transac-
tions, healthcare check-ups, and property access can be made through smart
technologies. This also presents a new vulnerability as hackers have more
opportunities to attack users. Therefore, there is an immediate emphasis
on a strong authentication system. While passwords, PINs, or pattern locks
can overwhelm users, active biometric schemes like retina scans require active
use and cannot be used in continuous situations. A solution to this is the
use of implicit continuous biometrics such as heart rate, gait, and breath-
ing patterns. In this work, we present two context-dependent soft-biometric-
based wearable authentication system strategies utilizing the heart rate, gait,
and breathing audio signals. From our detailed analysis, we find that in a
sedentary state, a binary support vector machine with radial basis function
(RBF) kernel can achieve an average accuracy of 0.94 ± 0.07 and F1 score
of 0.93 ± 0.08. In a non-sedentary state, k- Nearest Neighbors (k=2) can
achieve an average accuracy of 0.93± 0.06 and F1 score of 0.93± 0.03, which
shows the promise of this work. Considering the availability of a single users
data, we develop unary models and obtain an average accuracy of 0.72±0.10

and a F1 score 0.73 ± 0.06 when sedentary and 0.72 ± 0.10 and a F1 score
0.72 ± 0.09 respective scores when non-stationary.
Keywords: Wearable User Authentication, Implicit Authentication, Secu-
rity, Multi-Biometric Model
VITA
William Chunsham Cheung was born to Naipor Cheung and Mayiee Lee
on March 12th, 1994 in the town of Williamsburg Virginia. In the year
2012, he attended Stony brook university as a University Scholar along with
a Presidential Scholarship. He would graduate Cum Laude, with a double
major receiving a Bachelor of Science degree in Applied Mathematics with a
second major in Economics and a minor in Accounting.
From 2016 he would go on to work at National Grid in the accounting
department as an analyst, managing the ledger while automating certain
accounting practices. By 2019 he would attend Fordham university to study
Masters in Data Science with a GSAS Centennial Scholarship. He would
also have the opportunity to work under Prof. Sudip Vhaduri as a Graduate
Research Assistant.