Multi-item Scales and Tests: Development and Validation Methods
60
Multi-item Scales and Tests: Development and Validation Methods Elizabeth A. Hahn Associate Professor Department of Medical Social Sciences Feinberg School of Medicine, Northwestern University [email protected] Biostatistics in Medical Research Biostatistics Collaboration Center (BCC) & Outcomes Measurement and Survey Core (OMSC) November 8, 2011
Transcript of Multi-item Scales and Tests: Development and Validation Methods

Multi-item Scales and Tests: Development and Validation Methods
Elizabeth A. HahnAssociate Professor
Department of Medical Social SciencesFeinberg School of Medicine, Northwestern University
Biostatistics in Medical ResearchBiostatistics Collaboration Center (BCC) & Outcomes Measurement and Survey Core (OMSC)
November 8, 2011

Learning Objectives
1. Describe General Measurement Concepts and Methods
2. Learn about Classical and Modern Test Theory
3. Define Reliability and Validity

Creating Multi-item Scales

“Objective” “Subjective”Exercise test versus physical functioning, r = 0.40
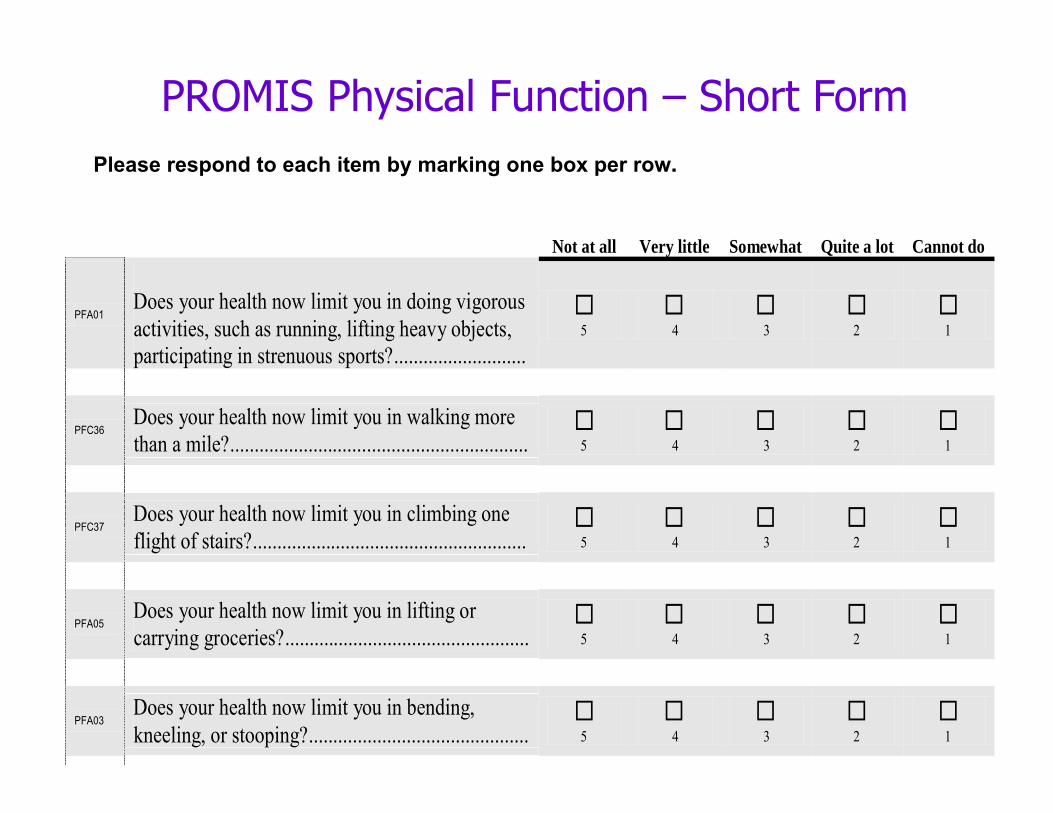
Not at all Very little Somewhat Quite a lot Cannot do
PFA01 Does your health now limit you in doing vigorous activities, such as running, lifting heavy objects, 5 4 3 2 1
participating in strenuous sports?...........................
PFC36 Does your health now limit you in walking more than a mile?............................................................. 5 4 3 2 1
PFC37 Does your health now limit you in climbing one flight of stairs?........................................................ 5 4 3 2 1
PFA05 Does your health now limit you in lifting or carrying groceries?.................................................. 5 4 3 2 1
PFA03 Does your health now limit you in bending, kneeling, or stooping?............................................. 5 4 3 2 1
PROMIS Physical Function – Short FormPlease respond to each item by marking one box per row.
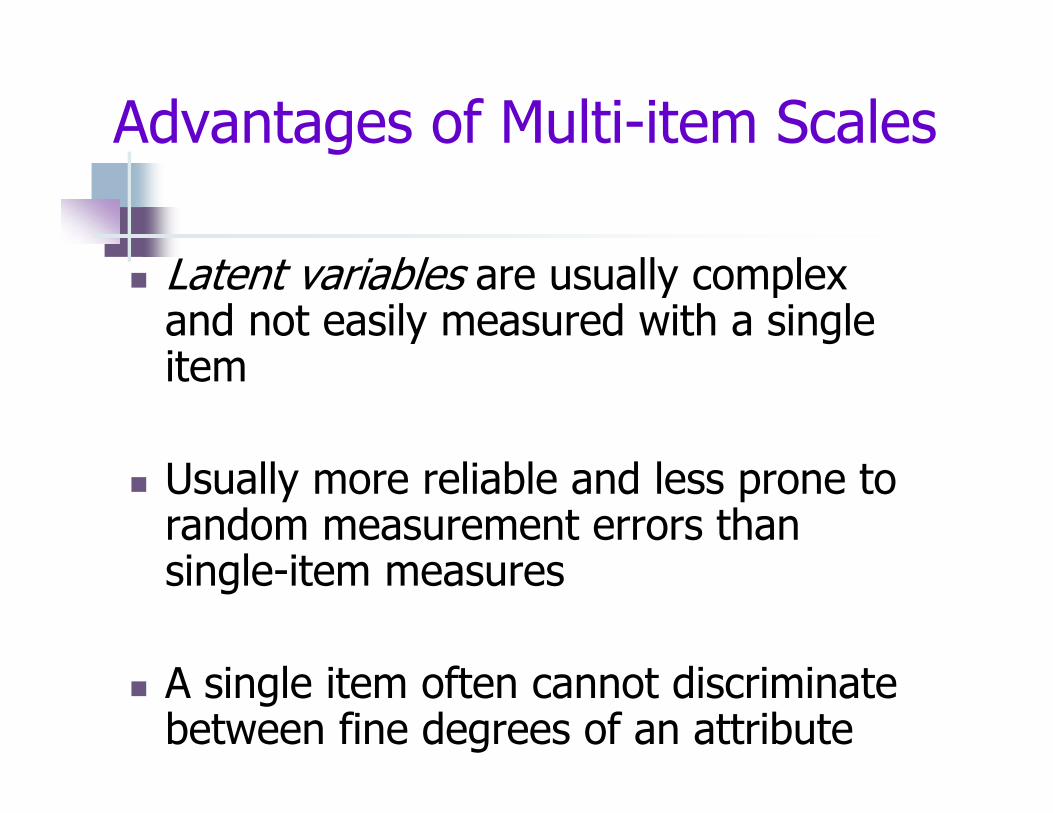
Advantages of Multi-item Scales
Latent variables are usually complex and not easily measured with a single item
Usually more reliable and less prone to random measurement errors than single-item measures
A single item often cannot discriminate between fine degrees of an attribute

Creating Multi-item Scales
Latent construct
vs.
Index

Latent Construct
Estimation of a unidimensional latent trait abstract concept cannot be measured directly examples: attitudes, satisfaction, patient-
reported outcomes (PRO)
However, it is possible to measure indicators of the latent trait use observed responses to questionnaire items
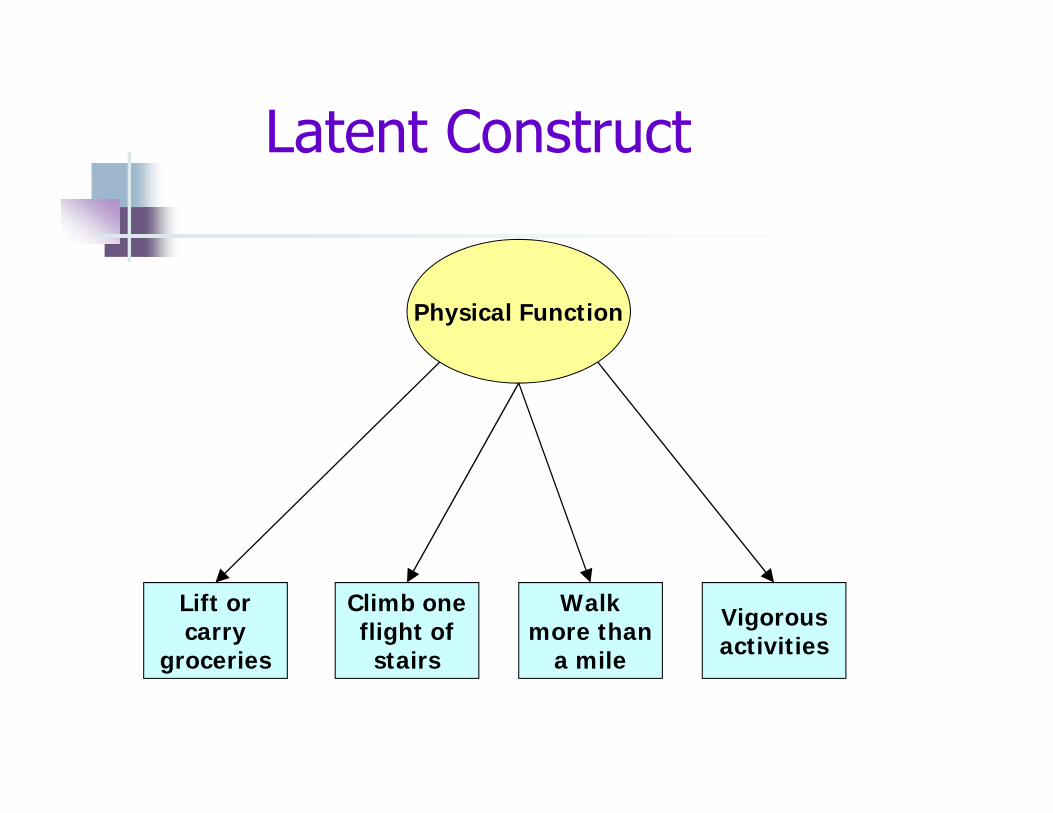
Physical Function
Lift or carry
groceries
Climb one flight of
stairs
Walk more than
a mile
Vigorous activities
Latent Construct
Summary of individual components symptoms comorbid conditions
Index

Comorbidity
Heart Attack Diabetes Stroke HypertensionAsthma
Index

8 attributes recommended by the Medical Outcomes Trust for health status and quality of life instruments (Scientific Adv Comm, Qual Life Res 2002)
1. a conceptual and measurement model2. reliability3. validity4. responsiveness5. interpretability6. low respondent and administrative burden7. alternative forms8. cultural and language adaptations

Literature review
Focus groups
Archival data analysis
Expert review/
consensus
Binning and winnowing
Literacy level analysisExpert item
revisionCognitive interviews
Translation review
Large‐scale testing
Validation studies
Calibration decisions
Intellectual property
Short forms,CAT
Statistical analysis
Domain Framework
The Life Story of a PROMIS ItemPatient-Reported Outcomes Measurement Information System
www.nihpromis.org

Classical and Modern Test Theory
Classical Test Theory assumptions: “parallel tests”: each item is a “test” that reflects
the underlying level of the trait item responses differ only due to random error a scale score is computed by simple summation
Modern Test Theory assumptions: each item reflects a different level of the trait respondents with a particular trait level have a
probability of responding positively to different items

Example:Measuring “Liking for Science” in
School Children
Less liking for science
More liking for science

Less Liking for Science
More Liking for Science
Item1
Item2
Item3
Item4
Item5
Item6
Item7
Item8
Item9
Itemn
A “Liking for Science” Variable

Writing Questions
3 Elements of a question
1. Context2. Stem3. Response
How much do you like each activity?
Going to the zoo.

Results of ordering by 9 judges
easy-to-like hard-to-like
1 2 3 4 5 6 7 8 9 10 11 median
learn names of weeds 2 2 5 11watch the grass change over seasons
1 1 2 1 4 7
watch bird make nest 2 2 2 2 1 4going to the zoo 4 1 2 1 1 2making a map 2 1 1 1 1 1 2 6

Administered 25 science activity items to children (n=75)
judges childrenlearn names of weeds hard hard
watch grass change somewhat hard somewhat hard
watch bird make nest somewhat easy somewhat easy
going to the zoo easy easy
making a map ? ?

InterpretationChild 1 Child 2 Child 3
a. learn names of weeds b. watch grass change c. watch bird make nest d. going to the zoo
c b a
Less Liking for Science (“easy”) More Liking for Science (“hard”)
Items
Children 123
d

Types of Respondent Data andMethods/Modes of Survey Administration
Self-report vs. proxy/observer DATA SOURCE
Self-administration paper-and-pencil MODE telephone computer
Interviewer-administration paper-and-pencil METHOD telephone computer

Considerations for Question Wording in Surveys of Culturally Diverse Populations

Instrument dimensions of equivalence across language and cultural groups
Content Content is relevant Semantic Meaning is the same Technical Method of assessment is
comparable Criterion Interpretation remains the
same Conceptual Instrument measures the
same theoretical constructFlaherty et al, 1988

Scoring Multi-item Scales

Scoring Multi-item Scales
Determine how a high scale score will be interpreted
Reverse scores and/or recalibrate scores (if warranted)
Address missing item responses Compute scale scores (may involve
transforming) Perform scoring checks

Positive and negative scoring examples
How much of the time during the past 4 weeks…
1. Have you been a very nervous person?1. All of the time 2. Most of the time 3. A good bit of the time4. Some of the time5. A little of the time6. None of the time
2. Have you felt calm and peaceful?1. All of the time 2. Most of the time 3. A good bit of the time4. Some of the time5. A little of the time6. None of the time

Scoring: Missing Data
1. Treat the scale score as missing- ignores other scale items with valid data- missing items may be related to outcome
2. Simple mean imputation- most common strategy; > 50% scale items completed- assumes missing item’s value = average of non-missing items
3. General imputation methods- may reduce non-response bias if done appropriately- can be mathematically and computationally difficult
4. Use Item Response Theory measurement models

The following items are about activities you might do during a typical day. Does your health now limit you in these activities? If so, how much?
(Circle One Number on Each Line)

ScoringSum
Prorate for missing items (sum of items) * (# of items in scale) / (# of
items answered) (13 * 10) / 9 = 14.44
Sum and Average Result is on the same scale as the original items Example (13 / 9 = 1.4):
1. Yes, Limited a Lot2. Yes, Limited a Little3. No, Not Limited at All
Transform Most common transformation is to a 0-100 scale
} Average = 1.4

Reliability and Validity

Distinction betweenReliability and Validity
a measure may be reliable (always yields the same score for the same respondent), but it may be consistently measuring the wrong thing (not measuring what it is supposed to measure)
reliability is necessary, but not sufficient for valid measurement

Reliability
the extent to which a measure yields the same number or score each time it is administered, all other things being equal (i.e., true change has not occurred)
Reliability
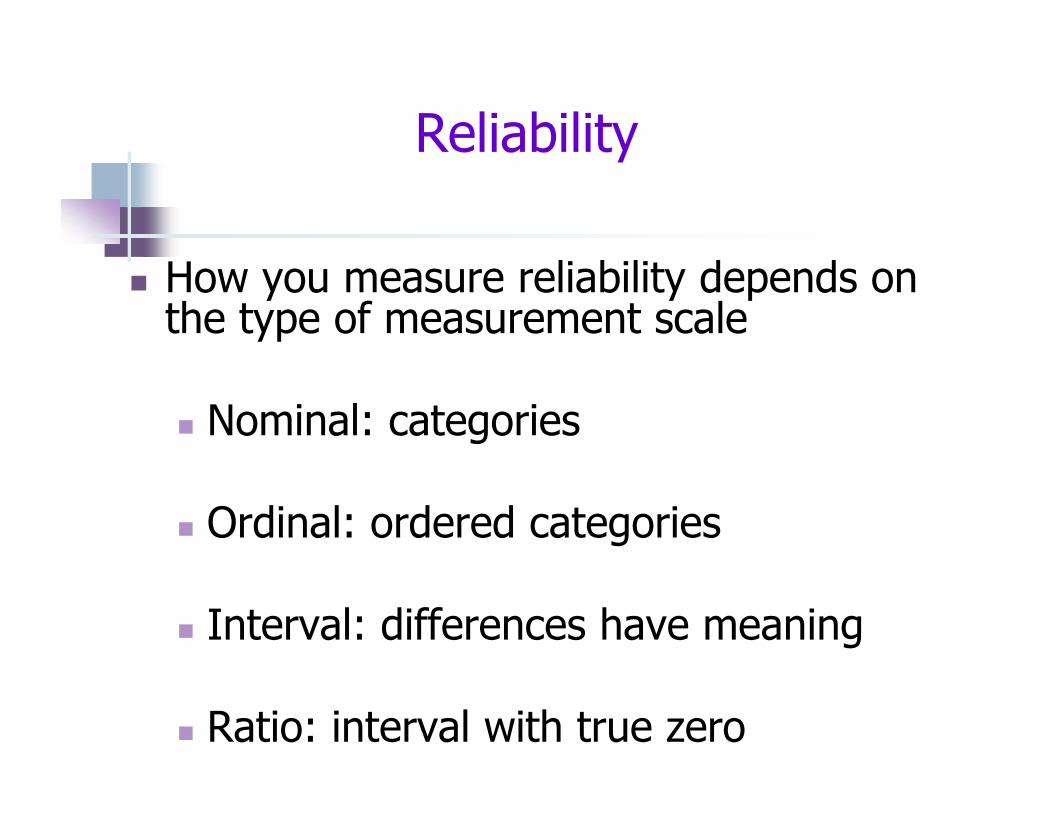
How you measure reliability depends on the type of measurement scale
Nominal: categories
Ordinal: ordered categories
Interval: differences have meaning
Ratio: interval with true zero

Reliability
a reliable measure is free from random error
two different reliability characteristics of a measure:
repeatability/reproducibility
internal consistency

Reliability: Repeatability/Reproducibility
over time (test-retest reliability) over observers (inter-rater or intra-rater
reliability) over different variants of an instrument
(equivalent forms reliability)
example: measurement of blood pressurereliability of measures over a 24-hour period or by different health care providers
or using different cuffs

Reliability for Nominal and Ordinal Scales
relevant statistic for estimating repeatability/ reproducibility reliability is Kappa or Weighted Kappa
Kappa (κ) quantifies the amount of agreement between measurements that is greater than the amount expected by chance alone
if κ=0, chance agreementif κ<0, less than chance agreement (rare)if κ =1, perfect agreement

Reliability for Interval and Ratio Scales
relevant statistic for estimating repeatability/ reproducibility reliability is an IntraclassCorrelation Coefficient (rICC)
numerous versions of ICCs if rICC near 0, almost all variation is due to
measurement error and the measure is unreliable
if rICC near 1, minimal measurement error and the measure is very reliable

Reliability: Internal Consistency
the extent to which a set of questions measures a single underlying dimension
e.g., fatigue, depression, physical function

Reliability: Internal Consistency
as the number of items is increased, the reliability will increase
diminishing returns with increasing items
reliability can be increased by deleting an item with poor item-total correlations

Reliability: Internal Consistency
For multi-item scales comprised of items with interval response choices, reliability is most commonly assessed using Cronbach’scoefficient alpha (ra) values ≥0.90 are considered the standard for
individual-level applications
values ≥0.70 are considered the standard for group-level applications

Data type Relevant statistic
High/excellent reliability (minimal/no error)
Moderate/good reliability (acceptable error)
Low reliability (high error)
Nominal (dichotomous)
Kuder-Richardson 20 (KR-20)
≥ 0.90 0.70 – 0.89 < 0.70
Nominal Kappa (κ) > 0.74 0.40 – 0.74 < 0.40
Ordinal Weighted Kappa
> 0.74 0.40 – 0.74 < 0.40
Interval/Ratio Intraclass Correlation Coefficient (rICC)
≥ 0.90 0.70 – 0.89 < 0.70
Internal Consistency Reliability (rα)
≥ 0.90 0.70 – 0.89 < 0.70
Guidelines for instrument reliability/precision
Validity
degree to which the measure reflects what it is supposed to measure (rather than something else)

Types of Validity
content validity
construct validity (including criterion validity)
responsiveness
Content Validity
the extent to which a measure samples a representative range of the content
need a clear idea of what is to be measured
fairly subjective (compare to existing standards, well-accepted theoretical definitions, expert opinions, interviews with the target population)

Construct Validity
hypothesize how the measure should “behave”- the direction of relationships- the strength of relationships
an iterative process Empirical results
Revisions
Testing

Construct Validity
convergent validity- extent to which different ways of measuring the same trait are interrelated
discriminant (divergent) validity- measures of different traits should be relatively unrelated
criterion validity- use of a “gold standard” measure

FACT-B Convergent Validity(ECOG Performance Status Rating)
57.1
54.5
50.3
4045
5055
60M
ean
TO
I Ras
ch M
easu
re
No symptoms (n=100)Some symptoms (n=67)Some bedrest (n=16)
p<0.001

FACT-C Convergent and Divergent Validity
(Pearson correlations)
FACT-C and FLIC: r=0.74
FACT-C and Social Desirability Scale: r=0.02
Ward et al, Qual Life Res 8: 181-195, 1999

Responsiveness Validity
measure should be able to detect small, but meaningful, changes over time

FACT-B Trial Outcome Index (TOI)Sensitivity to Change in Patient-rated PSR
-10
-8
-6
-4
-2
0
2
4
6
8
PSR worsen=8 (d=.65)
PSR samen=29 (d=.10)
PSR bettern=10 (d=.55)
Mea
n FA
CT-
B T
OI C
hang
e

Cella et al. Annals of Oncology 2004
Construct and Responsiveness ValidityConceptual equivalence: association between
hemoglobin response and improvement in fatigue

Reliability and Validityare not static characteristics
demonstrating reliability is essentially accumulating evidence about the stability of the measure
demonstrating validity involves accumulating evidence of many different types which indicate the degree to which the measure denotes what it was intended to represent

Low Literacy
High Literacy
Health Literacy Bank
Item1
Item2
Item3
Item4
Item5
Item6
Item7
Item8
Item9
Itemn
comprised of a large collection of items measuring a single concept enables test instruments of various lengths and even computerized adaptive
tests (CATs)
Item Response Theory (IRT) Item Banks
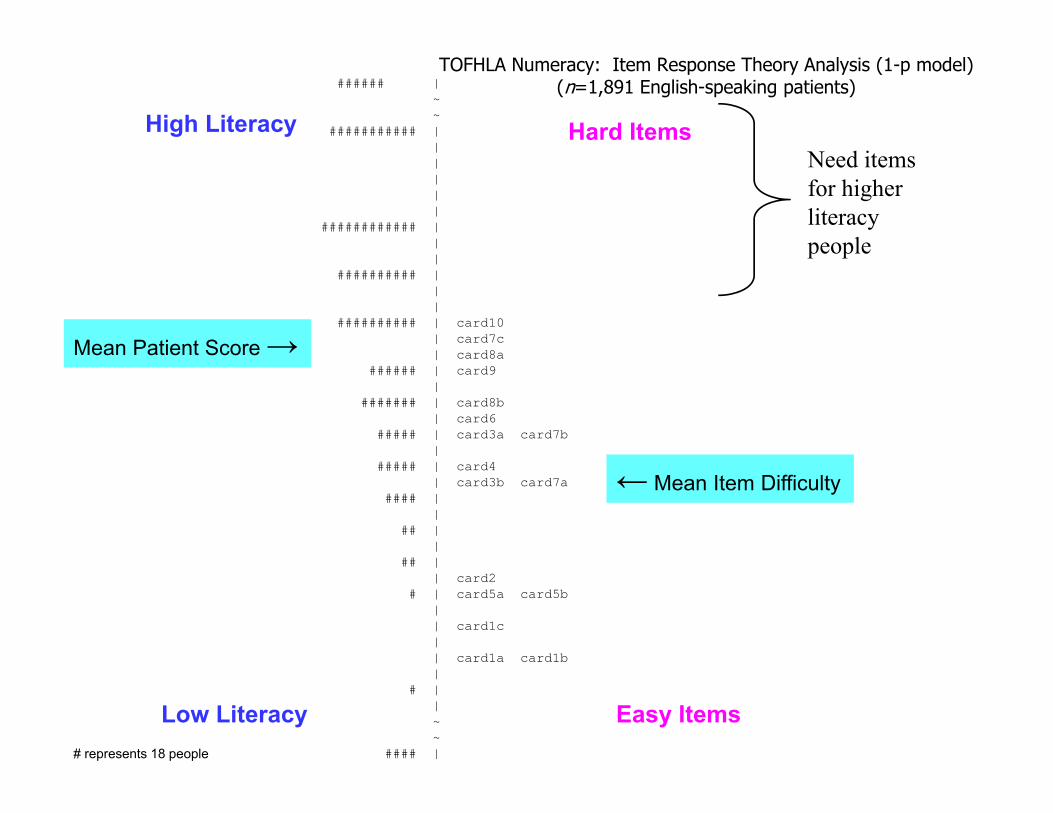
###### |~ ~
########### ||||||
############ |||
########## |||
########## | card10| card7c| card8a
###### | card9|
####### | card8b| card6
##### | card3a card7b|
##### | card4| card3b card7a
#### ||
## ||
## || card2
# | card5a card5b|| card1c|| card1a card1b|
# ||~~
#### |# represents 18 people
Need items for higher literacy people
TOFHLA Numeracy: Item Response Theory Analysis (1-p model)(n=1,891 English-speaking patients)
High Literacy Hard Items
Low Literacy Easy Items
← Mean Item Difficulty
Mean Patient Score →

###~###~ ### ↑| EIZ3Q5
# | ECA4Q1### |### |
#### |# |
########### |# |
#### | EMH4P1#### | EAS5Q1 EIN1Q4
####### | EDB2D3##### | EAS2D2 EIC1Q3
############ | ECA1P2 ECA3Q1 EIN1Q2 EIZ3P2######### | ECA5Q1
########## | EIZ3Q4####### | EIZ2P1 EMD2Q3####### | ECA3Q2 EIN1Q8
########## | EHT3D3 EIZ3Q1 EMD2Q2########## | ECA5D1 EOB2P2 EOB3D2
####### | EIZ1P1 EMH1Q1 EOB3D1####### | EDB3Q1
#### | EMH3P1 EOB1P2######## | EAS5D2 ECA4Q2 EDB2D2####### | ECA1P1 ECA2P1 EDB5Q1 EIC1P10 EIN2P4 EIZ3D4
EIZ3Q2 EMH2D3####### | EDB4P4 EHT1P2 EHT3D4 EIZ3D1 EMD2D2
##### | EAS2D1 EAS4P1 EDB2D1 EDB3P5 EDB5Q3 EHT1P6EHT3Q1 EIN1D3 EIN1D7 EMH2P1 EOB3Q1
### | EDB5P2 EOB5P5##### | EIC1P3 EIN1D1 EOB1P4
### | EIN1Q10 EIN1Q5 EIZ3D3 EMD4D1 EMH5P1 EOB2P10### | EHT1P3 EIC1P7
#### | ECA4P1 EDB3D1 EDB3P1 EDB3P4 EIC1D2 EIN1D4EOB5P2
### | EDB5Q2 EIC1P8 EMD2D3 EOB2P4## | EAS5D1 EIC1P9 EIN2D3## | EIC3P8
| EDB3D2| EHT2P1 EIN1Q9~ EIC1P6↓ EAS1P1
High Literacy
Low Literacy
Hard Items
Easy Items# represents 3 patients
Mean Patient Score →
← Mean Item Difficulty
Item Response Theory Analysis Results (1-p model)(n=616 English-speaking primary care patients)

The Advantage of IRT-based PRO Measures Over Traditional PRO
Measures
Traditional PRO Questionnaires
IRT-Based Measures
Fixed # of items presented serially or in branched designs (skip patterns)
Variable # of items, tailored for each personusing ComputerizedAdaptive Testing (CAT)technology
Floor and/or ceiling effects Reduced floor and ceiling effects

Traditional PRO Questionnaires
IRT-Based Measures
Reliability higher as number of items increases
Reliability can be equal to or higher than in other instruments
Larger number of items increases respondent burden
Fewer, targeted items (with CAT) reduces respondent burden
The Advantage of IRT-based PRO Measures Over Traditional PRO
Measures

Traditional PRO Questionnaires
IRT-Based Measures
Very few instruments can cross-walk scores to other instruments for combining or comparing scores
Can create multiple instruments from psychometrically-linked item banks
Can maintain cross-walks with several leading PRO scales
The Advantage of IRT-based PRO Measures Over Traditional PRO
Measures
Reference MaterialCzaja R, Blair J. Designing Surveys: A Guide to Decisions and Procedures, Second Edition. Thousand Oaks, CA: Pine Forge Press, 2005.
Fayers PM, Machin D. Quality of Life: The assessment, analysis and interpretation of patient-reported outcomes, Second Edition. West Sussex, England: John Wiley & Sons Ltd., 2007.
Nunnally JC, Bernstein IH. Psychometric Theory, Third Edition. New York: McGraw-Hill, Inc., 1994.
Scientific Advisory Committee of the Medical Outcomes Trust. Assessing health status and quality-of-life instruments: Attributes and review criteria. Qual Life Res 2002; 11: 193–205.
www.nihpromis.org
www.rasch.org

Thank You!
What questions do you have?