
Multi-homing and Platform Strategies: Historical Evidence ... Files/18-032_4eb19781-7eb0-4da8... ·...
42
Multi-homing and Platform Strategies: Historical Evidence from the U.S. Newspaper Industry K. Francis Park Robert Seamans Feng Zhu Working Paper 18-032
Transcript of Multi-homing and Platform Strategies: Historical Evidence ... Files/18-032_4eb19781-7eb0-4da8... ·...

Multi-homing and Platform Strategies: Historical Evidence from the U.S. Newspaper Industry
K. Francis Park Robert Seamans Feng Zhu
Working Paper 18-032

Working Paper 18-032
Copyright © 2017 by K. Francis Park, Robert Seamans, and Feng Zhu
Working papers are in draft form. This working paper is distributed for purposes of comment and discussion only. It may not be reproduced without permission of the copyright holder. Copies of working papers are available from the author.
Multi-homing and Platform Strategies: Historical Evidence from the U.S. Newspaper Industry
K. Francis Park NYU Stern School of Business
Robert Seamans NYU Stern School of Business
Feng Zhu Harvard Business School
Multi-homing and Platform Strategies:
Historical Evidence from the U.S. Newspaper Industry
K. Francis Park NYU Stern School of Business New York, New York 10012
Robert Seamans NYU Stern School of Business New York, New York 10012
Feng Zhu Harvard Business School
Boston, MA 02163 [email protected]
September 2017
We study how local U.S. newspapers respond to entry by TV broadcast stations in 1945–1963. We find that newspaper firms’ responses depend on their customers’ tendencies to multi-home (adopt both newspaper and TV) or single-home (adopt only newspaper or only TV). We also find that their prior experience responding to entry by radio stations improve their capability to respond to entry by TV stations. Our research builds on and extends literatures on platforms and learning-by-doing, and offers practical implications for managers in two-sided market settings.
Keywords: two-sided markets, multi-homing, learning by doing, platform strategies,
history, newspapers
2
INTRODUCTION
Firms across many industries today can be characterized as “two-sided,” including search engines
such as Google and Bing; online dating sites such as like eHarmony and Match.com; online deal
marketplaces such as Groupon and LivingSocial; cable TV networks such as Time Warner and
Comcast; credit card networks such as Visa and MasterCard; sharing-economy firms such as Uber,
Airbnb, and Kickstarter; and video game consoles such as PlayStation and Xbox, among other
examples. In these cases, firms serve as platforms connecting customers on different sides of the
market (e.g., Uber connects drivers on one side to riders on the other side).
One of the big challenges faced by incumbent platforms is how to handle competition from
new entrants. When a new platform arrives in the market, customers on either side of the two-
sided market can choose whether to switch to the new platform (“single-homing”), or adopt both
platforms (“multi-homing”) (e.g., Ambrus, Calvano, and Reisinger, 2016; Armstrong and Wright,
2007; Bresnahan, Orsini, and Yin, 2015; Corts and Lederman, 2009; Landsman and Stremersch,
2011; Piezunka, Katila, and Eisenhardt, 2015). For example, when LivingSocial enters a market
that was previously served by Groupon, users and merchants on Groupon could choose to switch
to LivingSocial or use both platforms.
Understanding market participants’ multi-homing tendencies on each side of the market
has important strategic implications. Theoretical work (e.g., Gabszewicz and Wauthy, 2004) has
shown that when agents on one side of the market choose to multi-home, agents on the other side
of the market will prefer to single-home as they can reach the same group on the other side through
one platform. At the same time, when agents on one side of the market are multi-homing, the
competitive intensities between the platforms on that side of the market will be low. When agents
are single-homing, however, platforms will need to compete aggressively to attract them. For

3
example, if all consumers choose to visit both Groupon and LivingSocial (i.e., multi-homing),
merchants need to work with only one platform to reach all potential consumers. Groupon and
LivingSocial do not have to compete for consumers but need to compete more aggressively to
attract merchants than consumers. Their strategies would be different if instead merchants were
more likely to multi-home than consumers. Adding to this complexity is that platform strategies
on both sides of the markets are linked via indirect network effects (Parker and Van Alstyne, 2005;
Rochet and Tirole, 2003). As a result, strategic changes on one side of market in response to entry
will require adjustment of strategies on the other side of the market. Given the complexity of the
strategic responses, we expect organizational learning from prior experience in responding to
similar entrants (e.g., Eggers, 2014, 2016; King and Tucci, 2002; Klepper and Simons, 2000) to
be particularly helpful to platform owners when they face new entrants.
To better understand how platform firms’ strategies depend on their consumers’ tendencies
to multi-home and the role of prior experience on their ability to respond, we construct a historical
dataset of U.S. newspapers for 1945–1963 and study how newspapers respond to entry by TV
stations in their markets. Newspapers are platforms that link together readers and advertisers on
different sides of their market (e.g., Anderson and Gabszewicz, 2006). We also consider how the
newspapers’ prior experience with entry by radio in earlier decades influences their responses to
TV entry. To do so, we take advantage of several institutional features of the newspaper industry
during this time period. First, during this time period newspaper markets are essentially
geographically segmented with one or two newspapers per market (Gentzkow, 2006; Gentzkow,
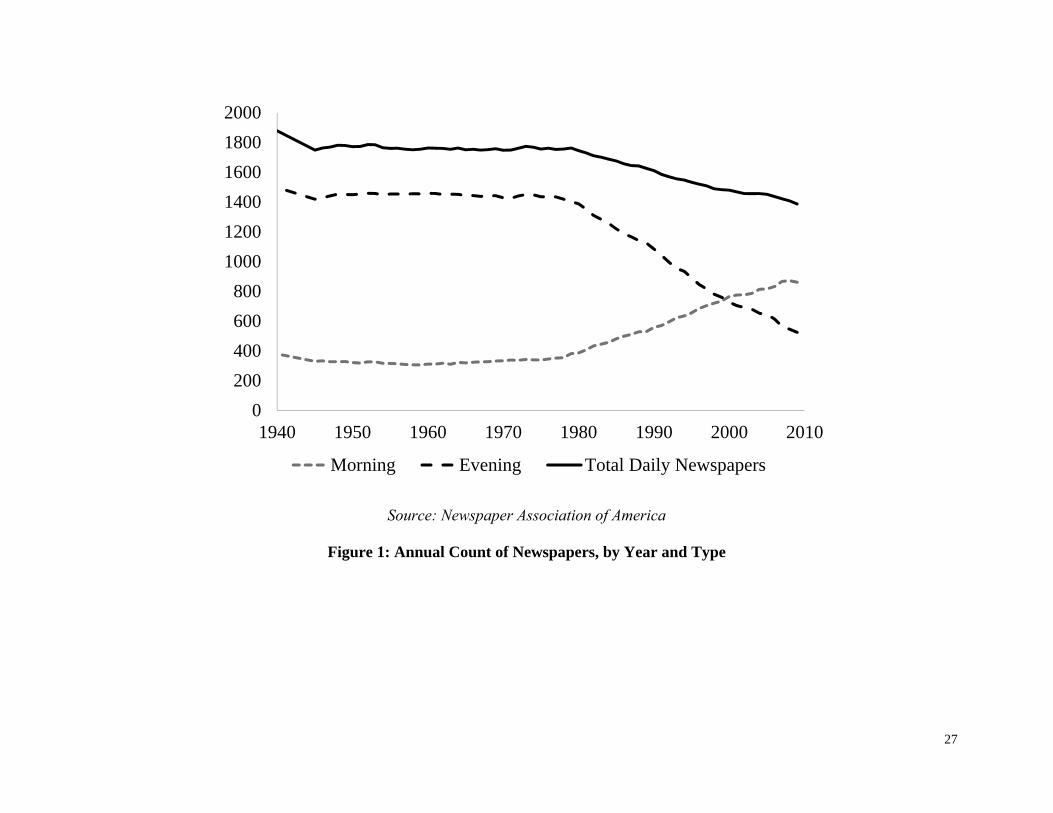
Shapiro, and Sinkinson, 2011). Moreover, newspapers were known as either “morning”
newspapers or “evening” newspapers, and were published and circulated to their subscribers
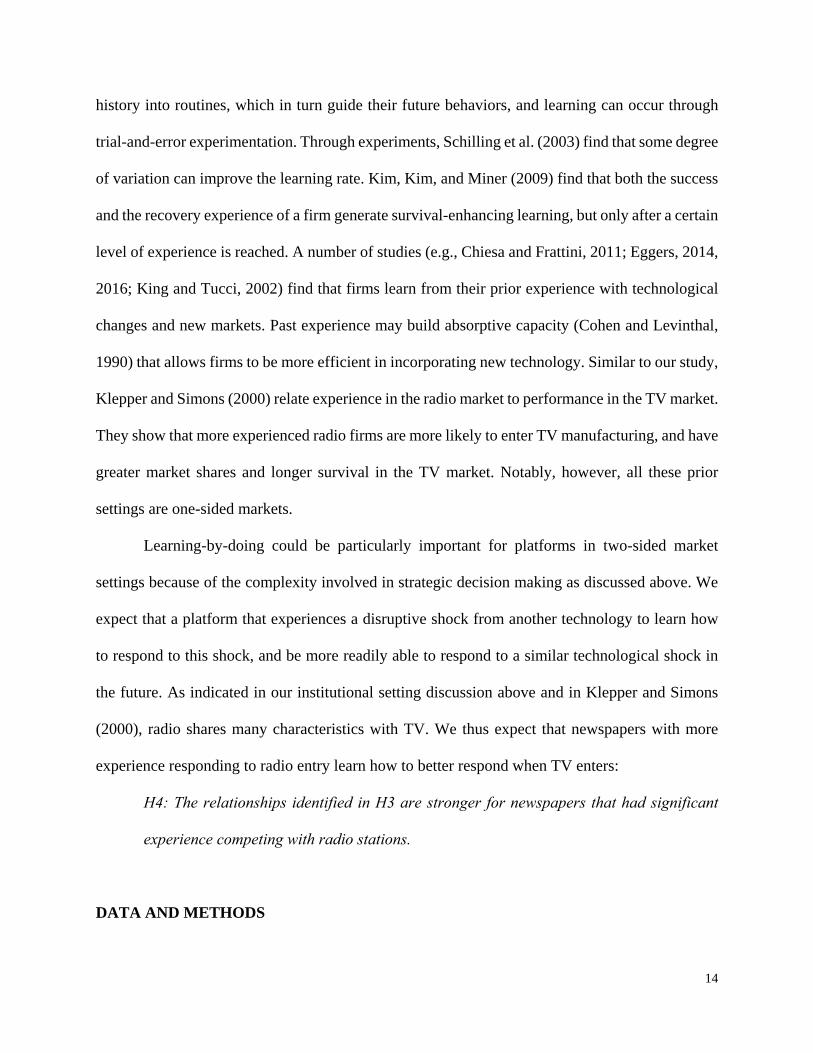
accordingly. Approximately 80 percent of newspapers in 1940 were evening newspapers and this
4
remained unchanged until about 1980 (see Figure 1). This feature is useful for our study because
the entry of TV primarily affected evening and not morning newspapers. Morning newspaper
subscribers are more likely to read the newspaper in the morning and watch TV at night (i.e., multi-
home), while evening newspaper subscribers are more likely to treat the evening newspaper and
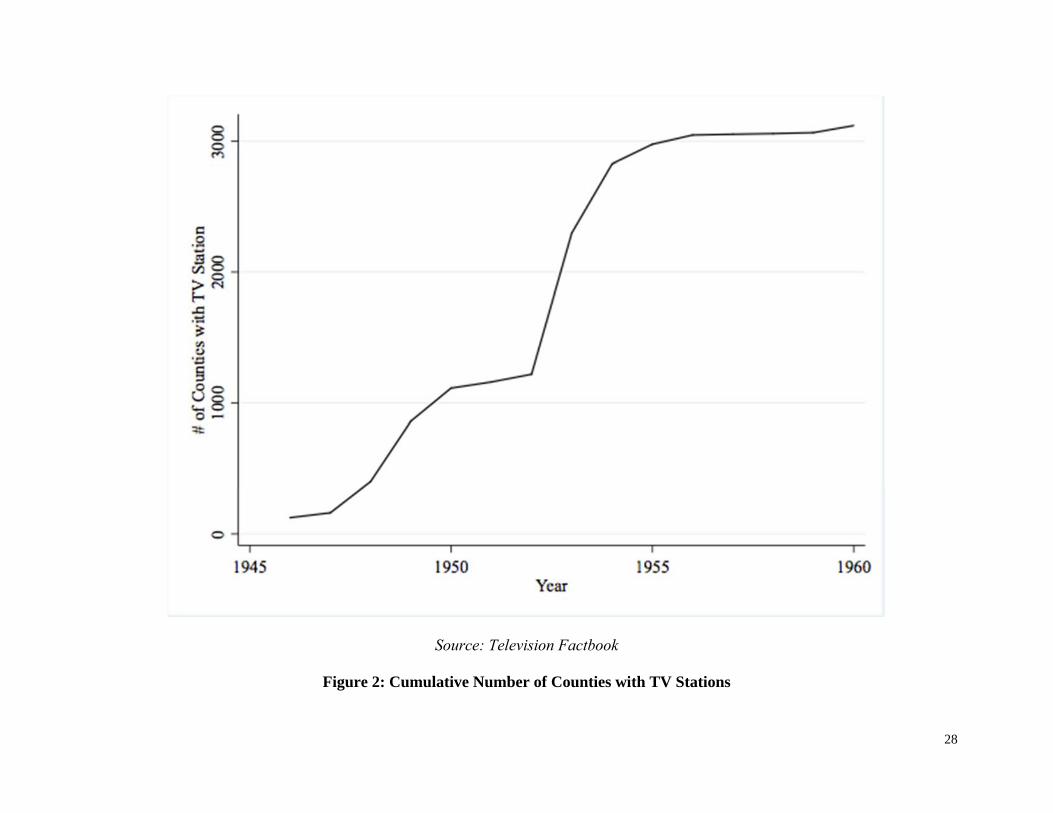
TV as substitutes, and potentially switch to TV for news (i.e., single-home). Second, TV entry was
staggered across geography and time (see Figure 2), owing in part to a decision by the Federal
Communications Commission (FCC) to freeze new radio licenses during the Korean War, as we
explain below (George, 2009; Baker and George, 2010). This feature provides a quasi-natural
experiment that we exploit in our empirical approach. Third, radio stations had entered media
markets in the early 1900s, and many features of the radio industry are shared by the TV industry.
Thus, this feature allows us to study how platforms operating in two-sided markets learn from
technological shocks over time.
***Figure 1 about here***
We develop a stylized model to analyze newspaper firms’ strategic responses to TV entry
with multi-homing and single-homing consumers (i.e., for morning and evening newspapers,
respectively), and derive several empirically testable hypotheses, which compare the responses to
TV entry between newspapers with multi-homing and single-homing subscribers. Our theory
predicts that when a TV station enters the market, newspapers with multi-homing customers
(morning newspapers) will have higher subscription prices, higher circulation, and similar ad rates
per subscriber, relative to newspapers with single-homing customers (evening newspapers). We
next draw from a rich literature on learning-by-doing to argue that a newspaper firm’s ability to
respond to entry by a TV station depends on the amount of its prior experience with technologies
5
with similar characteristics such as radio stations. We then take our hypotheses to data, and find
broad empirical support for our hypotheses.
Our study makes several contributions. First, it adds to the growing literature on platform
strategies (e.g., Eisenmann, Parker, and Van Alstyne, 2011; Iansiti and Levien, 2004; Kapoor and
Agarwal, 2017; Piezunka et al., 2015; Yoffie and Cusumano, 2015). Unlike prior studies where
customers’ multi-homing tendencies are assumed to be the same across all platforms in a market
(e.g., Armstrong 2006; Casadesus-Masanell and Zhu, 2010; Choi, 2010; Landsman and
Stremersch, 2011; Zhu and Iansiti, 2012), we provide an empirically rigorous account of how a
platform responds to entry by another platform in a setting with varying degrees of multi-homing
tendencies. We show that optimal platform strategies could change substantially when taking
multi-homing into account. These findings provide empirical support of our own theory and
hypotheses, and add to a growing literature on two-sided markets. Second, by studying how a
platform firm’s history matters for its future strategic decisions, we link the literature on learning-
by-doing to the literature on two-sided markets. We therefore contribute to a broader research
program that aims to build a fuller understanding of how insights from “one-sided” markets can
be incorporated into the growing “two-sided” market literature (e.g., Park, 2017; Seamans and Zhu,
2017; Wright, 2004). Third, by studying how newspapers respond to entry of TV, we gain some
insight into how incumbent platforms in two-sided markets respond to entrants using new
technology. We find evidence that, unlike the prediction in the theoretical literature in which
advertisers will single-home when consumers multi-home (e.g., Gabszewicz and Wauthy, 2004),
when the incumbent and the entrant use different technologies, advertisers value their potential
consumers’ repeated exposures to their brands through multiple channels and still prefer to multi-
home. We believe our results can shed light on newspaper responses to digitization in the late 20th

6
and early 21st century, and more broadly can shed light on generic responses by platforms to
disruptive technology. Finally, the historical nature of the setting serves as a reminder to readers
that even though research on two-sided markets is nascent, two-sided markets are not a new
phenomenon. Rather, our analysis using historic data on newspaper firms during 1945–1963 shows
that some of these firms have a sophisticated understanding of two-sided markets and the role of
multi-homing, and they incorporate these into their strategies. Our understanding of generic firm
strategies thus could be significantly enhanced through examining historical data.
EMPIRICAL SETTING: LOCAL U.S. NEWSPAPER INDUSTRY 1945–1963
Historical newspapers
Newspapers in the United States have existed since the colonial period. By 1945, which is the start
of the time period of our study, newspapers were established media entities within their local
markets of operation. With a few exceptions (such as the New York Times and Christian Science
Monitor), each individual newspaper covered a limited geographical region. Within their local
markets, newspapers were an important source for news, even after the introduction of radio and
television. For example, in 1944 the newspaper was still considered the most accurate source of
information on presidential campaigns (Gentzkow, Shapiro, and Sinkinson, 2011).
Newspapers, like TV, can be thought of as a platform connecting two sides of a market.
Both newspapers and TV provide content to consumers, which can be thought of as either readers
or viewers, depending on the medium. Similarly, both newspapers and TV provide eyeballs (those
of the readers/viewers) to advertisers. While the newspaper business was homogenous in the sense
that they derived most of their revenue from advertising, there were important differences among
newspapers. Most relevant for our study, newspapers differed depending on their timing of
7
publication or circulation. Some newspapers were distributed in the morning, which covered news
of events that occurred in the prior day, while other newspapers were distributed in the evening,
which covered news of events that occurred on that day. Throughout the 1940s-1960s, there were
significantly more evening newspapers than morning newspapers (see Figure 1). This difference
in the timing of publication may lead to different responses to the entry of new media formats such
as television broadcasting.
TV stations
The first prototypes of television receivers were made in the early 1920s, and television
broadcasting began in the late 1930s by a limited number of stations in major cities. In 1931, 18
experimental broadcasting stations were operating in the United States. The FCC began licensing
commercial broadcasting on July 1, 1941. The growth of television and regular commercial
broadcasting, however, did not begin until after World War II. In 1945, New York, Philadelphia,
Chicago, and Schenectady were the only four cities in the U.S. that had commercial TV
broadcasting stations. FCC licensing of commercial broadcasting expanded after the war, licensing
71 stations in 42 cities by 1948. However, the diffusion of TV broadcasting stations did not
continue smoothly, and it came to an unanticipated halt in September 1948 when the FCC instituted
a freeze on station licensing in order to conduct a study on signal interference, color standards, and
spectrum allocation. Initially, the freeze was intended to last for a few months, but the outbreak of
the Korean War and controversy over channel allocation left the freeze in place until 1952. While
stations that were licensed by 1948 were allowed to continue construction and begin broadcasting,
no new stations began operation between 1950 and 1952. In ending the freeze in 1953, the FCC
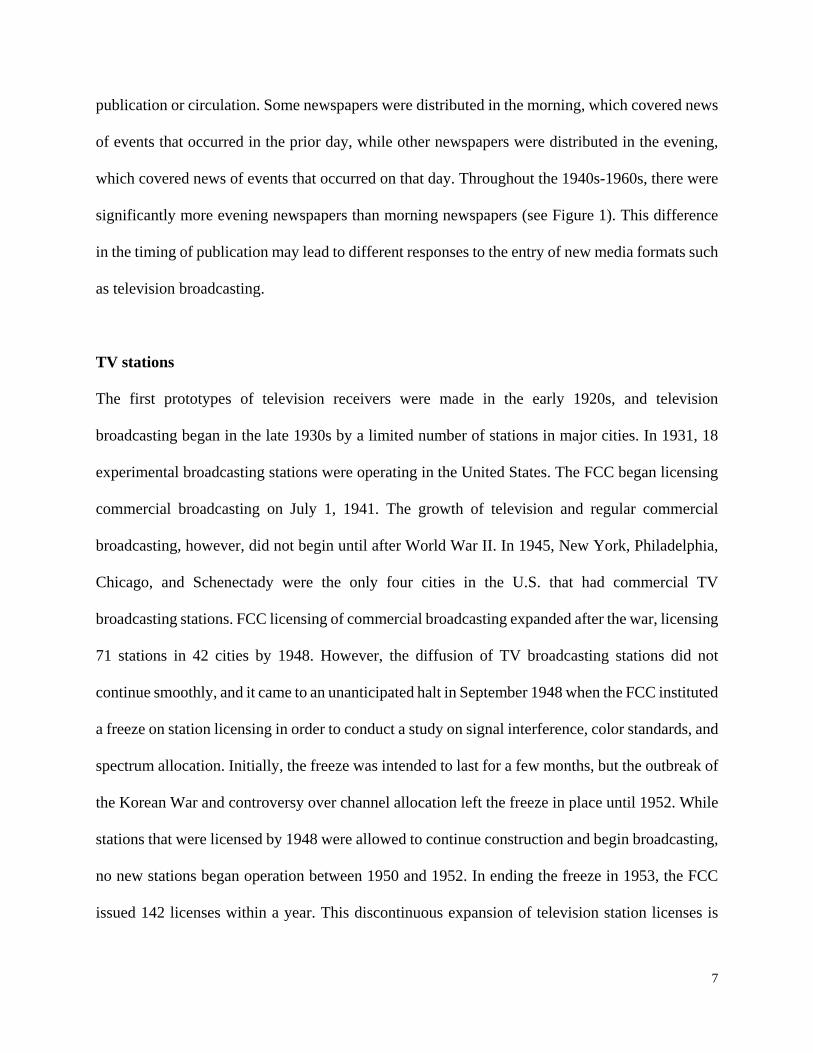
issued 142 licenses within a year. This discontinuous expansion of television station licenses is
8
illustrated in Figure 2, which graphs the cumulative number of counties with a television
broadcasting station. By 1960, television broadcasting was prevalent and reached about 96 percent
of the U.S. population (Baker and George, 2010).
***Figure 2 about here***
A number of studies have leveraged this exogenous variation in TV penetration to study
the impact of TV entry. George (2009) uses this variation to assess the impact of information
technology innovation on local product markets between 1945 and 1960. George finds that an
increase in TV penetration is associated with fewer local breweries, lower local beer production,
and higher concentration in the beer industry. Baker and George (2010) use the same variation,
and show that the increased exposure to advertisements after the TV entry increases a household’s
tendency to borrow for household goods and its tendency to carry debt. Similarly, Gentzkow
(2006) uses this variation to examine the impact of TV introduction on voter turnout between 1948
and 1970. He finds that the introduction of TV accounts for about a 25 to 50 percent decline in
voter turnout since the 1950s because the introduction of TV reduces the level of political
information even though it increases the total set of information sources. Gentzkow also shows
that the introduction of TV causes substitution away from traditional news sources such as
newspapers, and people become less likely to rely on newspapers for information about election
campaigns.
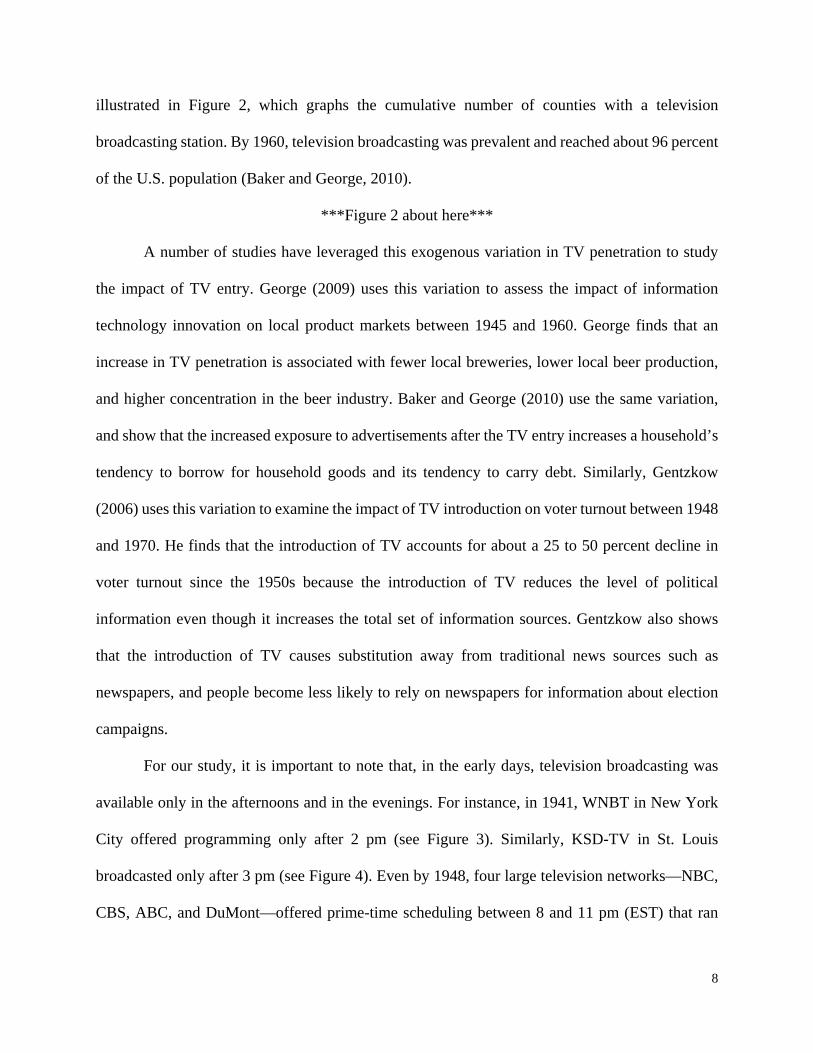
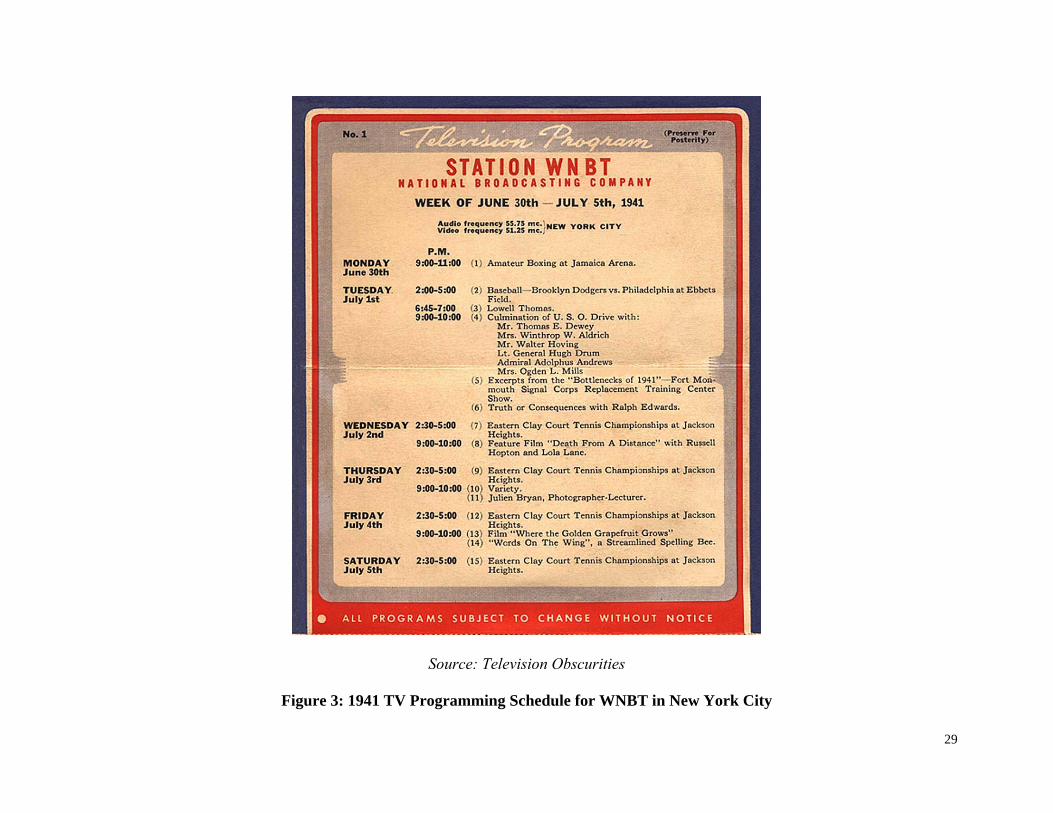
For our study, it is important to note that, in the early days, television broadcasting was
available only in the afternoons and in the evenings. For instance, in 1941, WNBT in New York
City offered programming only after 2 pm (see Figure 3). Similarly, KSD-TV in St. Louis
broadcasted only after 3 pm (see Figure 4). Even by 1948, four large television networks—NBC,
CBS, ABC, and DuMont—offered prime-time scheduling between 8 and 11 pm (EST) that ran
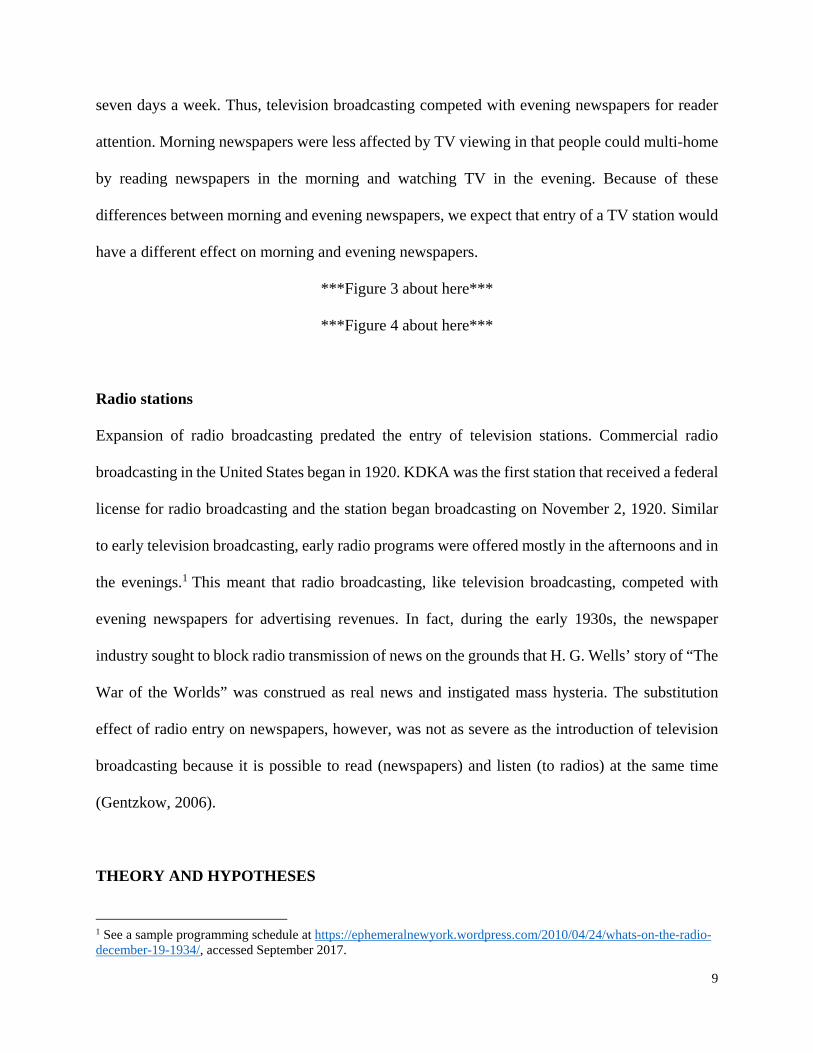
9
seven days a week. Thus, television broadcasting competed with evening newspapers for reader
attention. Morning newspapers were less affected by TV viewing in that people could multi-home
by reading newspapers in the morning and watching TV in the evening. Because of these
differences between morning and evening newspapers, we expect that entry of a TV station would
have a different effect on morning and evening newspapers.
***Figure 3 about here***
***Figure 4 about here***
Radio stations
Expansion of radio broadcasting predated the entry of television stations. Commercial radio
broadcasting in the United States began in 1920. KDKA was the first station that received a federal
license for radio broadcasting and the station began broadcasting on November 2, 1920. Similar
to early television broadcasting, early radio programs were offered mostly in the afternoons and in
the evenings.1 This meant that radio broadcasting, like television broadcasting, competed with
evening newspapers for advertising revenues. In fact, during the early 1930s, the newspaper
industry sought to block radio transmission of news on the grounds that H. G. Wells’ story of “The
War of the Worlds” was construed as real news and instigated mass hysteria. The substitution
effect of radio entry on newspapers, however, was not as severe as the introduction of television
broadcasting because it is possible to read (newspapers) and listen (to radios) at the same time
(Gentzkow, 2006).
THEORY AND HYPOTHESES
1 See a sample programming schedule at https://ephemeralnewyork.wordpress.com/2010/04/24/whats-on-the-radio-december-19-1934/, accessed September 2017.

10
In this section, we develop our hypotheses on (a) how the effect of TV entry on newspaper ad rates,
subscription prices, and circulation depends on a newspaper being morning or evening, the former
indicating higher likelihood of consumer multi-homing, and (b) how a newspaper’s prior history
with radio affects its ability to respond.
We first present a stylized model to highlight the intuition behind firm strategies under
single- and multi-homing. To more tightly link the theoretical findings to our empirical setting and
for ease of exposition, we have chosen features of the model such that they are consistent with the
underlying structure of a newspaper’s business model.
Consider a newspaper that charges a lump-sum price of α to each advertiser and p to each
subscriber. For simplicity and without loss of generality, we assume the marginal cost the
newspaper incurs on each side of the market to be zero. On the subscriber side, we assume that the
market size is S and the demand for the newspaper is Ds = S – p. Hence, the newspaper’s
subscription profit will be Dsp. Similar to Armstrong (2006), our functional form implicitly
assumes that demand for the newspaper on the subscriber side is independent of the number of ads
carried by the newspaper. This assumption is consistent with empirical findings on the newspaper
industry as reported in Argentesi and Filistrucchi (2007). On the advertiser side, let β, a small
positive number, be the return of each advertiser from reaching one newspaper subscriber. The
demand for advertising space is Da = βDs – α. We similarly obtain the newspaper’s profit on the
advertiser side as Daα. Hence, the total profit of the newspaper can be described as: π = Dsp + Daα.
Solving for the newspaper’s optimal pricings, we have:
and . (1)
The equations are intuitive. As the potential market size, S, increases, the newspaper is
more likely to attract a large subscription base and thus becomes more attractive to advertisers.

11
Hence, it can charge more on both sides of the market. In addition, as the return from advertising
(β) increases and the ad side of the business becomes more attractive, the newspaper decreases
subscription price (p) in an effort to attract more subscribers and charge a higher rate (α) to the
advertisers.
The equilibrium demand on each side of the market is:
and . (2)
As expected, the demand on each side increases with both S and β. In equilibrium, the ad
rate per subscriber:
= ( / = , (3)
which is the effective price advertisers pay to reach one newspaper subscriber.
Role of Single- and Multi-homing
We now consider single- and multi-homing after a TV station enters the market. For instance,
readers may get news content from newspaper and from TV without having to choose one over
the other. Similarly, advertisers may advertise both in newspapers and on TVs. As subscribers’
demand for newspaper is independent of the ads but advertisers’ decisions depend on subscribers’
choices, we first consider subscribers’ single- and multi-homing behavior and, depending on their
choices, consider whether advertisers choose to single- or multi-home.
If consumers are single-homing, some of them switch to TV for news and hence the
potential market size for newspaper, S, decreases. From equations (1) and (2), this implies that
price and circulation will decrease. The advertisers will prefer multi-homing, as they can reach
different consumers through the newspaper and the TV. The advertisers’ return from reaching one

12
newspaper subscriber, β, remain the same. From equations (1) to (3), we have the following
predictions:
H1: When a TV station enters a newspaper market, if newspaper subscribers are single-
homing, subscription price decreases, newspaper circulation decreases and ad rate per
subscriber does not change.
If consumers are multi-homing, the potential market size for newspaper, S, does not change.
In this case, the advertisers may have incentives to single-home, as they need to reach their
potential consumers through only one channel. On the other hand, TV and newspapers offer
different types of ads and hence there is synergy for an advertiser to reach the same consumer
through both channels. Chandra and Kaiser (2014) find, for example, that introduction of a new
platform (e.g., online media) can have complementarities with the existing platform. Chang and
Thorson (2004) find that television–web advertising synergy leads to higher attention, higher
perceived message credibility, and a greater number of total and positive thoughts than did
repetition within one channel. When both consumers and advertisers are multi-homing, the
newspaper and the TV station are effectively not competing. We thus have:
H2: When a TV station enters a newspaper market, if newspaper subscribers are multi-
homing, newspaper businesses are not affected much.
Comparing the single-homing and multi-homing scenarios, we have the following
hypothesis:
H3: Relative to the situation with single-homing newspaper subscribers, with multi-homing
newspaper subscribers, when a TV station enters a newspaper market, newspaper
subscription price increases, circulation increases, and ad rate per subscriber does not
change.

13
In our empirical analysis, we expect to observe these differences between morning
newspapers and evening newspapers.
Role of Prior History: Experience with Radio
Firms exist because they excel in sharing and transferring knowledge (Foss, 1996; Kogut and
Zander, 1992). For firms to grow or adapt to changes, they need to learn and expand their
knowledge base. The literature on learning suggests that past experience can generate learning that
enhances growth, competitiveness, and survival (e.g., Arrow, 1962; Baum and Ingram, 1998;
Dencker, Gruber, and Shah, 2009; Huber, 1991). Learning can occur vicariously by observing
others, within a firm via intra-firm learning, or from an establishment’s prior experience via
learning-by-doing. For example, Kim and Miner (2007) find that banks in the same local market
vicariously learn from the near-failures and failures of each other. Mowery, Oxley, and Silverman
(1996) and Hoang and Rothaermel (2010) study how strategic alliances facilitate interfirm learning.
Darr, Argote, and Epple (1995) and Kalnins and Mayer (2004) find that knowledge transfers across
pizza stores owned by the same franchisee but not across stores owned by different franchisees.
Seamans and Zhu (2017) find evidence of this intra-firm learning as well in a two-sided market
setting. They show that U.S. newspapers respond to Craigslist’s entry in 2001–2007 by
repositioning on the subscriber side of the market, and these newspapers benefit from having a
“sister” newspaper (owned by the same parent firm) that experienced Craigslist’s entry.
The literature on learning-by-doing provides evidence that firms benefit from replication
of an experience by moving down a learning curve. For example, in the context of the chemical
industry, Lieberman (1989) shows that prior product experience drives down cost and can deter
entry. Levitt and March (1988) point out that organizations learn by encoding inferences from
14
history into routines, which in turn guide their future behaviors, and learning can occur through
trial-and-error experimentation. Through experiments, Schilling et al. (2003) find that some degree
of variation can improve the learning rate. Kim, Kim, and Miner (2009) find that both the success
and the recovery experience of a firm generate survival-enhancing learning, but only after a certain
level of experience is reached. A number of studies (e.g., Chiesa and Frattini, 2011; Eggers, 2014,
2016; King and Tucci, 2002) find that firms learn from their prior experience with technological
changes and new markets. Past experience may build absorptive capacity (Cohen and Levinthal,
1990) that allows firms to be more efficient in incorporating new technology. Similar to our study,
Klepper and Simons (2000) relate experience in the radio market to performance in the TV market.
They show that more experienced radio firms are more likely to enter TV manufacturing, and have
greater market shares and longer survival in the TV market. Notably, however, all these prior
settings are one-sided markets.
Learning-by-doing could be particularly important for platforms in two-sided market
settings because of the complexity involved in strategic decision making as discussed above. We
expect that a platform that experiences a disruptive shock from another technology to learn how
to respond to this shock, and be more readily able to respond to a similar technological shock in
the future. As indicated in our institutional setting discussion above and in Klepper and Simons
(2000), radio shares many characteristics with TV. We thus expect that newspapers with more
experience responding to radio entry learn how to better respond when TV enters:
H4: The relationships identified in H3 are stronger for newspapers that had significant
experience competing with radio stations.
DATA AND METHODS
15
Data
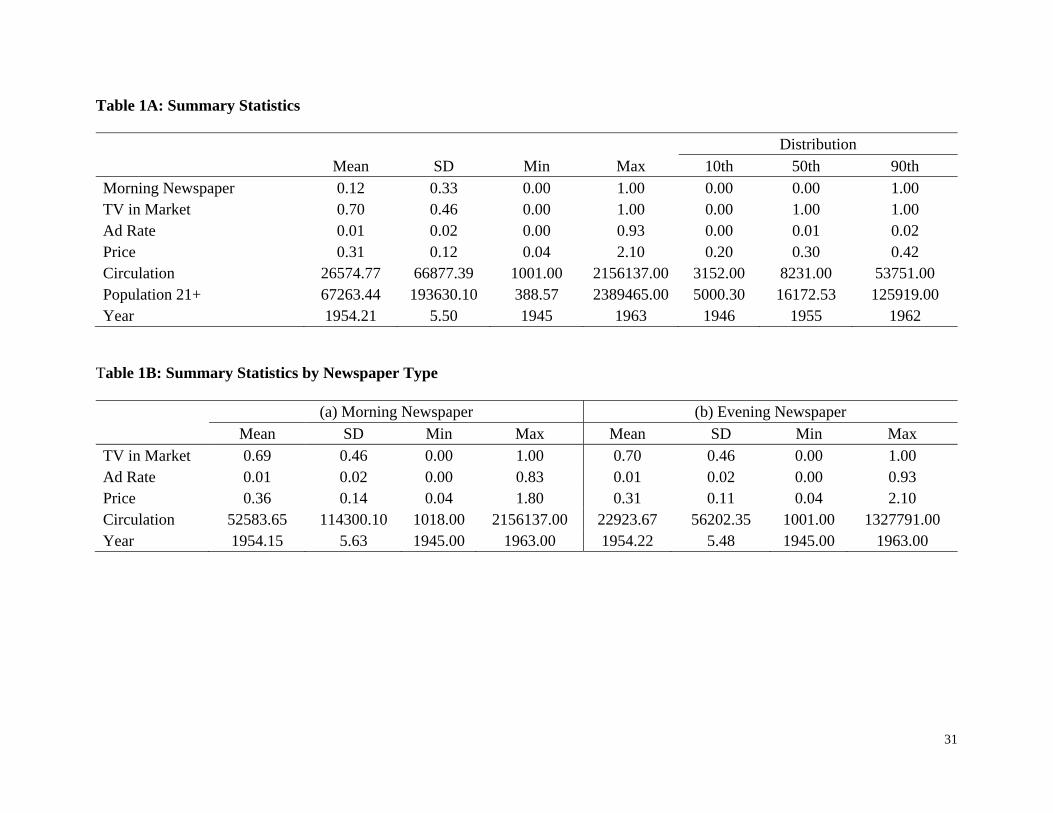
We collect data from multiple historical sources. Table 1A reports summary statistics of all
variables constructed. Information on the date of TV entry into different markets is from George
(2009). During the time period that we study (1945–1963), commercial TV broadcasting stations
enter 3,119 markets. Using this information, we create a dummy variable, TV_in_marketit, that
equals one for all years, t, after a TV station enters newspaper i’s local market, and zero otherwise.
We define the relevant market to be the county in which the newspaper is based, an approach
consistent with other research in this area (e.g., Gentzkow and Shapiro, 2010; Seamans and Zhu,
2014) and roughly consistent with TV broadcast coverage.
***Table 1A about here***
Information on each newspaper’s weekly circulation (Circulationit), subscription price
(Priceit), ad rate per subscriber (Ad rateit), morning or evening status, owner, and year founded is
from Editor & Publisher (E&P) International Yearbooks for years 1945–1949, 1952–1963. We
focus on these years because they are the most active years of TV entry (see Figure 1) and because
of data availability. The yearbooks contain data on virtually every newspaper in the U.S., and have
been used extensively for newspaper studies (e.g., Gentzkow and Shapiro, 2010; Seamans and Zhu,
2014). Since the TV entry shocks are local, we focus on newspapers that have a predominantly
local focus and therefore exclude large national papers, including the Christian Science Monitor,
New York Times, Wall Street Journal, and Washington Post from our analyses. As we focus on
competitive interactions, we also drop observations where a newspaper and a TV station have the
same owner.
We construct the variable morning_newspaperi to indicate whether newspaper i is
published and distributed in the morning (morning_newspaperi = 1) or in the evening

16
(morning_newspaperi = 0). In some cases, a newspaper is circulated both in the morning and in
the evening. For those newspapers, we calculate the circulation share of morning paper (i.e.,
circulation of morning paper / (circulation of morning paper + circulation of evening paper)). If
the circulation share of the morning paper is larger than 70 percent, we label such newspaper as a
morning newspaper. Our results are robust to different thresholds (e.g., 80 percent, 90 percent).
Notably, the designation of “morning” or “evening” newspaper does not change noticeably with
time. As indicated in Figure 1, the proportion of each remains relatively stable until the late 1970s.
Table 1B compares morning and evening newspapers and shows that both types of newspapers are
similar in many dimensions, except that morning newspapers tend to have greater circulation.
***Table 1B about here***
Information on radio availability in each market for years 1945–1963 is from the American
Radio History archive. The archive contains information on whether a radio station exists in a
given geographical market and the founding year of the radio station. Both E&P yearbooks and
the American Radio History archive were digitized by a firm in India.
We also include the population over the age of 21 at the county level (Population 21+it) as
a demographic control variable in some regressions. We prefer this measure of population over
others, as it would seem to do a good job of capturing the population of working individuals, who
are the likely target of any advertisers (though as described below our results are robust to alternate
population measures). This data is available at the county level for each census year 1940, 1950,
1960, and 1970 from the U.S. Census Bureau. Based on these known values, we interpolate the
values for the missing intercensal years.
Methods

17
Our empirical approach relies on differences in the presence of a TV station across and within
newspaper markets over time. Similar to prior studies (George, 2009; Baker and George, 2010;
Gentzkow, 2006), we leverage the exogenous variation in TV broadcasting station penetration
across geographical markets caused by the TV licensing freeze between 1950 and 1952 to establish
causal relationship: it is unlikely that any local newspapers anticipated this freeze (or the Korean
War which extended the freeze).
We also rely on differences in exposure to radio, which we define as the number of years
that elapse from the first radio station that enters a newspaper’s market to the entry of a TV
broadcast station. As we argue in our theoretical section above, a newspaper’s experience
competing with radio should provide it with useful information that help it to compete against TV.
In the same way that the timing of TV entry into a market is unanticipated, so too is the
newspaper’s exposure to radio prior to TV’s entry.2
We use the following regression specification in our analysis:
Outcomeit = β0 + β1TV_in_marketit + β2Morning_newspaperi*TV_in_marketit + XitΒ + γi +
ηt + εit,
where Outcomeit are the logarithms of Ad rateit , Priceit, and Circulationit. We take logarithms of
these variables because Table 1A indicates that these variables are highly skewed. Xit is a matrix
of other newspaper-year or market-year variables. In most regressions, we use the county-year
estimate of population in a market, though robustness tests described below use alternate
measures. The variables γi and ηt are fixed effects for newspaper and year. Errors are clustered at
the county level.
2 That is, if “TV entry year” is exogenous, then “TV entry year” – “Radio entry year” is also exogenous.

18
For the radio experience analysis, we redo the analysis after splitting the data into roughly
equal subsamples, depending on the number of years of experience with radio (above and below
the median number of years of experience). We expect to observe stronger newspaper responses
when the number of years of experience is greater.
RESULTS
Main results
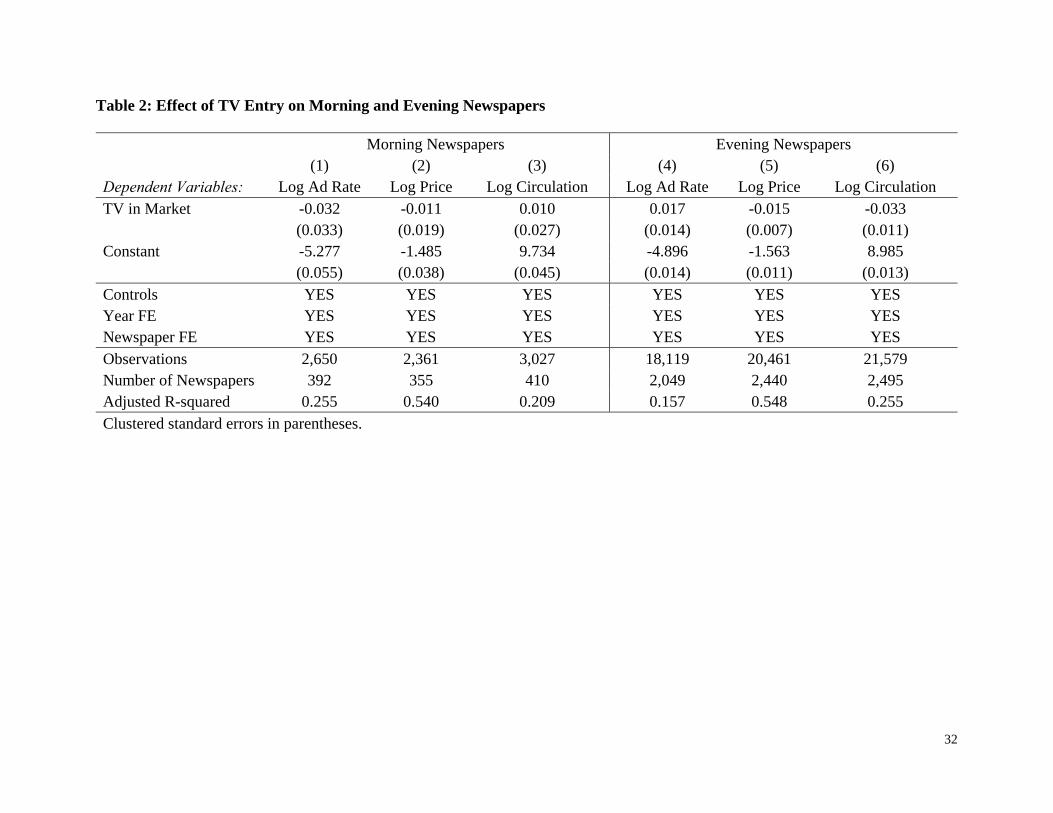
We first present our newspaper results separately for morning and evening newspapers in Table 2,
before presenting results with interactions in Table 3. Columns 1–3 in Table 2 report the results
for morning newspapers, and Columns 4–6 show the results for evening newspapers. The effect of
TV_in_marketit differs for morning and evening newspapers. For morning newspapers, the main
effect of TV_in_marketit is not significant for any of the dependent variables being studied. For
evening newspapers, the entry of TV leads to a significant decline in subscription prices (p-value
= 0.032) and circulation (p-value = 0.002) but not in ad rates. The coefficients of the regression
indicate that the entry of TV leads to roughly 1.5 percent drop in price and 3.3 percent decline in
circulation for evening newspapers. These findings are consistent with Hypotheses 1 and 2.
***Table 2 about here***
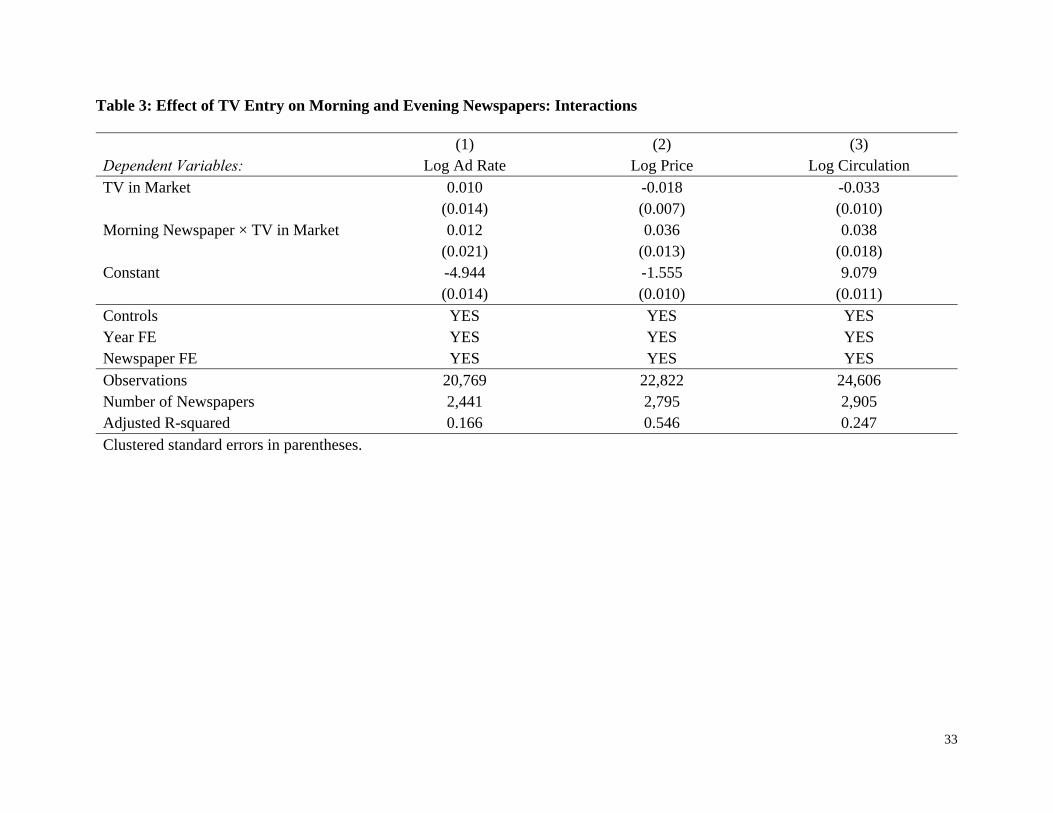
Table 3 reports similar results using interactions. We find that the coefficients of
Morning_newspaperi*TV_in_marketit are significant only for subscription prices and circulation
but not for ad rates. Morning newspapers’ subscription prices and circulation become 3.6 percent
and 3.8 percent higher than evening newspapers, respectively, as a result of the entry of TV. These
results are in line with our expectations in Hypothesis 3.
***Table 3 about here***
19
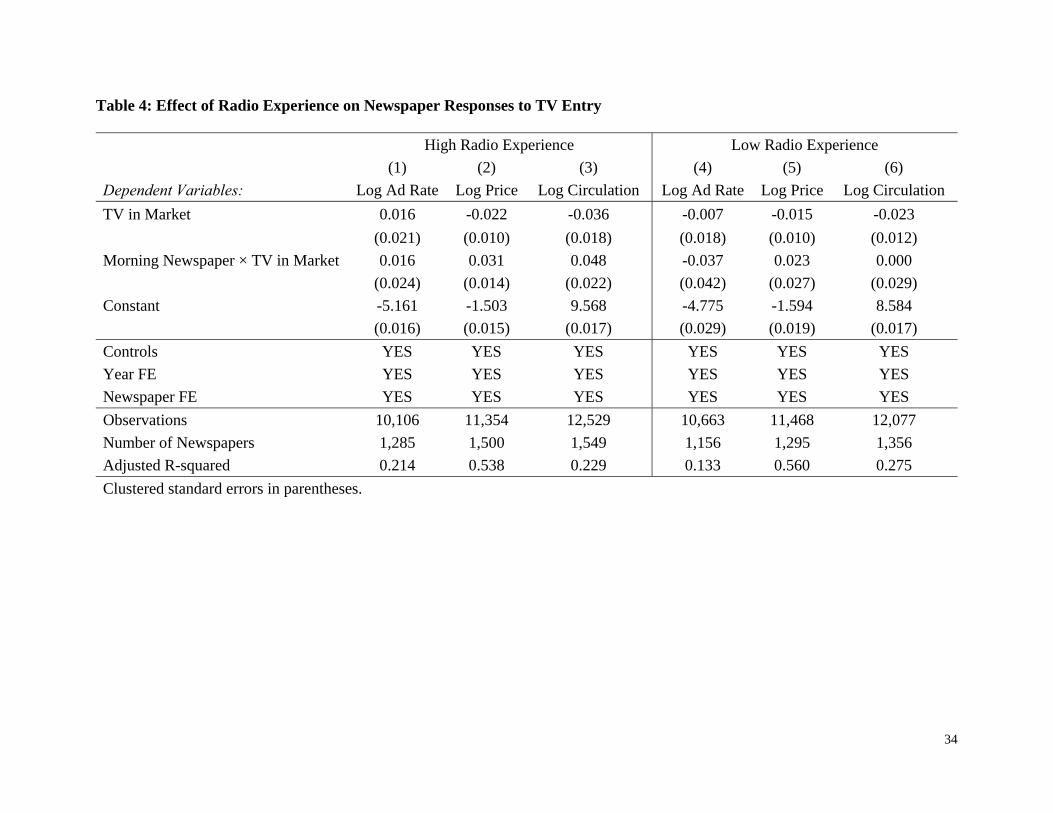
We next investigate how experience with radio conditions a newspaper’s response to TV
entry. These results are presented in Table 4. Columns 1–3 provide regressions on the sub-sample
of newspapers that have “high” experience with radio (14+ years of radio experience prior to TV
entry) and Columns 4–6 provide regressions on the sub-sample of newspapers that have “low”
experience with radio (<14 years of radio experience prior to TV entry). The coefficients in the
“high” experience category are generally of similar magnitude and significance to those presented
in Table 3. The coefficients in the “low” experience category (except for the constants) are
generally not significant. These findings are consistent with our expectations—it appears that more
experience with radio “strengthens” newspapers’ ability to respond to TV entry—as stated in
Hypothesis 4.
***Table 4 about here***
Robustness tests
We believe our results are robust to numerous alternative explanations. Our regressions include
newspaper-fixed effects, which control for idiosyncratic firm differences. The year-fixed effects
control for year specific shocks that affect all newspapers (such as recessions). Our regressions
also include annual county population, which helps to control for any market-specific changes in
demand for newspaper or TV. In addition, as we argue in our Methods subsection above, the entry
of TV into a market is arguably exogenous, and unanticipated by the local newspaper. The FCC’s
freeze provides us with temporal and geographic variation in the entry of TV. This helps us rule
out that any effect of entry of TV into a market is due to a contemporaneous shock that affects all
markets at the same time. Nevertheless, we undertake several robustness tests to rule out other
alternative explanations and present the results in an Appendix.

20
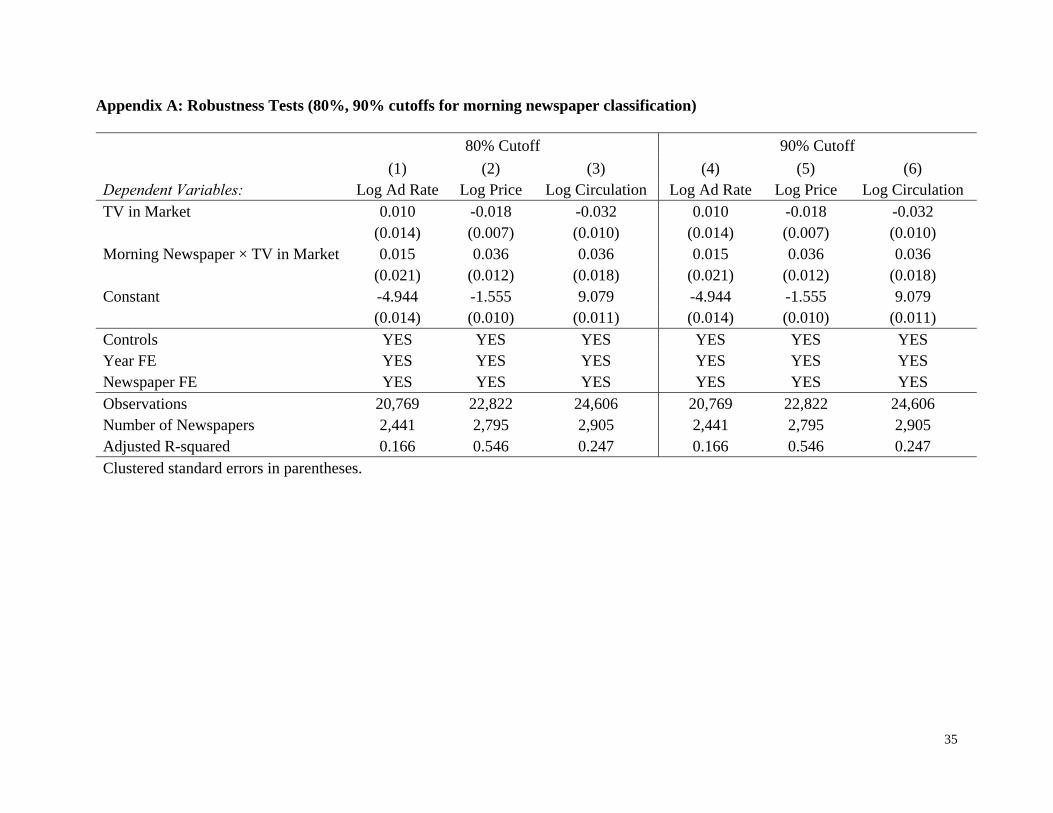
First, as indicated above, we try alternate cut-off values for our definition of morning
newspaper (80 percent and 90 percent, instead of 70 percent). The results are robust to these
alternate specifications (see Appendix A).
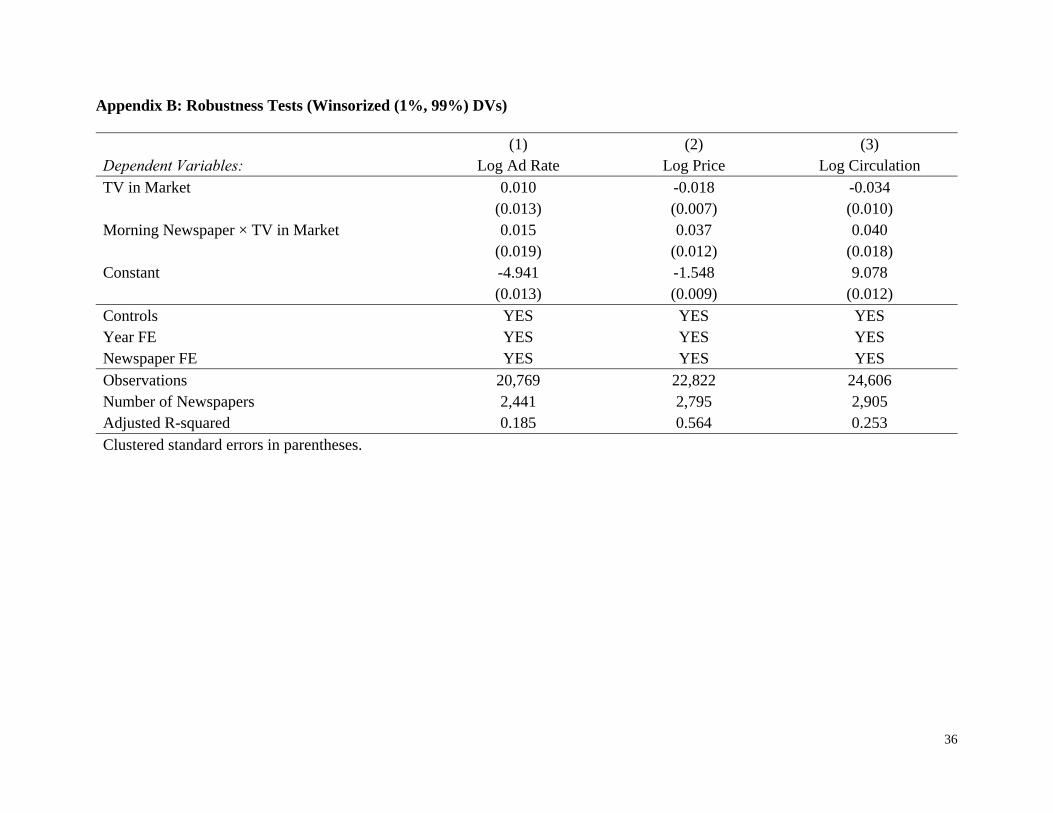
Second, to rule out that outliers (perhaps from poor coding done by the firm we used) are
driving our results, we winsorize our dependent variables at the 1 percent and 99 percent levels.
These results, presented in Appendix B, are similar to those presented above.
Third, we replicate our main results in separate regressions using alternate measures of
county-year population such as total population in the county, male population in county, and
female population in county. The results using total population are presented in Appendix C; the
other population results are largely similar.
Fourth, we are worried about a more complicated story that TV entry affects the nature of
competition among newspapers more generally, and in turn leads to changes in advertising rates,
subscription prices, and circulation. We thus replicate our main results after restricting our sample
of newspapers to those which are monopolists or duopolists in their markets. The results, presented
in Appendix D, are similar to our main results, and suggest that this “indirect” effect among
newspapers is unlikely to be the causal reason for the change in newspaper behavior; rather,
newspapers are responding to entry by TV.
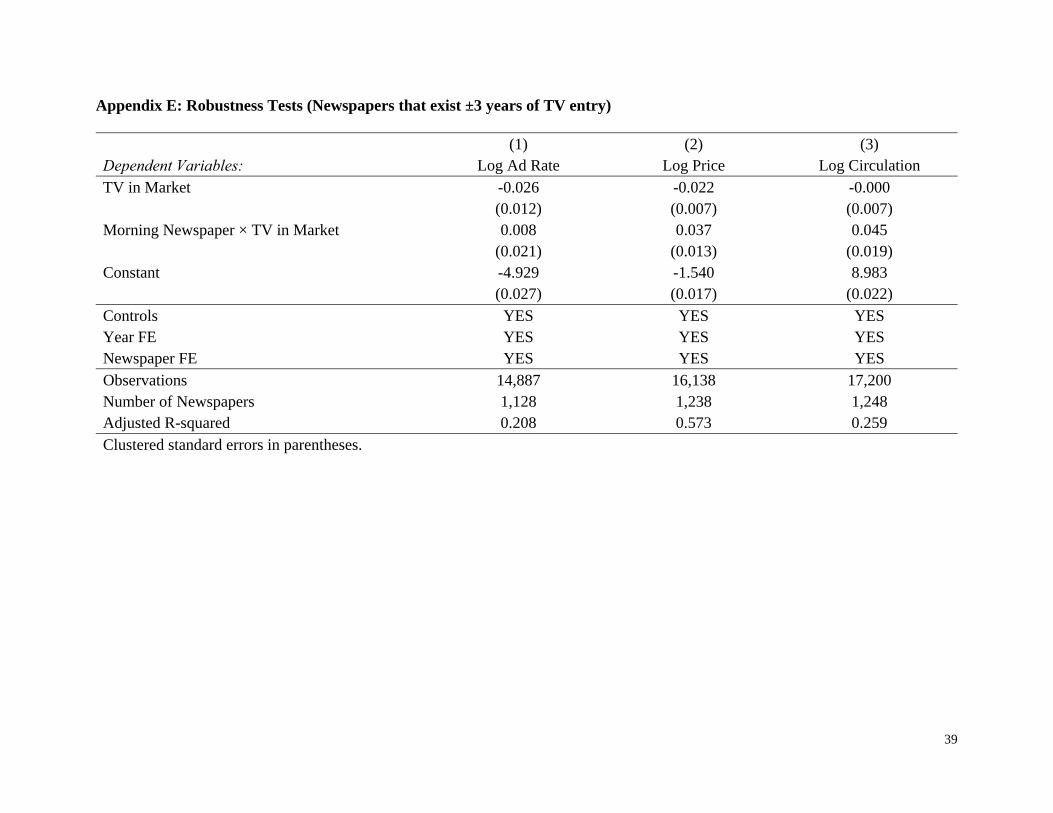
Fifth, we are concerned that our findings are caused by entry and exit of newspapers before
or after the TV entry shock. For example, if a large number of high circulation newspapers exited
immediately after TV entry, that may drive down the “average” of the TV entry effect that we
observe in Column 3 of Table 3. We conduct a robustness check by restricting our analysis to the
set of newspapers that we have observations for at least three years before and after the TV entry

21
shock. The results, presented in Appendix E, are similar to our main results and help rule out this
alternative explanation.
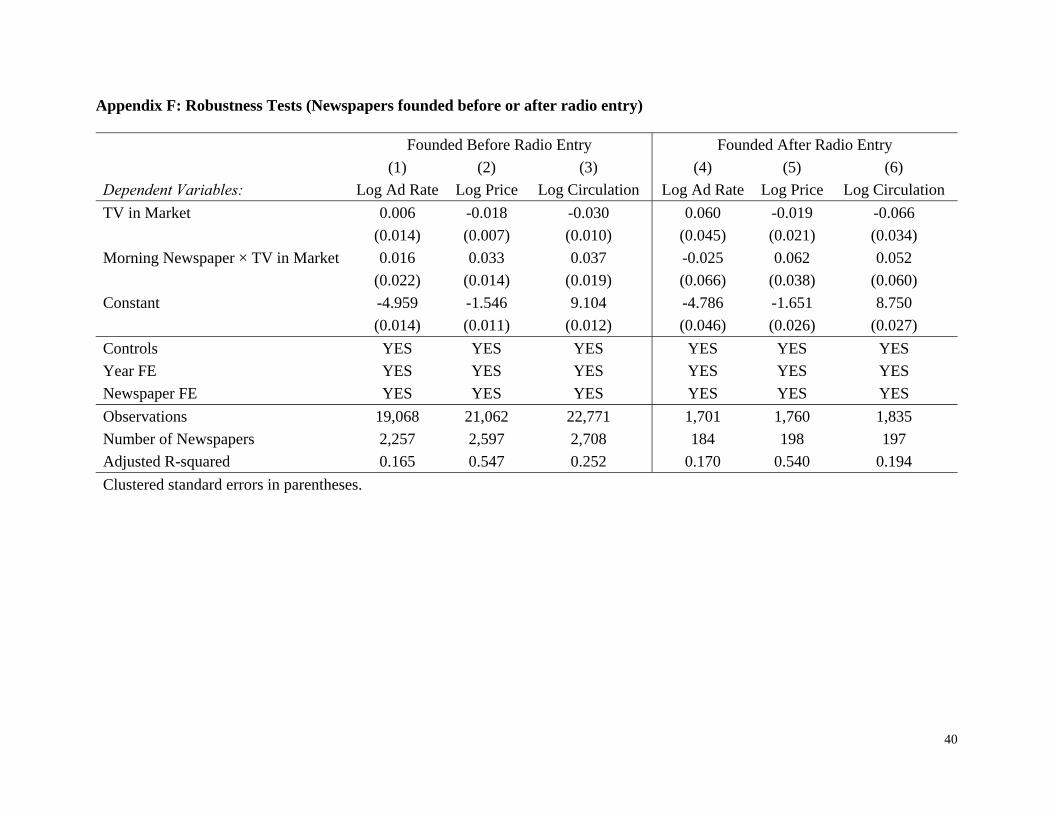
Finally, we provide a falsification check of our radio experience (Table 4) results. Recall
our argument that newspapers with more experience dealing with radio entry will have had more
time to learn how to deal with similar disruptive technological shocks. We take advantage of the
fact that some newspapers were founded in a market after radio entered that market. These
newspapers have spent their entire corporate lives operating in an environment with radio; they
never needed to make an adjustment from their old strategies to the new ones, so they have learned
little about how to adapt to technological shocks. In Appendix F, we split the sample of newspapers
into those which were founded prior to radio entry and those which were founded after radio
entered their market. The coefficients of interest are largely significant in the subsample founded
before radio entry with expected signs, and largely insignificant in the subsample founded after
radio entry.
DISCUSSION AND CONCLUSION
Our paper provides a study of how U.S. newspapers respond to local entry of TV broadcasting
stations during 1945–1963. Our empirical setting takes advantage of a quasi-natural experiment:
the staggered geographic and temporal rollout of TV stations that were temporarily halted during
the Korean War. We also consider how the newspapers’ prior experience with entry by radio in
earlier decades influences their responses to TV entry. We find that newspapers in markets that
are more likely to have multi-homing customers (i.e., morning newspapers and TV) have higher
prices and higher circulation relative to newspapers in markets with single-homing customers (i.e.,
evening newspapers and TV). These results suggest that platforms need to take their users’ multi-

22
homing tendencies into consideration when adjusting their strategies in response to entry. We also
find that these effects are stronger for newspapers with more experience with radio. These results
suggest that “ability to adapt” to technological shocks in two-sided market settings is an important
capability that shapes a platform’s response. Additional results (in Appendix F) suggest that it is a
capability that needs to be learned from experience, not observed vicariously.
Our study makes several contributions. Importantly, we demonstrate the value of linking
two-sided market theory to a broader corporate strategy literature by studying how a platform
firm’s prior history matters for its future strategic decisions. Moreover, we provide theoretically
grounded empirical evidence of how a platform firm responds to entry by another platform in a
setting with varying degrees of multi-homing tendencies—an area with recent theoretical research,
but little empirical work. Finally, even though our study draws from a historical context over half
a century ago, we believe it has implications that are managerially relevant today. Firms in multiple
industries can now be characterized as “two-sided”; firms in these settings need to consider how
their customers’ behavior—i.e., whether they multi-home or single-home—may influence the
trajectory of competition in a market.
While our empirical setting and a battery of robustness checks help assuage concerns
around selection and other types of endogeneity, our findings and research design do have
limitations. First, our story relies only on indirect evidence of learning by doing based on the
number of years that radio has been in a newspaper’s market. Future research may want to gather
more direct evidence to better understand the mechanisms through which learning occurs. Second,
for data availability reasons, we focus only on price, ad rate and circulation responses. However,
firms have other means of responding to technological disruption, including resource
reconfiguration (Karim and Mitchell, 2000; Lieberman, Lee, and Folta, 2017), cost cutting (Love
23
and Nohria, 2005), and other types of differentiation (Seamans and Zhu, 2017; Wang and Shaver,
2014, 2016). Future research may want to examine how single- and multi-homing affect non-price
dimensions of strategy. Third, firm strategies such as product differentiation and exclusive
contracts may influence single-homing and multi-homing tendencies (e.g., Cennamo and Santalo,
2013). Future research can explore the effectiveness of these strategies in other settings. Finally,
we study the role of single- and multi-homing in a single industry. The benefit of this approach is
that it allows us to take advantage of several key institutional features (such as multiple,
geographically segmented markets and staggered entry of TV into these markets), but the
drawback is that we cannot know how well these results generalize to other settings. Thus, future
research may want to examine single- and multi-homing in other settings.
REFERENCES
Ambrus A, Calvano E, Reisinger M. 2016. Either or both competition: A “two-sided” theory of advertising with overlapping viewerships. American Economic Journal: Microeconomics 8(3): 189–222.
Anderson SP, Gabszewicz JJ. 2006. The media and advertising: A tale of two-sided markets. Ginsburgh VA, Throsby D, eds. Handbook of the Economics of Art and Culture Vol. 1 (Elsevier B.V., Amsterdam), 568–614.
Argentesi E, Filistrucchi L. 2007. Estimating market power in a two-sided market: The case of newspapers. Journal of Applied Econometrics 22(7): 1247–1266.
Armstrong M. 2006. Competition in two-sided markets. RAND Journal of Economics 37(3): 669–691.
Armstrong M, Wright J. 2007. Two-sided markets, competitive bottlenecks and exclusive contracts. Economic Theory 32(2): 353–380.
Arrow K. 1962. The economic implications of learning by doing. Review of Economic Studies 29(3): 155–173.
Baker MJ, George LM. 2010. The role of television in household debt: Evidence from the 1950’s. The BE Journal of Economic Analysis & Policy 10(1): Article 41.
Baum JA, Ingram P. 1998. Survival-enhancing learning in the Manhattan hotel industry, 1898–1980. Management Science 44(7): 996–1016.
Bresnahan T, Orsini J, Yin P. 2015. Demand heterogeneity, inframarginal multi-homing, and platform market stability: Mobile app. Working paper, Stanford University, Stanford.

24
Casadesus-Masanell C, Zhu F. 2010. Strategies to fight ad-sponsored rivals. Management Science 56(9): 1484–1499.
Cennamo C, Santalo J. 2013. Platform competition: Strategic trade-offs in platform markets. Strategic Management Journal 34(11): 1331–1350.
Chandra A, Kaiser U. 2014. Targeted advertising in magazine markets and the advent of the internet. Management Science 60(7): 1829–1843.
Chang Y, Thorson E. 2004. Television and web advertising synergies. Journal of Advertising 33(2): 75–84.
Chiesa V, Frattini F. 2011. Commercializing technological innovation: Learning from failures in
high‐tech markets. Journal of Product Innovation Management 28(4): 437–454.
Cohen WM, Levinthal DA. 1990. Absorptive capacity: A new perspective on learning and innovation. Administrative Science Quarterly 35(1): 128–152.
Corts KS, Lederman M. 2009. Software exclusivity and the scope of indirect network effects in the U.S. home video game market. International Journal of Industrial Organization 27(2):121–136.
Choi JP. 2010. Tying in two-sided markets with multi-homing. Journal of Industrial Economics 58(3): 607–626.
Darr ED, Argote L, Epple D. 1995. The acquisition, transfer, and depreciation of knowledge in service organizations: Productivity in franchises. Management Science 41(11): 1750–1762.
Dencker JC, Gruber M, Shah SK. 2009. Pre-entry knowledge, learning, and the survival of new firms. Organization Science 20(3): 516–537.
Eggers JP. 2014. Competing technologies and industry evolution: The benefits of making mistakes in the flat panel display industry. Strategic Management Journal 35(2): 159–178.
Eggers JP. 2016. Reversing course: Competing technologies, mistakes, and renewal in flat panel displays. Strategic Management Journal 37(8): 1578–1596.
Eisenmann TR, Parker G, Van Alstyne MW. 2011. Platform envelopment. Strategic Management Journal 32(12): 1270–1285.
Foss NJ. 1996. Knowledge-based approaches to the theory of the firm: Some critical comments. Organization Science 7(5): 470–476.
Gabszewicz J, Wauthy X. 2004. Two-sided markets and price competition with multi-homing. Working paper.
Gentzkow M. 2006. Television and voter turnout. Quarterly Journal of Economics 121(3): 931–972.
Gentzkow M, Shapiro JM. 2010. What drives media slant? Evidence from US daily newspapers. Econometrica 78(1): 35–71.
Gentzkow M, Shapiro JM, Sinkinson M. 2011. The effect of newspaper entry and exit on electoral politics. American Economic Review 101(7): 2980–3018.
George LM. 2009. National television and the market for local products: The case of beer. The Journal of Industrial Economics 57(1): 85–111.
Hoang, H, Rothaermel, FT. 2010. Leveraging internal and external experience: Exploration, exploitation, and R&D project performance. Strategic Management Journal 31(7): 734–758
25
Huber GP. 1991. Organizational learning: The contributing processes and the literatures. Organization Science 2(1): 88–115.
Iansiti M, Levien R. 2004. The Keystone Advantage: What the New Dynamics of Business Ecosystems Mean for Strategy, Innovation, and Sustainability. Harvard Business School Press.
Kalnins A, Mayer KJ. 2004. Franchising, ownership, and experience: A study of pizza restaurant survival. Management Science 50(12): 1716–1728.
Kapoor R, Agarwal S. 2017. Sustaining superior performance in business ecosystems: evidence from application software developers in the iOS and Android smartphone ecosystems. Organization Science 28(3): 531–551.
Karim S, Mitchell W. 2000. Path-dependent and path-breaking change: Reconfiguring business resources following acquisitions in the US medical sector, 1978-1995. Strategic Management Journal 21(10-11): 1061–1081.
Kim JY, Kim JYJ, Miner AS. 2009. Organizational learning from extreme performance experience: The impact of success and recovery experience. Organization Science 20(6): 958–978.
Kim JYJ, Miner AS. 2007. Vicarious learning from the failures and near-failures of others: Evidence from the US commercial banking industry. Academy of Management Journal 50(3): 687–714.
King AA, Tucci CL. 2002 Incumbent entry into new market niches: The role of experience and managerial choice in the creation of dynamic capabilities. Management Science 48(2): 171–186.
Klepper S, Simons KL. 2000. Dominance by birthright: Entry of prior radio producers and competitive ramifications in the US television receiver industry. Strategic Management Journal 21(10-11): 997–1016.
Kogut B, Zander U. 1992. Knowledge of the firm, combinative capabilities, and the replication of technology. Organization Science 3(3): 383–397.
Landsman V, Stremersch S. 2011. Multihoming in two-sided markets: An empirical inquiry in the video game console industry. Journal of Marketing 75(6): 39–54.
Levitt B, March JG. 1988. Organizational learning. Annual Review of Sociology 14(1): 319–338. Lieberman MB, 1989. The learning curve, technology barriers to entry, and competitive survival
in the chemical processing industries. Strategic Management Journal 10(5): 431–447. Lieberman MB, Lee GK, Folta TB. 2017. Entry, exit, and the potential for resource redeployment.
Strategic Management Journal 38(3): 526–544. Love EG, Nohria N. 2005. Reducing slack: The performance consequences of downsizing by large
industrial firms, 1977–93. Strategic Management Journal 26(12): 1087–1108. Mowery DC, Oxley JE, Silverman BS. 1996. Strategic alliances and interfirm knowledge transfer.
Strategic Management Journal 17(S2): 77–91. Park, KF. 2017. Technological change in two-sided markets: The digital revolution and local U.S.
newspapers. Working paper. Parker G, Van Alstyne MW. 2005. Two-sided network effects: A theory of information product
design. Management Science 51(10): 1494–1504.

26
Piezunka H, Katila R, Eisenhardt KM. 2015. Big fish or big pond? Seller’s dilemma in intermediary selection. Working paper.
Rochet JC, Tirole J. 2003. Platform competition in two-sided markets. Journal of the European Economic Association 1(4): 990–1029.
Seamans R, Zhu F. 2014. Responses to entry in multi-sided markets: The impact of Craigslist on local newspapers. Management Science 60(2): 476–493.
Seamans, R, Zhu F. 2017. Repositioning and cost-cutting: The impact of competition on platform strategies. Strategy Science 2(2): 83–99.
Schilling MA, Vidal P, Polyhart RE, Marangoni A. 2003. Learning by doing something else: Variation, relatedness, and the learning curve. Management Science 49(1): 39–56.
Wang RD, Shaver JM. 2014. Competition-driven repositioning. Strategic Management Journal 35(11): 1585–1604.
Wang RD, Shaver JM. 2016. The multifaceted nature of competitive response: Repositioning and new product launch as joint response to competition. Strategy Science 1(3): 148–162.
Wright J. 2004. One-sided logic in two-sided markets. Review of Network Economics 3: 42–63. Yoffie, DB, Cusumano MA. 2015. Strategy Rules: Five Timeless Lessons from Bill Gates, Andy
Grove, and Steve Jobs. HarperBusiness. Zhu F, Iansiti M. 2012. Entry into platform-based markets. Strategic Management Journal 33(1):
88–106.
27
Source: Newspaper Association of America
Figure 1: Annual Count of Newspapers, by Year and Type
0
200
400
600
800
1000
1200
1400
1600
1800
2000
1940 1950 1960 1970 1980 1990 2000 2010
Morning Evening Total Daily Newspapers
28
Source: Television Factbook
Figure 2: Cumulative Number of Counties with TV Stations
29
Source: Television Obscurities
Figure 3: 1941 TV Programming Schedule for WNBT in New York City

30
Source: Early Television Museum
Figure 4: 1948 TV Programming Schedule for KSD-TV in St. Louis
31
Table 1A: Summary Statistics
Distribution Mean SD Min Max 10th 50th 90th Morning Newspaper 0.12 0.33 0.00 1.00 0.00 0.00 1.00 TV in Market 0.70 0.46 0.00 1.00 0.00 1.00 1.00 Ad Rate 0.01 0.02 0.00 0.93 0.00 0.01 0.02 Price 0.31 0.12 0.04 2.10 0.20 0.30 0.42 Circulation 26574.77 66877.39 1001.00 2156137.00 3152.00 8231.00 53751.00 Population 21+ 67263.44 193630.10 388.57 2389465.00 5000.30 16172.53 125919.00 Year 1954.21 5.50 1945 1963 1946 1955 1962
Table 1B: Summary Statistics by Newspaper Type (a) Morning Newspaper (b) Evening Newspaper Mean SD Min Max Mean SD Min Max TV in Market 0.69 0.46 0.00 1.00 0.70 0.46 0.00 1.00 Ad Rate 0.01 0.02 0.00 0.83 0.01 0.02 0.00 0.93 Price 0.36 0.14 0.04 1.80 0.31 0.11 0.04 2.10 Circulation 52583.65 114300.10 1018.00 2156137.00 22923.67 56202.35 1001.00 1327791.00 Year 1954.15 5.63 1945.00 1963.00 1954.22 5.48 1945.00 1963.00
32
Table 2: Effect of TV Entry on Morning and Evening Newspapers
Morning Newspapers Evening Newspapers (1) (2) (3) (4) (5) (6)
Dependent Variables: Log Ad Rate Log Price Log Circulation Log Ad Rate Log Price Log Circulation TV in Market -0.032 -0.011 0.010 0.017 -0.015 -0.033
(0.033) (0.019) (0.027) (0.014) (0.007) (0.011) Constant -5.277 -1.485 9.734 -4.896 -1.563 8.985
(0.055) (0.038) (0.045) (0.014) (0.011) (0.013) Controls YES YES YES YES YES YES Year FE YES YES YES YES YES YES Newspaper FE YES YES YES YES YES YES Observations 2,650 2,361 3,027 18,119 20,461 21,579 Number of Newspapers 392 355 410 2,049 2,440 2,495 Adjusted R-squared 0.255 0.540 0.209 0.157 0.548 0.255 Clustered standard errors in parentheses.
33
Table 3: Effect of TV Entry on Morning and Evening Newspapers: Interactions
(1) (2) (3) Dependent Variables: Log Ad Rate Log Price Log Circulation TV in Market 0.010 -0.018 -0.033
(0.014) (0.007) (0.010) Morning Newspaper × TV in Market 0.012 0.036 0.038
(0.021) (0.013) (0.018) Constant -4.944 -1.555 9.079
(0.014) (0.010) (0.011) Controls YES YES YES Year FE YES YES YES Newspaper FE YES YES YES Observations 20,769 22,822 24,606 Number of Newspapers 2,441 2,795 2,905 Adjusted R-squared 0.166 0.546 0.247 Clustered standard errors in parentheses.
34
Table 4: Effect of Radio Experience on Newspaper Responses to TV Entry
High Radio Experience Low Radio Experience (1) (2) (3) (4) (5) (6)
Dependent Variables: Log Ad Rate Log Price Log Circulation Log Ad Rate Log Price Log Circulation
TV in Market 0.016 -0.022 -0.036 -0.007 -0.015 -0.023 (0.021) (0.010) (0.018) (0.018) (0.010) (0.012)
Morning Newspaper × TV in Market 0.016 0.031 0.048 -0.037 0.023 0.000 (0.024) (0.014) (0.022) (0.042) (0.027) (0.029)
Constant -5.161 -1.503 9.568 -4.775 -1.594 8.584 (0.016) (0.015) (0.017) (0.029) (0.019) (0.017)
Controls YES YES YES YES YES YES
Year FE YES YES YES YES YES YES
Newspaper FE YES YES YES YES YES YES
Observations 10,106 11,354 12,529 10,663 11,468 12,077
Number of Newspapers 1,285 1,500 1,549 1,156 1,295 1,356
Adjusted R-squared 0.214 0.538 0.229 0.133 0.560 0.275
Clustered standard errors in parentheses.
35
Appendix A: Robustness Tests (80%, 90% cutoffs for morning newspaper classification)
80% Cutoff 90% Cutoff (1) (2) (3) (4) (5) (6)
Dependent Variables: Log Ad Rate Log Price Log Circulation Log Ad Rate Log Price Log Circulation TV in Market 0.010 -0.018 -0.032 0.010 -0.018 -0.032
(0.014) (0.007) (0.010) (0.014) (0.007) (0.010) Morning Newspaper × TV in Market 0.015 0.036 0.036 0.015 0.036 0.036
(0.021) (0.012) (0.018) (0.021) (0.012) (0.018) Constant -4.944 -1.555 9.079 -4.944 -1.555 9.079
(0.014) (0.010) (0.011) (0.014) (0.010) (0.011) Controls YES YES YES YES YES YES Year FE YES YES YES YES YES YES Newspaper FE YES YES YES YES YES YES Observations 20,769 22,822 24,606 20,769 22,822 24,606 Number of Newspapers 2,441 2,795 2,905 2,441 2,795 2,905 Adjusted R-squared 0.166 0.546 0.247 0.166 0.546 0.247 Clustered standard errors in parentheses.
36
Appendix B: Robustness Tests (Winsorized (1%, 99%) DVs)
(1) (2) (3) Dependent Variables: Log Ad Rate Log Price Log Circulation TV in Market 0.010 -0.018 -0.034
(0.013) (0.007) (0.010) Morning Newspaper × TV in Market 0.015 0.037 0.040
(0.019) (0.012) (0.018) Constant -4.941 -1.548 9.078
(0.013) (0.009) (0.012) Controls YES YES YES Year FE YES YES YES Newspaper FE YES YES YES Observations 20,769 22,822 24,606 Number of Newspapers 2,441 2,795 2,905 Adjusted R-squared 0.185 0.564 0.253 Clustered standard errors in parentheses.

37
Appendix C: Robustness Tests (Total population per county)
(1) (2) (3) Dependent Variables: Log Ad Rate Log Price Log Circulation TV in Market 0.006 -0.020 -0.024
(0.015) (0.007) (0.010) Morning Newspaper × TV in Market 0.011 0.036 0.038
(0.021) (0.013) (0.018) Constant -4.912 -1.558 9.022
(0.014) (0.011) (0.020) Controls YES YES YES Year FE YES YES YES Newspaper FE YES YES YES Observations 20,797 22,851 24,635 Number of Newspapers 2,444 2,798 2,908 Adjusted R-squared 0.166 0.547 0.254 Clustered standard errors in parentheses.

38
Appendix D: Robustness Tests (Monopoly & duopoly markets)
(1) (2) (3) Dependent Variables: Log Ad Rate Log Price Log Circulation TV in Market -0.020 -0.015 -0.018
(0.013) (0.007) (0.009) Morning Newspaper × TV in Market -0.006 0.030 0.036
(0.024) (0.017) (0.021) Constant -4.869 -1.574 8.820
(0.018) (0.013) (0.013) Controls YES YES YES Year FE YES YES YES Newspaper FE YES YES YES Observations 15,146 16,224 17,107 Number of Newspapers 1,803 2,018 2,084 Adjusted R-squared 0.164 0.561 0.267 Clustered standard errors in parentheses.
39
Appendix E: Robustness Tests (Newspapers that exist ±3 years of TV entry)
(1) (2) (3) Dependent Variables: Log Ad Rate Log Price Log Circulation TV in Market -0.026 -0.022 -0.000
(0.012) (0.007) (0.007) Morning Newspaper × TV in Market 0.008 0.037 0.045
(0.021) (0.013) (0.019) Constant -4.929 -1.540 8.983
(0.027) (0.017) (0.022) Controls YES YES YES Year FE YES YES YES Newspaper FE YES YES YES Observations 14,887 16,138 17,200 Number of Newspapers 1,128 1,238 1,248 Adjusted R-squared 0.208 0.573 0.259 Clustered standard errors in parentheses.
40
Appendix F: Robustness Tests (Newspapers founded before or after radio entry)
Founded Before Radio Entry Founded After Radio Entry (1) (2) (3) (4) (5) (6)
Dependent Variables: Log Ad Rate Log Price Log Circulation Log Ad Rate Log Price Log Circulation
TV in Market 0.006 -0.018 -0.030 0.060 -0.019 -0.066 (0.014) (0.007) (0.010) (0.045) (0.021) (0.034)
Morning Newspaper × TV in Market 0.016 0.033 0.037 -0.025 0.062 0.052 (0.022) (0.014) (0.019) (0.066) (0.038) (0.060)
Constant -4.959 -1.546 9.104 -4.786 -1.651 8.750 (0.014) (0.011) (0.012) (0.046) (0.026) (0.027)
Controls YES YES YES YES YES YES
Year FE YES YES YES YES YES YES
Newspaper FE YES YES YES YES YES YES
Observations 19,068 21,062 22,771 1,701 1,760 1,835
Number of Newspapers 2,257 2,597 2,708 184 198 197
Adjusted R-squared 0.165 0.547 0.252 0.170 0.540 0.194
Clustered standard errors in parentheses.