Multi-detector GPC Characterization Drew Poche’ Outline Basics-On the mechanism of GPC Detection...
41
Multi-detector GPC Characterization Drew Poche’
-
Upload
paul-kennedy -
Category
Documents
-
view
220 -
download
4
Transcript of Multi-detector GPC Characterization Drew Poche’ Outline Basics-On the mechanism of GPC Detection...
Multi-detector GPC Characterization
Drew Poche’
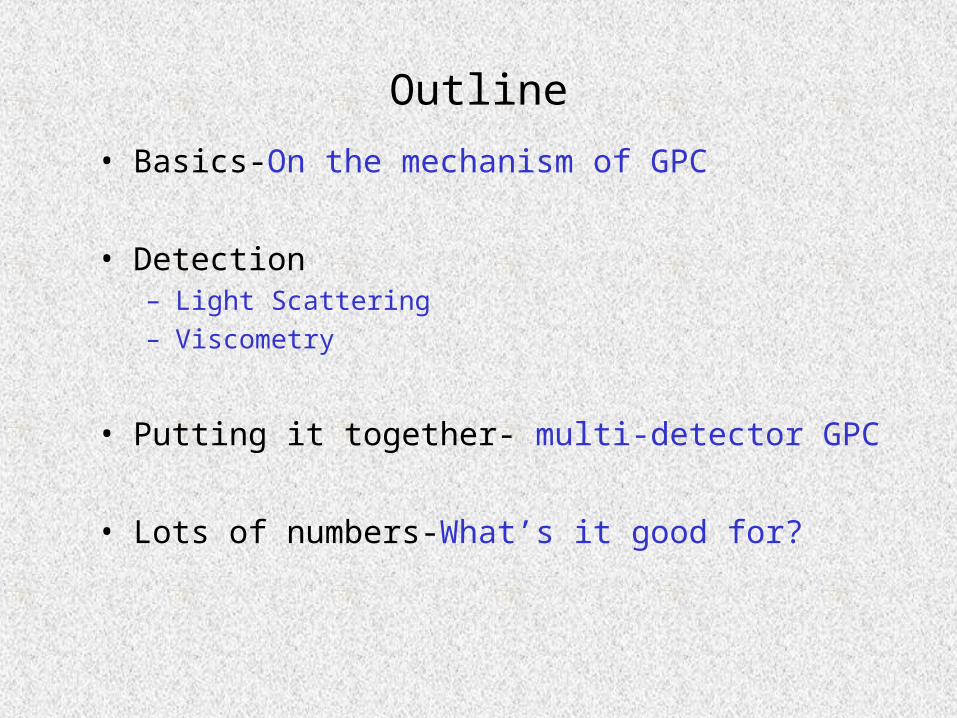
Outline
• Basics-On the mechanism of GPC
• Detection– Light Scattering– Viscometry
• Putting it together- multi-detector GPC
• Lots of numbers-What’s it good for?
How big is big?
Drew Poche’Materials CharacterizationDow Chemical, Plaquemine
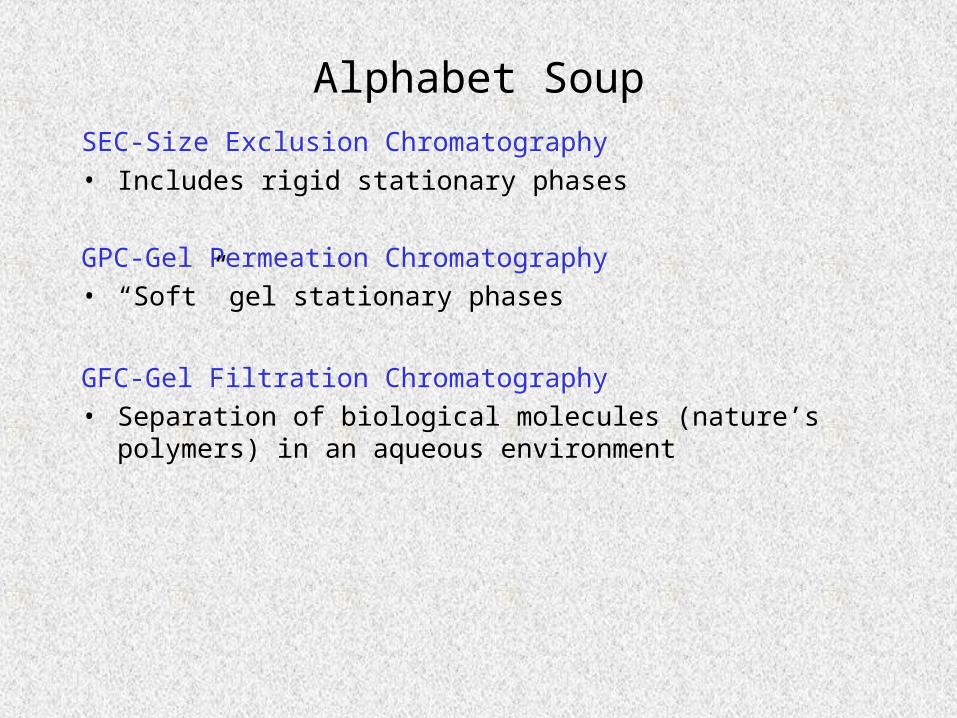
Alphabet SoupSEC-Size Exclusion Chromatography• Includes rigid stationary phases
GPC-Gel Permeation Chromatography• “Soft” gel stationary phases
GFC-Gel Filtration Chromatography• Separation of biological molecules (nature’s polymers)
in an aqueous environment
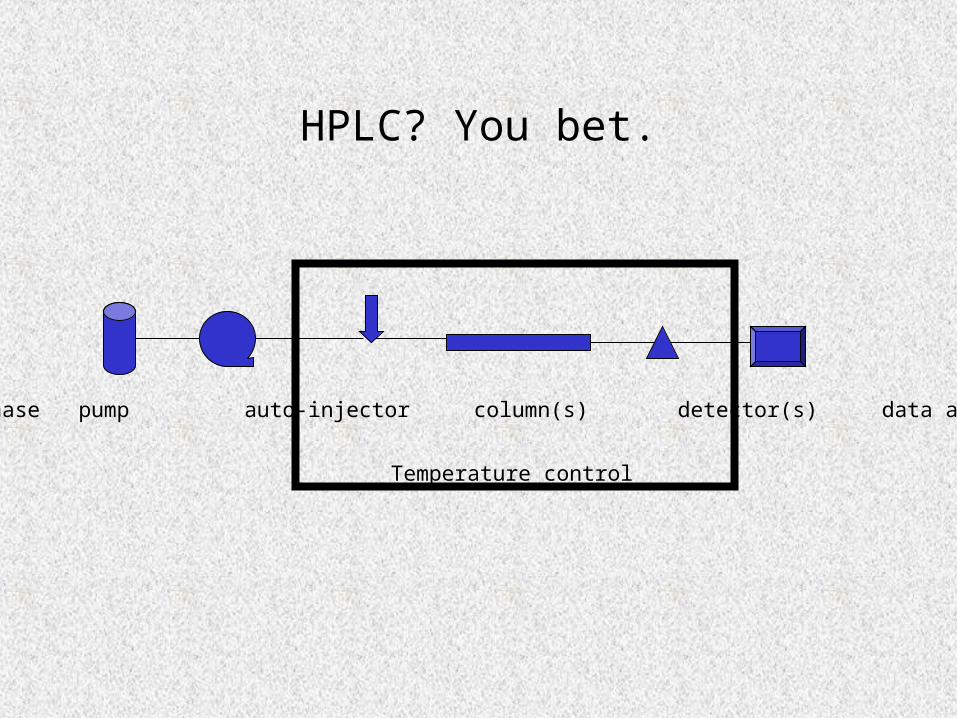
HPLC? You bet.
Mobile phase pump auto-injector column(s) detector(s) data acquisition
Temperature control
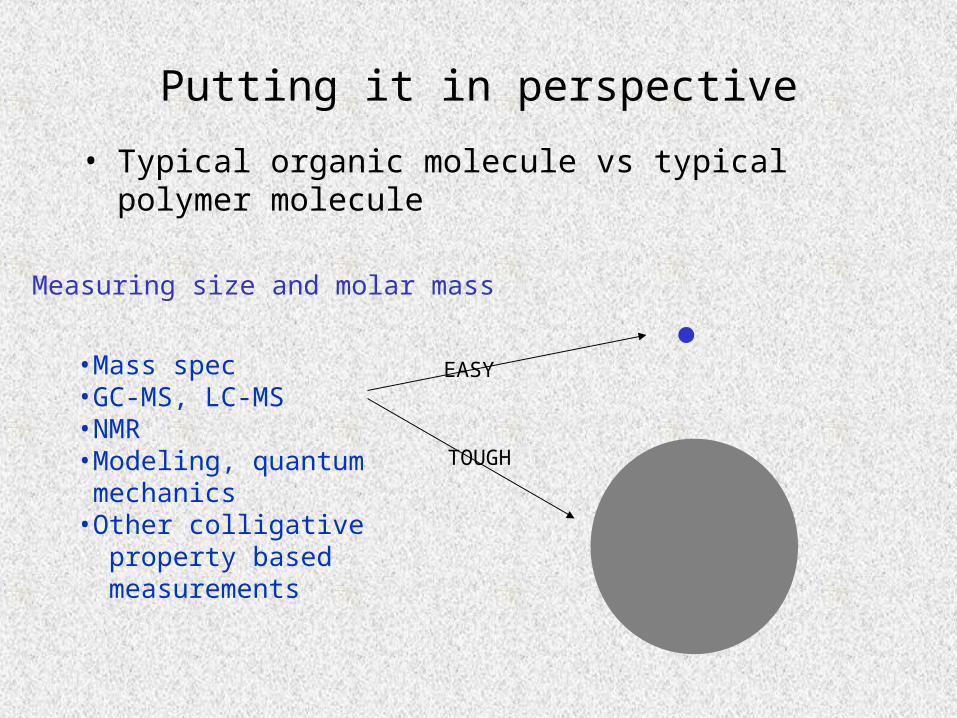
Putting it in perspective
• Typical organic molecule vs typical polymer molecule
•Mass spec•GC-MS, LC-MS•NMR•Modeling, quantum mechanics•Other colligative property based measurements
EASY
TOUGH
Measuring size and molar mass
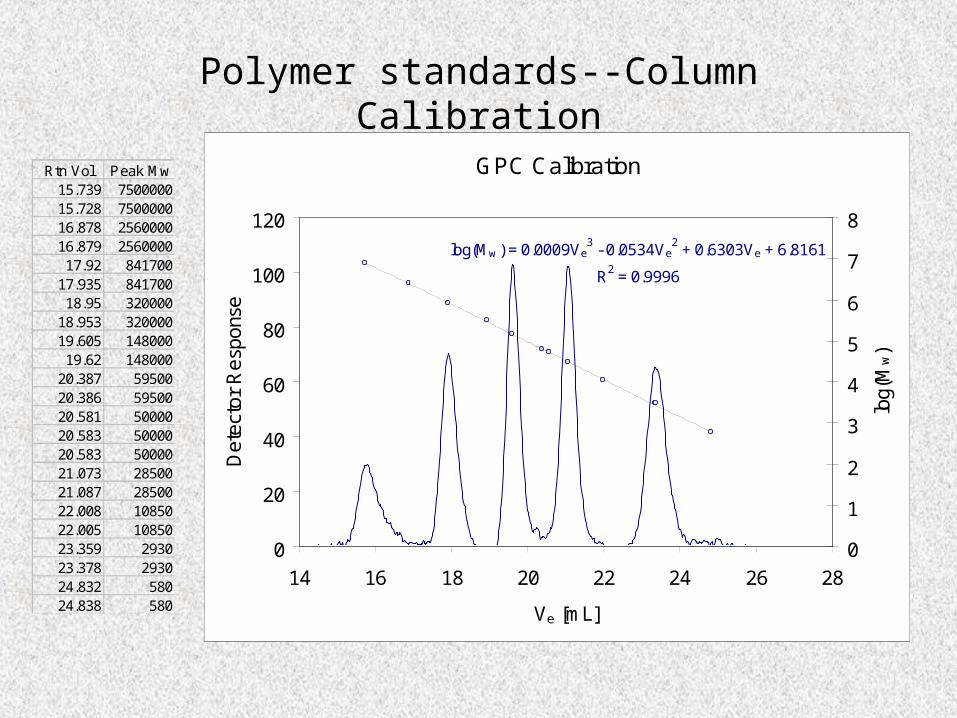
Polymer standards--Column Calibration
Rtn Vol Peak Mw15.739 750000015.728 750000016.878 256000016.879 256000017.92 841700
17.935 84170018.95 320000
18.953 32000019.605 14800019.62 148000
20.387 5950020.386 5950020.581 5000020.583 5000020.583 5000021.073 2850021.087 2850022.008 1085022.005 1085023.359 293023.378 293024.832 58024.838 580
GPC Calibration
log(Mw ) = 0.0009Ve3 - 0.0534Ve
2 + 0.6303Ve + 6.8161
R2 = 0.9996
0
20
40
60
80
100
120
14 16 18 20 22 24 26 28
Ve [mL]
Det
ecto
r R
espo
nse
0
1
2
3
4
5
6
7
8
log(
Mw)
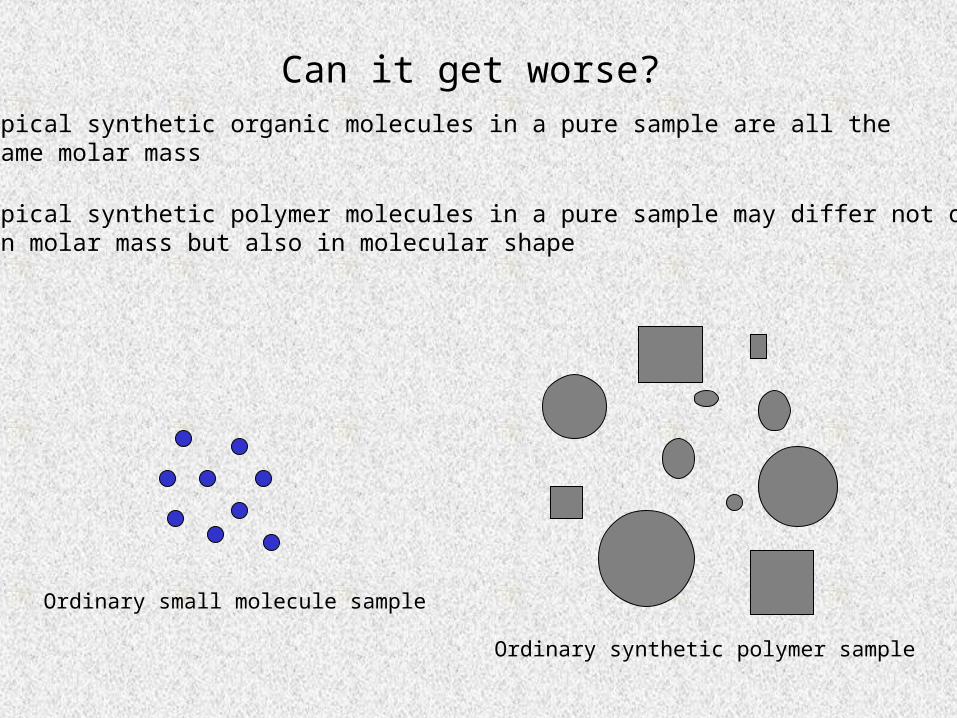
Can it get worse?•Typical synthetic organic molecules in a pure sample are all the same molar mass
•Typical synthetic polymer molecules in a pure sample may differ not only in molar mass but also in molecular shape
Ordinary small molecule sample
Ordinary synthetic polymer sample
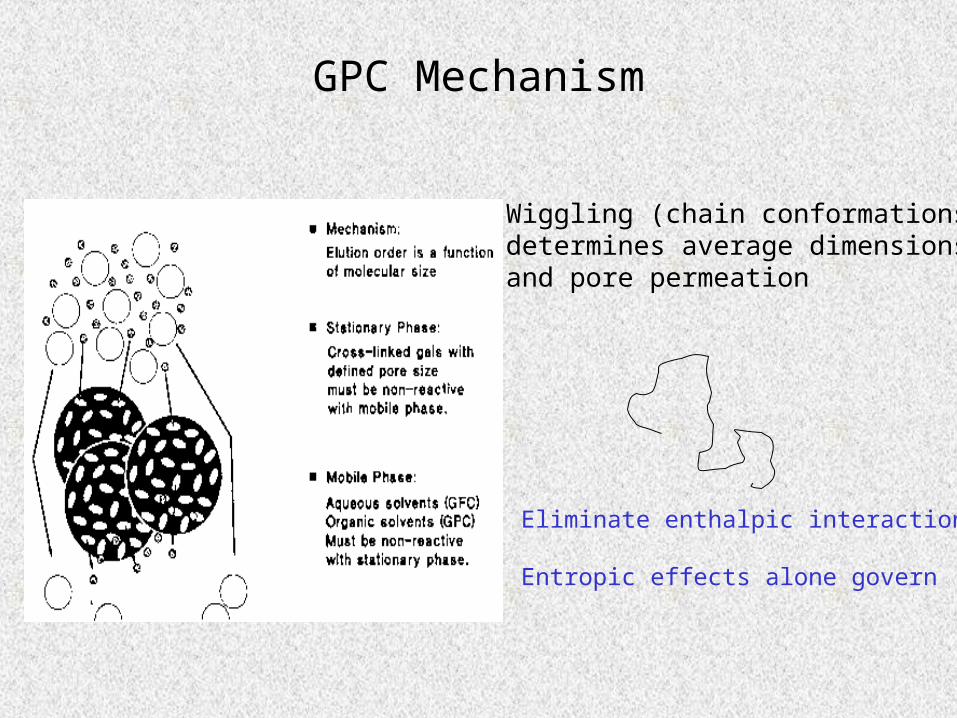
GPC Mechanism
Wiggling (chain conformations)determines average dimensionsand pore permeation
Eliminate enthalpic interactions
Entropic effects alone govern
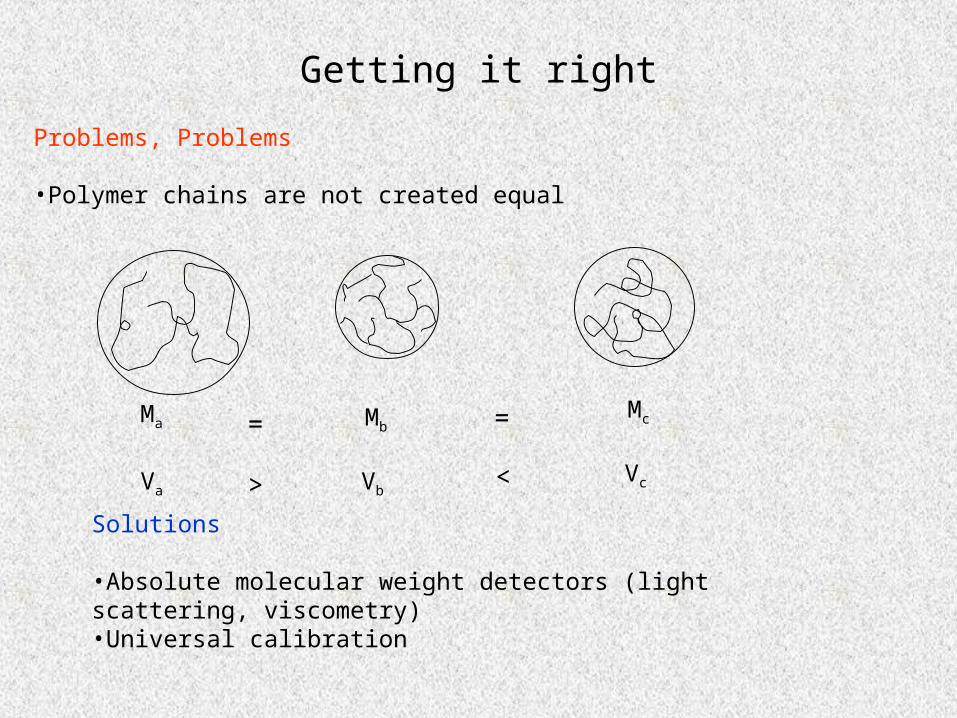
Getting it right
Problems, Problems
•Polymer chains are not created equal
Ma MbMc= =
Va VbVc<>
Solutions
•Absolute molecular weight detectors (light scattering, viscometry)•Universal calibration
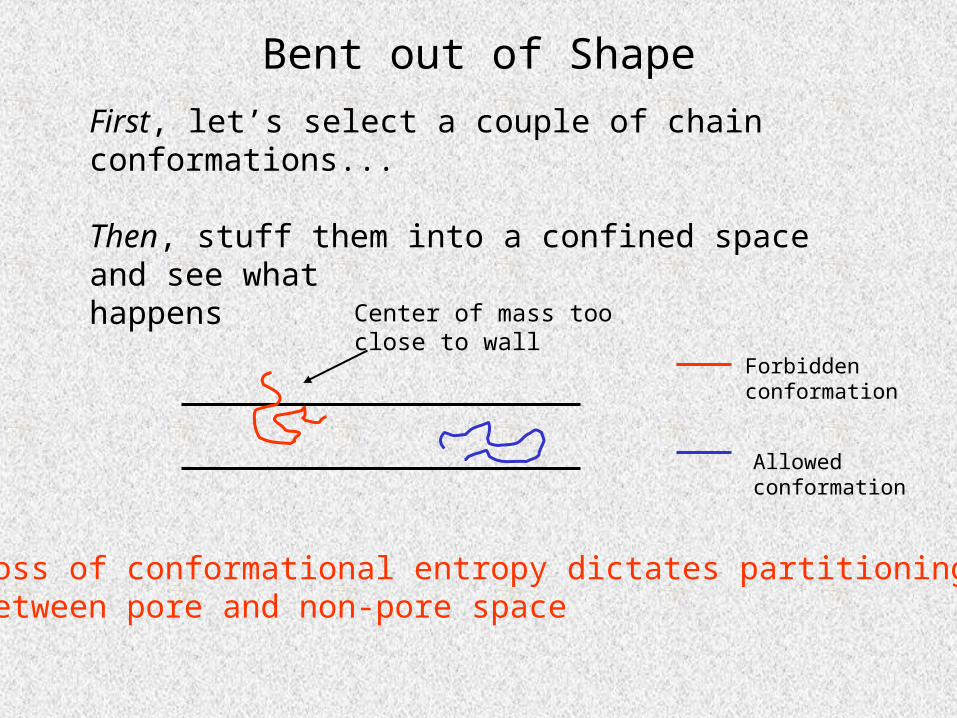
Bent out of Shape
First, let’s select a couple of chain conformations...
Then, stuff them into a confined space and see what happens
Forbiddenconformation
Allowedconformation
Loss of conformational entropy dictates partitioningbetween pore and non-pore space
Center of mass tooclose to wall
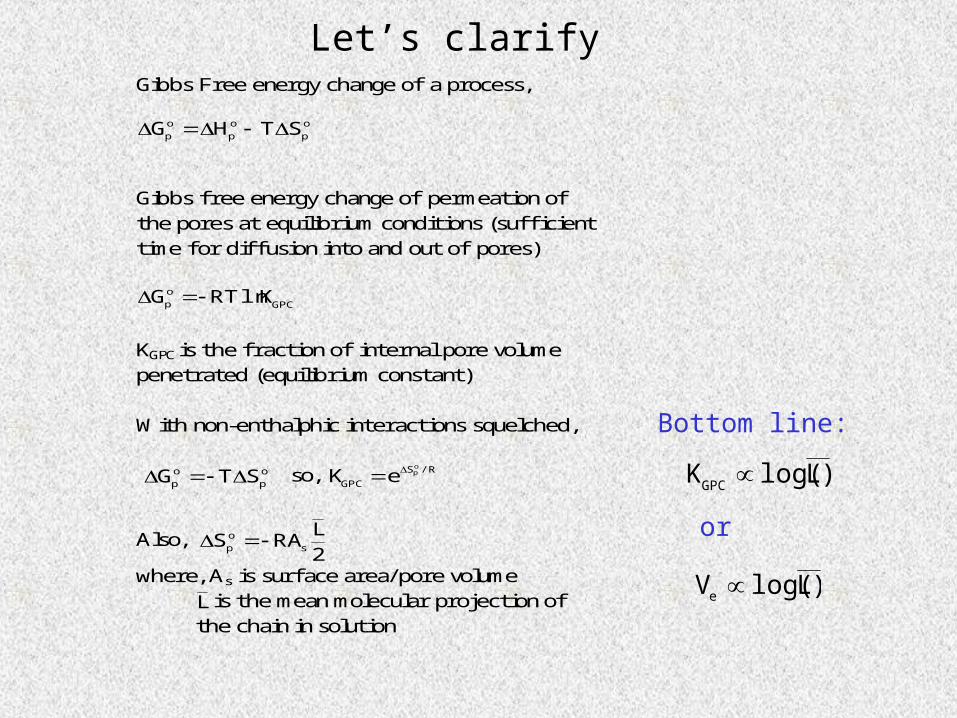
Let’s clarifyGibbs Free energy change of a process,
op
op
op STHG
Gibbs free energy change of permeation ofthe pores at equilibrium conditions (suffi cienttime for diff usion into and out of pores)
GPC
op KlnRTG
KGPC is the fraction of internal pore volumepenetrated (equilibrium constant)
With non-enthalphic interactions squelched,
op
op STG so, R/S
GPC
opeK
Also, 2L
RAS sop
where, As is surface area/pore volume
L is the mean molecular projection ofthe chain in solution
Bottom line:
)Llog(KGPC
)Llog(Ve
or
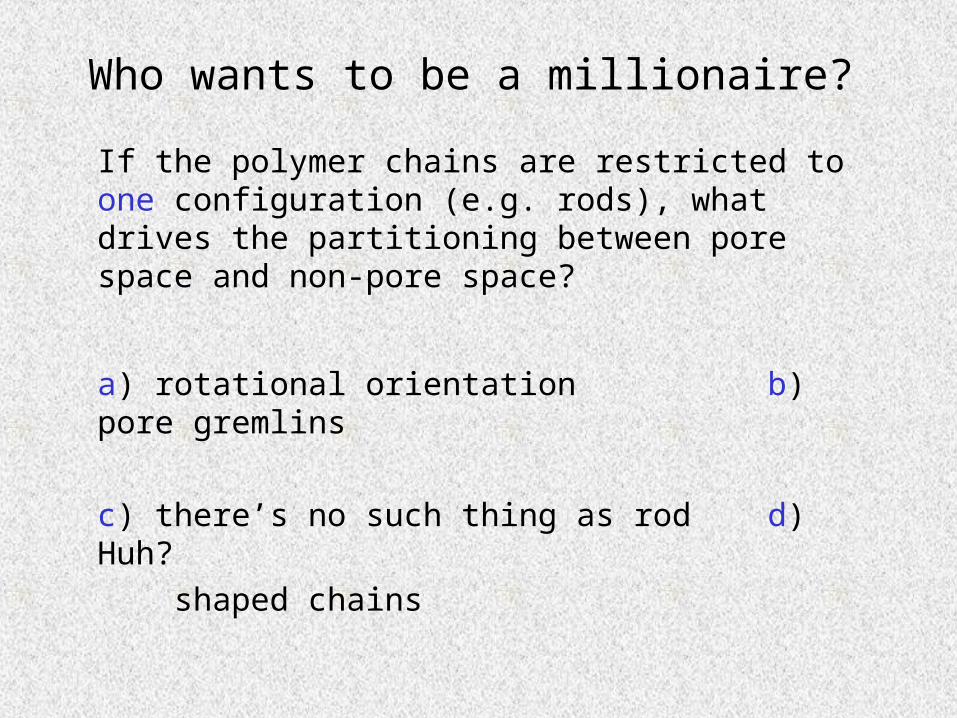
Who wants to be a millionaire?
If the polymer chains are restricted to one configuration (e.g. rods), what drives the partitioning between pore space and non-pore space?
a) rotational orientation b) pore gremlins
c) there’s no such thing as rod d) Huh? shaped chains
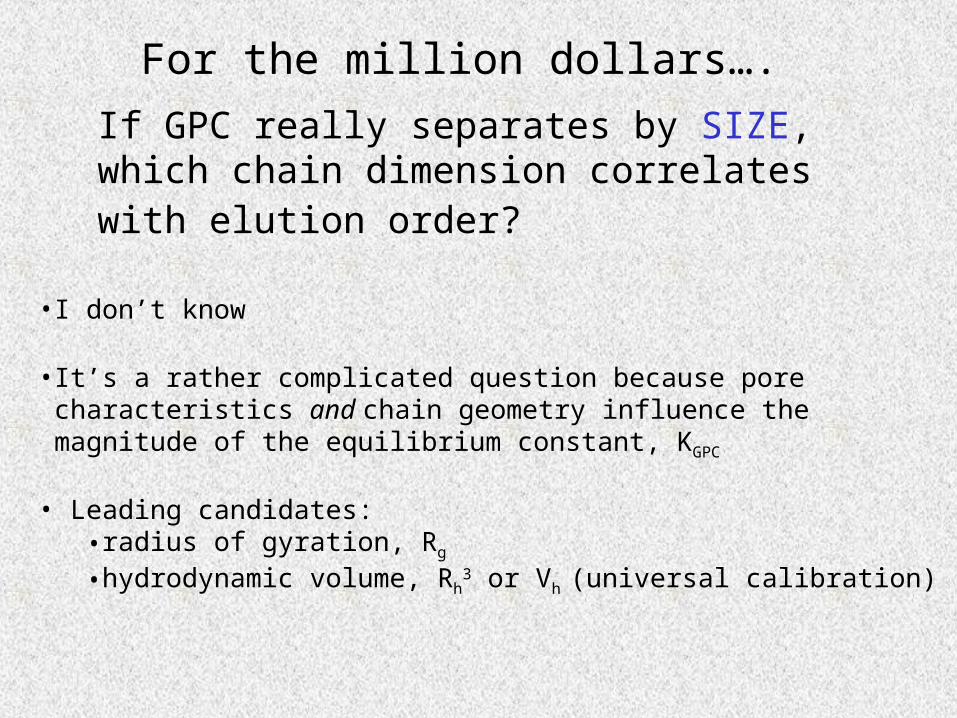
If GPC really separates by SIZE, which chain dimension correlates with elution order?
•I don’t know
•It’s a rather complicated question because pore characteristics and chain geometry influence the magnitude of the equilibrium constant, KGPC
• Leading candidates: •radius of gyration, Rg
•hydrodynamic volume, Rh3 or Vh (universal calibration)
For the million dollars….
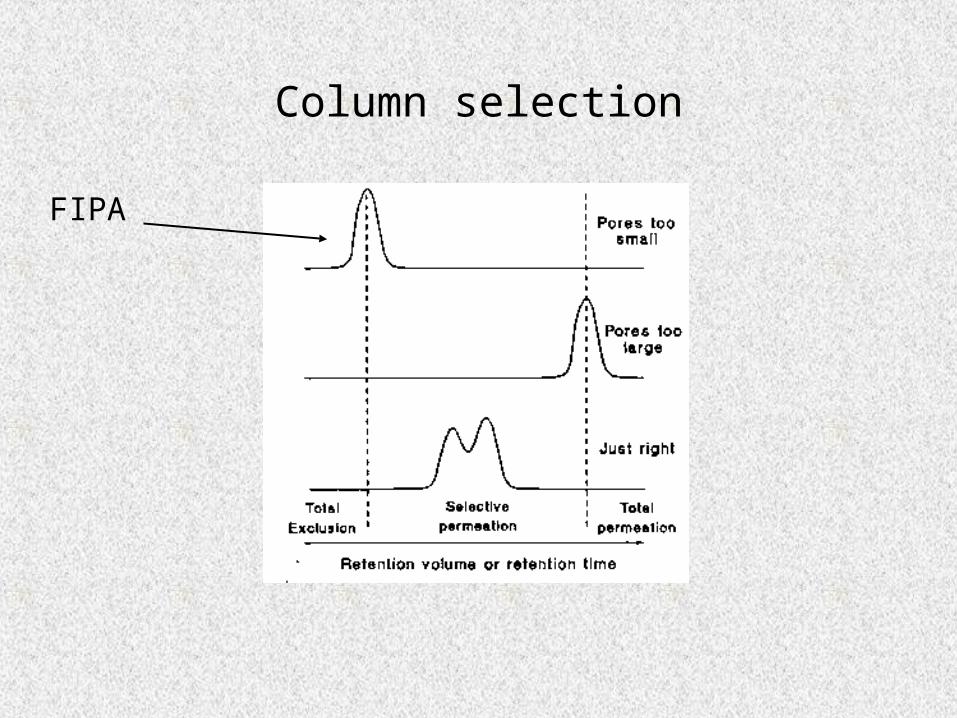
Column selection
FIPA
Making sense of the chromatogram
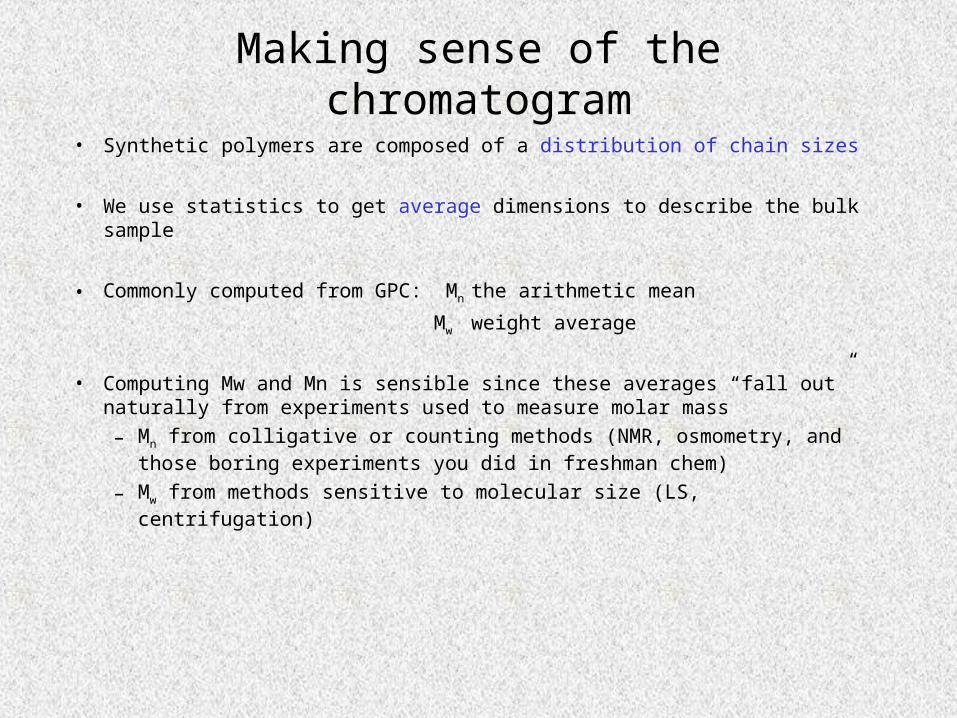
• Synthetic polymers are composed of a distribution of chain sizes
• We use statistics to get average dimensions to describe the bulk sample
• Commonly computed from GPC: Mn the arithmetic mean
Mw weight average
• Computing Mw and Mn is sensible since these averages “fall out” naturally from experiments used to measure molar mass
– Mn from colligative or counting methods (NMR, osmometry, and those boring experiments you did in freshman chem)
– Mw from methods sensitive to molecular size (LS, centrifugation)
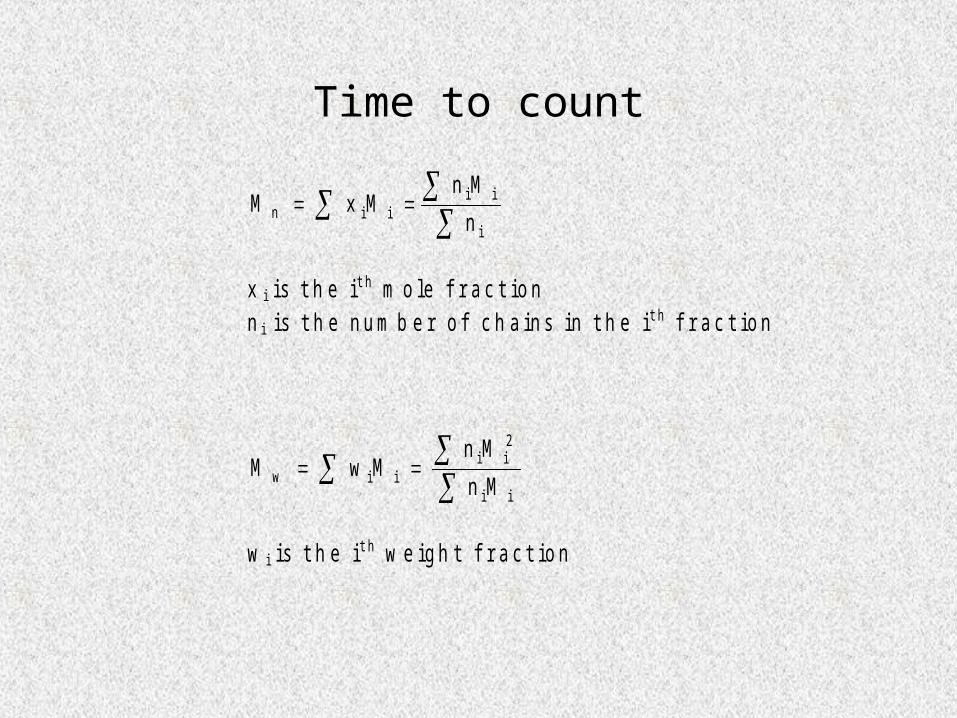
Time to count
i
iiiin n
MnMxM
x i i s t h e i t h m o l e f r a c t i o nn i i s t h e n u m b e r o f c h a i n s i n t h e i t h f r a c t i o n
ii
2ii
iiw Mn
MnMwM
w i i s t h e i t h w e i g h t f r a c t i o n
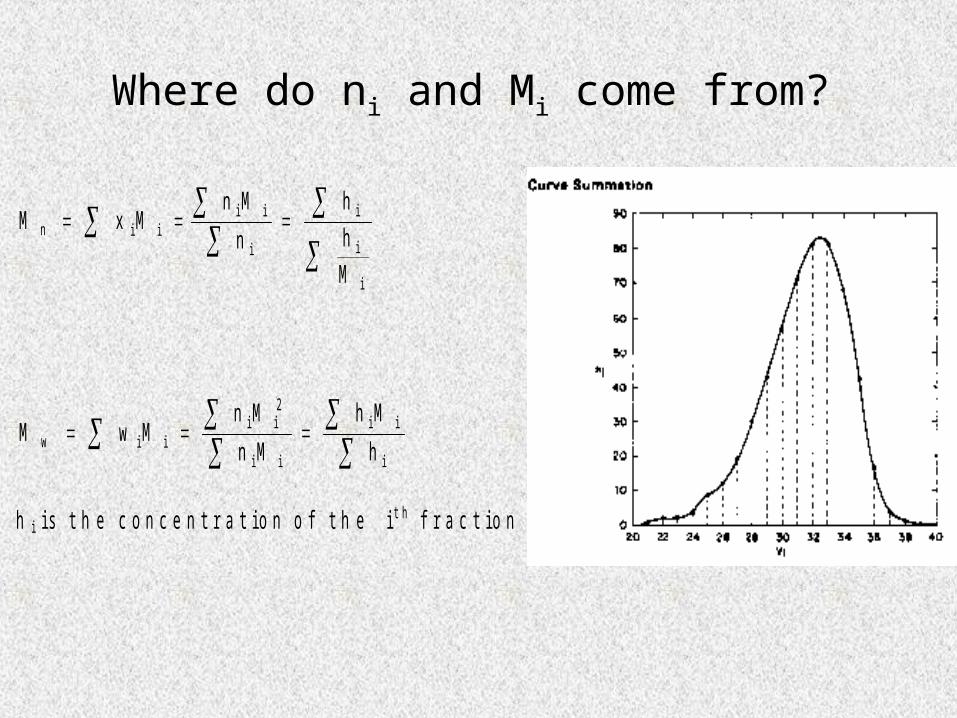
Where do ni and Mi come from?
i
i
i
i
iiiin
M
h
h
n
MnMxM
i
ii
ii
2ii
iiw h
Mh
Mn
MnMwM
h i i s t h e c o n c e n t r a t i o n o f t h e i t h f r a c t i o n
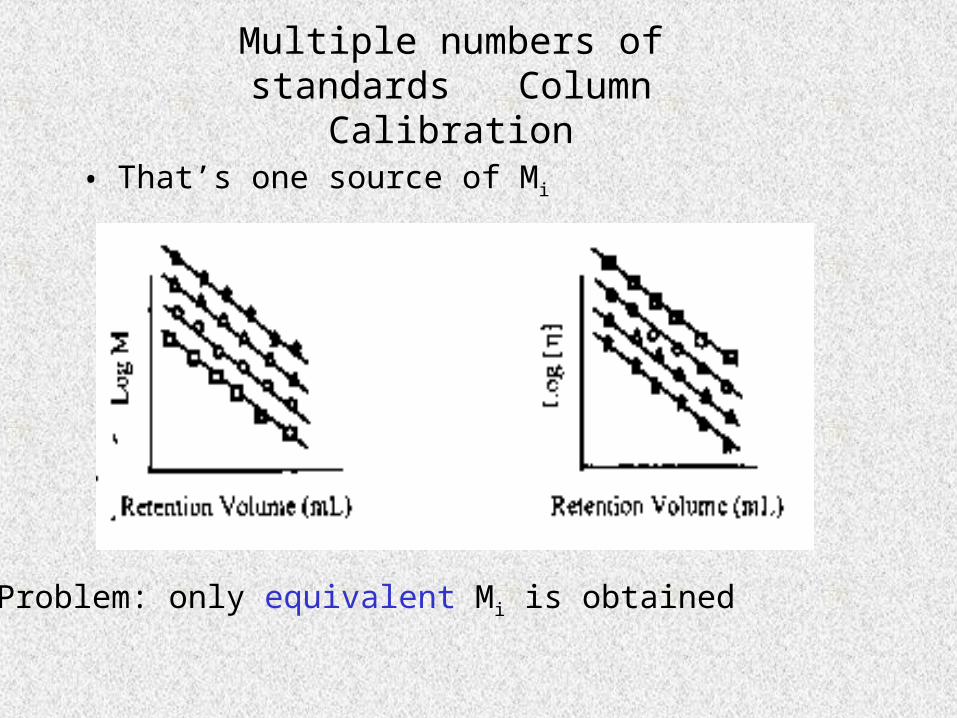
Multiple numbers of standards Column Calibration
• That’s one source of Mi
Problem: only equivalent Mi is obtained
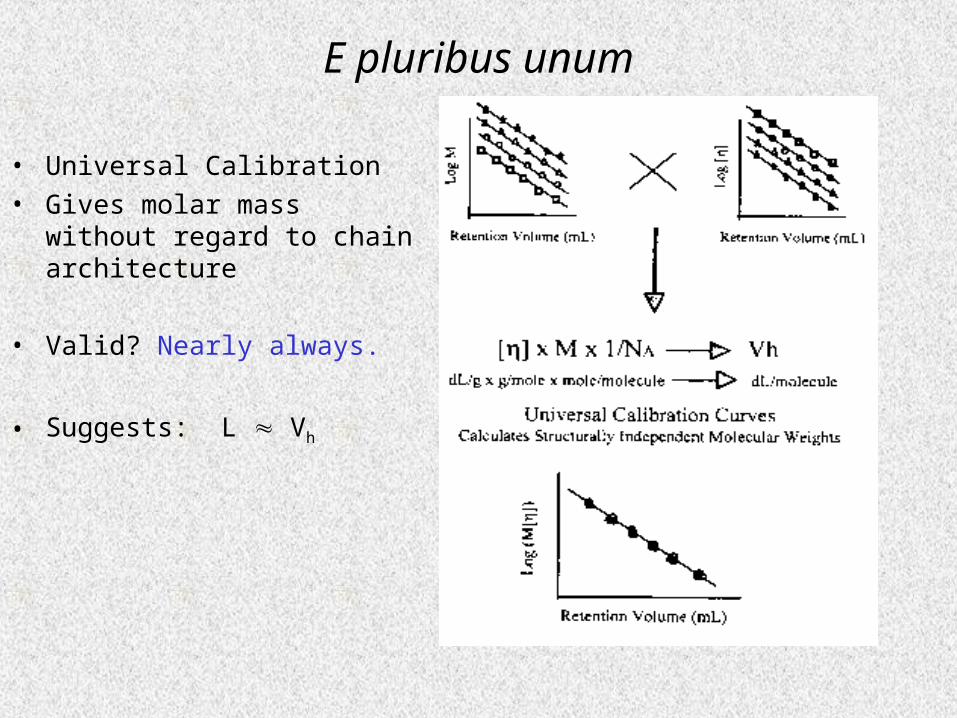
E pluribus unum
• Universal Calibration• Gives molar mass without
regard to chain architecture
• Valid? Nearly always.
• Suggests: L Vh
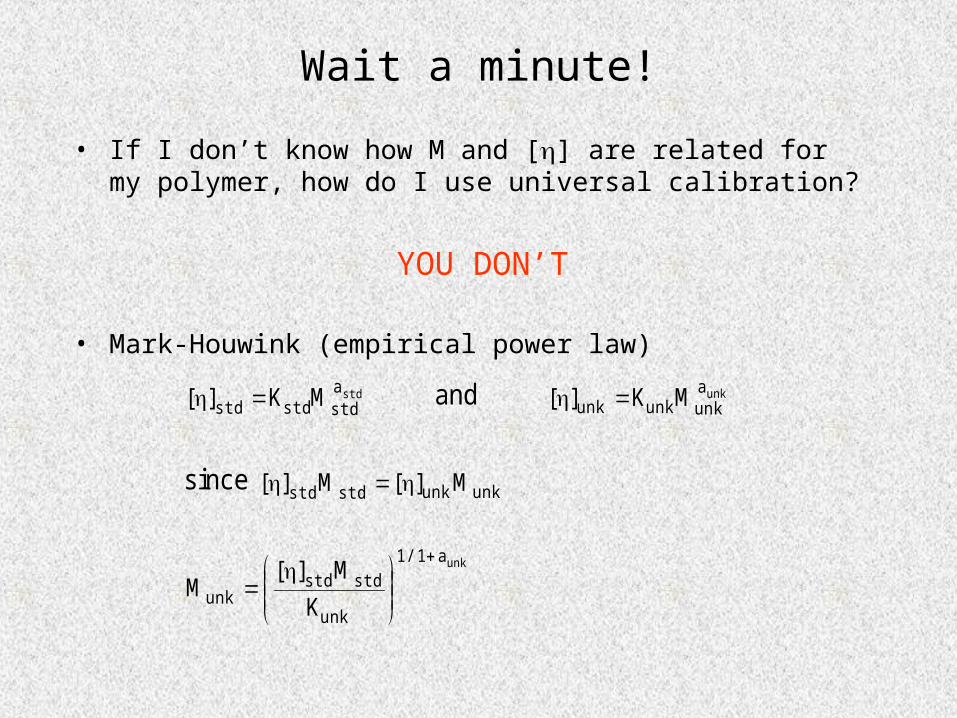
Wait a minute!
• If I don’t know how M and [] are related for my polymer, how do I use universal calibration?
YOU DON’T
• Mark-Houwink (empirical power law)
stdastdstdstd MK][ and unka
unkunkunk MK][
since unkunkstdstd M][M][
unka1/1
unk
stdstdunk K
M][M
“…too much dancing and not nearly enough prancing...”
C. Montgomery Burns, commenting on GPC prior to molar mass sensitive detectors
• Visible light scattering used for polymer characterization has been around almost as
long as chemists have believed in polymers
• However, GPC detectors based upon the technique are relatively new (1970s)
• Light scattering, by its nature, returns the weight average molar mass
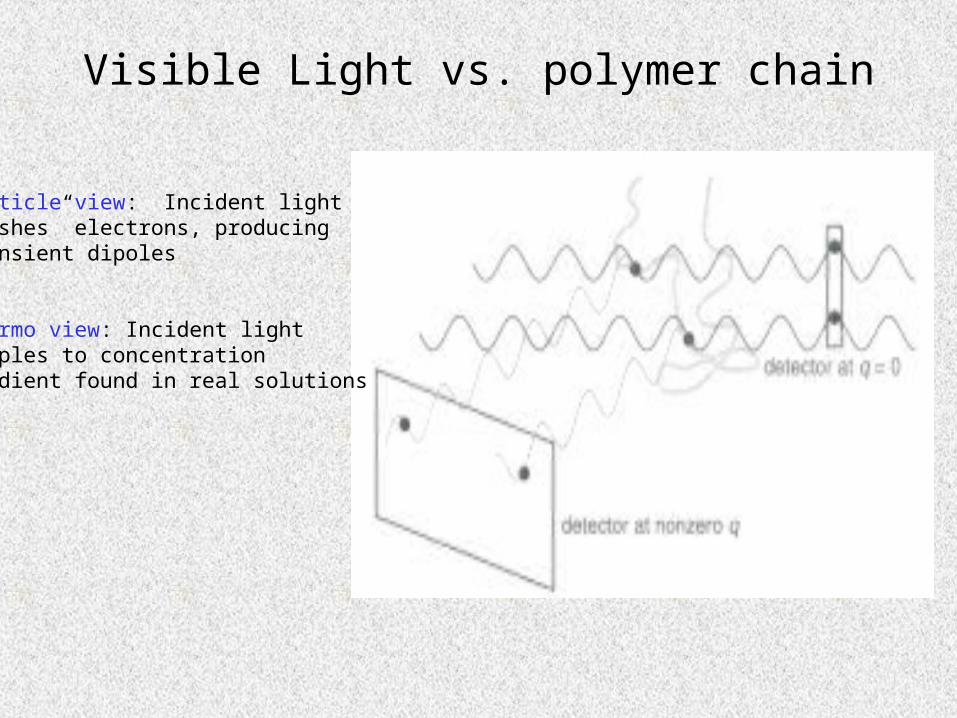
Visible Light vs. polymer chain
Particle view: Incident light“pushes” electrons, producingtransient dipoles
Thermo view: Incident lightcouples to concentrationgradient found in real solutions
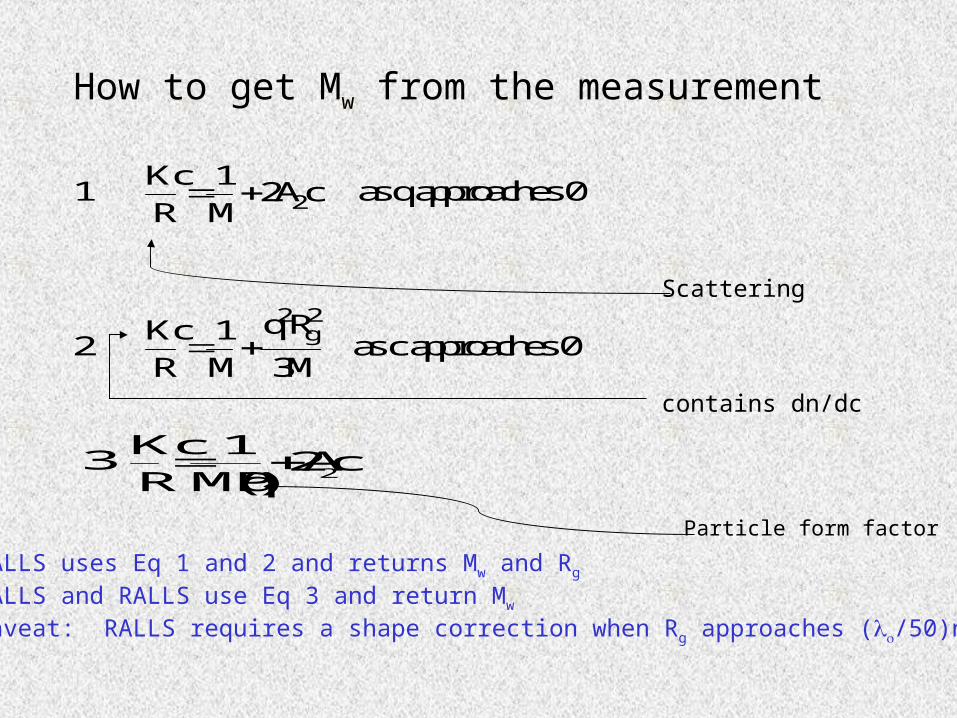
How to get Mw from the measurement
1 cA2M1
RKc
2 as q approaches 0
2M3
Rq
M1
RKc
2g
2
as c approaches 0
MALLS uses Eq 1 and 2 and returns Mw and Rg
LALLS and RALLS use Eq 3 and return Mw
caveat: RALLS requires a shape correction when Rg approaches (/50)n
Scattering
contains dn/dc
Particle form factor
3 cA2)q(MP
1RKc
2
How LS returns other molar mass averages
• Simple assumption….monodisperse fractions
from the GPC columns. Therefore,
Mw,i = Mi
• This assumption may lead to an over-estimation of Mn
“I’m going to describe the apparatus first before I set it motion. Then you’ll be able to follow the proceedings better.”
Franz Kafka
• Advantages– MALLS gives molecular architecture information
without assumptions IF there is a measurable angular dependence on the scattered light intensity
– RALLS is more forgiving of dusty samples and returns essentially the same information as
LALLS IF the polymer is small compared to
– LALLS is more sensitive, requires no correction over a huge range of molar mass
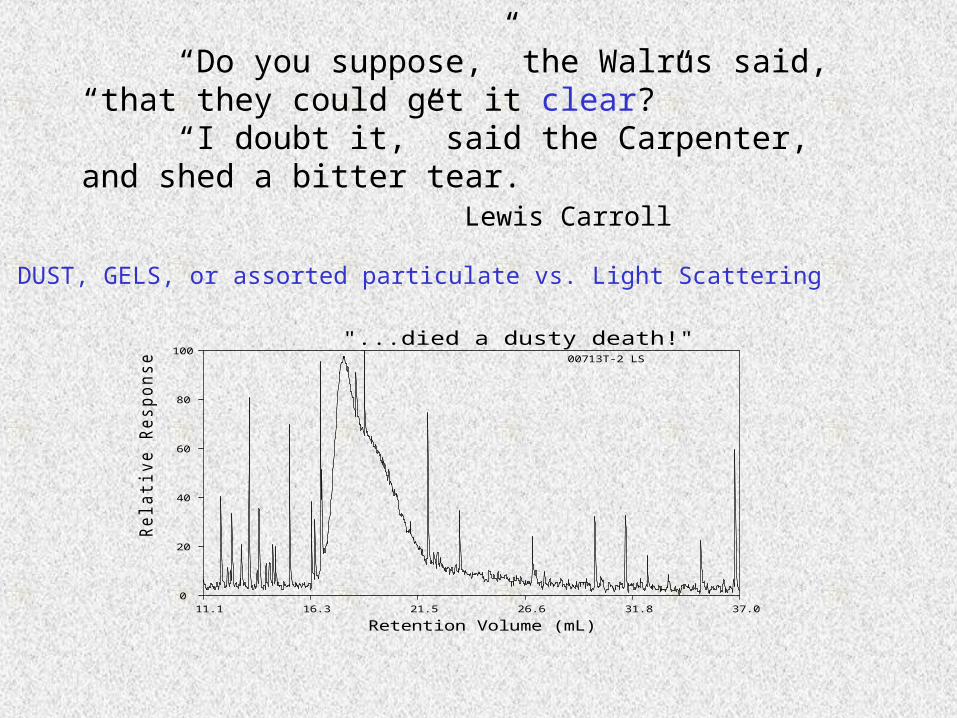
“Do you suppose,” the Walrus said, “that they could get it clear?”
“I doubt it,” said the Carpenter, and shed a bitter tear. Lewis Carroll
DUST, GELS, or assorted particulate vs. Light Scattering
"...died a dusty death!"00713T-2 LS
11.1 16.3 21.5 26.6 31.8 37.0 0
20
40
60
80
100
Retention Volume (mL)
Rela
tiv
e R
esp
on
se
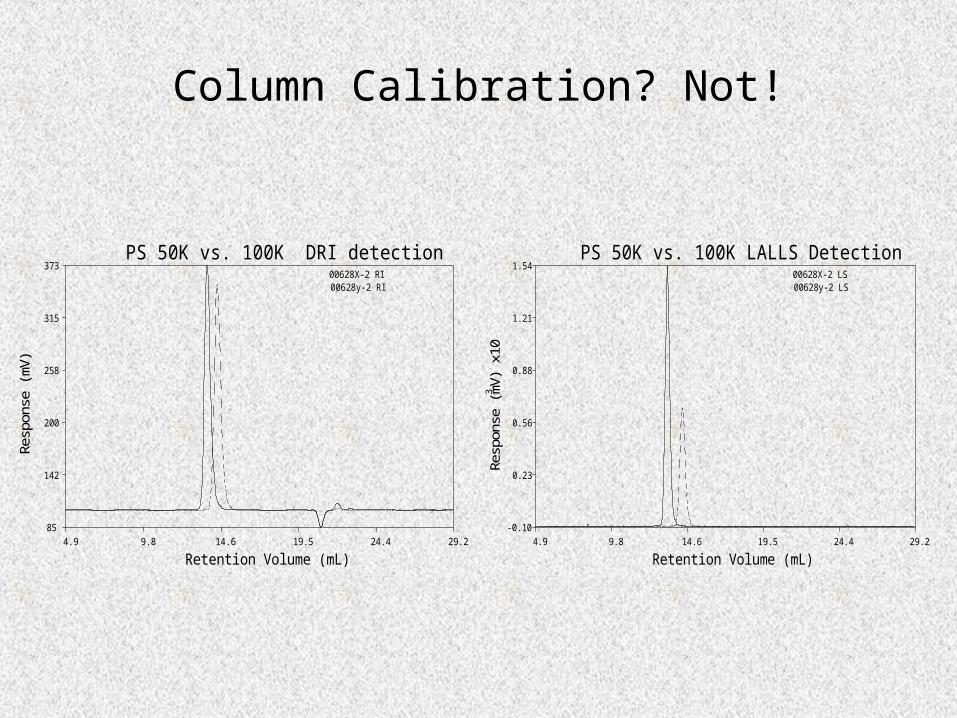
Column Calibration? Not!
PS 50K vs. 100K DRI detection00628X-2 RI00628y-2 RI
4.9 9.8 14.6 19.5 24.4 29.2 85
142
200
258
315
373
Retention Volume (mL)
Res
pons
e (m
V)
PS 50K vs. 100K LALLS Detection00628X-2 LS00628y-2 LS
4.9 9.8 14.6 19.5 24.4 29.2-0.10
0.23
0.56
0.88
1.21
1.54
Retention Volume (mL)
3R
espo
nse
(mV
) x10
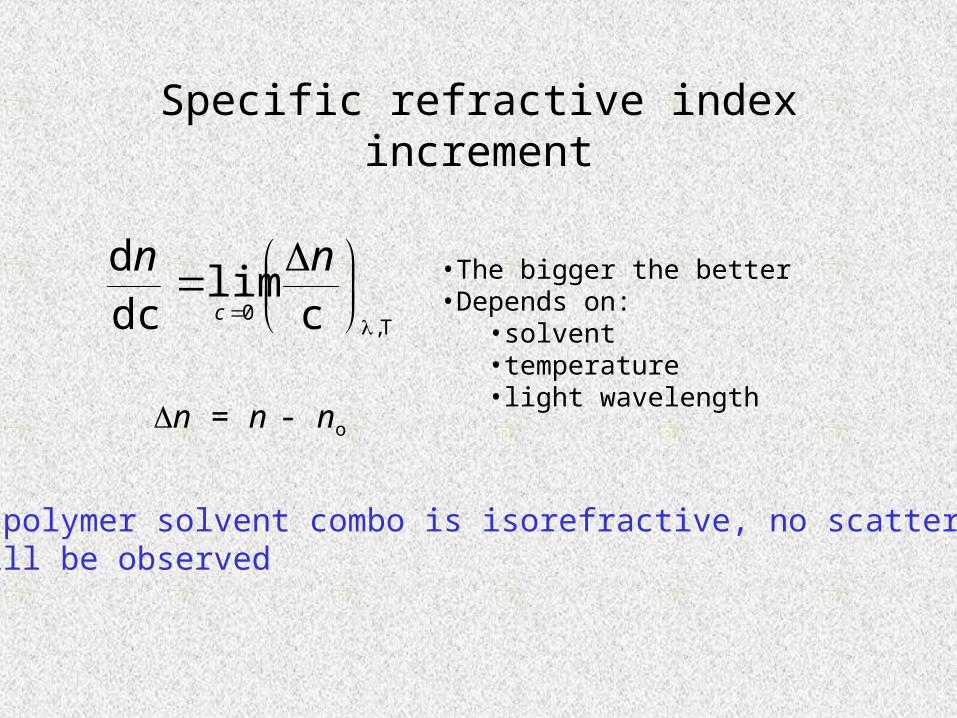
Specific refractive index increment
T,0 c
limdcd
nn
c
If polymer solvent combo is isorefractive, no scattering will be observed
•The bigger the better•Depends on:
•solvent•temperature•light wavelength
n = n - no
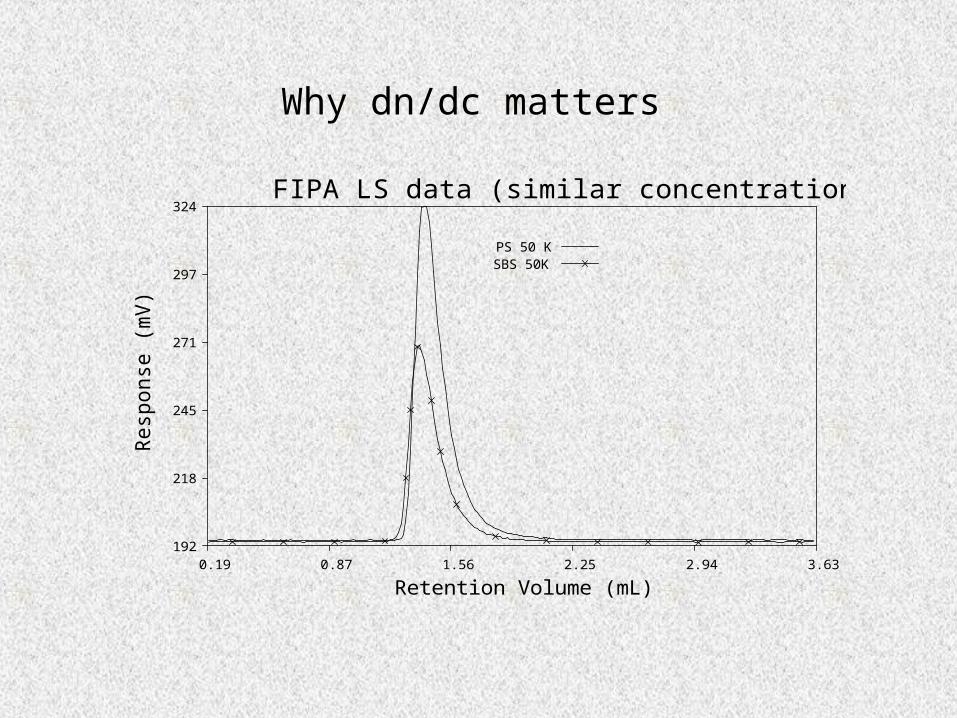
Why dn/dc matters
FIPA LS data (similar concentration)
PS 50 KSBS 50K
0.19 0.87 1.56 2.25 2.94 3.63 192
218
245
271
297
324
Retention Volume (mL)
Res
pons
e (m
V)
The plot thickens-Viscosity
• Viscometers as GPC detectors are based upon the measurement of a differential pressure between pure solvent and polymer solution
sp
How to get []i
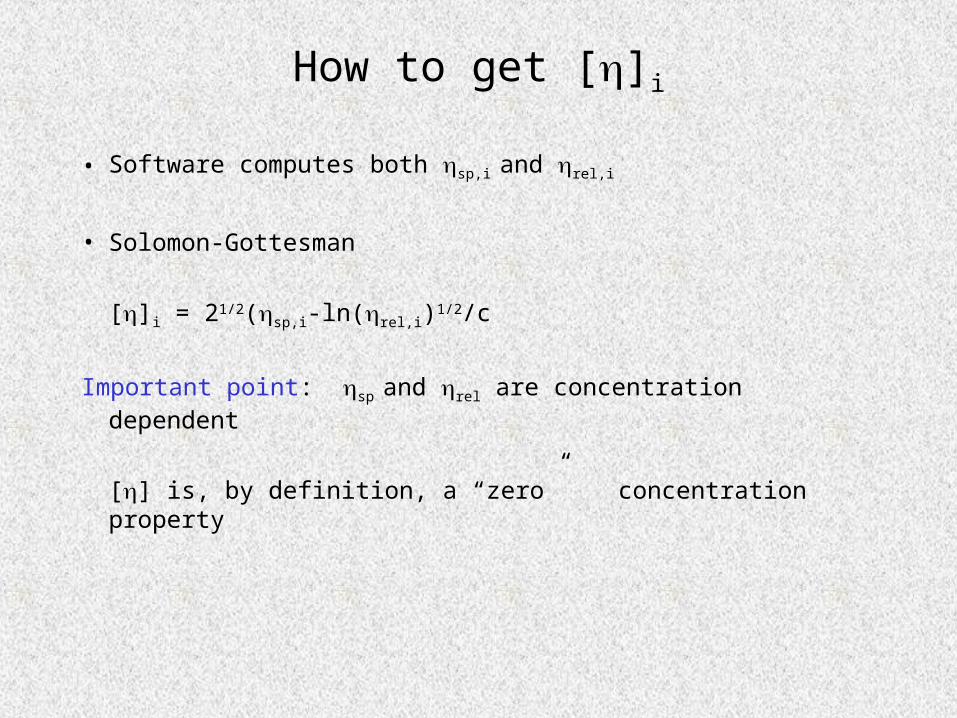
• Software computes both sp,i and rel,i
• Solomon-Gottesman
[]i = 21/2(sp,i-ln(rel,i)1/2/c
Important point: sp and rel are concentration dependent
[] is, by definition, a “zero” concentration property
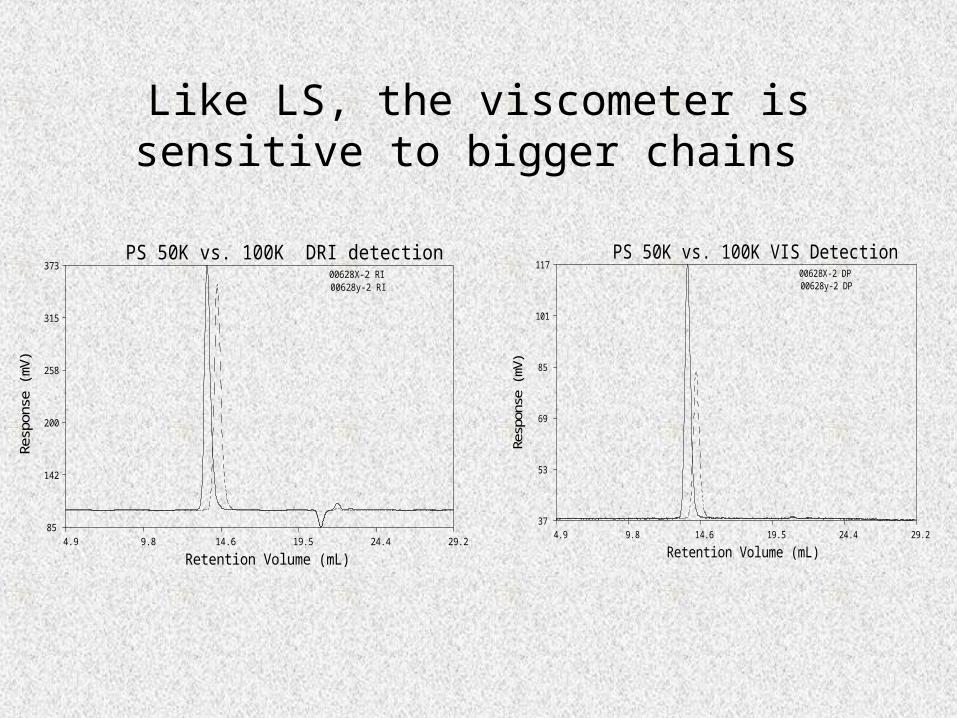
Like LS, the viscometer is sensitive to bigger chains
PS 50K vs. 100K VIS Detection00628X-2 DP00628y-2 DP
4.9 9.8 14.6 19.5 24.4 29.2 37
53
69
85
101
117
Retention Volume (mL)
Resp
onse
(mV
)
PS 50K vs. 100K DRI detection00628X-2 RI00628y-2 RI
4.9 9.8 14.6 19.5 24.4 29.2 85
142
200
258
315
373
Retention Volume (mL)
Res
pons
e (m
V)
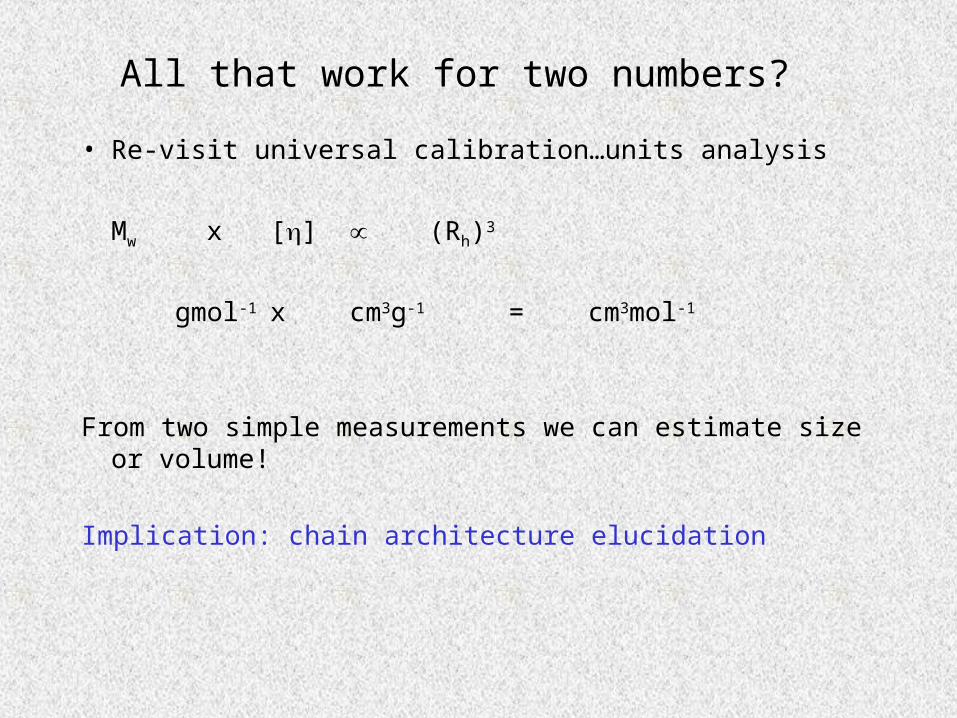
All that work for two numbers?
• Re-visit universal calibration…units analysis
Mw x [] (Rh)3
gmol-1 x cm3g-1 = cm3mol-1
From two simple measurements we can estimate size or volume!
Implication: chain architecture elucidation
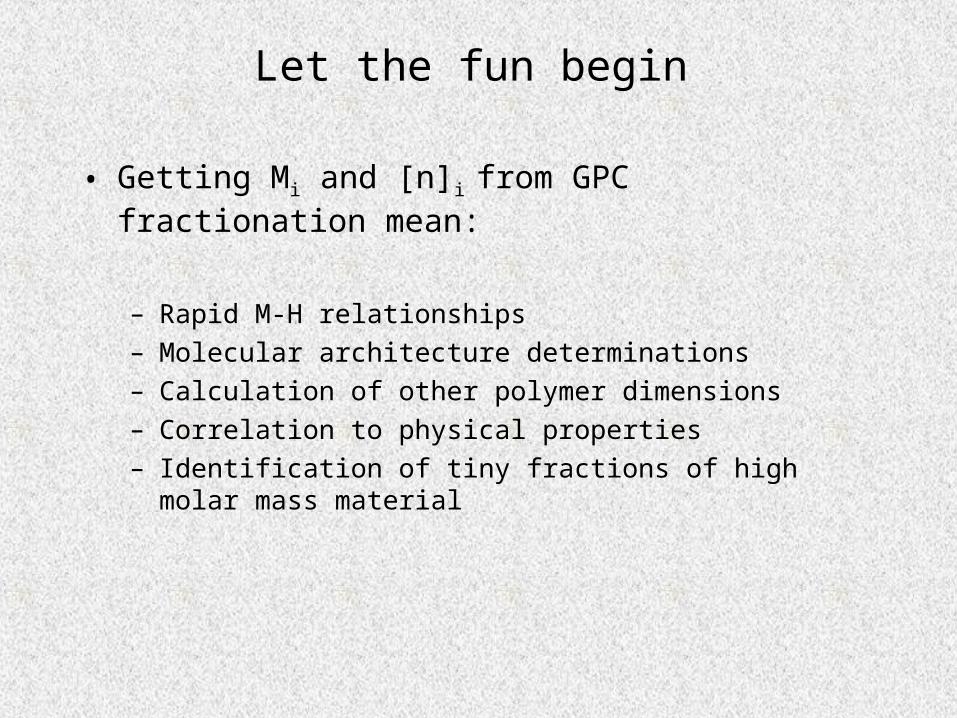
Let the fun begin
• Getting Mi and [n]i from GPC fractionation mean:
– Rapid M-H relationships– Molecular architecture determinations– Calculation of other polymer dimensions– Correlation to physical properties– Identification of tiny fractions of high molar mass
material
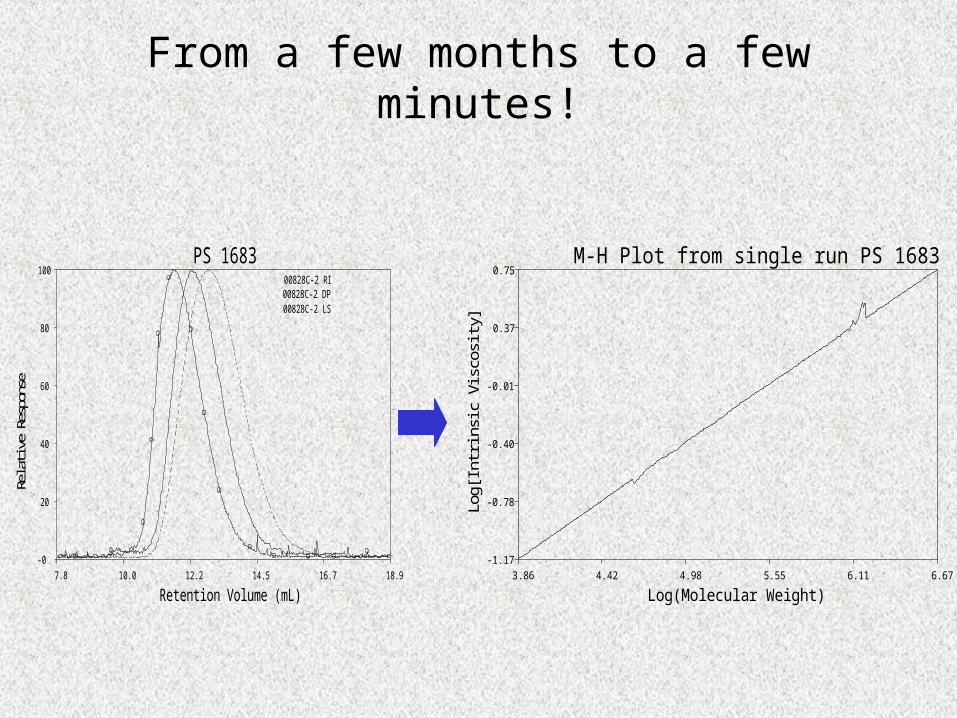
From a few months to a few minutes!
PS 168300828C-2 RI00828C-2 DP00828C-2 LS
7.8 10.0 12.2 14.5 16.7 18.9-0
20
40
60
80
100
Retention Volume (mL)
Relat
ive R
espo
nse
M-H Plot from single run PS 1683
3.86 4.42 4.98 5.55 6.11 6.67-1.17
-0.78
-0.40
-0.01
0.37
0.75
Log(Molecular Weight)
Log[
Intri
nsic
Vis
cosi
ty]
Behold the Power of M-H[] = KMa
• a parameter: approaching 0 ; spheres0.5 ;theta condition for linear chains0.7-0.8 ; expanded coils1.8 ; ideally rigid rod
a may or may not change with branching
• K parameter: shifts with comonomer composition or branching density

What happens when branches are present
Star branched
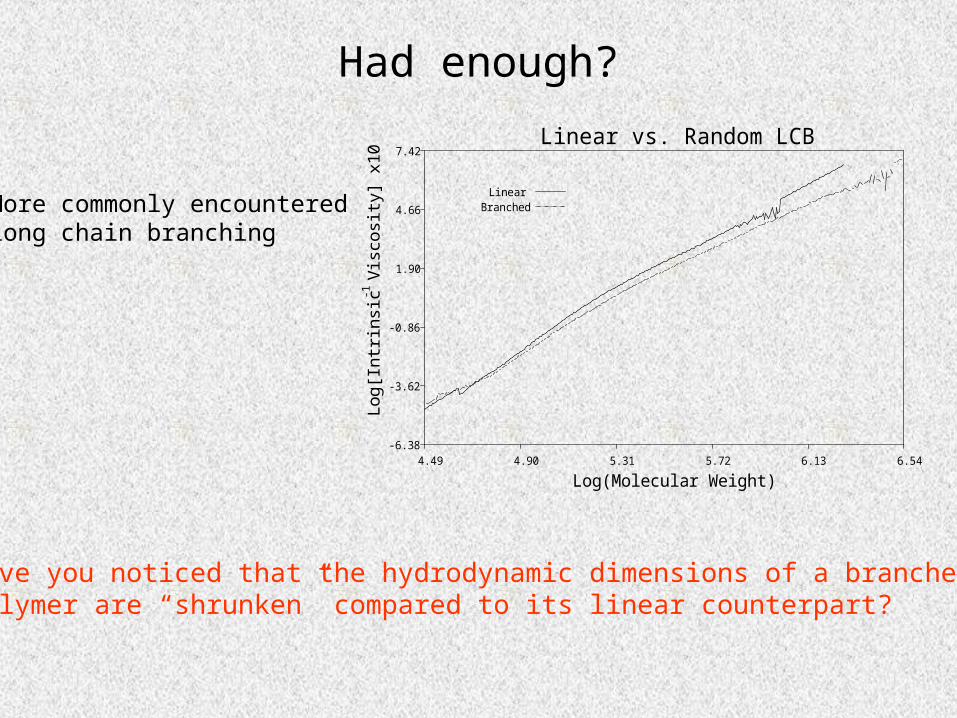
Had enough?
Linear vs. Random LCB
LinearBranched
4.49 4.90 5.31 5.72 6.13 6.54-6.38
-3.62
-0.86
1.90
4.66
7.42
Log(Molecular Weight)
-1L
og[I
ntri
nsic
Vis
cosi
ty]
x10
More commonly encounteredlong chain branching
Have you noticed that the hydrodynamic dimensions of a branchedpolymer are “shrunken” compared to its linear counterpart?
Branching? YIKES!
• Triple detection GPC measurements (LS,VIS, DRI)
• Determine []-Mw relationship (M-H values)
• Compare []-Mw relationship to that of a linear sample
• Apply appropriate branching model to calculate branching density Possibilities: star, off-center star, comb, random long
chain branching, H, super-H, Pom-Pom
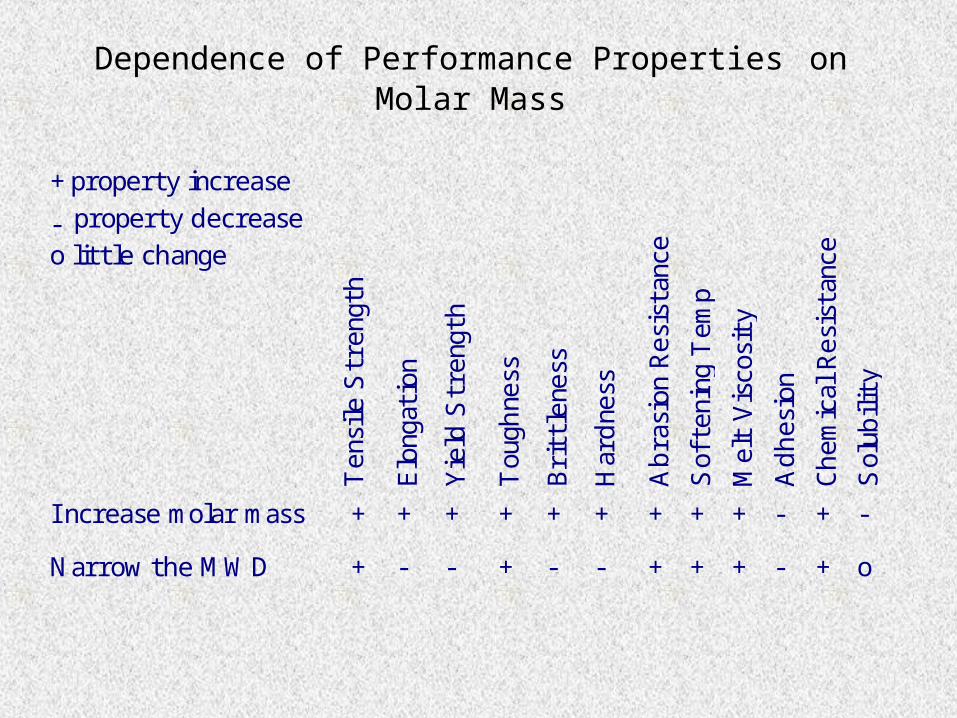
Dependence of Performance Properties on Molar Mass
+ property increase
- property decreaseo little change
Ten
sile
Str
engt
h
Elo
ngat
ion
Yie
ld S
tren
gth
Tou
ghne
ss
Bri
ttle
ness
Har
dne
ss
Abra
sion
Res
ista
nce
Sof
teni
ng T
emp
Mel
t V
isco
sity
Adhes
ion
Che
mic
al R
esis
tanc
e
Sol
ubili
ty
I ncrease molar mass + + + + + + + + + - + -
Narrow the MWD + - - + - - + + + - + o


![Agilent GPC Solutions · Agilent PL-GPC 220 Fully integrated, ... (Rg) Viscosity detector detector response proportional to the intrinsic viscosity [ ] of the polymer](https://static.fdocuments.in/doc/165x107/5b2ce86d7f8b9abb6e8b868b/agilent-gpc-solutions-agilent-pl-gpc-220-fully-integrated-rg-viscosity.jpg)