
Multi-Criteria Handwriting Quality Analysis with Online ...
31
HAL Id: hal-01515397 https://hal.archives-ouvertes.fr/hal-01515397 Submitted on 27 Apr 2017 HAL is a multi-disciplinary open access archive for the deposit and dissemination of sci- entific research documents, whether they are pub- lished or not. The documents may come from teaching and research institutions in France or abroad, or from public or private research centers. L’archive ouverte pluridisciplinaire HAL, est destinée au dépôt et à la diffusion de documents scientifiques de niveau recherche, publiés ou non, émanant des établissements d’enseignement et de recherche français ou étrangers, des laboratoires publics ou privés. Multi-Criteria Handwriting Quality Analysis with Online Fuzzy Models Damien Simonnet, Eric Anquetil, Manuel Bouillon To cite this version: Damien Simonnet, Eric Anquetil, Manuel Bouillon. Multi-Criteria Handwriting Quality Analysis with Online Fuzzy Models. Pattern Recognition, Elsevier, 2017, 69, pp.310-324. 10.1016/j.patcog.2017.04.003. hal-01515397
Transcript of Multi-Criteria Handwriting Quality Analysis with Online ...

HAL Id: hal-01515397https://hal.archives-ouvertes.fr/hal-01515397
Submitted on 27 Apr 2017
HAL is a multi-disciplinary open accessarchive for the deposit and dissemination of sci-entific research documents, whether they are pub-lished or not. The documents may come fromteaching and research institutions in France orabroad, or from public or private research centers.
L’archive ouverte pluridisciplinaire HAL, estdestinée au dépôt et à la diffusion de documentsscientifiques de niveau recherche, publiés ou non,émanant des établissements d’enseignement et derecherche français ou étrangers, des laboratoirespublics ou privés.
Multi-Criteria Handwriting Quality Analysis withOnline Fuzzy Models
Damien Simonnet, Eric Anquetil, Manuel Bouillon
To cite this version:Damien Simonnet, Eric Anquetil, Manuel Bouillon. Multi-Criteria Handwriting QualityAnalysis with Online Fuzzy Models. Pattern Recognition, Elsevier, 2017, 69, pp.310-324.�10.1016/j.patcog.2017.04.003�. �hal-01515397�

Multi-Criteria Handwriting Quality Analysis
with Online Fuzzy Models
Damien Simonnet, Eric Anquetil and Manuel Bouillon
INSA Rennes, UMR IRISA, Campus de Beaulieu, F-35042 Rennes, France
Abstract
IntuiScript is an innovative project aiming at the development of a digital work-book providing feedback during the handwriting learning process for childrenfrom three to seven years old. In this context, the paper presents a method toanalyse handwriting quality that responds to the expectations of the IntuiScripteducational scenario: on-line and real time feedback for children, an automaticdetection of children mistakes guiding the pedagogical progression, and a preciseanalysis of children writing saved to help teacher to understand children writingskills. The presented method introduces a multi-criteria architecture to analysehandwriting quality based on three different aspects: shape, order and direction.The validation of the proposed approach is done on a realistic dataset collectedin preschools and primary schools with 952 children. Results show a positivefeedback of children and teachers about the use of tactile digital devices, anda significant improvement of the performances of the multi-criteria architec-ture compared to the previous analyser. The ground truth has been annotatedby experts with different levels of confidence. Specific evaluation metrics areintroduced to deal with confidence annotations.
Keywords: Handwriting Analysis, Pen-Based Interaction, Educational System
1. Introduction
Jolly et al. [1] have presented a comparative study about the acquisitionof the training handwriting between digital devices and paper. Results showa significant improvement of children trained on the digital device comparedto children trained on paper, notably in terms of fluency (decreasing of the5
in-air time, and stopping time). In this context, this paper tackles the prob-lem of handwriting quality analysis. More precisely, this work takes place inan innovative project IntuiScript 1 founded by the French government to takeadvantages of the digital devices in primary schools. It aims at developing a
1http://intuiscript.com
Preprint submitted to Pattern Recognition April 27, 2017

digital workbook to help teachers and children from three to seven years old dur-10
ing the handwriting learning process. This work contributes to the IntuiScripteducational scenario with block letters on three main aspects:
• it allows children to work in autonomy with on-line and real time feedback;
• it proposes automatically pedagogical exercises that are adapted to chil-dren difficulties based on the automatic analysis of children writing;15
• it provides a precise off-line analysis of children writing (i.e. order, di-rection, shape) to help teachers to understand children writing skills anddifficulties.
(a) (b)
Figure 1: First in-class experiment (a) of the IntuiScript project with tablet tactile devices (b)about the analysis of week word letters.
(a) Word (b) Letter (c) Primitive
(d) (e) (f) (g)
Figure 2: Hierarchical methodology that enables children to be autonomous by first analysingletters of a word (a), and then working on letters (b) and primitives (c) if it is required.On-line feedback is given with a colour scale indicator drawn under each gesture with thefollowing colouring code: very good (green with yellow star) (d), good (green) (e), average(orange) (f) and incorrect (red) (g).
The main objective of the IntuiScript project is to offer an advanced digitalwriting experience at school by using tablet and tactile digital devices (with20
finger touch and stylus). The validation of the research project is based onexperiments performed in schools from half a day to a month with more than
2

thousand of French primary school students in Brittany. This paper presentsresults of the first experimentation conducted in 20 preschools with 952 chil-dren. During a two hours session, groups of seven/eight children as illustrated25
in Figure 1 and Figure 2 were drawing the block letters of the day of the weekand having automatic feedback with a colour scale indicator reflecting the cor-rectness of written letters.
The analyse of the handwriting quality is related to legibility (shape) andductus (order, direction) aspects. During the early learning stage of the writing,30
it is very important to have strong constraints on the ductus to acquire a correcthandwriting coordination. However, during their handwriting learning process,children acquire their own handwriting style in which there are tolerances forductus constraints, and the legibility becomes the main aspect evaluated. Thelegibility score decreases continuously with the deformation of a symbol. On the35
opposite, scores related to the ductus correspond to a binary decision, whereeducational experts do not always agree on a single writing convention, butthink that children must have rules defining uniquely how to write correctlya symbol. That is why the French Ministry of Education defines documentsthat describe a writing convention which is a recommendation for teacher as40
illustrated in Figure 3. In this case, the gesture correctness is related to thenotion of elementary strokes (e.g. horizontal/vertical/slanted line, half-circle)where a correct order and direction correspond respectively to a correct sequenceand direction of each elementary stroke. Therefore, the system presented in thepaper allows to return an adapted feedback corresponding to children skills and45
balanced between legibility and ductus aspects.In this paper, three main criteria are used to analyse the handwriting quality:
shape, order and direction. Similarly to [2, 3, 4, 5], the proposed approach eval-uates the handwriting quality with regards to reference models using intra-classand inter-class scores (i.e. the similarity to the analysed model and the differ-50
ence to other models, see Figure 4). Compared to the previous approach [5],specialised features and classifiers are introduced for each criterion.
This work presents a multi-criteria approach that analyses shape, order anddirection aspects of children handwriting. It is also seen as an extension of [5]that analyses symbols with an evolving fuzzy inference system [6] and HBF49 [7]55
features. More precisely, this paper contains five main contributions by intro-ducing:
• a multi-criteria approach combining specialised classifiers (shape, orderand direction) about legibility and ductus, with hierarchical dependencies(e.g. order and direction depend on shape) dedicated to specific problems,60
see Section 4;
• a confidence score meaningful for teachers and children depending on twoaspects: the distance to the theoretical model and the confusion with othermodels, see Section 4;
• a methodology to check the order correctness based on the identification65
3

Figure 3: Recommendation of the French Ministry of Education relatively to the ductus ofblock letters (extracted from the document entitled ‘Modeles d’ecriture scolaire. Documentd’accompagnement. Police de caracteres cursives’ (June 2013)).
of elementary strokes represented in a model as median strokes (see Sec-tions 5.2.2 and 6.2.2);
• features to characterise finely shape and direction (fuzzy histogram ofdirection and orientation), see Sections 5.2.1 and 5.2.3;
• feedback of teachers and children about the introduction of tactile digital70
devices in the learning writing process. A database from in-class experi-ments has been created with a ground truth and made publicly availablefor comparison with future works on handwriting analysis.
The rest of the paper is organised as follows. First, related work is presentedin Section 2. The educational scenario associated to the IntuiScript project and75
an overview of the approach are detailed in Section 3 and 4. Analysis-basedfeatures and classifiers are respectively described in Section 5 and 6. Then,Section 7 presents experiments and results. Sections 8 and 9 conclude thispaper.
2. Related Work80
In the literature, handwriting quality is related to legibility and kinematic [8].The former corresponds to letter shape and its associated readiness. The latter
4

Figure 4: Analysis of an example U. The analysis approach is based on two complementaryaspects: intra-class (i.e. the similarity of the example with the analysed model: U ) and inter-class (i.e. the difference with other models indicating by a confusion degree of other classes,e.g. V ) scores.
concentrates on the writing process (e.g. order, direction, fluidity) that must beefficient, as writing is a fundamental skill that is necessary for learning and usingknowledge. More precisely, the writing process requires three central skills: a85
complete visual representation of each letter, a recognition of elementary strokesin letters, and the ability to reproduce a letter as a sequence of elementarystrokes respecting the direction [9].
There are two typical applications resulting from the handwriting analysis:medical and education systems. Guinet et al. [10] focus on the kinematic aspect90
(i.e. velocity, duration, fluency, pauses) to detect handwriting pathologies. Jollyet al. [11] analyse the handwriting velocity to identify developmental coordina-tion disorders. Accardo et al. [12] study handwriting kinematics of children ondigital tablets with a various number of features (e.g. number of strokes perletter, peak velocities, and pen lift duration) and show that the handwriting is95
related to four kinematic domains: velocity, spatial arrangement, automationand motor planning plan. Hu et al. [13] present an educational system thatidentifies three types of errors for Chinese characters: stroke production errors(i.e. stroke reversal, concatenation of separate strokes, broken strokes), strokesequence errors (i.e. wrong sequencing of components, wrong stroke sequences100
in a component) [14] and stroke relationship errors (e.g. relative length and po-sition) [15]. Falk et al. [3] use five primitives (legibility, form, alignment, sizeand space) to quantify handwriting proficiency of children. More generally, ap-proaches for medical systems such as [10, 11, 12] use mainly the kinematic aspectby opposition to educational systems [13, 3] that pay more attention to legibility105
features, and use simple kinematic features (e.g. velocity and acceleration).The legibility of the writing is often evaluated with low-level features related
to the letter recognition task that makes difficult to evaluate quantitatively thecorrectness of a criterion (e.g. shape in [4]). Therefore, specific confidence scores(e.g. a confidence based on a modified quadratic discriminant function [16]) are110
often used to assess quantitatively this correctness. Following this aspect, the
5

use of a reference model to compute confidence values is similar to applicationsrelated to the signature analysis [17, 18] where the aim is to evaluate if thehandwriting of the signature corresponds to its owner. This underlines an im-portant aspect of this paper which is the difference between recognition and115
analysis tasks. The recognition consists in identifying a symbol independentlyof its quality and writing style. On the opposite, the analysis evaluates thequality of a symbol known by comparing it to a reference model, correspondingin this paper to teacher’s expectations about handwriting.
This paper presents a handwriting analyser for educational systems which120
uses static and dynamic examples. One important aspect is that a dynamicexample - showing to children how to reproduce block letters - is a specificfeature only possible with the use of digital devices. The proposed approachmakes a step forward by introducing a finer analysis based on four criteria:multi-criteria, shape, order and direction. Firstly, a multi-criteria score sum-125
marises in real-time legibility and kinematic aspects for children, according tothe teacher expectations. Secondly, a hierarchical approach presents for teachersthe legibility aspect (shape) followed in case of the correctness by a kinematicanalysis (order and direction). Finally, a fundamental criterion to assess thequality of the cursive writing is the fluidity [19]. However, it will be considered130
later with the second step of the IntuiScript experiments related to the cursiveanalysis, and is therefore outside of the scope of this paper.
3. IntuiScript Educational Scenario
This paper investigates the handwriting quality analysis for its use in aneducational system to give an on-line feedback to children and off-line feed-135
back to teachers. The on-line feedback helps children by providing a simplescore to measure their improvements and to work in autonomy. The off-linefeedback is composed of a set of more detailed feedback that can be used byteachers. In-class experiments presented in this paper target the validation ofthis handwriting analysis methodology. The educational scenario and digital140
workbook design will be evaluated at the end of the IntuiScript project withseveral months of experiment and more than 1000 children. Nevertheless, thisproject is based on a user-centered design approach that includes several cy-cles of conception followed by experiments. Therefore, feedback of children andteachers related to this experiment will be used to improve the next version of145
the education scenario. The rest of this section presents the current educationalscenario proposed by IntuiScript educational experts for learning words basedon block letters.
The scenario illustrated by Figure 2 is based on three hierarchical stepsadapted to the skills and difficulties of each child. It is important to note that150
the automatic adaptation of pedagogical exercises is only possible with an on-line handwriting analysis, such as the one presented in this paper. First, basedon examples containing rules about shape, order and direction, children haveto write each letter of a given word and an on-line feedback is returned (seeFigure 2(a)). In the application, examples correspond to dynamic animations155
6

that can be repeated as many times as children want. Then, if the systemdetects some incorrectly letters drawn, it proposes to children to work on in-dividual letters (see Figure 2(b)). An on-line feedback allows them to measureautonomously their progress. Finally, if the system detects that the handwrit-ing is still incorrect, an exercise with letter primitives (e.g. horizontal/verti-160
cal/slant line, loop) is given with the same approach than individual letters (seeFigure 2(c)).
4. Multi-Criteria Gesture Analysis
The handwriting analysis task is fundamentally different from the recognitiontask that focuses on the recognition of a letter independently of its quality and165
its writing style. The input of this system illustrated in Figure 5 corresponds toa gesture acquired from a digital device (a) that can be decomposed in strokes(delimited by pen up) (b), elementary strokes (delimited by singularity points)(c) and median strokes (median segments of elementary strokes) (d).
(a) (b) (c) (d)
Figure 5: The original gesture from a digital device (a), and its decomposition in strokes(delimited by pen up) (b) and elementary strokes (c) with the drawing direction and order.Median strokes are represented by thicker lines in (d).
In the analysis, the letter is already known but the aim is to evaluate its170
quality by comparing it against a reference model under various criteria thatcan be interdependent (e.g. order depends on shape). Two complementarymeasurements are related to this process: an intra-class measure describing thecloseness to the model of the expected letter, and an inter-class measure whichquantifies its discriminatory quality with respect to other symbols.175
The analysis system depicted in Figure 6 is based on a hierarchical approachwith three criteria: shape, order and direction. Each criterion can be used byteachers during the remediation to identify errors and children difficulties. Arefined multi-criteria confidence gives to children a score related to legibilityand ductus aspects.180
More precisely, the elementary-analyser presented in Figure 7 consists inextracting features that are used by discriminative and generative models tocompute inter-class and intra-class scores. These scores are then merged withthe fusion model to give a final confidence score with regards the symbol anal-ysed. In the rest this paper, the denomination analysis-based classifier refers to185
a set of discriminative, generative and fusion models.
7

Order
Shape
Direction
Multi-CriteriaConfidence
score
Hierarchical Classifier
Figure 6: Multi-Criteria Analyser : Overview of the system composed of three sub-criteria:shape, order and direction based on hierarchical dependencies.
Figure 7: Workflow of the elementary-analyser that gives a confidence about a gesture (orsymbol). This analyser is used in shape, order and direction analysers.
The two following sections describe analysis-based features and classifiersspecifics for each criterion, followed by the evaluation in Section 7 comparingthe results with this approach obtained against an approach using a recognition-based methodology [5].190
5. Analysis-Based Features
The analysis is based on a set of specific features to characterise differentaspects of an handwriting letter, and used as input for an analysis-based classi-fier.
In the previous approach [5], features for each criterion were a subset of a195
set of recognition-based features : HBF49. In this paper, a new set of dedicatedanalysis-based features are defined for each criterion. The rest of this sectionpresents these two approaches.
5.1. A baseline with HBF49 features
HBF49 [7] is a generic set of features designed for handwriting symbols200
recognition. More precisely, it is composed of dynamic features that dependon the writing process (e.g. starting and ending positions, proportion of down-strokes trajectory, angle of the initial vector, inflexions), and visual features thatfocus on the appearance of the written results (e.g. 2D histogram of point, k-perpendicularity, k-angle). This set of features captures multiple criteria: shape,205
order, direction and global as depicted in Table 1.
8

Table 1: Description of HBF49 features [7] with regards global, shape, order and directioncriteria. Each number refers to the features identifier described in [7]. Features 6 and 7characterise two criteria: order and direction.
Type Criteria Features NumberDynamic Order HBF49 (1-4): starting and ending points position 4
HBF49 (6-7): first point to last point vector 2Direction HBF49 (6-7): first point to last point vector 2
HBF49 (9-10): angle to initial vector 2Global HBF49 (5): first point to last point vector (norm) 1
HBF49 (8): closure 1HBF49 (11-12): inflexions 2HBF49 (13): proportion of downstrokes trajectory 1HBF49 (14): number of strokes 1
Visual Direction HBF49 (19): average direction 1HBF49 (24-27): absolute angle histogram 4HBF49 (28-31): relative angle histogram 4
Shape HBF49 (15): bounding box diagonal angle 1HBF49 (18): deviation 1HBF49 (32-40): 2D histogram 9HBF49 (41-47): hu moments 7HBF49 (48-49): convex hull 2
Global HBF49 (16-17): trajectory length 2HBF49 (20-21): curvature and perpendicularity 2HBF49 (22-23): k-perpendicularity, k-angle 2
Table 2: RECOGNITION-BASED features of the previous work [5] used for Shape, Orderand Direction criteria.
Criteria Features NumberShape [5] HBF49 (15, 16, 17, 32-40) 11Order [5] HBF49 (1-7) 7Direction [5] HBF49 (13, 24-31) 9
Some set of analysis-based features, presented in Table 2, were build in [5]by selecting a subset of HBF49 features for each criterion. However, HBF49 hasbeen designed to recognise handwritten symbols and not to analyse specificallythe correctness of a criterion with regards to a reference model. For instance,210
HBF49 does not contain any precise features to characterise order and direction.Order features used in [5] (i.e. HBF49 (1-7) ) capture starting and ending po-sition but are not robust enough to detect order changes in elementary strokes.Similarly, direction features [5] (i.e. HBF49 (13, 24-31) ) focus on the propor-tion of down-strokes trajectory and the global orientation that is not sufficient215
to characterise changes of direction related to elementary strokes.
5.2. A new set of analyse-based features
The set of new analyse-based features introduced in this paper is sum up inTable 3 and described as follows where each criterion must be independent.
5.2.1. Shape220
The proposed shape features consist firstly in selecting HBF49 features thatdo not depend on order and direction (e.g. 2D histogram of points [32 − 40],
9

Table 3: Features used for the four criteria based on HBF49 [7] and specific analysis-basedfeatures.
Criteria Reuse of HBF49 [7] fea-tures
New Analysis-based features Number
Shape HBF49 (15, 18, 20, 21,24-27, 32-42, 44, 48, 49)
Fuzzy Histogram of Orientation O(1-48)
69
Order HBF49 (15, 18, 20, 21, 24-27, 32-42,44, 48, 49) features applied on each el-
ementary stroke
21
Direction Fuzzy Histogram of Directions D(1-48) 48
absolute angle histogram [24− 27], hu moments [41− 42, 44], hull area [48, 49]).Secondly, a novel set of features is added to capture finely shape changes becausemost of HBF49 features are global except the 2D histogram of points that lacksof precision (e.g. a square and its included circle have very close 2D histogramof points but shapes are fundamentally different). These orientation featurespresented in Figure 8 are based on a 4× 3 grid in which a four bins histogram -associated to the range [0, π] - with a fuzzy quantification is built for each cell.Consequently, 48 features are added, and the set of shape features is composedof 69 features. The use of the fuzzy theory [20, 21] in these features allows tobe more robust to evaluate the quality of shape drawn by children. During thelearning writing process, children writing can have a stroke positioning less pre-cised that adults and the use fuzzy theory in features allows to capture with lesstraining samples a description of the orientation of a given model. First, non-fuzzy histograms of orientation or direction are computed in each cell. Then,these histograms contribute to the fuzzy histogram of the closest cells with afuzzy voting. This voting depends on the contributions of each segment in acell. As illustrated in Figure 8(d), the fuzzy weight is related to the distancebetween the segment and closest cells (4 among the 9 around the segment).The distance is expressed as an exponential function of the Manhattan distancebetween the gravity centre of a cell and a segment. More precisely, the equa-tion (1) defines the contribution of a segment to the fuzzy weight associated toa cell (i, j) where gseg and gi,j are respectively the gravity centre of the segmentconsidered and the cell (i, j), and Ccells corresponds the set of closest cells tothe current segment.
w(gseg , gi,j) =exp (−‖gseggi,j‖1)
∑
(k,l)∈Ccellsexp (−‖gseggk,l‖1)
(1)
5.2.2. Order
The correct order of a gesture corresponds to the correct order of the as-sociated elementary strokes (see Figure 5(c)). The identification of the correctorder is based on the median part of strokes (see Figure 10) which is a part ofelementary stroke that is invariant to direction changes. During the learning225
process, median strokes are computed from a letter fully decomposed in ele-mentary strokes as presented in Figure 12. The classification stage, described
10

(a) 4 Orientations (b) 4× 3 grid (c) A sample (d) Fuzzy Voting
Figure 8: Shape Features: Fuzzy Histogram of Orientation O(1-48). (c) illustrates the featurecomputation on the letter A based on a 4×3 grid (b) on which a four bins histogram associatedto four orientations (a) is computed. The fuzzy voting (d) is based on the contribution of eachsegment to the closest cells (4 among the 9 around the segment) as expressed in equation (1).
in Section 6.2.2 and Figure 13, searches the sub-part that matches the besteach elementary stroke of the learnt model. The features used on the medianstrokes are global shape features that are invariant to the direction (see Ta-230
ble 3). These features do not include fuzzy histogram of orientations becauseelementary strokes are simple shapes that can be discriminated with spatial po-sition features (e.g. 2D histogram of points) and the global orientation features(e.g. absolute angle histogram). Consequently, 21 features are used in the setof order features.235
5.2.3. Direction
To capture finely local direction changes, a fuzzy histogram of directionbased on a 4 × 3 grid is introduced in Figure 9. For each cell, a four binshistogram - associated to the range [−π
2 , 3π2 ] - with a fuzzy quantification is
built. Consequently, 48 features are added and constitute the set of direction240
features.
(a) 4 Directions (b) 4× 3 grid (c) A sample (d) Fuzzy Voting
Figure 9: Direction Features: Fuzzy Histogram of Direction D(1-48). (c) illustrates the featurecomputation on the letter A based on a 4×3 grid (b) on which a four bins histogram associatedto four directions (a) is computed. The fuzzy voting (d) is based on the contribution of eachsegment to the closest cells (4 among the 9 around the segment) as expressed in equation (1).
The next section describes the different classification systems used with theseinput features.
11

(a) (b) (c) (d) (e)
Figure 10: Median strokes coloured and numbered from the first to the fourth with red, blue,green and brown. Strokes are coloured with the same colour code.
6. Analysis-based Classifiers
In the previous approach [5], a single classifier (evolving fuzzy inference245
system [6]) was used with specific feature sets for each criterion.In this paper, in addition of specifics features presented in the previous
section, a specific classifier is introduced for each criteria. First, the elementaryanalyser described in Figure 7 is presented. Then, specifics classifiers usingthe elementary analyser for shape, direction and order criteria are described.250
Finally, a multi-criteria analyser corresponding to Figure 6 is explained.In the rest of this paper, a gesture is defined as a set of strokes as illustrated
in Figure 5(b). More formally, each stroke is represented as a set of points
xg = ∪Np
i=1pi where a point pi is represented by its x and y coordinates and timevalues. G represents the set of gestures that is currently analysed. g represents255
one gesture or class of the set G.
6.1. Elementary Analyser
Supervised learning algorithms use a generative and discriminative analysisto compute intra-class and inter-class scores (see Figure 4). These algorithmstake as input a set of labelled data (xcg ,k)k∈J1,NgK where Ng is the number of260
samples available for a gesture g. More precisely, each sample is represented bya set of features.
The generative algorithm builds a prototype M that is used to compute anintra-class score, also called absolute confidence. The discriminative algorithmgenerates a model MD that discriminates samples among classes using the265
prototype M and features extracted. The inter-class score resulting from thisprocess is also called relative confidence. These algorithms are incremental algo-rithms to let teachers expend models with their own drawing. The first buildsa prototype as a set of clusters and the second is a classifier based on a fuzzyinference system. The rest of this section described in details each algorithm of270
the elementary analyser as follows:
6.1.1. Generative Model
For each gesture (or class) g ∈ G, a cluster cg is represented by a meanvector µcg and a covariance matrix Σcg . As in [22], an incremental process isused to compute the mean vector and the precision matrix Φcg = Σ−1
cgthat
are respectively expressed by equations (2) and (3) where xcg ,k is the k-th
12

sample relative to the gesture g, αk = 1/k, Ψcg,k = xcg ,k − µc,k and λcg,k =ΨT
cg,kΦcg ,k−1Ψcg,k.
µcg ,k = (1− αk) · µcg,k−1 + αk · xcg ,k (2)
Φcg,k =Φcg,k−1
1− αk
−αk · Φcg,k−1Ψ
Tcg,k
Ψcg,kΦcg,k−1
(1− αk) · [1 + αk(λcg ,k − 1)](3)
Finally, the prototype resulting from the supervised clustering is M =(µcg ,Φcg)g∈G where the Mahalanobis distance dm quantifies the closeness ofa sample x to the cluster cg. The absolute confidence described in Section 6.2.1is based on this distance.
∀g ∈ G, dm(x, cg) =√
(x− µcg )TΦcg(x− µcg ) (4)
6.1.2. Discriminative Model
An evolving fuzzy inference system named Evolve [6, 22] is used in additionof the generative model to build decision boundaries as linear functions of theprototype M and input features. This process, which is equivalent to a neuralnetwork, is particularly efficient to improve the discriminatory power of thesystem by increasing the precision of the class boundaries between prototypes.The model resulting from this learning process is defined as:
MD=(µcg ,Φcg)g∈G, Ec (5)
where Ec represents the linear functions. (sg)g∈G corresponds to a vector of themembership degrees relatively to all classes in G and is used to compute the275
relative confidence described in Section 6.2.1.
6.1.3. Fusion Model
The fusion model combines results of the generative and discriminative mod-els with a conjunction between two comparative metrics: the absolute confidenceca which is the closeness to a cluster model resulting from the generative model,280
and the relative confidence cr which is the confidence to not confuse gesturesresulting from the discriminative model.
This paper makes a contribution by introducing a probabilistic version ofthe confidence defined in equation (6) where xg represents a gesture to analyseas a g ∈ G.
c(xg) = ca(dm(xg, cg)) · cr(xg) (6)
6.2. Specialised Analysers
Three specialised analysers are defined: the confidence-based classifier, bi-nary order classifier and binary direction classifier that are used respectively285
for shape, order and direction criteria.
13

6.2.1. Confidence-Based Classifier
The confidence-based classifier is based on the fusion model. It introducesa method to normalise the confidence score to be meaningful for teachers andchildren.290
Firstly, the absolute confidence is computed with the generative model anda set of positive samples to define a confidence function using a Log-Cauchydistribution. This confidence function defined in equation (7) corresponds toits reliability function where the median and the median absolute deviation ofln(x) are robust estimators of parameters µ and σ [23].
ca(x) = cµ,σ(x) =1
2−
1
πarctan
[
ln(x)− µ
σ
]
(7)
However, using this estimator does not correspond to the confidence of posi-tive samples as the computed confidence varies from 0 to 1 for positive samples.To give a useful feedback to children, it is expected that the confidence of nega-tive and positive samples correspond respectively to ranges 0−0.5 and 0.5−1.0.Consequently, µ must be estimated as the rejection threshold between positive295
and negative samples, and σ as the median absolute deviation.The estimation process illustrated in Figure 11 works as follows. First,
for each gesture g, positive and negative samples are generated with artificialdata synthesis by geometrical distortion [24] (rotation, inclination, curvaturechanges). Then, the rejection threshold relatively to the Mahalanobis distanceµg is learnt by using a greedy algorithm that minimises a function depending onthe ratio of false positives rFP and false negatives rFN defined in equation (8).The parameter βg fixes the importance of having less false negatives than falsepositives that depends on the application.
eµg = argminθ∈[0,+∞[
[βg · rFN (θ) + (1− βg) · rFP (θ)] (8)
Secondly, the relative confidence defined in equation (10) is based on theoutput of the discriminative classifier and extends the definition of [5] corre-sponding to equation (9) by penalising continuously the score when there is aconfusion (sg corresponds to the membership degree relatively to the class g).
cor(xg) =
sg − maxp∈G\{sg}
sp
maxp∈G
sp(9)
cr(xg) =
{
1 if cor(xg) ≥ 01 + cor(xg) if cor(xg) < 0
(10)
6.2.2. Binary Order Classifier
Order is a binary criterion that is considered correct when all the elementarystrokes have been drawn in the correct order. Each elementary stroke is repre-sented as its median stroke of size sm that is invariant to drawing directions.
14

0
1
0 µg 1
Fals
e P
ositiv
e R
ate
(r F
P)
False Negative Rate (rFN)
Estimation of µg
f(x)g(x)
(a)
0
0.5
1
0 eµg-e
σg eµg
Confidence
Mahalanobis distance
Absolute Confidence
LogCauchy Rejecttraining-ntraining-p
(b)
Figure 11: Building of the LogCauchy rejection confidence from positive (training-p) and neg-ative (training-n) samples. µg is computed with equation (8) and corresponds graphically (a)
to the intersection of the FN/FP curve f(x) = rFP (x) and g(x) =βg · x
1− βg
. (b) illustrates the
building of the LogCauchy reject confidence with regards to positive and negative trainingsamples. It is noted that the confidence is 0.5 for the rejection value: eµg .
A discriminative model is used to discriminate them efficiently. Therefore, theorder model MDo is defined by equation (11) and depicted in Figure 12 whereNg
e is the number of elementary strokes associated to a gesture g and Egc are
the rules conclusion.
MDo =[
(µckg,Φckg
)k∈J1,Nge K, E
gc
]
g∈G
(11)
During the analysis, a spatio-temporal decomposition resulting from a spatialsampling applied to the original gesture is used to build the gesture sequence(gt)t∈J1,Ns
p−smK where
gt = ∪t+smi=t psi (12)
and gs = ∪Ns
p
i=1psi is the gesture after applying the spatial sampling. Then,
given a gesture g, elements of the gesture sequence are compared to medianstroke models to identify the eg elements that have the best matching based ondiscriminative distances of the class recognised by the generative model (see thesliding window in Figure 13). More precisely, for each median stroke k, a setof stroke candidates Gc is built with strokes having the best generative scoresamong the gesture sequence, and the best matching is found as follows:
argming∈Gc
dm(g, ckg) (13)
where ckg represents the cluster of the k-th median stroke. Finally, the order iscorrect if all elements matched are in the same order than the median-strokemodel.300
15

e1 e2e3
(a) Gesture
m1
(b) e1
m2
(c) e2
m3
(d) e3
Figure 12: During the learning stage of the order classifier, each gesture (a) is decomposedin elementary strokes. Then, for each elementary stroke (ek), features are extracted from themedian strokes (b) (c) (d) represented as thicker lines, and used to learn a classifier.
Figure 13: During the order analysis, an approach based on a sliding windows (representedwith the dotted line rectangle) is used to search the best substrokes corresponding to theelementary strokes modelled in Figure 12.
6.2.3. Binary Direction Classifier
Similarly to order, direction is a binary criterion that is considered correctwhen all the elementary strokes are in the correct direction independently of theorder. For each gesture g, a discriminative model MDd is learnt to discriminatethe direction correctness. A class is created for each combination of elementarystrokes inversion direction. This model is defined in equation (14) where Ig
represents the number of inversion of direction (i.e. 2Nge ). Therefore, the binary
decision follows the best membership degrees sbest, i.e. correct if the correctdirection class is recognised and incorrect if one of the incorrect direction classis recognised.
MDd =[
(µckg,Φckg
)k∈J1,IgK, Egc
]
g∈G
(14)
6.3. Multi-Criteria Analyser
Finally, a refined multi-criteria confidence gives to children a feedback re-lated to the legibility and the ductus. It is defined as the combination of theprevious criteria by equation (15) where cs, co and cd are the confidence asso-ciated to shape, order and direction, and (αk)k∈{1,0} a maximum score whenthere is one or two errors, and αs a weight associated to the shape.
c = min(αscs, 1.0) · P(co, cd) where P(co, cd) =
1 if co + cd = 2α1 if co + cd = 1α0 if co + cd = 0
(15)
This confidence is obtained by combining the continuous confidence of the shapeclassifier with a penalisation when the order and/or the direction are incorrect.
16

The weights (αk)k∈{0,1,s} are fixed by teachers and depends on the children305
skills and teacher expectations.
7. Experiments and Results
This section presents experimental results of the multi-criteria analyseragainst the recognition-based approach of [5] that uses only recognition fea-tures. First, datasets are introduced followed by the approach to generate the310
ground truth and the evaluation protocol. Finally, experiments and results areexplained.
7.1. Datasets
Training and testing datasets are extracted from a dataset collected from952 children from four to five years old in 20 French preschools. Children were315
practising block letters with exercises mainly related to week words (e.g. lundi,mardi meaning respectively Monday and Tuesday in French). 20 correct sam-ples 2 for each letter (i.e. A, C, D, E, H, I, L, M, N, O, P, R and U) withvarious number of strokes are used in the training dataset, and the rest con-stitute the Original Testing (OT) dataset described by Table 4(a). However,320
the OT dataset contains few samples of incorrect order (4%) and direction (3%)probably because the input was done at the end of the school year when childrenproduce less mistakes. Therefore, to fully validate order and direction classifiers,negative samples described by Table 4(b) are generated from positive samplesby synthetically changing order and direction (Negative Order/Direction Test-325
ing (NODT) dataset). Finally, three groups of similar letters relatively to theshape (i.e. A,H,R,P / C,O,U,D / E,I,L / M,N) are used to build the NegativeShape Testing (NST) dataset presented in Table 4(c): 50 samples for each letterare selected from the testing dataset and negative samples are chosen within agroup (e.g. E and I for L).330
This dataset containing symbols drawn by 952 children is publicly availableon a dedicated web page 3 with a ground truth for each criterion, and resultsof the presented approach to be used in the future as a baseline for the analysistask.
7.2. Generation of a Ground-Truth with an Expert335
In the OT dataset, it is often difficult to estimate the correctness of a sampleas children are learning to write. Therefore an expert has manually created theground truth with the following rules. First, a sample is correct with regards toshape if it is similar to the expected letter, it cannot be confused with anotherletter and if there are no strokes modifying the letter aspect. Moreover, as340
it exits different levels of deformation for the shape, the expert can qualify
2This 20 samples are used to generate 580 synthetic training samples with geometricaldistortion [24].
3 https://www-intuidoc.irisa.fr/partial-block-letters/
17

Table 4: Number of gestures (Ng) per letter in the Original Testing (OT) (a), NegativeOrder/Direction Testing (NODT) (b) and Negative Shape Testing (NST) (c) datasets withthe ratio of positive and negative samples per criterion. Order and direction as a sampleis only valid when shape is correct. The shape is also characterise with a strong and weekconfidence. Letters have been drawn by 952 children from preschools.
(a) Original Testing (OT)
Ng Shape Positive Shape Negative Order Direction(Strong/Weak) (Weak/Strong) (Positive/Negative) (Positive/Negative)
A 737 0.10 / 0.49 0.19 / 0.22 0.56 / 0.00 0.40 / 0.00C 192 0.21 / 0.18 0.35 / 0.26 0.39 / 0.00 0.39 / 0.00D 634 0.02 / 0.67 0.11 / 0.2 0.62 / 0.00 0.62 / 0.00E 243 0.01 / 0.37 0.29 / 0.33 0.13 / 0.23 0.32 / 0.00H 141 0.35 / 0.33 0.08 / 0.24 0.01 / 0.52 0.51 / 0.11I 908 0.00 / 0.75 0.22 / 0.03 0.75 / 0.00 0.75 / 0.00L 607 0.02 / 0.75 0.11 / 0.12 0.77 / 0.00 0.77 / 0.00M 538 0.05 / 0.38 0.27 / 0.30 0.29 / 0.00 0.29 / 0.01N 768 0.00 / 0.27 0.48 / 0.25 0.21 / 0.00 0.21 / 0.00O 132 0.02 / 0.57 0.35 / 0.07 0.52 / 0.00 0.45 / 0.06P 137 0.22 / 0.36 0.16 / 0.26 0.54 / 0.00 0.55 / 0.00R 315 0.00 / 0.34 0.26 / 0.40 0.29 / 0.00 0.28 / 0.01U 315 0.02 / 0.57 0.26 / 0.16 0.57 / 0.00 0.57 / 0.00All 5667 0.08 / 0.46 0.24 / 0.22 0.5 / 0.04 0.49 / 0.03
(b) Negative Order/Direction Testing (NODT)
Ng Shape Order Direction(Positive) (Positive/Negative) (Positive/Negative)
A 312 1.00 0.58 / 0.41 0.31 / 0.69C 61 1.00 1.00 / 0.00 0.00 / 1.00D 1456 1.00 0.75 / 0.25 0.25 / 0.75E 342 1.00 0.39 / 0.61 0.61 / 0.39H 72 1.00 0.58 / 0.42 0.42 / 0.58L 112 1.00 0.75 / 0.25 0.25 / 0.75M 608 1.00 0.39 / 0.61 0.61 / 0.39N 372 1.00 0.58 / 0.42 0.42 / 0.58O 34 1.00 1.00 / 0.00 0.00 / 1.00P 224 1.00 0.75 / 0.25 0.25 / 0.75R 240 1.00 0.58 / 0.42 0.42 / 0.58U 105 1.00 1.00 / 0.00 0.00 / 1.00All 3938 1.00 0.63 / 0.37 0.37 / 0.63
(c) Negative Shape Testing (NST)
A C D E H I L M N O P R UNg 150 150 150 100 150 100 150 50 50 150 150 150 150
18

0
0.5
1
0 0.3 0.5 0.7 1
tru
e p
ositiv
e /
ne
ga
tive
sim
ilarity
classifier confidence
Strongpos (TPS)Strongneg (TNS)Weakpos (TPS)Weakneg (TNS)
Figure 14: The true positive similarity (TPS) and true negative similarity (TNS) valuesmeasure the similarity of a confidence-based system with an expert. Thus, a sample witha strong confidence will be more penalised than a sample with a weak confidence when theresult is different from the expert. These curves show respectively the true positive similarityfor strong and weak positive samples, and the true negative similarity for the strong and weaknegative samples with regards to the classifier confidence.
positive/negative samples with a strong or weak confidence. Then, a sample iscorrect relatively to order and direction respectively if the order and directionof elementary strokes are correct. Ground truth of NODT and NST datasetsare automatically deduced from the generation process.345
Two metrics called true positive similarity (TPS) and true negative similarity(TNS) are introduced to measure the similarity between the output of the system(i.e. a confidence value) with the expert decision. These metrics illustrated inFigure 14 penalise more errors of the classifier when a sample is ground-truthedwith a strong confidence.350
7.3. Evaluation Protocol
The evaluation protocol is based on two types of evaluation metrics reflectingperformances of confidence-based and binary classifiers. The former uses a ROCcurve created by changing the confidence threshold to show system performancesat different operating points. The latter computes the analysis rate of positive355
and negative samples. Finally, to have a uniform comparison of criteria, analysisrates of positive and negative samples are also computed for a confidence-basedclassifier by using a confidence threshold of 0.5.
Each criterion is tested on specific testing datasets: shape (OT and NST),order (OT and NODT) and direction (OT and NODT) to avoid data duplica-360
tion, e.g. the evaluation of shape does not need to be performed on NODT asall shapes are in OT.
The baseline of this work is the approach presented in [5] with recognition-based features - summarised in Table 2 - combined with the confidence-basedclassifier. The binary decision of order and direction classifiers are set up em-365
pirically in [5] by fixing a confidence threshold (0.2 and 0.25 respectively). It is
19

important to note that the presented approach uses three distinct analysers forthe criteria shape, order and direction corresponding to the confidence-based,binary order and binary direction classifiers as opposition of the baseline thatis only based on the confidence-based classifier.370
In the presented approach, the importance factor βg in equation (8) is equalto 0.9 to have less false negatives during the estimation of the rejection threshold,and the size of the median stroke is sm = 5 (i.e. 5 points resulting from theHBF49 [7] spatial sampling) to be discriminant. The choice of a high value forthe importance factor βg is motivated by the fact that the system should not375
penalise a children if the letter can be interpreted as ‘correct’, therefore falsepositives are tolerated but not false negatives. The adjusting weights αs forthe shape in equation (15) is fixed to 1.1. The maximum score α0 and α1 inequation (15) are respectively set up to 0.5 and 0.35 to be in the orange orred part of the colour scale indicator when there is an error of order and/or380
direction.
7.4. Results
Before giving quantitative results about handwriting analysis, it is importantto analyse feedback of children about this first experimentation with tactiledigital devices. In-class experiments conducted with the multi-criteria classifier385
have shown that children get quickly familiar with the application and try toimprove the evaluation score that is well understood. Moreover, the personalisedfeedback allows children to progress with autonomy at their own speed, and tostay concentrated during the whole session of 20 minutes which is difficult foryoung children. Some of them were so involved that they did not want to stop.390
Quantitative and qualitative results of all criteria are summed up in Table 5and Figure 16. In all qualitative figures, evaluation results are displayed withan encompassing rectangle: green (true positive), blue (true negative), orange(false negative) and red (false positive) where the decision threshold is 0.5.Moreover, confidence scores are displayed on the bottom left corner with four395
levels of correctness: very good (green with a dark star), good (green), average(orange) and incorrect (red) corresponding to a uniform partition of confidenceranges. However, before to describe in details these results per criterion, it isimportant to note that the shape correctness is a necessary condition to performorder and direction analysis as shown in Figure 15 and justifies the choice of400
the presented hierarchical classifier. In Figure 16, results on the three criteriaare given for five letters ‘R’. The samples #0, #1 and #2 correspond to lettersthat are correct for all criteria. The samples #3 and #4 have respectively anincorrect order (b) and direction (c) although the shape (a) is correct. In #3,the order is incorrect because the first and second stroke drawn correspond to405
the second and first median stroke of the model, therefore there is an inversionbetween the two first strokes. In 4#, the direction is incorrect because thevertical line is not a descending stroke. The rest of this section presents resultsper criterion as follows:
20

Table 5: Comparison between the previous approach [5] and the multi-criteria classifier. Re-sults are presented with True Positive Similarity and True Negative Similarity (TPS - TNS)evaluation scores on the three criteria: Shape, Order and Direction. Features used in [5] andintroduced in this paper are respectively described in details in Table 2 and Table 3.
(a) Confidence-based classifier (with features of the previous approach [5])
Shape [5] Order [5] Direction [5]Classifier Confidence-Based Confidence-Based Confidence-BasedFeatures A subset of HBF49 A subset of HBF49 A subset of HBF49A 0.99 - 0.77 0.68 - 0.55 0.97 - 0.34C 0.96 - 0.93 - 0.97 - 1.00
D 0.99 - 0.85 0.24 - 0.99 0.88 - 0.99
E 0.99 - 0.96 0.56 - 0.64 1.00 - 0.44H 0.96 - 0.96 0.28 - 0.45 0.73 - 0.79I 0.97 - 0.76 - 0.89 - 1.00
L 0.99 - 0.65 0.86 - 1.00 0.73 - 0.81M 0.97 - 0.65 0.59 - 0.61 0.95 - 0.75N 0.95 - 0.86 0.46 - 0.81 0.94 - 0.71O 0.89 - 0.96 - 1.00 - 0.0P 0.94 - 0.95 0.27 - 1.00 0.85 - 0.99
R 0.94 - 0.89 0.64 - 0.76 0.99 - 0.85U 0.99 - 0.95 - 0.98 - 0.00All 0.96 - 0.85 0.51 - 0.76 0.91 - 0.67
(b) Multi-Criteria classifier (new result)
Shape Order DirectionClassifier Confidence-Based Binary Order Binary DirectionFeatures A subset of HBF49 and a A subset of HBF49 Fuzzy Histogram
Fuzzy Histogram of Orientation on elementary strokes of DirectionA 0.91 - 0.92 0.98 - 0.97 0.95 - 0.93
C 0.95 - 0.94 - 1.00 - 1.00
D 0.97 - 0.97 0.99 - 0.98 0.98 - 0.99
E 0.97 - 0.96 0.99 - 0.98 0.89 - 1.00
H 0.94 - 0.95 0.97 - 0.97 0.97 - 1.00
I 0.92 - 0.84 - 0.98 - 1.00
L 0.97 - 0.85 0.99 - 1.00 0.99 - 0.99
M 0.95 - 0.90 0.99 - 1.00 0.95 - 0.92
N 0.96 - 0.98 1.00 - 1.00 0.96 - 0.99
O 0.94 - 0.99 - 1.00 - 1.00
P 0.97 - 0.96 1.00 - 1.00 0.97 - 0.98
R 0.93 - 0.98 1.00 - 1.00 1.00 - 0.96
U 0.97 - 0.96 - 1.00 - 1.00
All 0.95 - 0.94 0.99 - 0.99 0.97 - 0.98
21
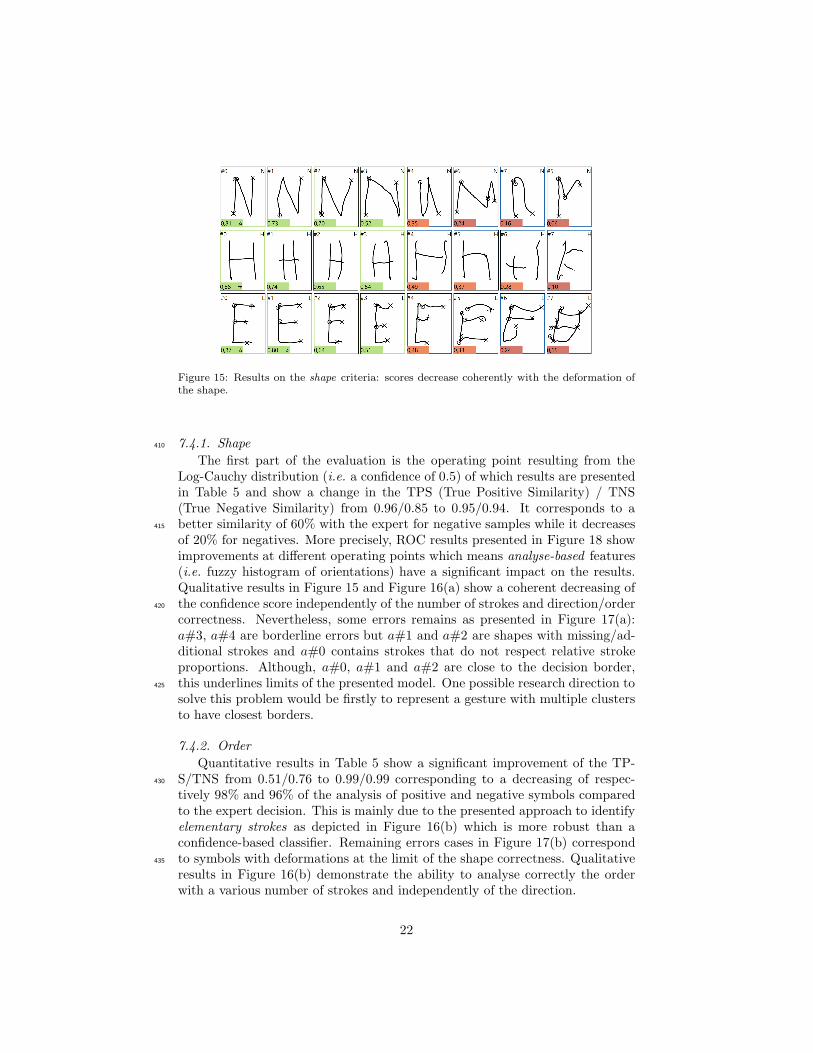
Figure 15: Results on the shape criteria: scores decrease coherently with the deformation ofthe shape.
7.4.1. Shape410
The first part of the evaluation is the operating point resulting from theLog-Cauchy distribution (i.e. a confidence of 0.5) of which results are presentedin Table 5 and show a change in the TPS (True Positive Similarity) / TNS(True Negative Similarity) from 0.96/0.85 to 0.95/0.94. It corresponds to abetter similarity of 60% with the expert for negative samples while it decreases415
of 20% for negatives. More precisely, ROC results presented in Figure 18 showimprovements at different operating points which means analyse-based features(i.e. fuzzy histogram of orientations) have a significant impact on the results.Qualitative results in Figure 15 and Figure 16(a) show a coherent decreasing ofthe confidence score independently of the number of strokes and direction/order420
correctness. Nevertheless, some errors remains as presented in Figure 17(a):a#3, a#4 are borderline errors but a#1 and a#2 are shapes with missing/ad-ditional strokes and a#0 contains strokes that do not respect relative strokeproportions. Although, a#0, a#1 and a#2 are close to the decision border,this underlines limits of the presented model. One possible research direction to425
solve this problem would be firstly to represent a gesture with multiple clustersto have closest borders.
7.4.2. Order
Quantitative results in Table 5 show a significant improvement of the TP-S/TNS from 0.51/0.76 to 0.99/0.99 corresponding to a decreasing of respec-430
tively 98% and 96% of the analysis of positive and negative symbols comparedto the expert decision. This is mainly due to the presented approach to identifyelementary strokes as depicted in Figure 16(b) which is more robust than aconfidence-based classifier. Remaining errors cases in Figure 17(b) correspondto symbols with deformations at the limit of the shape correctness. Qualitative435
results in Figure 16(b) demonstrate the ability to analyse correctly the orderwith a various number of strokes and independently of the direction.
22

(a) Shape (R)
(b) Order (R)
(c) Direction (R)
(d) Shape (D)
(e) Order (D)
(f) Direction (D)
Figure 16: Qualitative results on the three criteria with positive shapes and where strokesare coloured from the first to the fourth with red, blue, green and brown (the begin and endof each stroke is represented respectively with a circle and a cross). In (b) and (e) medianstrokes are represented with thicker lines as in Figure 10.
23

(a) Shape
(b) Order (c) Direction
Figure 17: Qualitative results: classification errors mainly due to borderline samples (a) andshapes at the limit of the correctness to analyse order (b) and direction (c). The analysedletter is written in the top right corner.
7.4.3. Direction
Quantitative results in Table 5 show a significant improvement of the TP-S/TNS from 0.91/0.67 to 0.97/0.98 corresponding to a decreasing of respectively440
67% and 94% of the analysis error of positive and negative symbols comparedto the expert decision. It is explained by the use of local fuzzy histograms ofdirections that is a finer representation of local directions. It works with variousnumber of strokes and independently of the order as presented in Figure 16(c).Similarly to order, errors cases correspond to deformations at the limit of the445
shape correctness as depicted in Figure 17(c).
7.4.4. Multi-Criteria
The multi-criteria confidence corresponds to the feedback given to the chil-dren. Therefore, this score depends on two main aspects: the legibility and theductus on which the importance of each aspect is fixed by teachers based on450
children skills and the aim of the handwriting exercise. Figure 19 illustratesthree possible strategies for the teacher to customise the feedback returned tothe children. In Figure 19(a), it corresponds to an early learning stage, shape,order and direction must correspond to the model. Therefore, errors in order(a#2), direction (a#3, a#4) and shape (a#3) are penalised. As opposition,455
the strategy in Figure 19(b) corresponds to an advance learning stage, wherechildren acquired their own writing style. The legibility is therefore the onlyevaluation criterion. Finally, in Figure 19(c) and Figure 19(d) respectively,there is no constraint of order and direction. These strategies are intermedi-ate learning stages where a constraint about order or direction can be relaxed.460
Consequently, c#2 and d#4 become correct compared to first strategy as theorder and direction are respectively not considered as a mistake. The sample3 is incorrect in direction and slightly deformed. In d#3, the score is on themiddle as it has slightly an incorrect shape but a correct order. This illustratesthe versatility of the method to adapt to various pedagogical scenarios to satisfy465
24

0.5
0.6
0.7
0.8
0.9
1
0 0.1 0.2 0.3 0.4 0.5
Tru
e P
ositiv
e R
ate
False Positive Rate
ROC
ACDEHILMNOPRU
(a) Shape (previous approach [5])
0.5
0.6
0.7
0.8
0.9
1
0 0.1 0.2 0.3 0.4 0.5
Tru
e P
ositiv
e R
ate
False Positive Rate
ROC
ACDEHILMNOPRU
(b) Shape (new result)
Figure 18: Comparison with the previous approach [5] of the shape criteria with the lettersA, C, D, E, H, I, L, M, N, O, P, R and U on the OT and NST datasets. In both cases, aconfidence-based classifier is used, only the set of feature changes.
25

l
Table 6: Dataset and results about the cursive writing.Dataset Results
Ng Shape Positive Shape Negative Direction Shape Direction(Strong/Weak) (Weak/Strong) (Pos/Neg) (TPS-TNS) (TPS-TNS)
a 1421 0.15 / 0.48 0.23 / 0.14 0.29 / 0.23 0.88 - 0.93 1.00 - 1.00c 337 0.00 / 0.20 0.73 / 0.07 0.11 / 0.09 0.95 - 0.87 1.00 - 1.00d 1654 0.10 / 0.57 0.25 / 0.08 0.28 / 0.23 0.93 - 0.91 1.00 - 1.00e 974 0.00 / 0.69 0.17 / 0.14 0.48 / 0.16 0.89 - 0.96 1.00 - 0.99h 372 0.02 / 0.56 0.35 / 0.07 0.28 / 0.23 0.85 - 0.95 1.00 - 1.00l 2234 0.05 / 0.34 0.47 / 0.15 0.32 / 0.04 0.74 - 0.96 0.99 - 1.00m 959 0.20 / 0.53 0.11 / 0.16 0.38 / 0.32 0.93 - 0.83 0.99 - 1.00n 1727 0.17 / 0.45 0.26 / 0.12 0.33 / 0.27 0.82 - 0.96 1.00 - 1.00o 405 0.00 / 0.28 0.64 / 0.08 0.19 / 0.05 0.98 - 0.84 1.00 - 1.00p 386 0.00 / 0.61 0.39 / 0.00 0.21 / 0.19 0.94 - 0.77 1.00 - 0.97r 792 0.11 / 0.36 0.37 / 0.17 0.33 / 0.12 0.91 - 0.86 1.00 - 1.00s 425 0.00 / 0.40 0.60 / 0.00 0.22 / 0.17 0.92 - 0.94 1.00 - 1.00u 2092 0.00 / 0.45 0.45 / 0.10 0.26 / 0.14 0.97 - 0.88 1.00 - 1.00All 13778 0.08 / 0.46 0.35 / 0.11 0.30 / 0.18 0.90 - 0.90 0.99 - 0.99
teacher expectations.
7.5. Experiments on Cursive Letters
In-class experiments have also been conducted with cursive writing in whichthe multi-criteria approach has been used with the shape and direction criteriaas order is not meaningful for cursive writing. 30 samples of each letters have470
been used for the training. The testing dataset including the synthetic inversionof direction and results about shape and direction are presented in Table 6. Inthis experiment, all the parameters are the same than in block letter writingexperiments.
Results in terms of TPS/TNS are respectively 0.99/0.99 and 0.90/0.90 for475
the direction and the shape. The direction decision of the system is very closeto the expert decision with 1% of dissimilarity for positive and negative sam-ples. Compared to the expert, the system gives a shape decision with 10% ofdissimilarity for positive and negative samples. 81% of samples have been an-notated by the expert with weak confidence which emphasises that it is difficult480
to take a strict decision on this dataset. In the block writing dataset, therewere 70% of samples with a weak confidence and a result of 0.95/0.94 in termsof TPS/TNS. Therefore the proposed approach gives similar results on cursiveand block writing letters.
8. Conclusion485
This paper has presented a multi-criteria analysis of block letters applied inthe innovative project IntuiScript targeting the development of a digital work-book to help teachers and children during the handwriting learning process. Anew dataset collected in 20 preschools with 952 children is made publicly avail-able with a ground truth and results obtained in this work for comparison with490
future works on the handwriting analysis. Results on this dataset have shown
26

(a) Early learning stage: All Criteria.
(b) Advanced learning stage: Shape Only.
(c) Intermediate learning stage: No Order.
(d) Intermediate learning stage: No Direction.
Figure 19: Qualitative results of the multi-criteria classifier with the colour scale indicatorreturned to the children. It illustrates four possible strategies for the teacher to customisethe feedback returned to the children (i.e. multi-criteria). In (a), it corresponds to an earlylearning stage, the shape, order and direction must correspond to the model. The strategy (b)only concentrates on the legibility. In (c) and (d) respectively, there is no constraint of orderand direction.
27

significant improvements compared to [5] that are explained by the five maincontributions. A multi-criteria approach combining the results of the threeclassifiers is used to give a precised feedback to children summarising kinematicand legibility aspects of the writing. The shape resulting from that approach495
is based two complementary aspects: the distance to the theoretical model andthe confusion with other models (intra and inter scores). A method to identifyelementary strokes based on median strokes analyses precisely the order inde-pendently of the drawing direction. Specific features using fuzzy histograms oforientation and direction characterise finely shape and direction. The indepen-500
dent analysis of each criterion is only given to teachers to help them duringthe remediation to identify difficulties and errors of children. Teachers can cus-tomised the feedback given to children by focusing on the legibility or/and theductus. Finally, feedback of children and teachers about the use of tactile digitaldevices and the digital workbook in schools have been very positive.505
9. Future Work
The next steps of the IntuiScript project are the analysis of the fluiditythat is a fundamental criterion to characterise the cursive writing. To handlethis problem, methods based on lognormal models [25, 26] seem promising.Finally, the IntuiScript project will let teachers define their own models in510
an authoring mode by firstly asking to the teacher to draw letter samples andsecondly by consolidating with children samples collected during the remediationto adjust the model to teacher expectations. Consequently, the model learnt willallow several configurations of correct orders and directions. Therefore, furtherexperiments will be conducted to validate the existing incremental generative515
and discriminative learning approaches presented in this research work for theauthoring mode.
Acknowledgements
This work takes place in the context of a three years research project foundedby the French government as part of innovative projects (BPI): IntuiScript520
(http://intuiscript.com/). The authors are grateful to their industrial part-ners (Script&Go, Microsoft), educational experts of Rennes academy, ESPE,Brittany region and LOUSTIC laboratory for their collaboration.
References
[1] C. Jolly, R. Palluel-Germain, E. Gentaz, Evaluation of a tactile train-525
ing for handwriting acquisition in french kindergarten children: A pilotstudy, Kindergartens: Teaching methods, expectations and current chal-lenges (2013) 161–176.
28

[2] C. W. Li-Tsang, A. S. Wong, H. W. Leung, J. S. Cheng, B. H. Chiu,F. Linda, R. C. Chung, Validation of the chinese handwriting analysis530
system (chas) for primary school students in hong kong, Research in devel-opmental disabilities 34 (2013) 2872–2883.
[3] T. H. Falk, C. Tam, H. Schellnus, T. Chau, On the development ofa computer-based handwriting assessment tool to objectively quantifyhandwriting proficiency in children, Computer Methods and Programs in535
Biomedicine 103 (2011) 102–111.
[4] V. Kulesh, K. Schaffer, I. Sethi, M. Schwartz, Handwriting quality evalu-ation, in: International Conference on Advances in Pattern Recognition,2001, pp. 157–165.
[5] M. Bouillon, E. Anquetil, Handwriting analysis with online fuzzy models,540
in: Conference of the International Graphonomics Society, 2015, pp. 71–74.
[6] A. Almaksour, E. Anquetil, Improving premise structure in evolving takagi–sugeno neuro-fuzzy classifiers, Evolving Systems 2 (2011) 25–33.
[7] A. Delaye, E. Anquetil, Hbf49 feature set: A first unified baseline for onlinesymbol recognition, Pattern Recognition 46 (2013) 117–130.545
[8] L. H. Dinehart, Handwriting in early childhood education: Current researchand future implications, Journal of Early Childhood Literacy 15 (2015) 97–118.
[9] J. A. Schickedanz, Much More than the ABCs: The Early Stages of Readingand Writing., ERIC, 1999.550
[10] E. Guinet, S. Kandel, Ductus: A software package for the study of hand-writing production, Behavior Research Methods 42 (2010) 326–332.
[11] C. Jolly, E. Gentaz, Analysis of cursive letters, syllables, and words hand-writing in a french second-grade child with developmental coordinationdisorder and comparison with typically developing children, Frontiers in555
psychology 4 (2013) 1–10.
[12] A. P. Accardo, M. Genna, M. Borean, Development, maturation and learn-ing influence on handwriting kinematics, Human movement science 32(2013) 136–146.
[13] Z.-H. Hu, Y. Xu, L.-S. Huang, H. Leung, A chinese handwriting education560
system with automatic error detection, Journal of Software 4 (2009) 101–107.
[14] N. Law, W. Ki, A. Chung, P. Ko, H. Lam, Childrens stroke sequence errorsin writing chinese characters, Reading and Writing: An InterdisciplinaryJournal 10 (1998) 267–292.565
29

[15] C. K. Tan, An algorithm for on-line strokes verification of chinese char-acters using discrete features, in: International Workshop on Frontiers inHandwriting Recognition, 2002.
[16] Y. Gao, L. Jin, N. Li, Chinese handwriting quality evaluation based onanalysis of recognition confidence, in: International Conference on Infor-570
mation and Automation, 2011, pp. 211–225.
[17] D. Impedovo, G. Pirlo, R. Plamondon, Handwritten signature verification:New advancements and open issues, in: International Conference on Fron-tiers in Handwriting Recognition, 2012, pp. 367–372.
[18] G. Pirlo, V. Cuccovillo, D. Impedovo, P. Mignone, On-line signature ver-575
ification by multi-domain classification, in: International Conference onFrontiers in Handwriting Recognition, 2014.
[19] A. Vinter, A. W. van Gemmert, J. G. Phillips, Special issue: Progress ingraphonomics: A perceptual motor skill perspective, Human MovementScience 30 (4) (2011) 683–686.580
[20] L. A. Zadeh, Fuzzy sets as a basis for a theory of possibility, Fuzzy Setsand Systems 1 (1978) 3–28.
[21] A. Delaye, E. Anquetil, S. Mace, Explicit fuzzy modeling of shapes andpositioning for handwritten chinese character recognition, in: InternationalConference on Document Analysis and Recognition, 2009, pp. 1121–1125.585
[22] A. Almaksour, E. Anquetil, Ilclass: Error-driven antecedent learning forevolving takagi-sugeno classification systems, Applied Soft Computing 19(2013) 419–429.
[23] J. Olive David, Applied Robust Statistics, Southern Illinois University De-partment of Mathematics, 2008.590
[24] S. Bayoudh, H. Mouchre, L. Miclet, E. Anquetil, Learning a classifier withvery few examples: Analogy based and knowledge based generation of newexamples for character recognition, in: European Conference on MachineLearning, 2007.
[25] R. Plamondon, M. Djioua, A multi-level representation paradigm for hand-595
writing stroke generation, Human Movement Science 25 (2006) 586–607.
[26] M. Djioua, R. Plamondon, A new algorithm and system for the charac-terization of handwriting strokes with delta-lognormal parameters, IEEETransactions on Pattern Analysis and Machine Intelligence 31 (2009) 2060.
30


![MULTI-CRITERIA PROJECT PORTFOLIO OPTIMIZATION UNDER … Multi-criteria... · multi-criteria utility function [18] as a tool of the multi-criteria assessment of the projects under](https://static.fdocuments.in/doc/165x107/5d58df0b88c9931b1c8bdcb0/multi-criteria-project-portfolio-optimization-under-multi-criteria-multi-criteria.jpg)