Multi-chamber oscillating water column device for ... · Multi-chamber oscillating water column...
38
Infrastructure Access Report Infrastructure: TECNALIA Electrical PTO Lab User-Project: MORE Multi-chamber oscillating water column device for harvesting Ocean Renewable Energy Department of Information Engineering (University of Parma) & Department of Civil, Environmental and Architectural Engineering (University of Padova) Marine Renewables Infrastructure Network Status: Final Version: 03 Date: 21-Mar-2014 EC FP7 “Capacities” Specific Programme Research Infrastructure Action
Transcript of Multi-chamber oscillating water column device for ... · Multi-chamber oscillating water column...

Infrastructure Access Report
Infrastructure: TECNALIA Electrical PTO Lab
User-Project: MORE
Multi-chamber oscillating water column device for harvesting Ocean Renewable Energy
Department of Information Engineering (University of Parma) & Department of Civil, Environmental and Architectural Engineering (University of Padova)
Marine Renewables Infrastructure Network
Status: Final Version: 03 Date: 21-Mar-2014
EC FP7 “Capacities” Specific Programme
Research Infrastructure Action
Infrastructure Access Report: MORE
Rev. 03, 21-Mar-2014 Page 2 of 38
ABOUT MARINET MARINET (Marine Renewables Infrastructure Network for emerging Energy Technologies) is an EC-funded network of research centres and organizations that are working together to accelerate the development of marine renewable energy - wave, tidal & offshore-wind. The initiative is funded through the EC's Seventh Framework Programme (FP7) and runs for four years until 2015. The network of 29 partners with 42 specialist marine research facilities is spread across 11 EU countries and 1 International Cooperation Partner Country (Brazil). MARINET offers periods of free-of-charge access to test facilities at a range of world-class research centres. Companies and research groups can avail of this Transnational Access (TA) to test devices at any scale in areas such as wave energy, tidal energy, offshore-wind energy and environmental data or to conduct tests on cross-cutting areas such as power take-off systems, grid integration, materials or moorings. In total, over 700 weeks of access is available to an estimated 300 projects and 800 external users, with at least four calls for access applications over the 4-year initiative. MARINET partners are also working to implement common standards for testing in order to streamline the development process, conducting research to improve testing capabilities across the network, providing training at various facilities in the network in order to enhance personnel expertise and organizing industry networking events in order to facilitate partnerships and knowledge exchange. The aim of the initiative is to streamline the capabilities of test infrastructures in order to enhance their impact and accelerate the commercialization of marine renewable energy. See www.fp7-marinet.eu for more details.
Partners
Ireland University College Cork, HMRC (UCC_HMRC)
Coordinator
Sustainable Energy Authority of Ireland (SEAI_OEDU)
Denmark Aalborg Universitet (AAU)
Danmarks Tekniske Universitet (RISOE)
France Ecole Centrale de Nantes (ECN)
Institut Français de Recherche Pour l'Exploitation de la Mer (IFREMER)
United Kingdom National Renewable Energy Centre Ltd. (NAREC)
The University of Exeter (UNEXE)
European Marine Energy Centre Ltd. (EMEC)
University of Strathclyde (UNI_STRATH)
The University of Edinburgh (UEDIN)
Queen’s University Belfast (QUB)
Plymouth University(PU)
Spain Ente Vasco de la Energía (EVE)
Tecnalia Research & Innovation Foundation (TECNALIA)
Belgium 1-Tech (1_TECH)
Netherlands Stichting Tidal Testing Centre (TTC)
Stichting Energieonderzoek Centrum Nederland (ECNeth)
Germany Fraunhofer-Gesellschaft Zur Foerderung Der Angewandten Forschung E.V (Fh_IWES)
Gottfried Wilhelm Leibniz Universität Hannover (LUH)
Universitaet Stuttgart (USTUTT)
Portugal Wave Energy Centre – Centro de Energia das Ondas (WavEC)
Italy Università degli Studi di Firenze (UNIFI-CRIACIV)
Università degli Studi di Firenze (UNIFI-PIN)
Università degli Studi della Tuscia (UNI_TUS)
Consiglio Nazionale delle Ricerche (CNR-INSEAN)
Brazil Instituto de Pesquisas Tecnológicas do Estado de São Paulo S.A. (IPT)
Norway Sintef Energi AS (SINTEF)
Norges Teknisk-Naturvitenskapelige Universitet (NTNU)
Infrastructure Access Report: MORE
Rev. 03, 21-Mar-2014 Page 3 of 38
DOCUMENT INFORMATION Title Multi-chamber oscillating water column device for harvesting Ocean Renewable Energy
Distribution Public
Document Reference MARINET-TA1-MORE
User-Group Leader, Lead Author
Delmonte Nicola Department of Information Engineering – University of Parma Viale G.P. Usberti 181/A – 43124 Parma – Italy Email: [email protected]
User-Group Members, Contributing Authors
Delmonte Nicola Department of Information Engineering – University of Parma
Ruol Piero Department of Civil, Environmental and Architectural Engineering - University of Padova
Martinelli Luca Department of Civil, Environmental and Architectural Engineering - University of Padova
Giuliani Francesco Department of Information Engineering – University of Parma Cova Paolo Department of Information Engineering – University of Parma
Infrastructure Accessed: TECNALIA Electrical PTO Lab
Infrastructure Manager (or Main Contact)
Robles Eider
REVISION HISTORY Rev. Date Description Prepared by
(Name) Approved By Infrastructure
Manager
Status (Draft/Final)
01 26-Feb-14 Structure Access Report Delmonte Nicola Draft
02 17-Mar-14 Structure Access Report Delmonte Nicola Draft
03 21-Mar-14 Structure Access Report Delmonte Nicola Joseba Lopez Mendia Final

Infrastructure Access Report: MORE
Rev. 03, 21-Mar-2014 Page 4 of 38
ABOUT THIS REPORT One of the requirements of the EC in enabling a user group to benefit from free-of-charge access to an infrastructure is that the user group must be entitled to disseminate the foreground (information and results) that they have generated under the project in order to progress the state-of-the-art of the sector. Notwithstanding this, the EC also state that dissemination activities shall be compatible with the protection of intellectual property rights, confidentiality obligations and the legitimate interests of the owner(s) of the foreground. The aim of this report is therefore to meet the first requirement of publicly disseminating the knowledge generated through this MARINET infrastructure access project in an accessible format in order to:
Progress the state-of-the-art
Publicize resulting progress made for the technology/industry
Provide evidence of progress made along the Structured Development Plan
Provide due diligence material for potential future investment and financing
Share lessons learned
Avoid potential future replication by others
Provide opportunities for future collaboration
etc. In some cases, the user group may wish to protect some of this information which they deem commercially sensitive, and so may choose to present results in a normalized (non-dimensional) format or withhold certain design data – this is acceptable and allowed for in the second requirement outlined above.
ACKNOWLEDGEMENT The work described in this publication has received support from MARINET, a European Community - Research Infrastructure Action under the FP7 “Capacities” Specific Programme.
LEGAL DISCLAIMER The views expressed, and responsibility for the content of this publication, lie solely with the authors. The European Commission is not liable for any use that may be made of the information contained herein. This work may rely on data from sources external to the MARINET project Consortium. Members of the Consortium do not accept liability for loss or damage suffered by any third party as a result of errors or inaccuracies in such data. The information in this document is provided “as is” and no guarantee or warranty is given that the information is fit for any particular purpose. The user thereof uses the information at its sole risk and neither the European Commission nor any member of the MARINET Consortium is liable for any use that may be made of the information.
Infrastructure Access Report: MORE
Rev. 03, 21-Mar-2014 Page 5 of 38
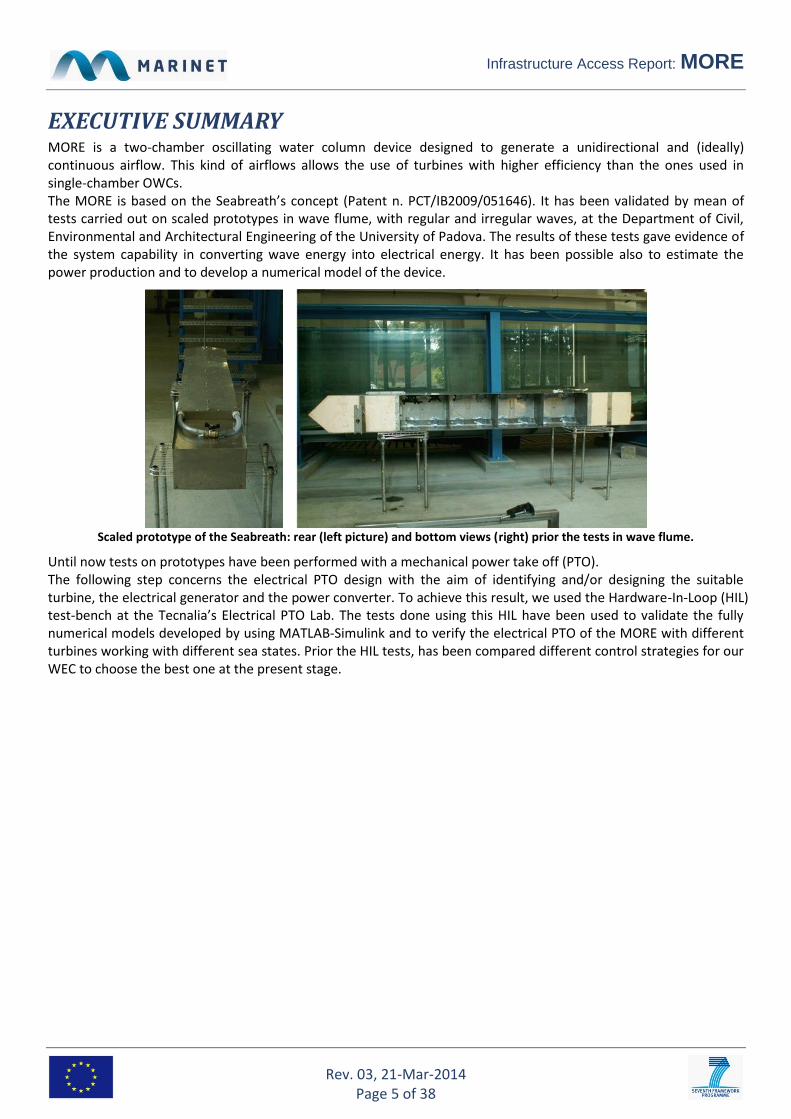
EXECUTIVE SUMMARY MORE is a two-chamber oscillating water column device designed to generate a unidirectional and (ideally) continuous airflow. This kind of airflows allows the use of turbines with higher efficiency than the ones used in single-chamber OWCs. The MORE is based on the Seabreath’s concept (Patent n. PCT/IB2009/051646). It has been validated by mean of tests carried out on scaled prototypes in wave flume, with regular and irregular waves, at the Department of Civil, Environmental and Architectural Engineering of the University of Padova. The results of these tests gave evidence of the system capability in converting wave energy into electrical energy. It has been possible also to estimate the power production and to develop a numerical model of the device.
Scaled prototype of the Seabreath: rear (left picture) and bottom views (right) prior the tests in wave flume.
Until now tests on prototypes have been performed with a mechanical power take off (PTO). The following step concerns the electrical PTO design with the aim of identifying and/or designing the suitable turbine, the electrical generator and the power converter. To achieve this result, we used the Hardware-In-Loop (HIL) test-bench at the Tecnalia’s Electrical PTO Lab. The tests done using this HIL have been used to validate the fully numerical models developed by using MATLAB-Simulink and to verify the electrical PTO of the MORE with different turbines working with different sea states. Prior the HIL tests, has been compared different control strategies for our WEC to choose the best one at the present stage.
Infrastructure Access Report: MORE
Rev. 03, 21-Mar-2014 Page 6 of 38
CONTENTS
1 INTRODUCTION & BACKGROUND ...................................................................................................................7
1.1 INTRODUCTION .................................................................................................................................................... 7 1.2 DEVELOPMENT SO FAR .......................................................................................................................................... 7 1.2.1 Stage Gate Progress .................................................................................................................................. 10 1.2.2 Plan For This Access ................................................................................................................................... 11
2 OUTLINE OF WORK CARRIED OUT ................................................................................................................. 12
2.1 SETUP ............................................................................................................................................................... 12 2.1.1 Wave Energy Converter Emulator ............................................................................................................. 12 2.1.2 Electric generator and grid connection ..................................................................................................... 13 2.1.3 PLC programming ...................................................................................................................................... 14 2.1.4 Wave-to-Wire model ................................................................................................................................. 15 2.1.5 Wind turbines modeling ............................................................................................................................ 17 2.1.6 Drive train modeling .................................................................................................................................. 20 2.1.7 The control law .......................................................................................................................................... 20 2.1.1 Scaling, compensations and adaptations .................................................................................................. 23
2.2 TESTS ............................................................................................................................................................... 25 2.2.1 Test Plan .................................................................................................................................................... 25
2.3 RESULTS ............................................................................................................................................................ 27 2.4 ANALYSIS & CONCLUSIONS................................................................................................................................... 32 2.4.1 Turbines ..................................................................................................................................................... 32 2.4.2 WEC modelling .......................................................................................................................................... 32 2.4.3 Control laws ............................................................................................................................................... 35 2.4.4 Conclusions ................................................................................................................................................ 35
3 MAIN LEARNING OUTCOMES ....................................................................................................................... 36
3.1 PROGRESS MADE ............................................................................................................................................... 36 3.1.1 Progress Made: For This User-Group or Technology ................................................................................. 36 3.1.2 Progress Made: For Marine Renewable Energy Industry .......................................................................... 36
3.2 KEY LESSONS LEARNED ........................................................................................................................................ 36 3.3 SCIENTIFIC PUBLICATIONS .................................................................................................................................... 36 3.4 WEBSITE & SOCIAL MEDIA ................................................................................................................................... 37
4 REFERENCES ................................................................................................................................................ 37
5 APPENDICES ................................................................................................................................................ 37
5.1 STAGE DEVELOPMENT SUMMARY TABLE ................................................................................................................ 37

Infrastructure Access Report: MORE
Rev. 03, 21-Mar-2014 Page 7 of 38
1 INTRODUCTION & BACKGROUND
1.1 INTRODUCTION The objective of the MORE project is to setup the power electronics to use in a prototype of multi-chamber OWC with a single air turbine. In literature there is not a lot about this kind of WEC. We found something about an Australian project (iVec Floating Power Plant) where there is a u-shaped air duct fed by non-return valves at each chamber that ensure a unidirectional airflow. At the two ends of the duct (inlet and outlet) of the iVec FPP prototype have been placed two one-way rotational turbines. As known this turbines are made using two ducted fans, without taking care of their performances. Another system that contemplates a conventional unidirectional turbine is the Stellenbosch Wave Energy Converter or SWEC. It consists of a pair of submerged collectors (arms) coupled in a “V”-formation to an air turbine generator mounted above the water level in a tower at the apex of the V. Each collector arm is made up of a series of OWC chambers in which water level oscillations displace air via inlet and outlet non-return valves to and from low and high pressure manifold systems which are connected to the air turbine in the tower, by means of non-return valves. For this system has been done a study to design an ad hoc optimum turbine. The MORE is part of a larger project named Seabreath. At the present stage, it is necessary to include a turbo-generator to assess the power capabilities together with the optimization of the power electronic converter and its control in the best way. The Seabreath is an array of chambers where oscillating wave columns take place. Unlike the above-mentioned multi-OWCs, the duct is made to form a sort of closed loop to feed only one turbine. In the loop, in addition to the non-return valves, overpressure valves are provided to allow air to exit or enter directly from the outside air to the columns, without passing through the turbine. The tests carried out at the Tecnalia's PTO lab can be useful to select the control strategy. Considering that the foregone prototypes will be made with two or little more chambers a first type of turbine can be choose among the ones used today for OWCs with bidirectional air flows, because they are not only self-rectifying, a property unnecessary in this case, but they got good response to pulsed air flows. In the near future a ducted turbine has to be developed and the electric PTO tests done may also be useful for this purpose. The MORE project is conducted by the Department of Information Technology of the University of Parma in cooperation with the Department of Civil, Environmental and Architectural Engineering of the University of Padova. The staff of Tecnalia provided a valuable support to allow not only to use their laboratory, but also to prepare the necessary models.
1.2 DEVELOPMENT SO FAR The Seabreath wave energy converter is in its initial stage of design. The confidence that in terms of extraction of energy from waves this type of system could performs better than other more complicated mechanical PTO ideas is in that the simplicity of the OWC principle. The device is an elongated structure, made by an array of rectangular chambers with open bottom (Figure 1). The idea is to keep the structure aligned perpendicularly to the incident wave crests, i.e. it is of the attenuator type of WECs.
Figure 1. Perspective view of the prototype (upper and front sides in transparency).

Infrastructure Access Report: MORE
Rev. 03, 21-Mar-2014 Page 8 of 38
In the final configuration, the device is intended to float. The floating body dynamics and the mooring system still need to be analysed, though. It would be much more convenient at the moment to consider a similar but virtually fixed device, or possibly anchored with piles. If we stick to the classification proposed by Thorpe in 1992 (see for instance Thorpe, 2000) the SeaBreath is of the
Oscillating Water Column (OWC) type, since each chamber behaves as an OWC. Figure 2 shows the operating principle of this multi-chamber OWC. When air in each chamber is compressed, it is directed by non-return valves toward a longitudinal high pressure duct; when air pressure drops, the air comes from a low pressure duct. The peculiar recirculation system of the device includes further details that increase performance under irregular wave conditions. A unidirectional impulse turbine connected between the high and low pressure ducts is ideally used to generate energy. Since the wave travels from one chamber to the other, the induced flow is rather steady, with benefits for the turbine efficiency.
(a)
(b)
(c)
Figure 2. Operating principle: (a) the wave ago levels vary within the sectors; (b) when the level drops, air is sucked from the duct on the left, while when the level rises, air is pushed into the right duct; (c) the unidirectional airflow feeds a turbine.
The principle of redirecting the flow derived by a certain number of chambers is common to other devices, see for instance the Leancon, www.leancon.com (Kofoed and Frigaard, 2008), or devices already mentioned in paragraph 1.1.

Infrastructure Access Report: MORE
Rev. 03, 21-Mar-2014 Page 9 of 38
Physical model tests on the Seabreath were carried out in the 36 m x 1 m x 1.4 m wave flume of Padua University
(Figure 3). The wavemaker is an oleodynamic roto-translational paddle equipped with a hardware wave absorption system. To perform the tests, a fixed bottom was used. Water depth at the structure was 0.78 m.
Figure 3. Wave flume cross section.
The work made by using the wave flume has been structured on a various series of tests on physical models to obtain an enough useful data to characterize the ability of the prototype to convert wave energy into electrical energy. To fully understand the operating mechanisms of the energy converter, two version of prototype have been used. First of all, has been observed the evolution of the free surface inside the chambers, using a prototype without the top side. After those experiments, a series of tests have been done to assess the actual ability to produce energy in terms of regular and irregular waves. To avoid the uncertainty related to the dynamics of buoyancy, it was considered only a device fixed on poles (not floating). The fixed device is generally less efficient for shortwave, but with long wave it is more efficient than an optimum-sized floating device. This has allowed interpreting more effectively the operation of the device and to develop numerical models to show its potential. The experimental results have shown that the number of chambers and their size can be derived from the minimum wavelength from which you wish to exploit the energy: the chamber should not be shorter than 4 times the wavelength. The number of rooms equal to 4, and consequently the overall length of the device, is probably the optimum, because the energy to the fourth chamber is still enough larger (hence the Seabreath is not unnecessarily long). But the wave energy to the chamber 4 is appreciably lower than the wave present in the third bedroom. Thus, a fifth chamber may not be convenient. At best, it would be useful to have intermediate baffles, but this would result in an unacceptable increase in the complexity of the whole conversion system. The tests without the emulator of turbine (Step 1) have allowed obtaining a simple empirical model of the wave forcing. With an emulator of turbine, the tests showed that the Seabreath is able to convert wave energy both for regular (Step 2) and irregular (Step 3) sea waves. The efficiency depends largely on the period of the incident waves. The best measured value of this figure of merit, which is of the order of 10% of the incident energy, was obtained with a prototype with valves and ducts of forced air not well dimensioned. The interpretation of the functioning led to believe that the size of the ducts is very undersized, and that this has greatly limited the airflow conveyed to the turbine and the converted energy. Assuming that the efficiency does not change by varying the scale, the power produced is proportional to the length scale raised to the power of 3.5. The average result of 0.7 W produced in the laboratory for regular wave of 6 cm and periods from 1.2 to 1.8 s is equivalent to 25 kW of a model 20 times greater (6 m wide and 30 m long, with a regular wave of 1.2 m, T = 5.3÷8 s) and to 1.6 MW with a device 66 times greater (20 x 100 m with a regular wave with height of 4 m and T = 9÷14 s). This value does not take into account the losses due to the efficiency of the turbine, the electrical power conversion and the connection to the shore. In the transition from regular to irregular wave was observed deterioration in terms of useful power to the turbine of the order of 50%, as typically observed in all systems of this kind. In this work was evaluated the efficiency of the system by the waves to the turbine. This efficiency is expressed in terms of width of capture, the width of the hypothetical wavefront from which it is possible to harvest all the energy.

Infrastructure Access Report: MORE
Rev. 03, 21-Mar-2014 Page 10 of 38
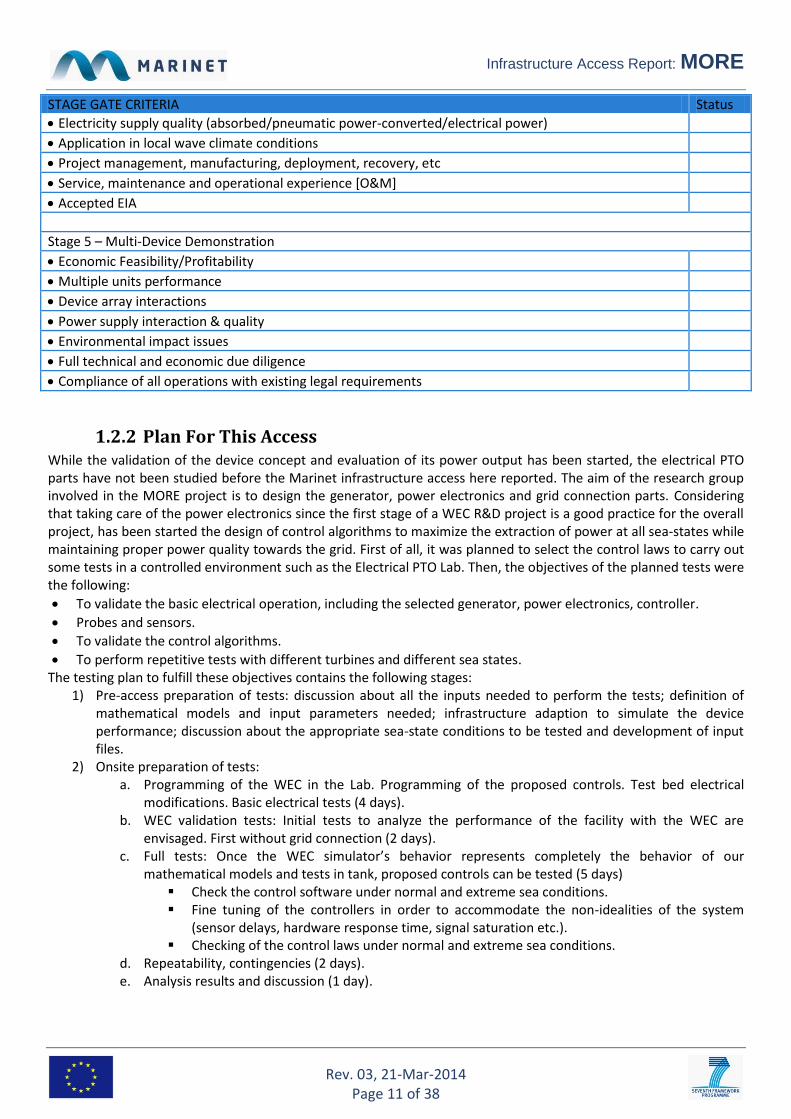
1.2.1 Stage Gate Progress Previously completed: Planned for this project:
STAGE GATE CRITERIA Status
Stage 1 – Concept Validation
Linear monochromatic waves to validate or calibrate numerical models of the system (25 – 100 waves)
Finite monochromatic waves to include higher order effects (25 –100 waves)
Hull(s) sea worthiness in real seas (scaled duration at 3 hours)
Restricted degrees of freedom (DofF) if required by the early mathematical models
Provide the empirical hydrodynamic co-efficient associated with the device (for mathematical modelling tuning)
Investigate physical process governing device response. May not be well defined theoretically or numerically solvable
Real seaway productivity (scaled duration at 20-30 minutes)
Initially 2-D (flume) test programme
Short crested seas need only be run at this early stage if the devices anticipated performance would be significantly affected by them
Evidence of the device seaworthiness
Initial indication of the full system load regimes
Stage 2 – Design Validation
Accurately simulated PTO characteristics
Performance in real seaways (long and short crested)
Survival loading and extreme motion behaviour.
Active damping control (may be deferred to Stage 3)
Device design changes and modifications
Mooring arrangements and effects on motion
Data for proposed PTO design and bench testing (Stage 3)
Engineering Design (Prototype), feasibility and costing
Site Review for Stage 3 and Stage 4 deployments
Over topping rates
Stage 3 – Sub-Systems Validation
To investigate physical properties not well scaled & validate performance figures
To employ a realistic/actual PTO and generating system & develop control strategies
To qualify environmental factors (i.e. the device on the environment and vice versa) e.g. marine growth, corrosion, windage and current drag
To validate electrical supply quality and power electronic requirements.
To quantify survival conditions, mooring behaviour and hull seaworthiness
Manufacturing, deployment, recovery and O&M (component reliability)
Project planning and management, including licensing, certification, insurance etc.
Stage 4 – Solo Device Validation
Hull seaworthiness and survival strategies
Mooring and cable connection issues, including failure modes
PTO performance and reliability
Component and assembly longevity
Infrastructure Access Report: MORE
Rev. 03, 21-Mar-2014 Page 11 of 38
STAGE GATE CRITERIA Status
Electricity supply quality (absorbed/pneumatic power-converted/electrical power)
Application in local wave climate conditions
Project management, manufacturing, deployment, recovery, etc
Service, maintenance and operational experience [O&M]
Accepted EIA
Stage 5 – Multi-Device Demonstration
Economic Feasibility/Profitability
Multiple units performance
Device array interactions
Power supply interaction & quality
Environmental impact issues
Full technical and economic due diligence
Compliance of all operations with existing legal requirements
1.2.2 Plan For This Access While the validation of the device concept and evaluation of its power output has been started, the electrical PTO parts have not been studied before the Marinet infrastructure access here reported. The aim of the research group involved in the MORE project is to design the generator, power electronics and grid connection parts. Considering that taking care of the power electronics since the first stage of a WEC R&D project is a good practice for the overall project, has been started the design of control algorithms to maximize the extraction of power at all sea-states while maintaining proper power quality towards the grid. First of all, it was planned to select the control laws to carry out some tests in a controlled environment such as the Electrical PTO Lab. Then, the objectives of the planned tests were the following:
To validate the basic electrical operation, including the selected generator, power electronics, controller.
Probes and sensors.
To validate the control algorithms.
To perform repetitive tests with different turbines and different sea states. The testing plan to fulfill these objectives contains the following stages:
1) Pre-access preparation of tests: discussion about all the inputs needed to perform the tests; definition of mathematical models and input parameters needed; infrastructure adaption to simulate the device performance; discussion about the appropriate sea-state conditions to be tested and development of input files.
2) Onsite preparation of tests: a. Programming of the WEC in the Lab. Programming of the proposed controls. Test bed electrical
modifications. Basic electrical tests (4 days). b. WEC validation tests: Initial tests to analyze the performance of the facility with the WEC are
envisaged. First without grid connection (2 days). c. Full tests: Once the WEC simulator’s behavior represents completely the behavior of our
mathematical models and tests in tank, proposed controls can be tested (5 days) Check the control software under normal and extreme sea conditions. Fine tuning of the controllers in order to accommodate the non-idealities of the system
(sensor delays, hardware response time, signal saturation etc.). Checking of the control laws under normal and extreme sea conditions.
d. Repeatability, contingencies (2 days). e. Analysis results and discussion (1 day).

Infrastructure Access Report: MORE
Rev. 03, 21-Mar-2014 Page 12 of 38
2 OUTLINE OF WORK CARRIED OUT The Hardware-In-the-Loop (HIL) test bench available for testing at the Tecnalia’s laboratory is shown in Figure 4. It can be viewed as divided in two main sections: the first with an electric motor driven to emulate the WEC and the second with the electric generator and its controls.
Figure 4. HIL bench used: picture of the electric machines (upper left), picture of the dSPACE interface (upper right) and schematic architecture (lower).
The WEC emulator consists of an electric motor, an AC/AC frequency converter and software to control it. The purpose of these elements is to emulate the behavior of Wave Energy Converter ( WEC) at the wind turbine shaft with different sea conditions. This requires modeling the turbine with mathematical equations or lookup tables to use in the software control (to develop in MATLAB-Simulink environment). To emulate the rest of the WEC the pneumatic load or the wind speed vs the time have to be given. The generator block includes a power converter to drive the electric generator and a PLC with the control law of the system. The shaft of the generator can be coupled to the shaft of the motor with a joint or with a gearbox . In both cases, a flywheel can be added to modify the inertia of the overall system from 1 to 8 kg m2.
2.1 SETUP
2.1.1 Wave Energy Converter Emulator The Matlab-Simulink model has to be compiled and run in dSPACE to emulate the behavior of the system including turbine. The dSPACE permits to interface the simulated parts with the real parts of the HIL. In this case the hardware interface of dSPACE is used to read the rotational speed of the turbine and to apply the output torque to the shaft. Using this approach, each type of energy converter that uses a rotating generator can be emulated.
Infrastructure Access Report: MORE
Rev. 03, 21-Mar-2014 Page 13 of 38
Matlab-SimulinkWEC + Turbine
Model
dSPACE
From motor shaft To motor control
ωr Tm dSPACE
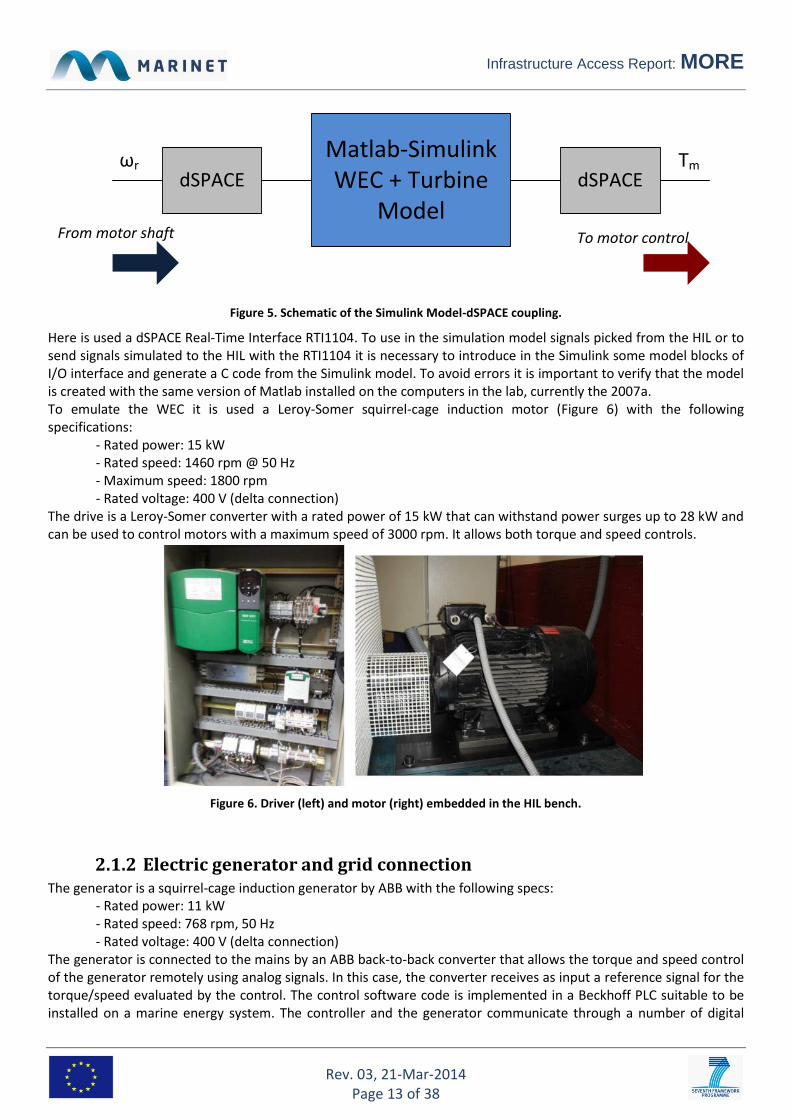
Figure 5. Schematic of the Simulink Model-dSPACE coupling.
Here is used a dSPACE Real-Time Interface RTI1104. To use in the simulation model signals picked from the HIL or to send signals simulated to the HIL with the RTI1104 it is necessary to introduce in the Simulink some model blocks of I/O interface and generate a C code from the Simulink model. To avoid errors it is important to verify that the model is created with the same version of Matlab installed on the computers in the lab, currently the 2007a. To emulate the WEC it is used a Leroy-Somer squirrel-cage induction motor (Figure 6) with the following specifications:
- Rated power: 15 kW - Rated speed: 1460 rpm @ 50 Hz - Maximum speed: 1800 rpm - Rated voltage: 400 V (delta connection)
The drive is a Leroy-Somer converter with a rated power of 15 kW that can withstand power surges up to 28 kW and can be used to control motors with a maximum speed of 3000 rpm. It allows both torque and speed controls.
Figure 6. Driver (left) and motor (right) embedded in the HIL bench.
2.1.2 Electric generator and grid connection The generator is a squirrel-cage induction generator by ABB with the following specs:
- Rated power: 11 kW - Rated speed: 768 rpm, 50 Hz - Rated voltage: 400 V (delta connection)
The generator is connected to the mains by an ABB back-to-back converter that allows the torque and speed control of the generator remotely using analog signals. In this case, the converter receives as input a reference signal for the torque/speed evaluated by the control. The control software code is implemented in a Beckhoff PLC suitable to be installed on a marine energy system. The controller and the generator communicate through a number of digital
Infrastructure Access Report: MORE
Rev. 03, 21-Mar-2014 Page 14 of 38
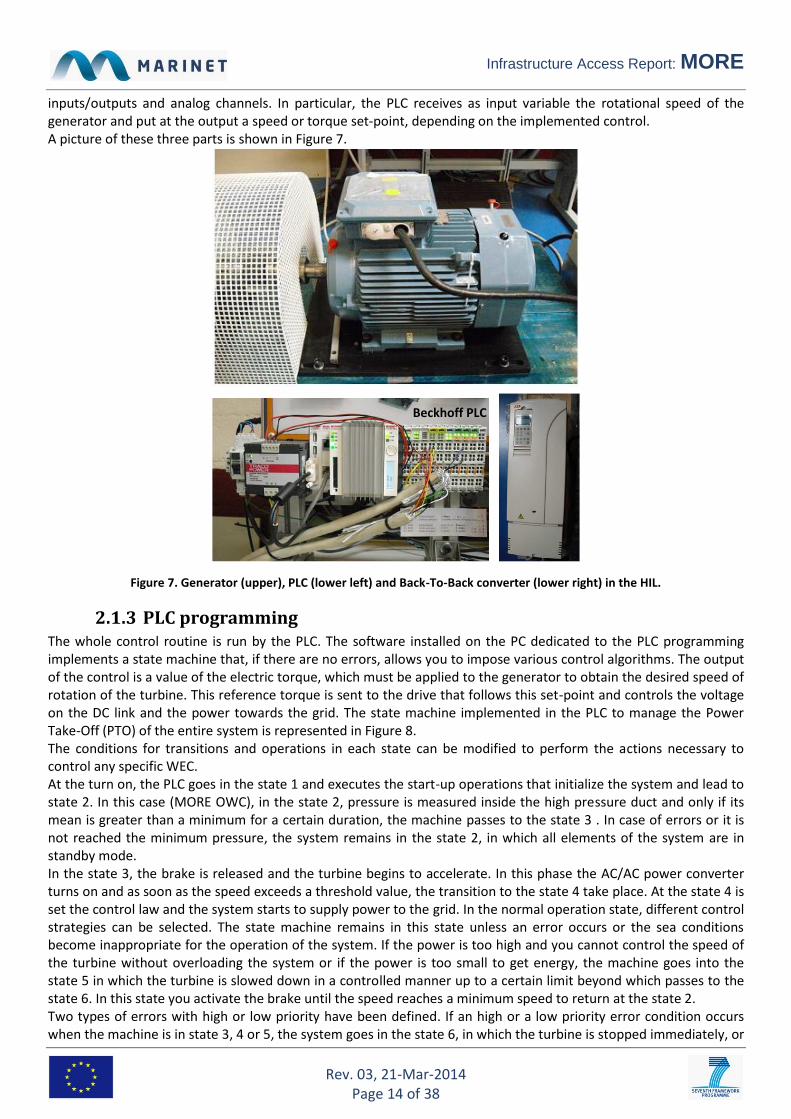
inputs/outputs and analog channels. In particular, the PLC receives as input variable the rotational speed of the generator and put at the output a speed or torque set-point, depending on the implemented control. A picture of these three parts is shown in Figure 7.
Beckhoff PLC
Figure 7. Generator (upper), PLC (lower left) and Back-To-Back converter (lower right) in the HIL.
2.1.3 PLC programming The whole control routine is run by the PLC. The software installed on the PC dedicated to the PLC programming implements a state machine that, if there are no errors, allows you to impose various control algorithms. The output of the control is a value of the electric torque, which must be applied to the generator to obtain the desired speed of rotation of the turbine. This reference torque is sent to the drive that follows this set-point and controls the voltage on the DC link and the power towards the grid. The state machine implemented in the PLC to manage the Power Take-Off (PTO) of the entire system is represented in Figure 8. The conditions for transitions and operations in each state can be modified to perform the actions necessary to control any specific WEC. At the turn on, the PLC goes in the state 1 and executes the start-up operations that initialize the system and lead to state 2. In this case (MORE OWC), in the state 2, pressure is measured inside the high pressure duct and only if its mean is greater than a minimum for a certain duration, the machine passes to the state 3 . In case of errors or it is not reached the minimum pressure, the system remains in the state 2, in which all elements of the system are in standby mode. In the state 3, the brake is released and the turbine begins to accelerate. In this phase the AC/AC power converter turns on and as soon as the speed exceeds a threshold value, the transition to the state 4 take place. At the state 4 is set the control law and the system starts to supply power to the grid. In the normal operation state, different control strategies can be selected. The state machine remains in this state unless an error occurs or the sea conditions become inappropriate for the operation of the system. If the power is too high and you cannot control the speed of the turbine without overloading the system or if the power is too small to get energy, the machine goes into the state 5 in which the turbine is slowed down in a controlled manner up to a certain limit beyond which passes to the state 6. In this state you activate the brake until the speed reaches a minimum speed to return at the state 2. Two types of errors with high or low priority have been defined. If an high or a low priority error condition occurs when the machine is in state 3, 4 or 5, the system goes in the state 6, in which the turbine is stopped immediately, or

Infrastructure Access Report: MORE
Rev. 03, 21-Mar-2014 Page 15 of 38
in the state 5 that gives way to a controlled slowdown respectively. In both cases, once the turbine has been stopped, the system returns to state 2. The PLC can handle a variety of analog and digital inputs, that can be custom configured, allowing to implement different control strategies and to evaluate different WEC.
STATE 1BOOT
STATE 2STANDBY
Boot time elapsed
STATE 3RUN UP
Standby time elapsed &
Mean chamber pressure > Lower Limit
STATE 4NORMAL
OPERATION
STATE 5RUN DOWN
STATE 6BRAKE
Turbine speed > Production speed Limit
Low
prio
rity e
rror
High priority error
High priority error
Turbine speed < Breaking Limit
Low priority error
High priority error
Turbine speed < Production speed limit
orChamber pressure > Higher Limit
Turbine speed < Standby speed limit
S1BOOT
System initialisation, all equipment in stand-by position
S2STANDBY
Turbine brake applied
S3RUN UP
Release brake and switching on equipment
S4NORMAL
OPERATION
Production mode following turbine control algorithm
S5RUN DOWN
Controlled run down algorithm
S6BRAKE
Apply brake to the turbine
Figure 8. State machine implemented by the PLC to control the generator.
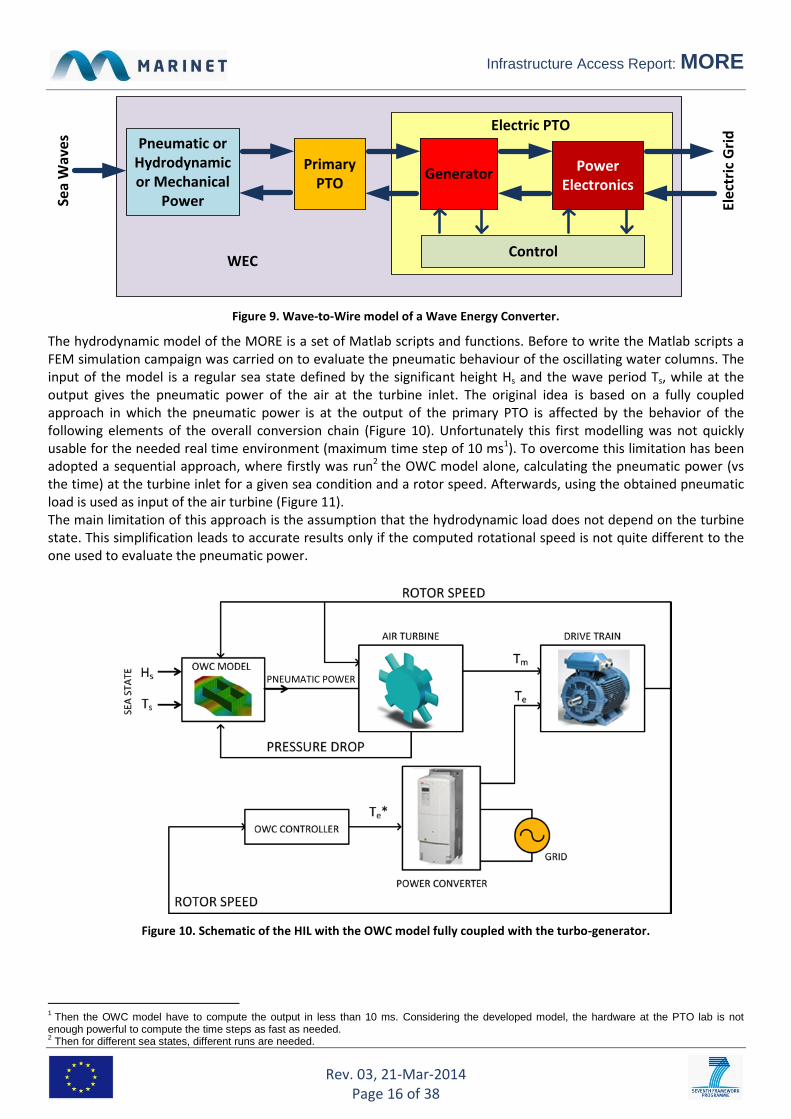
2.1.4 Wave-to-Wire model The Wave-to-Wire model is used to represent the overall behavior of the WEC following the flow of power conversion from the kinetic energy of the sea waves to the grid (Figure 9). Although the electronic power acts only in the last stage of conversion, for the development of the converter is good to have the whole transformation chain. In particular, the study was focused on the implementation of the hydrodynamic model of the primary Power Take Off and the turbines modelling.
Infrastructure Access Report: MORE
Rev. 03, 21-Mar-2014 Page 16 of 38
Sea
Wav
es
Ele
ctri
c G
rid
Pneumatic orHydrodynamicor Mechanical
Power
PrimaryPTO
Generator PowerElectronics
Control
Electric PTO
WEC
Figure 9. Wave-to-Wire model of a Wave Energy Converter.
The hydrodynamic model of the MORE is a set of Matlab scripts and functions. Before to write the Matlab scripts a FEM simulation campaign was carried on to evaluate the pneumatic behaviour of the oscillating water columns. The input of the model is a regular sea state defined by the significant height Hs and the wave period Ts, while at the output gives the pneumatic power of the air at the turbine inlet. The original idea is based on a fully coupled approach in which the pneumatic power is at the output of the primary PTO is affected by the behavior of the following elements of the overall conversion chain (Figure 10). Unfortunately this first modelling was not quickly usable for the needed real time environment (maximum time step of 10 ms1). To overcome this limitation has been adopted a sequential approach, where firstly was run2 the OWC model alone, calculating the pneumatic power (vs the time) at the turbine inlet for a given sea condition and a rotor speed. Afterwards, using the obtained pneumatic load is used as input of the air turbine (Figure 11). The main limitation of this approach is the assumption that the hydrodynamic load does not depend on the turbine state. This simplification leads to accurate results only if the computed rotational speed is not quite different to the one used to evaluate the pneumatic power.
Figure 10. Schematic of the HIL with the OWC model fully coupled with the turbo-generator.
1 Then the OWC model have to compute the output in less than 10 ms. Considering the developed model, the hardware at the PTO lab is not
enough powerful to compute the time steps as fast as needed. 2 Then for different sea states, different runs are needed.
PNEUMATIC POWER

Infrastructure Access Report: MORE
Rev. 03, 21-Mar-2014 Page 17 of 38
Figure 11. HIL schematic with pneumatic power generated by the OWC without influence of turbo-generator and the power control.
The Simulink model of the electric PTO considered for the MORE is depicted in Figure 12 The pneumatic power comes from the off-line simulation of the WEC as mentioned above, the Control law block gives the electric torque reference for the generator from the rotational speed of the turbine, the Drive Train block models the electric generator, while the Wind Turbine block models the chosen turbine giving the mechanical torque applied by the turbine to the shaft from the wind speed and the rotational speed. The power electronics (Back-to-Back) is assumed ideal (with no losses).
Figure 12. Simulink model of the electric PTO.
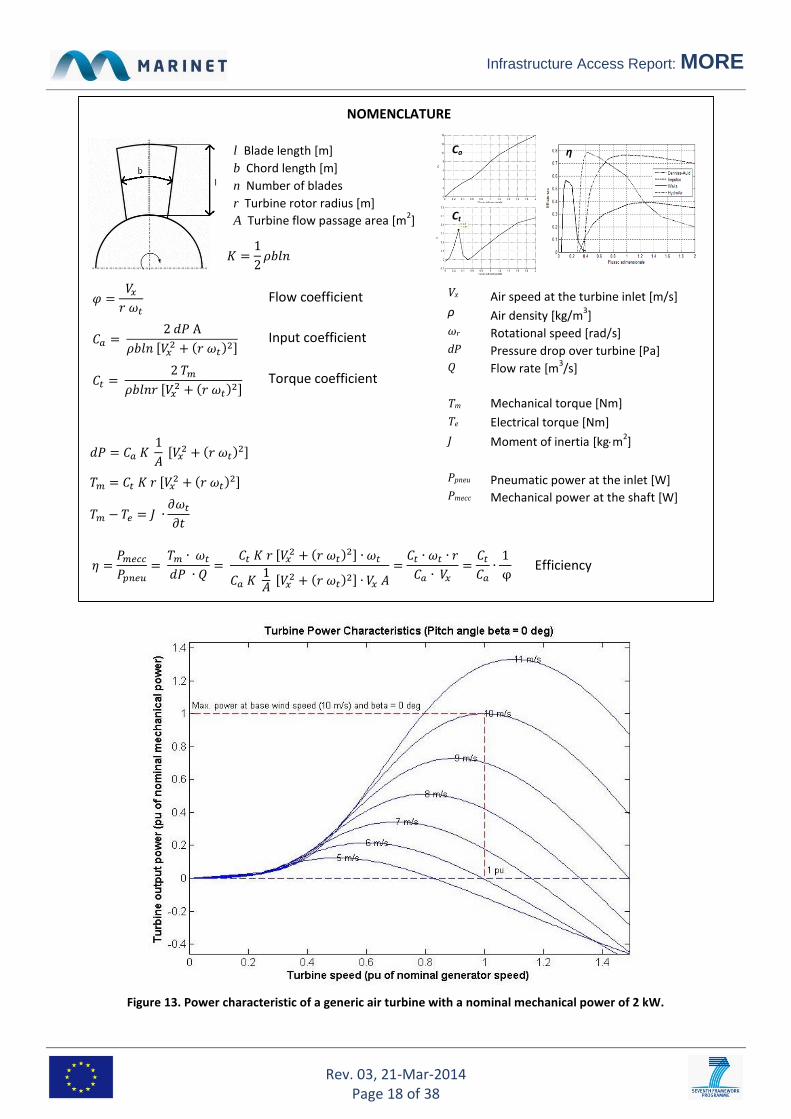
2.1.5 Wind turbines modeling Depending on the chosen turbine, the setup model in Simulink was different. Three different models have been adopted. The nominal mechanical output power was choose to be 2 kW. Then a first kind of turbine tested was a unidirectional turbine with the power characteristic of Figure 13. In this case the model of the turbine to embed in the model of Figure 12 is the one of Figure 14.
Infrastructure Access Report: MORE
Rev. 03, 21-Mar-2014 Page 18 of 38
FLUSSO ADIMENSIONALE
COEFF. DI PRESSIONE
COEFF. DI COPPIA
Vx Velocità dell’aria incidente (m/s)
ρ Densità dell’aria (Kg/m3)
ωr Velocità angolare del rotore (rad/s)
dP Caduta di pressione sulla turbina (Pa)
Q Portata (m3/s)
Tm Coppia meccanica della turbina (N∙ m)
Te Coppia elettrica del generatore (N∙ m)
J Momento di inerzia del sistema (Kg m2)
Ppneu Potenza pneumatica in ingresso (W)
Pmecc Potenza meccanica in uscita (W)
EFFICIENZA DI CONVERSIONE
CADUTA DI PRESSIONE
COPPIA MECCANICA
l Lunghezza della pala (m)
b Lunghezza della corda (m)
n Numero delle pale
r Raggio medio (m)
A Area tubo di flusso (m2)
MODELLO MATEMATICO TURBINE SELF-RECTIFYING PER OWC
Ca
Ct
η
Figure 13. Power characteristic of a generic air turbine with a nominal mechanical power of 2 kW.
l Blade length [m]
b Chord length [m]
n Number of blades
r Turbine rotor radius [m]
A Turbine flow passage area [m2]
Flow coefficient
Input coefficient
Torque coefficient
Efficiency
Air speed at the turbine inlet [m/s]
Air density [kg/m3]
Rotational speed [rad/s]
Pressure drop over turbine [Pa]
Flow rate [m3/s]
Mechanical torque [Nm]
Electrical torque [Nm]
Moment of inertia [kgm2]
Pneumatic power at the inlet [W]
Mechanical power at the shaft [W]
NOMENCLATURE
Infrastructure Access Report: MORE
Rev. 03, 21-Mar-2014 Page 19 of 38
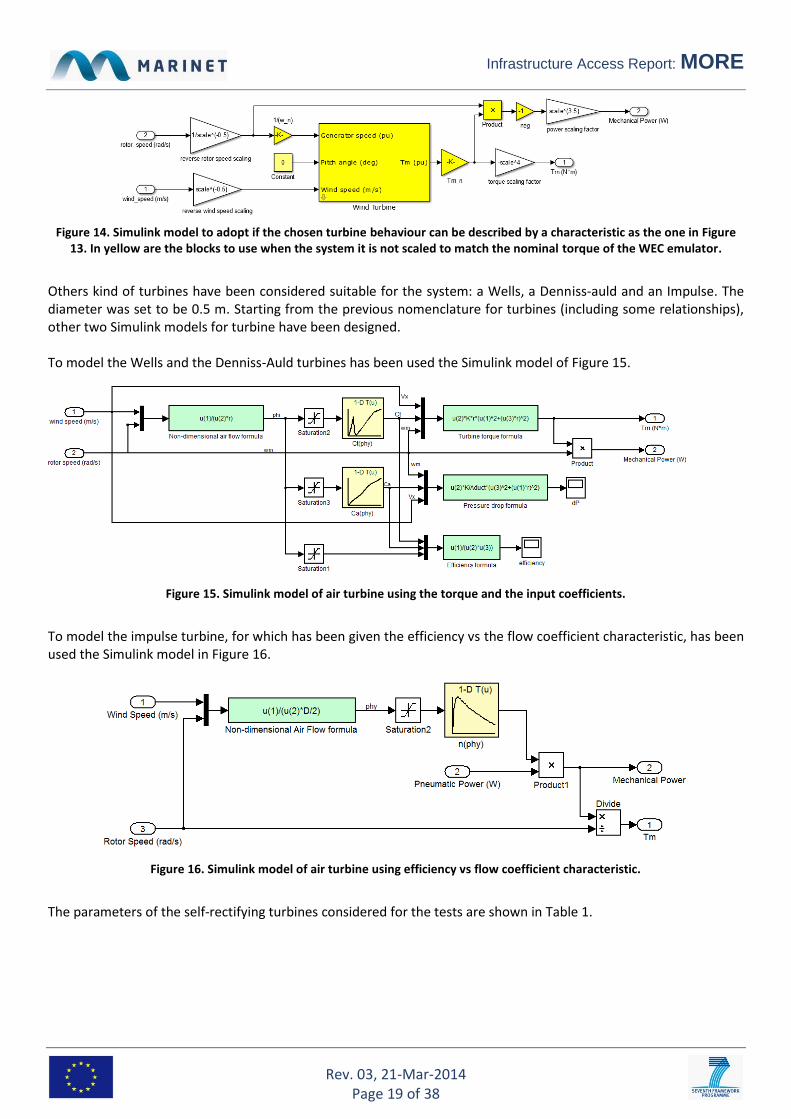
Figure 14. Simulink model to adopt if the chosen turbine behaviour can be described by a characteristic as the one in Figure 13. In yellow are the blocks to use when the system it is not scaled to match the nominal torque of the WEC emulator.
Others kind of turbines have been considered suitable for the system: a Wells, a Denniss-auld and an Impulse. The diameter was set to be 0.5 m. Starting from the previous nomenclature for turbines (including some relationships), other two Simulink models for turbine have been designed. To model the Wells and the Denniss-Auld turbines has been used the Simulink model of Figure 15.
Figure 15. Simulink model of air turbine using the torque and the input coefficients.
To model the impulse turbine, for which has been given the efficiency vs the flow coefficient characteristic, has been used the Simulink model in Figure 16.
Figure 16. Simulink model of air turbine using efficiency vs flow coefficient characteristic.
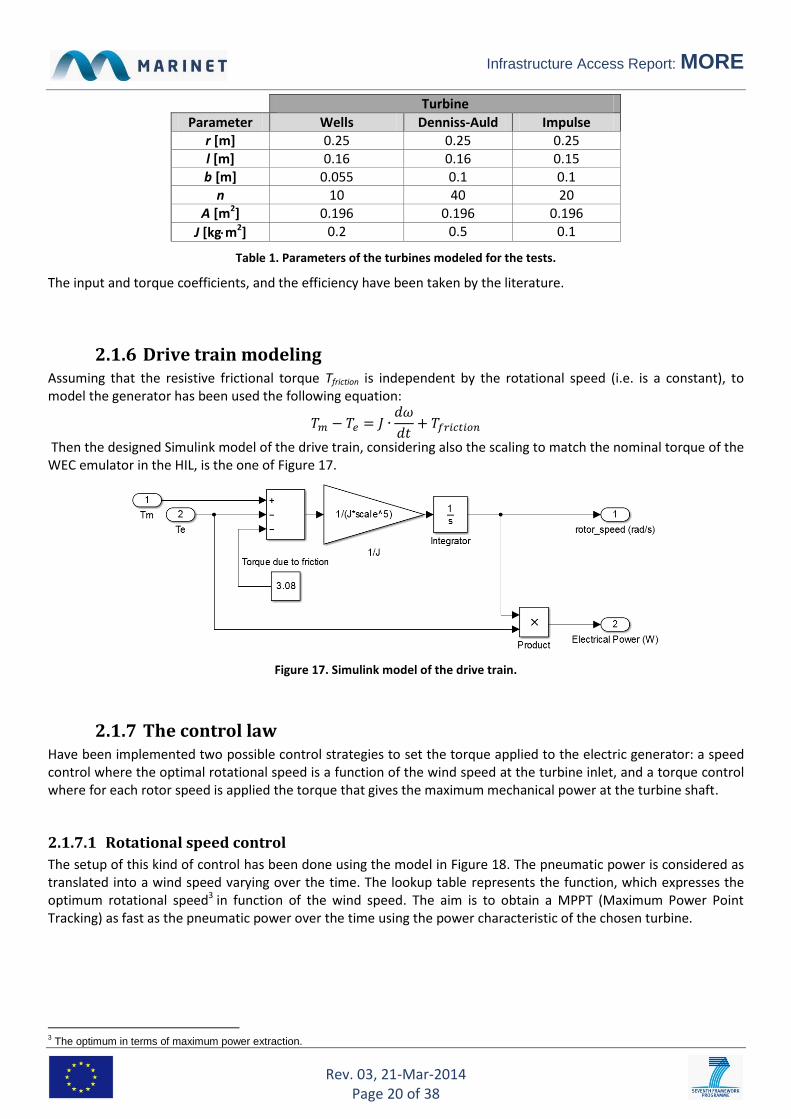
The parameters of the self-rectifying turbines considered for the tests are shown in Table 1.
Infrastructure Access Report: MORE
Rev. 03, 21-Mar-2014 Page 20 of 38
Turbine
Parameter Wells Denniss-Auld Impulse r [m] 0.25 0.25 0.25 l [m] 0.16 0.16 0.15 b [m] 0.055 0.1 0.1
n 10 40 20 A [m2] 0.196 0.196 0.196
J [kgm2] 0.2 0.5 0.1
Table 1. Parameters of the turbines modeled for the tests.
The input and torque coefficients, and the efficiency have been taken by the literature.
2.1.6 Drive train modeling Assuming that the resistive frictional torque Tfriction is independent by the rotational speed (i.e. is a constant), to model the generator has been used the following equation:
Then the designed Simulink model of the drive train, considering also the scaling to match the nominal torque of the WEC emulator in the HIL, is the one of Figure 17.
Figure 17. Simulink model of the drive train.
2.1.7 The control law Have been implemented two possible control strategies to set the torque applied to the electric generator: a speed control where the optimal rotational speed is a function of the wind speed at the turbine inlet, and a torque control where for each rotor speed is applied the torque that gives the maximum mechanical power at the turbine shaft.
2.1.7.1 Rotational speed control
The setup of this kind of control has been done using the model in Figure 18. The pneumatic power is considered as translated into a wind speed varying over the time. The lookup table represents the function, which expresses the optimum rotational speed3 in function of the wind speed. The aim is to obtain a MPPT (Maximum Power Point Tracking) as fast as the pneumatic power over the time using the power characteristic of the chosen turbine.
3 The optimum in terms of maximum power extraction.

Infrastructure Access Report: MORE
Rev. 03, 21-Mar-2014 Page 21 of 38
Figure 18. Simulink model of the subsystem “turbine+generator+back-to-back converter” with optimum rotational speed control for MPPT.
The control, consist of two concentric closed loops, as shown in Figure 19.
wmeasureed
Figure 19. Control and controlled parts of the Simulink model in Figure 18.
The closed-loop speed control must ensure an appropriate dynamic in response to the reference speed changes and has to compensate for the presence of any external disturbances on the torque. The block diagram of the closed-loop speed control is shown in Figure 20. Once set the PI controller of the closed-loop Iq control, so that the this closed-loop can be seen as ideal by the more external closed-loop, for the proper operation of the speed control (e.g. a band of 3162 rad/s and a phase margin of 85.5°) were set Kp = 10 and Ki = 100.
Generator
Figure 20. Iq and w control loops of the Simulink model in Figure 18.

Infrastructure Access Report: MORE
Rev. 03, 21-Mar-2014 Page 22 of 38
Running the scaled model of Figure 21, the torques behaviours are the ones in Figure 22.
Figure 21. Simulink model with rotor speed control scaled to match the nominal torque of the WEC emulator.
Figure 22. Electrical (red) and mechanical (green) torque resulting from a simulation of the model in Figure 21.
The variations of the electrical torque are wide, so we chose not to apply it as it is. Further investigations are needed before to apply this kind of control.
2.1.7.2 Torque control
To get a more reliable mechanical behaviour of the HIL has been developed a model with a torque control law as shown in Figure 23.

Infrastructure Access Report: MORE
Rev. 03, 21-Mar-2014 Page 23 of 38
Figure 23. Simulink model with torque control.
The optimum torque function is obtained by the power characteristic of the turbine at the rotational speed where the power is maximum (MPPT). In this way the torque variations are smaller than those that occur with the speed control. The optimum torque function in Figure 23 is the one for the Wells turbine here considered. Different optimum torque functions have been used for the Denniss-Auld and the Impulse turbines.
2.1.1 Scaling, compensations and adaptations The MORE does not match the equipment of the laboratory (motor, inverter, ...). To get a consistent relationship between the HIL and the models of the MORE, it is necessary to adapt the Simulink models to account for the deviations from the test bench. Ideally the ratio between the forces of the scaled/adapted model and that of the real prototype has to be maintained for all the forces (inertial, gravitational, viscous, elastic and pressure). This is impossible when the scale factor is not unitary. In all other cases, it is possible to determine the dominant forces in the system and try to keep their relationship. The behavior of the waves is closely related to the gravity, therefore the use of the Froude law, that preserves the relationship between inertial and gravitational forces, is a good solution for the scaling of the models as done in the one depicted in Figure 24.
Figure 24. Simulink model to emulate the WEC in the used HIL with scaling, compensations and adaptations.
In this case, the necessary scaling, compensations and adaptions made on the original models are shown in Figure 25.

Infrastructure Access Report: MORE
Rev. 03, 21-Mar-2014 Page 24 of 38
Torque compensator
testbenchn
FSscaledn
scaled
testbenchV
J
J
,
,
w
w
Torque adapter
43.277.97
1
Calibration LUT
END
START
Scaling factor λ evaluation
4
,
,
turbinen
testbenchn
T
T
Time scaling factor = λ0.5
Power scaling factor = λ3.5
PNEUMATIC INPUT
Moment of inertia scaling factor = λ5
Area scaling factor = λ2
OU
TPU
T Torque scaling factor = λ4
INP
UT
Power scaling factor = λ3.5
Rotor speed scaling factor = 1/λ-0.5
Wind speed scaling factor = 1/λ0.5
CONSTANTS
VARIABLES
FRO
UD
E SC
ALI
NG
ADJUSTMENTS/ADAPTATIONS
Speed adapter
FS
scaledn
V
,w
Figure 25. Flow-chart of the scaling, compensations and adaptations applied to the original models of the MORE.

Infrastructure Access Report: MORE
Rev. 03, 21-Mar-2014 Page 25 of 38
The scaling factor was defined in order to adjust the nominal torque of the turbine model used for the simulations
Tn, turbine to that of the test bench in the laboratory, Tn,test bench. Then, the scaling factor can be evaluated from the relation :
√
.
Once computed , if we wish to use the pneumatic power scaled to the HIL values, variables and constant can be scaled applying the Froude’s law at the output of the original blocks, while at the input the same have to be scaled using the inverse formulas. Beyond the scaling, others adjustments have to do to match the values of some entity such as the rotational speed or the torque reference with the electric that represent them at the dSPACE interface or at the PLC. For example, assuming VFS to be the analog the full scale range of the rotational speed signal4. The same consideration have been applied to the torque, but in this case is the simulated signal that have to be adapted to the electrical one applied to the dSPACE interface. Before this adaptation a torque compensation has been applied due to the both the different inertia and different nominal rotational speed of the bench and the ones of the MORE.
2.2 TESTS In this section will be described the work carried on at the PTO lab. During the first phase of the MORE project, after some discussion about turbines modelling, the acquisition of more detailed information and a few days spent learning to use the bench, has been prepared the test plan as a basis for the tests which has been followed. The next phases were over in order to be able to obtain a more clear correlation between simulations and the experiments at laboratory and to compare the behaviour of the power converter using different turbines. Unfortunately, the first test done in the lab with a self-consistent model of the WEC (sea state and PTO primary coupled with the state of turbine operation), did not give satisfactory results due to the capabilities of the computer available. So, the strategy to emulate the WEC has been revisited respect the original plan, using off-line WEC simulations. At the start, some tests were carried on just to verify if the new model works well and to learn more about the use of the HIL bench. After these tests, has been drawn a new plan. The tests were carried on as shown below.
2.2.1 Test Plan The tests that have been useful for the intended purposes are summarized in Table 2.
4 In this case VFS = 1 V.

Infrastructure Access Report: MORE
Rev. 03, 21-Mar-2014 Page 26 of 38
Test ID Description Sea state
(regular waves) Hs [m], Ts [s]
#1 - #6 Use of the HIL bench learning -
#7 - #9 Attempts of self-consistent model with real-time application on the HIL bench -
#10 - #11 Defining the scaling/adaptation/compensation process -
#12 Model with a generic 2 kW wind turbine and pneumatic power obtained by WEC simulations with a Wells turbine rotating at 100, 200, 300 and 400 rad/s.
0.6, 3.1
0.8, 3.6
1.0, 4.0
1.2, 4.4
1.4, 4.7
1.6, 5.1
#13 Attempt using the model with a generic 2 kW wind turbine and pneumatic power obtained by WEC simulations with a Wells turbine and a friction that doesn’t match the actual of the bench.
-
#14 Model with a Wells turbine and pneumatic power obtained by WEC simulations with the same turbine rotating at 100, 200, 300 and 400 rad/s.
0.6, 3.1
0.8, 3.6
1.0, 4.0
1.2, 4.4
1.4, 4.7
1.6, 5.1
#15 Model with a Denniss-Auld turbine and pneumatic power obtained by WEC simulations with the Wells turbine rotating at 100, 200, 300 and 400 rad/s.
0.6, 3.1
0.8, 3.6
1.0, 4.0
1.2, 4.4
1.4, 4.7
1.6, 5.1
#16 Model with an Impulse turbine and pneumatic power obtained by WEC simulations with the Wells turbine rotating at 100, 200, 300 and 400 rad/s.
0.6, 3.1
0.8, 3.6
1.0, 4.0
1.2, 4.4
1.4, 4.7
1.6, 5.1
#17 Model with an Impulse turbine and pneumatic power obtained by WEC simulations with the same turbine rotating at 100 rad/s.
0.6, 3.1
0.8, 3.6
1.0, 4.0
1.2, 4.4
1.4, 4.7
1.6, 5.1
#18 - #19 Attempts using a model with MPPT speed control -
Table 2. Tests carried out.
The pneumatic powers obtained by off line simulations of the WEC with the Wells turbine have been taken as input for all the models to emulate the WEC in the HIL bench. This simplification shorts time needed for the off line simulations5. At this stage, to a first approximation, it is not strictly necessary to use the pneumatic power obtained with simulation considering the same turbine emulated in the HIL bench. As shown in Figure 26, the behaviours of the two pneumatic powers taken as example are similar (almost the same maximum values and gradients over the time). Although the mean powers in steady-state are different (with the Impulse turbine, the pneumatic power is around 10% less), the efficiency of the controlled6 turbo-generator is the same (around 0.58).
5 Each one of them requires a considerable amount of time.
6 With the torque law.

Infrastructure Access Report: MORE
Rev. 03, 21-Mar-2014 Page 27 of 38
Figure 26. Comparison of the pneumatic powers obtained from off line simulations of the WEC with the Wells turbine (red
trace) and the Impulse turbine with Hs=1.2 m and w=100 rad/s. Once the transient has finished (between 20 and 30 sec), the mean powers are 3.12 kW and 2.86 kW for the WECs with the Wells and the Impulse turbines respectively.
2.3 RESULTS Let <Pneumatic Power> the mean pneumatic power at the inlet of the turbine, <Mechanical Power> the mean power at the shaft of the turbine and <Electrical Power> the mean power at the output of the electric generator, then it is possible to define three efficiencies of the electric PTO:
The efficiencies measured by the tests #14, #15 and #16 are summarized in Table 3.
Turbine
Wave Efficiency Wells Denniss-Auld Impulse
H=1.6 m, T=5.1 s
turb 0.56 0.45 0.65
el 0.91 0.92 0.94
tot 0.5 0.42 0.61
H=1.4 m, T=4.7 s
turb 0.56 0,46 0,65
el 0,91 0,93 0,92
tot 0,51 0,43 0,6
H=1.2 m, T=4.4 s
turb 0,56 0,47 0,65
el 0,87 0,93 0,89
tot 0,49 0,44 0,58
H=1 m, T=4 s
turb 0,54 0,49 0,66
el 0,82 0,98 0,83
tot 0,44 0,48 0,54
H=0.8 m, T=3.6 s
turb 0,54 0,48 0,67
el 0,82 0,99 0,75
tot 0,44 0,47 0,5
H=0.6 m, T=3.1 s
turb 0,48 0,43 0,71
el 0,66 0,93 0,57
tot 0,32 0,4 0,4
Table 3. Efficiencies measured by tests #14, #15 and #16.

Infrastructure Access Report: MORE
Rev. 03, 21-Mar-2014 Page 28 of 38
The results obtained by the runs of test #12 are not compared with the ones of Table 3, because of the air turbine considered isn’t designed for the MORE, i.e. its power characteristic is not resulting from a sizing for an entrance diameter of 50 cm or from geometrical choices on the blades. Probably, for this reason, the measured efficiencies in this case are lower than the ones of Table 3. As example, the obtained data by a sea state with Hs=1.4 m and Ts=4.7 s are the ones shown in Figure 27.
Figure 27. Measured and simulated powers, torques and rotational speed with the generic air turbine (test #12, sea state Hs=1.4 m, Ts=4.7 s), over a time interval in steady-state.
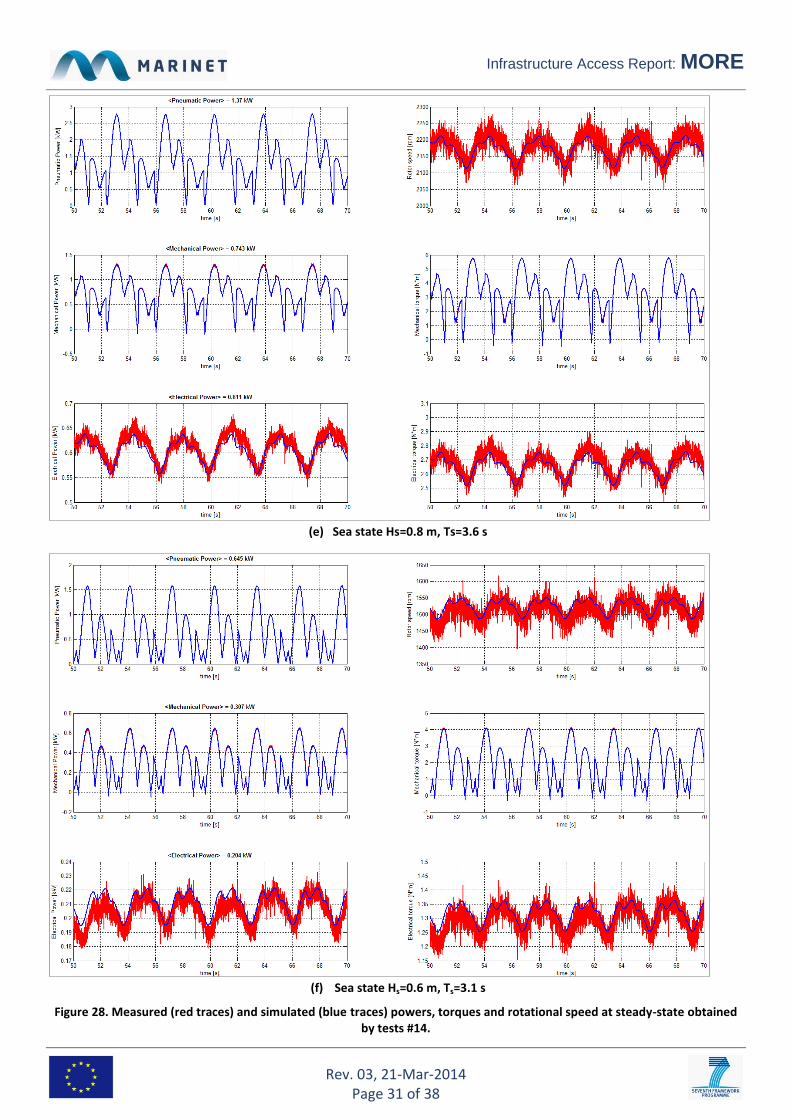
Considering a ducted turbine the performances are better. The behaviours of the observed powers, torques and rotational speed are similar for all the considered turbines, thus, for simplicity, here are shown (see charts of Figure 28) only the ones obtained by the model with the Wells turbine used for the test that had shown rotational speed as much as possible near to one considered for the applied pneumatic power obtained by off line simulations of the WEC.

Infrastructure Access Report: MORE
Rev. 03, 21-Mar-2014 Page 29 of 38
(a) Sea state Hs=1.6 m, Ts=5.1 s
(b) Sea state Hs=1.4 m, Ts=4.7 s

Infrastructure Access Report: MORE
Rev. 03, 21-Mar-2014 Page 30 of 38
(c) Sea state Hs=1.2 m, Ts=4.4 s
(d) Sea state Hs=1 m, Ts=4 s
Infrastructure Access Report: MORE
Rev. 03, 21-Mar-2014 Page 31 of 38
(e) Sea state Hs=0.8 m, Ts=3.6 s
(f) Sea state Hs=0.6 m, Ts=3.1 s
Figure 28. Measured (red traces) and simulated (blue traces) powers, torques and rotational speed at steady-state obtained by tests #14.
Infrastructure Access Report: MORE
Rev. 03, 21-Mar-2014 Page 32 of 38
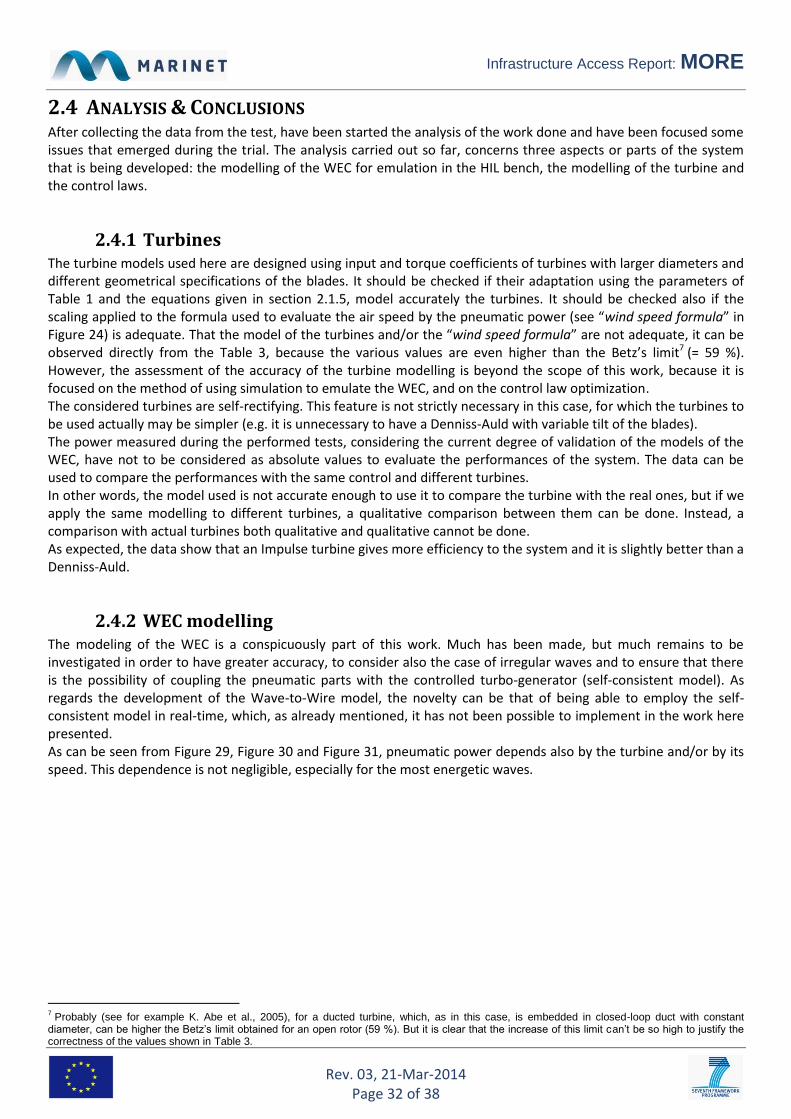
2.4 ANALYSIS & CONCLUSIONS After collecting the data from the test, have been started the analysis of the work done and have been focused some issues that emerged during the trial. The analysis carried out so far, concerns three aspects or parts of the system that is being developed: the modelling of the WEC for emulation in the HIL bench, the modelling of the turbine and the control laws.
2.4.1 Turbines The turbine models used here are designed using input and torque coefficients of turbines with larger diameters and different geometrical specifications of the blades. It should be checked if their adaptation using the parameters of Table 1 and the equations given in section 2.1.5, model accurately the turbines. It should be checked also if the scaling applied to the formula used to evaluate the air speed by the pneumatic power (see “wind speed formula” in Figure 24) is adequate. That the model of the turbines and/or the “wind speed formula” are not adequate, it can be observed directly from the Table 3, because the various values are even higher than the Betz’s limit7 (= 59 %). However, the assessment of the accuracy of the turbine modelling is beyond the scope of this work, because it is focused on the method of using simulation to emulate the WEC, and on the control law optimization. The considered turbines are self-rectifying. This feature is not strictly necessary in this case, for which the turbines to be used actually may be simpler (e.g. it is unnecessary to have a Denniss-Auld with variable tilt of the blades). The power measured during the performed tests, considering the current degree of validation of the models of the WEC, have not to be considered as absolute values to evaluate the performances of the system. The data can be used to compare the performances with the same control and different turbines. In other words, the model used is not accurate enough to use it to compare the turbine with the real ones, but if we apply the same modelling to different turbines, a qualitative comparison between them can be done. Instead, a comparison with actual turbines both qualitative and qualitative cannot be done. As expected, the data show that an Impulse turbine gives more efficiency to the system and it is slightly better than a Denniss-Auld.
2.4.2 WEC modelling The modeling of the WEC is a conspicuously part of this work. Much has been made, but much remains to be investigated in order to have greater accuracy, to consider also the case of irregular waves and to ensure that there is the possibility of coupling the pneumatic parts with the controlled turbo-generator (self-consistent model). As regards the development of the Wave-to-Wire model, the novelty can be that of being able to employ the self-consistent model in real-time, which, as already mentioned, it has not been possible to implement in the work here presented. As can be seen from Figure 29, Figure 30 and Figure 31, pneumatic power depends also by the turbine and/or by its speed. This dependence is not negligible, especially for the most energetic waves.
7 Probably (see for example K. Abe et al., 2005), for a ducted turbine, which, as in this case, is embedded in closed-loop duct with constant
diameter, can be higher the Betz’s limit obtained for an open rotor (59 %). But it is clear that the increase of this limit can’t be so high to justify the correctness of the values shown in Table 3.

Infrastructure Access Report: MORE
Rev. 03, 21-Mar-2014 Page 33 of 38
Figure 29. Mean pneumatic powers vs the rotational speed of the turbine obtained by off line simulations of the WEC with the Wells turbine at different sea states.
Figure 30. Pneumatic power obtained by a simulation of the WEC with Hs=1.6 m, Ts=5.1 s and considering the Wells
turbine rotating at constant speed of 100 rad/s.
Figure 31. Pneumatic power obtained by a simulation of the WEC with Hs=1.6 m, Ts=5.1 s and considering the Wells
turbine rotating at constant speed of 400 rad/s.
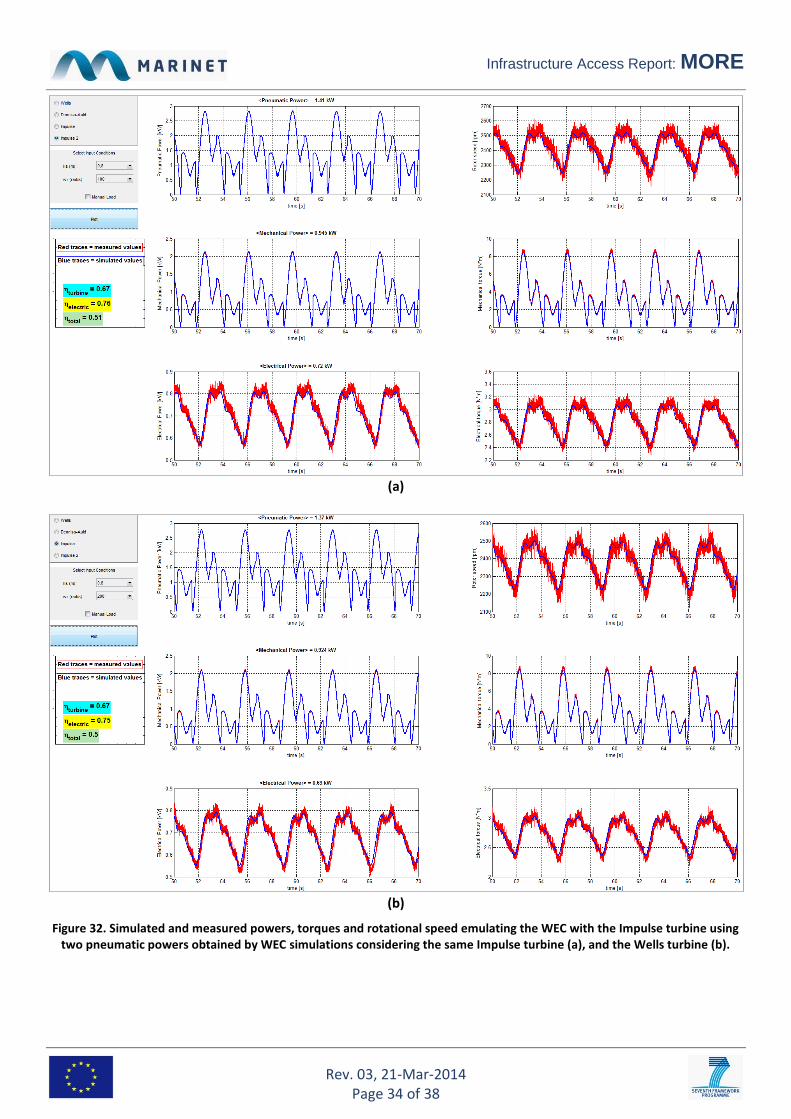
Therefore, when the pneumatic power to the turbine is pulsed with large variations, the use of a self-consistent model to emulate the WEC would make more accurate the entire Wave-to-Wire model. As regards the use of pneumatic powers resulting from off-line simulations of the WEC with the Wells turbine, it is observed that from the point of view of efficiencies there is no appreciable influence. As can be seen from the examples of the Figure 32 for the case of the Impulse turbine, even if the power levels are different, the efficiencies are not different.
Infrastructure Access Report: MORE
Rev. 03, 21-Mar-2014 Page 34 of 38
(a)
(b)
Figure 32. Simulated and measured powers, torques and rotational speed emulating the WEC with the Impulse turbine using two pneumatic powers obtained by WEC simulations considering the same Impulse turbine (a), and the Wells turbine (b).

Infrastructure Access Report: MORE
Rev. 03, 21-Mar-2014 Page 35 of 38
2.4.3 Control laws The torque control implemented, although based on a simple algorithm, appears to work well, responding to changes quickly. Transients that arise when the signals used as reference in the feedback move away from what you want, sell out in seconds. In Figure 28(f) you can see an example of this, in the time intervals 50-55 s and 59-63 s. By revising this strategy, the performances can be improved. The first attempt to apply a simple speed control with PI controller did not yield the desired results due to rapid and strong torque variations that actually make it unusable as it is. In the future we can try to implement a speed control more complex to make it applicable to the case study and comparable with the torque control.
2.4.4 Conclusions The amount of the work done has been remarkable. The experiments performed have allowed us to verify the validity of the method of application of the Wave-to-Wire modelling with pneumatic power generated by simulations. Experiments have confirmed that:
An Impulse turbine, rather than a Denniss-Auld with fixed blades, are more efficient than a Wells and more adequate to be used in a system like the MORE;
Considering simple strategies, the MPPT torque control is better than that of a speed control;
To emulate the WEC would be more accurate to use a self-consistent model that adapts in real-time the pneumatic power based on the state of the controlled turbo-generator.
For future tests, it will be necessary to assess if the wind speed at the turbine inlet is evaluated in the right way, and it will be better to use more accurate turbine modelling.
The information derived from the analysis of the data, yet to be explored fully, will be valuable for the future developments of the MORE.

Infrastructure Access Report: MORE
Rev. 03, 21-Mar-2014 Page 36 of 38
3 MAIN LEARNING OUTCOMES For the research group of the MORE project, the lessons learned from the work here presented are many. These and the progresses are better specified below.
3.1 PROGRESS MADE Compared to the plan provided for this access, the progress made are the development of the first simple control laws of the turbo-generator, as well as in the development of a model for emulation of the WEC in a HIL bench. This work can be useful also to choose the optimum turbine for the MORE system.
3.1.1 Progress Made: For This User-Group or Technology This round of experiments has provided a basic know-how on WECs, OWCs, ducted turbines and HIL test
bench for power electronics.
Two control strategies have been studied.
The behaviour of a control scheme in simulated environment has been investigated and tested using an HIL test bench with different turbines and regular sea states.
Some issues have been identified, which need to be investigated for further improvement of the control schemes.
A data set has been gathered, which will be used for further improvement of the controller.
3.1.1.1 Next Steps for Research or Staged Development Plan – Exit/Change & Retest/Proceed?
The next steps will concern the improvement of the models and the next issues will be:
Further evaluation of the gathered data.
Tuning of controllers and models.
Preparation of models with pneumatic load coupled in a self-consistent way with the turbo-generator.
Controllers for further tests on prototypes.
3.1.2 Progress Made: For Marine Renewable Energy Industry For the marine renewable energy industry can be interesting the approach used for the Wave-to-Wire modelling to design the power electronics controls. The WEC emulation based on simulations instead of measurements by prototypes, can help in saving time and costs during the design of WEC’s optimum power electronics.
3.2 KEY LESSONS LEARNED The key lessons learned can be summarized as follows:
Work that requires interdisciplinary knowledge needs to be addressed in cooperation with who got skills to compensate for the shortcomings of the members of the research group
Simplicity in setup has proven essential and worked well to acquire know how
An energy yield increase by application of advanced control schemes can be realized.
Special characteristics of down-scaled models (friction, scaling of the wave period time) can play a major role in the context of control.
Consideration of advanced control schemes for full-scale real sea applications seems reasonable, but further R&D is required.
3.3 SCIENTIFIC PUBLICATIONS Currently further evaluation of the data, gathered during the testing, is conducted. The final results will be presented in a scientific paper.

Infrastructure Access Report: MORE
Rev. 03, 21-Mar-2014 Page 37 of 38
3.4 WEBSITE & SOCIAL MEDIA Website: www.seabreath.it YouTube Link(s): -- LinkedIn/Twitter/Facebook Links: -- Online Photographs Link: --
4 REFERENCES J. Falnes, “Ocean waves and oscillating systems”, Cambridge University Press, 2004.
P. Ruol, L. Martinelli, P. Pezzuto, “Multi-chamber OWC devices to reduce and convert wave energy in harbor entrance and inner channels“, Proceedings of the Twenty-first (2011) International Offshore and Polar Engineering Conference, Maui, Hawaii, USA, June 19-24, 2011.
L. Martinelli, P. Ruol, G. Cortellazzo, “On mooring design of wave energy converters: the Seabreath application”, Proceedings of 33rd Conference on Coastal Engineering,.Santander (Spain),July 1‐6 2012.
M. Alberdi, M. Amundarain, A.J. Garrido, I. Garrido, F.J. Sainz, "Control of Oscillating Water Column-based wave power generation plants for grid connection", 20th Mediterranean Conference on Control & Automation, pp.1485,1490, July 2012.
S. Ceballos, J. Rea, I. Lopez, J. Pou, E. Robles, D.L. O'Sullivan, "Efficiency Optimization in Low Inertia Wells Turbine-Oscillating Water Column Devices", IEEE Transactions on Energy Conversion, vol.28, no.3, pp.553-564, Sept. 2013.
J. P. Kofoed, P. Frigaard, “Hydraulic evaluation of the LEANCON wave energy converter”, DCE Technical Report No. 45, Aalborg University – Department of Civil Engineering, ISSN 1901-726X, 2008.
5 APPENDICES
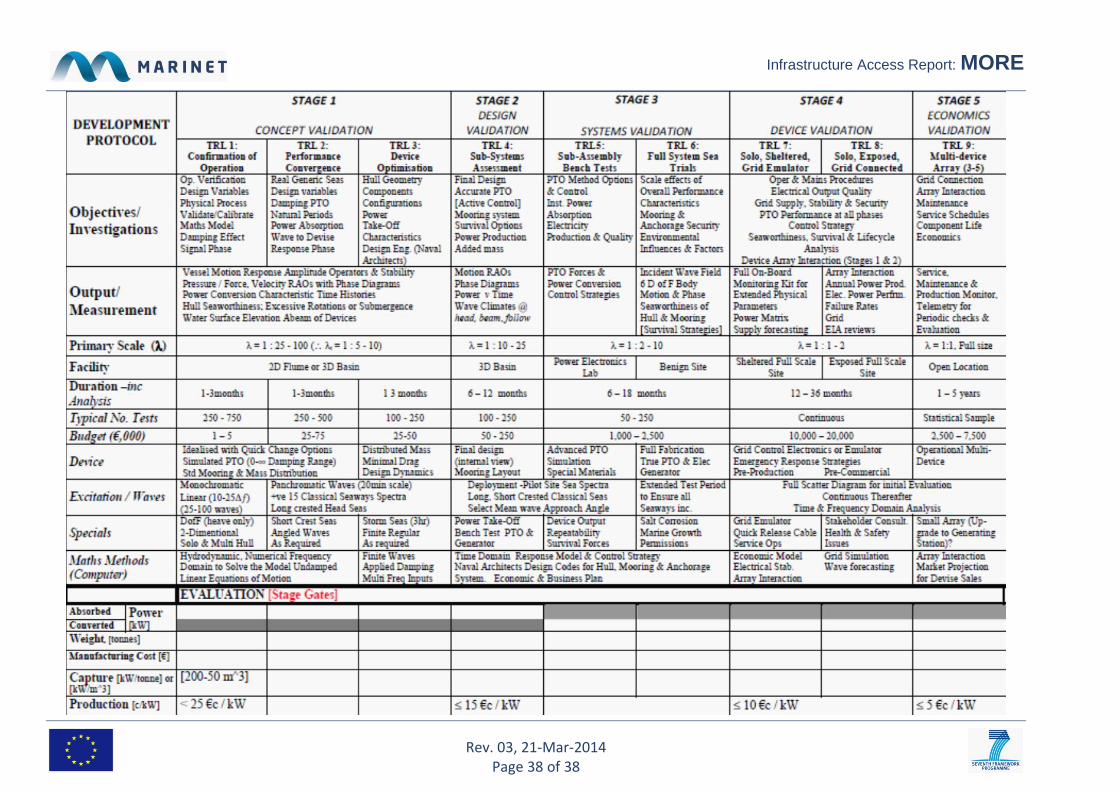
5.1 STAGE DEVELOPMENT SUMMARY TABLE The table following offers an overview of the test programmes recommended by IEA-OES for each Technology Readiness Level. This is only offered as a guide and is in no way extensive of the full test programme that should be committed to at each TRL.
Infrastructure Access Report: MORE
Rev. 03, 21-Mar-2014 Page 38 of 38