Lumbar Spine Orthopedic Tests. Lumbar Anatomy Erector Spinae Group.

Multi-center analysis of CIREN occupant lumbar bone mineral density and correlation with age
and fracture incidence
Ashley A. Weaver, Mona Saffarzadeh, Kristen M. Beavers,
R. Caresse Hightower, Anna N. Miller, Joel D. Stitzel Virginia Tech – Wake Forest University Center for Injury Biomechanics
Wake Forest University School of Medicine, Winston-Salem, NC
C BIC BICOLLEGE of ENGINEERING
Center for Injury Biomechanics

Crash Characteristics Occupant Contacts
Occupant Demographics
(i.e. Age)
Injury Causation Investigation
Osteopenia/ Osteoporosis
(BMD)

Last Year’s Goals
• Lumbar BMD of 281 WFU occupants (109 M, 172 F) was quantified using phantom-less CT method – Of those classified as osteopenic (<145 mg/cc) using this technique
• 64% are undiagnosed in CIREN • 36% are correctly classified in CIREN
Weaver, Traffic Injury Prevention, AAAM, 2015.

Current Goals of Study
• Quantify lumbar BMD of 873 CIREN occupants (372 M, 501F) from 8 centers using phantom-less CT method
– 873 CT scans obtained from CIREN database
• 8 centers: Wake Forest, UVA/Fairfax, UAB, MCW, U of Maryland/Baltimore, Seattle, Michigan, San Diego
– Additional CT scans requested from current CIREN centers

Phantom-less vBMD Analysis Workflow
Validate Phantom-less vBMD Technique
Quantify vBMD in CIREN Occupants
Correlate vBMD with CIREN Data
Pilot data: DXA & QCT Measures
(50 subjects; 17M, 33F)
Collect vBMD & tissue measures for calibration
to mg/cc
Relate vBMD to CIREN occupant demographics,
comorbidities, injuries
BMD Analysis

Lumbar Spine BMD Analysis of Pilot & CIREN CT Scans

2 3 4
Fat
Muscle
ROIs for BMD Calibration from HU to mg/cc
Phantom calibration measures Port 2: 0 mg/cc CaHA Port 3: 75 mg/cc CaHA Port 4: 150 mg/cc CaHA Fat-muscle calibration measures Muscle: right psoas Fat: subcutaneous, anterior
INTable Calibration Phantom http://www.image-analysis.com/intable_phantom
0 75 150 mg/cc CaHA

y = 0.90x + 40.16R² = 1.00
0
75
150
225
-75 0 75 150
Cal
ibra
ted
to
CaH
A (
mg
/cc)
Image J Mean Gray Value from Port ROI
Phantom Calibration Method
Phantom Calibration Method
Phantom calibration technique applied to each pilot subject scan: Linear regression fit: [0, 75, 150] mg/cc CaHA vs Ports 2-4 ROI measures
0 75 150 mg/cc CaHA
Port 2
Port 3
Port 4
INTable Calibration Phantom
“Phantom Calibration Equation”
HU value from Port ROIs
y = 0.90x + 40.16R² = 1.00
y = 0.91x + 32.46R² = 1.00
-150
-75
0
75
150
225
-150 -75 0 75 150
Cal
ibra
ted
to
CaH
A (
mg
/cc)
Image J Mean Gray Value from Port ROI
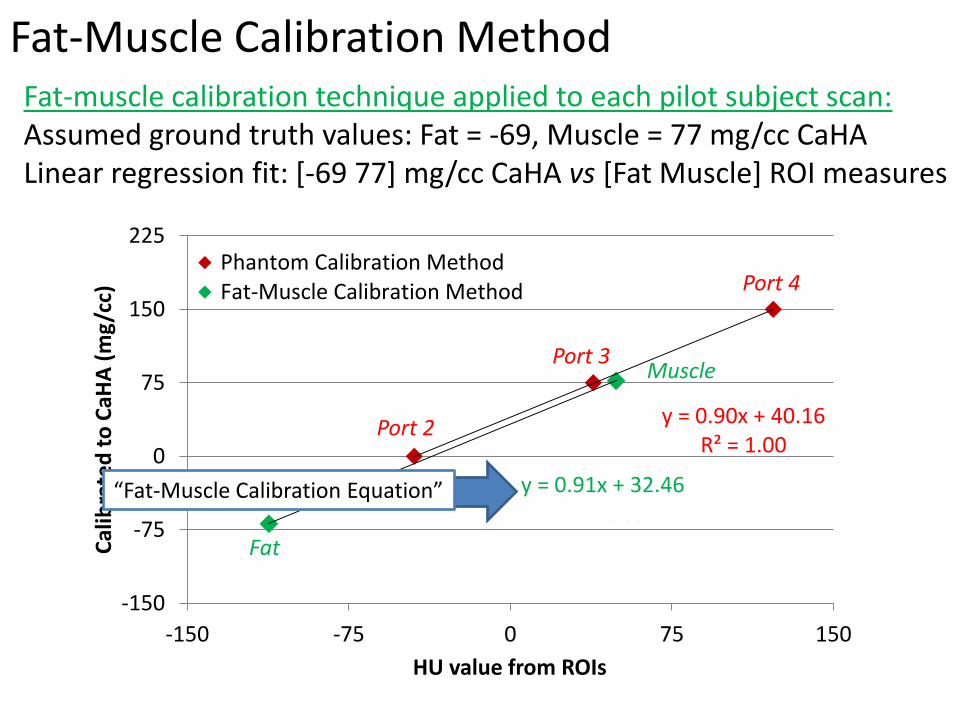
Phantom Calibration MethodFat-Muscle Calibration Method
Fat-Muscle Calibration Method Fat-muscle calibration technique applied to each pilot subject scan: Assumed ground truth values: Fat = -69, Muscle = 77 mg/cc CaHA Linear regression fit: [-69 77] mg/cc CaHA vs [Fat Muscle] ROI measures
Port 2
Port 3
Port 4
“Fat-Muscle Calibration Equation”
Fat
Muscle
HU value from ROIs

Calibration Method Comparison
• Pilot dataset shows Fat-Muscle Calibration ≈ Phantom Calibration
• Fat-Muscle Calibration applied to phantom-less CIREN scans
Phantom Calibration Method
Fat-
Mu
scle
Cal
ibra
tio
n M
eth
od
y=0.69+1.00x R2=0.87
p=<0.0001
Mean Lumbar BMD (mg/cc CaHA)

CT-based Predictive mg/cc Threshold for Osteopenia
L1-L4 T-Score from DXA
Me
an L
um
bar
BM
D (
mg
/cc
CaH
a)
Normal T-score >= -1
Osteopenia or Osteoporosis T-score < -1
145 mg/cc Threshold for Osteopenia
• DXA/CT, 50 subject pilot data
FP, 18
TP, 8
TN, 24
145 mg/cc Maximum Sensitivity
(ROC Analysis)

2015 CIREN Study Population
• 873 occupants (372 M, 501 F) across 8 centers
• Abdominal CT
• Ages 16+ Diagnosed osteopenia/osteoporosis
92 subjects
781 subjects No documented osteopenia/osteoporosis
CIREN Comorbidities
Nu
mb
er
of
Su
bje
cts
89.5%
10.5%
Age (years)
0
20
40
60
80
100
10 20 30 40 50 60 70 80 90
Male
Female

Normal Bone Quality
Normal Bone Quality
Osteopenia or Osteoporosis
Osteopenia or Osteoporosis
>= 145 mg/cc - Normal
CIREN Comorbidity
Me
an L
um
bar
BM
D (
mg
/cc
CaH
A)
FP TP
TN FN
< 145 mg/cc - Osteopenia
CIREN Truth Table of Bone Quality: Documented Comorbidities vs CT-Predicted vBMD
81 Undiagnosed osteopenia?
39 Misclassified
in CIREN?
700, Normal
53 Osteopenia

CIREN Subjects
Age (years)
Mea
n L
um
ba
r v
BM
D (
mg
/cc
Ca
HA
)
Mea
n L
um
bar
vB
MD
(mg/c
c C
aH
A)
Age (years)
145 mg/cc
Threshold for
Osteopenia
No osteopenia/osteoporosis comorbidity
Osteopenia/osteoporosis comorbidity
Documented Comorbidity in CIREN Database?
Female: vBMD=298.2 – 1.99(age)Male: vBMD=281.8 – 1.77(age)
Female: vBMD=295.6-1.974(age) Male:vBMD=280.7-1.737(age)
145 mg/cc Threshold
for Osteopenia 44M, vBMD=135 mg/cc L1, L5, T12, clavicle fx
44F, vBMD=139 mg/cc, L1-L5, 7 rib, 2 facial fx
81M, vBMD=302 mg/cc 9 rib, sternum, hand, pelvic, patella, tibia, fibular, femur fx – no spine fxs
34F, vBMD=110 mg/cc L3-L4, calcaneous, patella fxs
40M, vBMD=118 mg/cc Paraplegic; fibula, femur, tibia fx

# R
ib/S
tern
um
Fra
ctu
res
2.3 fractures
4.4 fractures
p-value=0.00001
>= 145 mg/cc - Normal < 145 mg/cc - Osteopenia
Significantly Higher # Rib/Sternum Fractures in CIREN Occupants with vBMD < 145 mg/cc

Greater proportion of occupants with <145 mg/cc BMD sustained thoracolumbar, lumbar, & thoracic vertebral body fx
0
100
200
300
400
500
600
700
800
900
0
100
200
300
400
500
600
700
800
900
No Fx – Normal, >=145 mg/cc Fx - Normal, >=145 mg/cc
No Fx - Osteopenic, <145 mg/cc Fx - Osteopenic, <145 mg/cc
24%
17%
13%
16%
10%
6%
3%
3%
Nu
mb
er o
f o
ccu
pan
ts

L1
L2
L3
L4
L5
Fat
MuscleBone
Summary & Conclusions
• Phantom-less CT BMD Estimation Technique
• Osteopenia indicated for lumbar BMD<145 mg/cc – Associated with increased # rib/sternum fxs – Associated with a greater incidence of thoracolumbar, thoracic, and lumbar spine fxs – Of those classified as osteopenic using this technique
• 60% are undiagnosed in CIREN • 40% are correctly classified in CIREN
• Technique useful for osteopenia/osteoporosis classification of CIREN
occupants & other prospective/retrospective BMD studies
C BIC BI
Center for Injury Biomechanics
COLLEGE of ENGINEERING

Ongoing Research • Increase sample size further by collecting non-injury CTs that are not
currently in the database from CIREN centers
• Investigate height, weight, and BMI correlation with lumbar vBMD in larger sample – Poor correlation in current data; contrasts positive correlations (BMD vs
weight/BMI) reported in larger studies (Felson, et al., 1993; Reid, 2002)
• Goal: Measure lumbar vBMD in 1000+ CIREN occupants for correlation with age, fx incidence, height, weight, & crash conditions

Wake Forest School of Medicine Translational Science Institute Wake Forest University Translational Science Center
Acknowledgments
Russell Griffin, Shannon Carroll Tom Scalea, Pat Dischinger
Frank Pintar, Dale Halloway
Thank you to our committed collaborators!
Chris Michetti, Jeff Crandall, Thomas Hartka

Ashley Weaver, [email protected]
Joel Stitzel, [email protected]
Contact Info
C BIC BI
Center for Injury Biomechanics
COLLEGE of ENGINEERING