Mu2e Production Target Development Towards CD-3
57
HPT/2015/1 1 Mu2e Production Target Development Towards CD-3 Interim Report CJ Densham, JRJ Bennett, TR Davenne, G Burton, O Caretta, M Fitton, P Loveridge, J ODell STFC Rutherford Appleton Laboratory Harwell Science and Innovation Campus Didcot, OX11 0QX, UK 10 August 2015
Transcript of Mu2e Production Target Development Towards CD-3

HPT/2015/1
1
Mu2e Production Target Development Towards CD-3
Interim Report
CJ Densham, JRJ Bennett, TR Davenne, G Burton, O Caretta, M Fitton, P Loveridge, J ODell
STFC Rutherford Appleton Laboratory
Harwell Science and Innovation Campus
Didcot, OX11 0QX, UK
10 August 2015

HPT/2015/1
2
Table of Contents
1 Introduction ........................................................................................................................ 4
2 Thermal Emissivity Measurements .................................................................................... 5
2.1. Background ................................................................................................................. 5
2.2. Method ........................................................................................................................ 5
2.3. Results ......................................................................................................................... 8
2.4. Conclusions ............................................................................................................... 10
3 Lifetime Pulsed Heating Tests .......................................................................................... 11
3.1. Background ............................................................................................................... 11
3.2. Vertical Configuration ............................................................................................... 11
3.3. Horizontal Configuration .......................................................................................... 13
4 Oxidation Lifetime Tests On Bare Tungsten .................................................................... 16
4.1. Background ............................................................................................................... 16
4.2. Samples ..................................................................................................................... 17
4.3. Apparatus .................................................................................................................. 18
4.4. Procedure ................................................................................................................... 20
4.5. Discussion ................................................................................................................. 24
5 Silicon-Carbide Coating Trials ......................................................................................... 26
5.1. Motivation ................................................................................................................. 26
5.2. CVD coating Trials ................................................................................................... 27
5.3. Thermal Cycling Test ................................................................................................ 29
5.4. Emissivity Measurements ......................................................................................... 32
5.5. Long Bakeout ............................................................................................................ 33
5.6. High Cycle Pulse Testing .......................................................................................... 34
6 Oxidation Tests On SiC Coatings ..................................................................................... 35
6.1. Samples ..................................................................................................................... 35
6.2. Thermo-Gravimetric Analysis (TGA) ....................................................................... 38

HPT/2015/1
3
6.3. Little Wire Tests ........................................................................................................ 40
6.4. Summary ................................................................................................................... 44
7 Helium Cooling as a Backup Target Technology ............................................................ 45
7.1. Motivation for helium cooled Mu2e target ............................................................... 45
7.2. Requirements ............................................................................................................. 45
7.3. Feasibility Study ........................................................................................................ 46
7.4. Outline Costing ......................................................................................................... 51
8 References ........................................................................................................................ 53
Appendix A: Technical Goals of the Contract Extension ........................................................ 56

HPT/2015/1
4
1 Introduction
The High Power Targets Group at STFC-RAL has previously developed the conceptual design of the Mu2e Production Target [1] [2] [3] and conducted R&D activities required to bring the preliminary design to the CD-2 level [4]. The work described herein, conducted by the same engineering group is part of a continuation of that programme which aims to bring the target design to the CD-3 level.
The present baseline technology choice is for a passively cooled tungsten target which operates at a sufficiently high temperature that the necessary heat transfer from the target into the surrounding heat shield may be achieved through thermal radiation alone [5]. Adopting this passive cooling concept has meant that no active coolant or associated plant is required, the risk of coolant leaks has been eliminated and the remote target handling has been greatly simplified. However challenges relating to continuous high temperature operation of the target have been introduced. At this stage baseline target development activities are focussed on obtaining data from a physical testing programme to inform and quantify specific technical risks associated with this high temperature operation. Particular topics addressed in this report include thermal emissivity measurements, an update on ultra-high temperature thermal fatigue testing, target oxidation tests at high temperature and low pressure and research into chemical vapour deposited (CVD) silicon carbide as a potential high emissivity and oxidation resistant coating.
This interim report is a deliverable under the terms of an extension to the contract between Fermilab and STFC Rutherford Appleton Laboratory entitled ‘Description of tasks and Resources Requested for Design, Testing and Prototyping work relating to Mu2e Experiment Pion Production Target’ [6]. This report comes at approximately half way through the contract extension period. The technical goals of the contract extension are listed in a statement of work, which is attached as Appendix A of this document.

HPT/2015/1
5
2 Thermal Emissivity Measurements
2.1. Background
The operating temperature reached by a radiation cooled target depends on the deposited power, target surface area and target material emissivity. Previous emissivity measurements performed by the same authors were focussed on the determination of the “monochromatic emissivity” ελ of tungsten [4], i.e. its emissivity at a certain wavelength. This quantity is needed in order to make temperature corrections in optical pyrometry where the instrument operates at the wavelength in question. The new measurements described below are for the “total emissivity” εT of tungsten, i.e. its emissivity across all wavelengths. This quantity is used to characterise radiation heat-transfer from a heated surface.
2.2. Method
The total emissivity of tungsten as a function of temperature was obtained using a measurement procedure similar to that applied by Taylor et. al. [7]. The apparatus, pictured in Figure 1, comprised a 230mm long centreless ground tungsten tube that could be heated in a vacuum using a known direct current I. Voltage taps spaced apart by ±20mm about the centre of the specimen were used to measure a potential difference V, and the applied resistive heating power in that portion of the sample could be calculated from:
(1)
We can say that heat loss from the region between the voltage taps is either by thermal radiation to the surrounding containment vessel, or by thermal conduction along the specimen towards its relatively cooler ends. Any convection heat loss is avoided by operating in a vacuum. It can be shown that if the sample is sufficiently long and the peak temperature sufficiently high then under equilibrium conditions the central region will reach a near uniform temperature and that conduction heat leaks can be neglected. Under these special conditions we can assume that thermal radiation is the only heat transfer mechanism at work, and the thermal emissivity can be calculated from:
(2)
Where D is the rod diameter, L is the voltage tap spacing, σ is the Stefan Boltzmann constant, and Ts and Te are the rod surface and vessel environment temperatures. When the sample is at elevated temperature the Te term can generally be neglected.
This method relies on a precise knowledge of the absolute surface temperature of the sample since any error will be exaggerated by the power four in equation (2). With this in mind a “type C” Tungsten/Rhenium thermocouple was inserted into the inner bore of the tube with its junction positioned at the sample mid-point. It is assumed that the thermocouple will reach the sample equilibrium temperature because it is effectively sitting inside a heated cavity. In this way no physical contact between the thermocouple and sample is necessary.

HPT/2015/1
6
Figure 1, Assembly of the sample mounting fixture (upside-down relative to installed configuration).
Under certain conditions the conduction heat leak from the region of interest may become a significant factor. In order to correct for conduction heat leaks the outer surface temperature of the sample was measured using a slide mounted digital pyrometer (Figure 2) that had been calibrated to match the thermocouple temperature reading. This allowed the temperature distribution along the length of the sample to be monitored and the local conduction heat leak at any given position could then be determined from the local temperature gradient according to:
(3)
where k is thermal conductivity and A is the tube cross-section area.
As a by-product of the measurements taken, the electrical resistivity R of the sample as a function of temperature could also be deduced from:

HPT/2015/1
7
(4)
Where L is the distance between the voltage taps.
Figure 2, Emissivity sample under test.
In the test the applied current was fixed and then a period of several minutes was allowed in order for a thermal equilibrium to be reached. The peak temperature (thermocouple) and temperature gradients at the two voltage taps (pyrometer) were then measured. During the test the applied current was varied from 125 to 250A in steps of 25A. The resulting peak temperature ranged from 700 to 1700°C.

HPT/2015/1
8
2.3. Results
By way of illustration a typical sample temperature profile is shown in Figure 3. The vertical dashed lines indicate the limits of the unsupported part of the sample. There is a central region where the temperature is relatively uniform and thermal radiation heat transfer dominates. There are steep temperature gradients towards the cooler ends of the sample where thermal conduction heat transfer dominates.
Figure 3, A typical temperature distribution along the sample measured using the digital pyrometer. In this case the applied current was 250A.
A zoomed-in view of the temperature distribution close to the sample centre is shown in Figure 4. The vertical dashed lines indicate the position of the voltage taps. A 2nd order polynomial fit was applied and used to estimate the temperature gradient at the voltage tap positions. Conduction heat leaks could then be calculated according to equation 3 above.
The results are listed in Table 1. The total heat deposited between the voltage taps “Q total” comes from equation 1. The sum of the conduction losses past the two voltage taps “Q cond.” Comes from equation 3. The portion of heat lost by thermal radiation is then calculated from the difference between the previous two quantities:
Q rad = Q total – Q cond (5)

HPT/2015/1
9
Figure 4, A zoomed in view of the temperature distribution in between the voltage taps. In this case the applied current was 250A.
The total emissivity εT, accounting for conduction losses, comes from
(6)
and the electrical resistivity R comes from equation 4. It can be seen that at the upper end of the temperature range radiation heat transfer was the dominant mode of heat transfer. However, at the lower end of the temperature range conduction losses became very significant. It was therefore important to correct for conduction losses in the total emissivity calculation.
Table 1, Total emissivity and electrical resistivity results.
T (°C)
Q total (W)
Q cond. (W)
Q rad. (W)
εT ( - )
R (Ω.m)
698.6 13.6 9.1 4.5 0.188 2.40E-07
1030.7 28.0 9.6 18.4 0.234 3.44E-07
1250.6 45.7 7.7 38.0 0.259 4.11E-07
1424.7 68.0 5.8 62.2 0.273 4.66E-07
1575.0 94.6 4.2 90.5 0.283 5.13E-07
1706.0 127.1 2.9 124.2 0.295 5.57E-07

HPT/2015/1
10
2.4. Conclusions
Previous engineering simulations performed by the same authors as part of the Mu2e target development used literature values for the thermal and electrical properties of tungsten [4]. The present measurements of total emissivity and electrical conductivity are compared to those literature values in Figure 5. The measured electrical resistivity values agree very closely with the literature data. The total emissivity measurements however are consistently higher than the previously assumed literature values. One possible explanation for this discrepancy could be that the rough (centreless-ground) surface finish of our sample led to a higher emissivity than is the case for the typically highly polished samples reported in the literature. In any case the indication here is that the previously assumed literature data is conservative, that is a higher emissivity leads to a cooler target.
Figure 5, Comparison of measured properties with those literature values assumed previously.

HPT/2015/1
11
3 Lifetime Pulsed Heating Tests
3.1. Background
Thermal stress cycling in the target is identified as a mechanism that has the potential to limit the target lifetime. In order to address and quantify this risk a thermal cycling test programme that aims to mimic the target operating conditions is underway. The test uses a pulsed electric current to deposit heat in a specially shaped tungsten sample. The operating temperature, pulsed temperature rise, thermal gradients and induced thermal stresses in the sample are designed to closely match those predicted for a Mu2e target under operation. A detailed description of the method and apparatus has been given previously [4]. An update on the present status is given below.
3.2. Vertical Configuration
Initially the system was configured so that samples could be mounted vertically as shown in Figure 6. At the time of writing the previous report [4] a tungsten sample was under test and had survived for 100 million pulses, which is equivalent to 4 years of continuous running of the Mu2e target. The test was ongoing.
Figure 6, A pulsed heating test underway with a sample mounted in the vertical configuration.
After a few hours operation at 1750°C it was noticed that the sample, which initially had a dull grey colouration, had developed a bright/shiny appearance. This is presumably due to impurities at the surface being burned off. After a few days operation at 1750°C it was

HPT/2015/1
12
noticed that a patchwork of grains was clearly visible at the surface of the central (hottest) part of the sample. This is not surprising since the central part of the sample was held well above the recrystallization temperature for pure tungsten. Following 100 Million cycles at conditions designed to mimic Mu2e target operation, and with no sign of failure, it was decided to make the test conditions more severe to try to induce a failure. With the pulsed temperature rise almost doubled and the nominal peak temperature increased to 2000°C the sample survived for a further 37 Million cycles before a failure was observed and the system shut down. The test conditions are summarised in Table 2.
Table 2, Pulsed heating test parameters.
Peak Current (A)
Repetition Frequency
(Hz)
Peak Surface ΔT (°C)
Mean Peak Temperature
(°C)
Number of Cycles
Notes
1900 16.2 44 1750 100 million Designed to mimic Mu2e target operation
2300 11.5 73 2000 37 million More severe condition than expected at Mu2e
A comparison of the sample before and after testing is shown in Figure 7. Apon the onset of failure a local hot-spot developed and it appeared that material, perhaps even whole grains, were being extruded out of the sample. The system was shut-down before the test could run away and melt any evidence at the failure point. We note that the failure location is not as expected on the little disk where the thermal gradients and stresses were highest. Instead it is at the point on the sample where the diameter is at a minimum, close to the peak temperature and in a region of high current density (up to 900 A/mm2). One possible explanation is that this failure is due to the process of electromigration rather than thermal stress / fatigue. In essence, when an electric field is applied to a metal, in addition to the transport of electrons a relatively small transport of the metal ions also occurs. This process of mass transport of metal ions is referred to as electro-migration or electro-diffusion. The rate of this mass transport apparently depends on temperature and current-density. It has been studied as a lifetime limiting factor in DC tungsten filament lamps [8] [9]. Apparently bulb filaments powered by a DC current are susceptible to this failure mechanism because the electric field is not reversed as is the case for alternating current. In our lifetime test, although the current was pulsed, it always flowed the same way through the sample.

HPT/2015/1
13
Figure 7, The sample before (left) and after (right) testing.
Following cooldown and dis-assembly from the vacuum vessel intact the sample eventually snapped in two at the failure location whilst being handled. The two halves of the sample were then separated so that the failure surface could be examined. The broken sample together with an end view of the failure surface is shown in Figure 8.
Figure 8, Close up view of the failed sample (left) and an end view of the failure surface (right).
3.3. Horizontal Configuration
It was suggested that the pulsed heating test could be made more representative of Mu2e target conditions if the samples were mounted and tested in a horizontal (rather than vertical) configuration. In that way bending loads due to self-weight would act in addition to the transient thermal stress. New longer shaped samples were machined from stock 6mm diameter centreless ground tungsten rod supplied by Plansee [10]. The sample dimensions are shown in Figure 9. Previously, shorter (160mm long) samples had been machined from 6.4mm diameter stock purchased from MTT [11].

HPT/2015/1
14
Figure 9, Sample dimensions for the horizontal test configuration.
The tungsten samples were machined at the RAL precision development facility using a wire electro-discharge process. Post machining the samples were etched in Aqua Regia to remove any residual brass scale deposited by the wire (Figure 10). A close-up view of the machined part of the sample is shown in Figure 11.
Figure 10, “Long” and “short” samples before (top) and after (bottom) etching.

HPT/2015/1
15
Figure 11, Close-up view of the pulse-test samples prior to the start of the run.
The test rig was reconfigured to allow the sample fixture to be plugged in horizontally (rather than vertically) as shown in Figure 12. The power supply settings designed to mimic Mu2e target conditions in the sample were set (i.e. the top row in Table 2). At the time of writing the sample has survived 25 Million cycles without any noticeable degradation. In terms of number of pulses this is equivalent to about 1 year of operation at Mu2e assuming a beam cycle time of 1.33 seconds.
Figure 12, Pulse testing underway in a horizontal configuration.

HPT/2015/1
16
4 Oxidation Lifetime Tests On Bare Tungsten
4.1. Background
One of the potential failure mechanisms identified for the radiation cooled Mu2e target is chemical erosion of the target material leading to a mechanical failure of some kind. This mechanism, together with the available literature data and expected erosion rates, has been outlined previously [4].
In summary, it is widely reported that at temperatures exceeding about 500°C tungsten will react readily with any oxygen present to form a tungsten oxide. A review of the literature indicates that the oxidation of tungsten at high temperature and low pressure is realised as a gradual recession of the tungsten surface as the oxide is continuously formed and boiled off. For example Figure 13 shows the surface recession of initially cylindrical tungsten rods heated in a low oxygen pressure.
Figure 13, Surface recession of initially cylindrical tungsten rods. Reproduced from Perkins Price and Crooks [12].
Figure 14 shows a summary of the available literature data on oxidation recession rates of tungsten at 1700°C [12] [13] [14] [15], i.e. the peak temperature expected in the Mu2e target. The hatched region in the lower left corner indicates the expected upper and lower bounds of the true surface recession rate based on extrapolation from two different literature data sets. Analysis of the data indicates that this chemical erosion mechanism could be significant under Mu2e target operating conditions. Due to the sparsity of available literature data and the uncertainty surrounding which of the two very different extrapolations should be used it was decided to perform our own chemical erosion test under representative Mu2e target conditions. Whereas the literature studies focussed on erosion rates of tungsten in low pressure pure oxygen, our own test would be done in low pressure air. This is thought to be more representative of a potential leak in the Mu2e vacuum vessel.

HPT/2015/1
17
Figure 14, literature data on oxidation recession rates of tungsten at 1700°C.
4.2. Samples
Straight tungsten wires, 100mm long and 0.5 mm outside diameter were purchased from Goodfellow metals [16]. The stated material purity was 99.9%. Under the microscope drawing marks were clearly visible on the surface of the wire (Figure 15).
Figure 15, image of the wire before the test taken using an optical microscope.

HPT/2015/1
18
4.3. Apparatus
The tungsten wire was mounted in a test rig where it could be heated using a DC current in a controlled partial vacuum environment. The apparatus comprised a wire mounting fixture, a vacuum vessel, a pumping rig, a DC power supply and various diagnostics. The wire mounting fixture enabled current to be passed along the wire which was supported from either end in a horizontal configuration. Thermal elongation of the wire was accommodated using a sliding graphite bush arrangement at one end. The vacuum vessel was fitted with a coaxial power feedthrough, optical viewports allowing observation of the heated wire, and a vacuum needle valve that was used to introduce a controlled leak of ambient atmospheric air. The temperature of the wire was monitored using a disappearing filament type optical pyrometer. A residual gas analyser (RGA) was fitted in order to monitor impurities in the vacuum. The pumping rig comprised a turbomolecular pump backed by a dry scroll pump, and pirani and penning gauges. The RGA could also read out total pressure and thus provided a useful cross-check for the dedicated vacuum gauge readings. The DC power supply (PSU) was rated for up to 60V, 50A. The rig was arranged so that any air leak originating at the needle valve would have to flow past the tungsten wire en route to the vacuum exhaust line. A schematic of the apparatus is shown in Figure 16. A photograph is shown in Figure 17.
Figure 16, Schematic of the oxidation lifetime test stand.

HPT/2015/1
19
Figure 17, photograph of the oxidation lifetime test stand. The coaxial sample mounting fixture is shown inset.
The unsupported central (i.e. heated) portion of the wire was about 50mm long. A direct current of about 12A was needed in order to reach a peak wire temperature of about 1700°C. Figure 18 shows the calculated equilibrium temperature distribution along a 0.5mm diameter 50mm long tungsten wire heated by a 12A direct current and with ends fixed at 100°C. The calculation, performed using the finite element software ANSYS, takes account of the temperature dependence of electrical resistivity, thermal conductivity and emissivity. The potential difference across the wire under steady-state operation is 1.2 V, giving a wire resistance of 100 milli-Ohms. 14.4W is deposited in the wire as heat, of which 6.6W is conducted out of the wire ends and the remaining 7.8W is radiated to the surrounding environment, which is assumed to be at 30°C.

HPT/2015/1
20
Figure 18, Calculated temperature distribution in a 50mm long 0.5mm diameter tungsten wire heated by a 12A direct current with ends assumed to be held at 100°C.
4.4. Procedure
The sample was loaded into the rig and the pumps were left to run with the leak valve closed, until the system pressure dropped to at least one order of magnitude below the desired test pressure. Then, over a period of a few hours the applied current was gradually increased while the wire temperature was monitored using the disappearing filament pyrometer. The speed at which the wire temperature could be ramped up was limited in order to keep the system pressure at least one order of magnitude below the desired test pressure. This process was known as a system “bake-out”. Typical RGA plots at the start and end of a bakeout are shown in Figure 19. The peaks at AMU 17 and 18 indicate the presence of water vapour, which was the dominant residual gas during bakeout.

HPT/2015/1
21
Figure 19, RGA scan before (left) and after (right) a system bakeout. Residual gasses dominated by water vapour.
After the system bakeout the leak valve was opened and adjusted to achieve the desired system pressure. Some small adjustments of the leak rate were needed before the system stabilised. Upon opening the leak valve the RGA clearly showed the presence of nitrogen (the peaks at AMU 14 and 28) and oxygen (the peaks at AMU 16 and 32) in a ratio of about 4:1 as expected (Figure 20).
Figure 20, Change in the RGA response upon opening the leak valve. Leak valve closed (left), leak valve open (right).
During the test we know that the hot tungsten wire was using up oxygen to make tungsten oxide. In order to check that this effective oxygen “pumping” rate of the wire did not affect

HPT/2015/1
22
the residual oxygen level in the vessel the RGA output was monitored with the wire both hot and cold. No difference in the system oxygen partial pressure could be seen (Figure 21).
Figure 21, RGA output with the wire hot (left) and cold (right). The wire temperature did not affect the oxygen levels in the vessel.
At various intervals the wire was removed from the test rig to be measured and weighed. Then it was re-mounted in the test rig and the process of pump-down and bakeout repeated before reopening the air leak to continue with the test. The wire mass was obtained using a precision four figure balance. It’s minimum diameter was obtained by taking multiple readings with a calibrated micrometer. In all, three bare tungsten wires were tested. The test conditions for each wire are listed in Table 3.
Table 3, Test Conditions.
Sample Peak Temperature (°C)
Total System Pressure (mbar)
Wire 1 1700 1 10-5
Wire 2 1700 1 10-4
Wire 3 1300 1 10-4
Results obtained from the three test wires are compared in Figure 22. It was possible to fit a straight line through the data for change in mass and change in radius, indicating a linear (steady-state) process. The greatest change in radius was taken to be the difference between half of the initial diameter and half of the smallest diameter measurement at a given time. The slope of this data (right hand plot in Figure 22) gives the surface recession rate in microns/day. This recession rate was converted to units of mm/year by multiplying by a

HPT/2015/1
23
factor 0.365. Recall the desired minimum target operating life of 1 year. The RAL test results are compared to the literature data in Figure 23.
Figure 22, Change in Mass (left) and the greatest change in radius (right) for the three test wires.
Figure 23, Results from the RAL test compared with the literature data at 1700°C.

HPT/2015/1
24
The test wires were examined under a scanning electron microscope (SEM). Typical images of a wire before and after heating to 1700°C in the vacuum/leak test are shown in Figure 24 and Figure 25. Before heating there are clear drawing marks at the wire surface but no grain structure is visible. After heating the drawing marks were still present and a pattern of elongated grains had become visible. The grains were typically 1–2 μm wide and 10–20 μm long.
Figure 24, SEM image at 300x magnification of a wire before (left) and after (right) heating to 1700°C.
Figure 25, SEM image at 1200x magnification of a wire before (left) and after (right) heating to 1700°C.
4.5. Discussion
The surface recession rates obtained from the RAL test fall within the expected range indicated by the hatched region in Figure 23. However our results do indicate a more rapid rate of recession than the data points from Anderson [14] or Eisinger [15]. This could be explained by residual gasses other than pure oxygen that was used in the literature tests such

HPT/2015/1
25
as water and perhaps CO2, CO, hydrocarbons, etc. which may also lead to additional chemistry at the hot target surface.
It is interesting to note that the reduction in recession rate when the temperature was reduced from 1700°C to 1300°C was only a factor of about two (see wires two and three in Figure 22). This gives a first idea of the difference in recession rates we could expect to see at the hottest central part of the target compared to its relatively cooler but more delicate ends where the support spokes must be attached.
In our test it was not feasible to go to pressures below about 10-5 mbar due to the length of time needed before a measurable change would occur. This in itself tells us something about the operating pressure required in the Mu2e target environment if a long target life is to be expected. The predicted Mu2e target recession rate as a function of total pressure is summarised in Table 4, together with the author’s interpretation on target life. Given the dimensions of the target we can say that at 10-6 Torr very little chemical erosion would be expected. At 10-5 Torr we would expect chemical erosion to become a significant factor in determining target life. At 10-4 Torr only a short target life could be expected.
Table 4, Predicted Mu2e target recession rates as a function of total pressure in the target environment.
Total Pressure Recession Rate Source Notes on Target Life
1 10-6 Torr A few microns/year Extrapolate from RAL test data Long target life
1 10-5 Torr 0.12 mm/year RAL test data Chemical erosion becomes a significant factor
1 10-4 Torr 1.8 mm/year RAL test data Short target life

HPT/2015/1
26
5 Silicon-Carbide Coating Trials
5.1. Motivation
It is possible that the target lifetime might be extended through the application of a suitable coating to the tungsten substrate. The ideal target coating would have a high total emissivity, excellent high temperature chemical stability, a thermal expansion coefficient that is well matched to tungsten (the substrate), excellent adhesion to the substrate, and excellent resistance to the radiation damage expected in the target environment. Previously, from a number of candidate coating systems, Silicon Carbide (SiC) was singled out for further investigation as a potential target coating material [4].
Published values for the total emissivity of silicon carbide coatings [17] [18] are contrasted with typical values for bare tungsten [19] in Figure 26. The difference is quite remarkable.
Figure 26, Total emissivity of silicon carbide and bare tungsten.

HPT/2015/1
27
An increase in total emissivity of this kind can have a significant effect in the target operating temperature. An ANSYS thermal finite element model of the Mu2e target has been described in previous reports [3] [4]. Based on the emissivity data shown in Figure 26 the model was re-run to determine the maximum target temperature as a function of beam power for both bare tungsten and silicon-carbide coated tungsten. The result, shown in Figure 27, indicates that the maximum temperature in the target could be reduced from around 1700°C to around 1250°C by enhancing its total emissivity through the application of a silicon carbide coating.
Figure 27, Comparison of maximum operating temperature in the Mu2e target for bare tungsten and silicon-carbide coated tungsten. The nominal beam power is identified by the dashed red line.
Silicon based ceramics such as silicon carbide and silicon nitride have been widely applied as high temperature structural materials due to their high strength, high thermal shock resistance and excellent oxidation resistance [20]. SiC bodies are commonly fabricated by various kinds of sintering process, but sintered SiC bodies contain additives which can cause serious degradation to their oxidation resistance, particularly at high temperatures. However, highly pure and fully dense SiC can be produced by chemical vapour deposition (CVD) [21]. High quality CVD silicon carbide coatings have been successfully applied to carbon/carbon composites and porous SiC sintered bodies for oxidation protection. SiC coatings are thought to have potential application in extremely harsh oxidising environments such as those in re-entry of spacecraft and protection of ceramic gas turbine blades [22].
5.2. CVD coating Trials
Chemical Vapour Deposition (CVD) is a process where gaseous precursors react to form a solid coating on a heated substrate. A controlled flow of mixed reactant gases is introduced into a reaction chamber. When they come into contact with the heated substrate components the gasses react to form the desired coating material, at the same time giving off waste gasses that are pumped out of the chamber. Over time the coating will grow to cover all exposed surfaces of the substrate. The CVD coating of tungsten substrate components with silicon

HPT/2015/1
28
carbide requires the tungsten parts to be heated to around 1000°C in the reaction chamber and an organo-metallic precursor gas is used.
Tungsten tubes, 1.6 mm outside diameter, 0.6 mm inside diameter, 50 mm long were purchased from Goodfellow Metals [16]. The tubes had apparently been made by taking 1.6 mm centreless ground bars and spark eroding the bar from both ends to produce a bore of 0.6 mm. The stated material purity was 99.95%.
One such tube was CVD coated by an external company, Archer Technicoat [23]. A nominal coating thickness of 50 microns was applied. The tube was coated in a batch along with several other components. When the coated sample was photographed and enlarged to several times magnification it became apparent that the resulting surface was covered in little bumps (Figure 28) and that the coating thickness was rather non-uniform.
Figure 28, SiC coating on the 1.6mm diameter tungsten tube.
To allow the measurement of the temperature within the tube by an optical pyrometer a small lateral hole (passing through one wall only) was created by the Micronanics Laser Solutions Centre [24] who specialise in intricate laser machining. The hole was generated using a 3.5W 355nm UV Avia Laser. The maching process involved rastering the laser spot across the required part of the surface according to a CNC programme, removing material as it went by laser ablation. The process was done in ambient air. Due to the laser optics the resulting hole was tapered, being 0.3 mm diameter at the tube OD, and 0.1 mm diameter at the tube ID. Photographs of the little hole taken with an optical microscope are shown in Figure 29.
Figure 29, microscope images of the little hole.

HPT/2015/1
29
Silicon-Carbide is a good electrical insulator. This meant that the ends of the tube needed to be polished back to bare tungsten to facilitate a good electrical connection. The coating proved to be very well adhered to the substrate and was extremely difficult to remove. However, after a number of trials a successful process was identified. This involved spinning the sample in a drill chuck and polishing the protruding end using medium and fine grit diamond honing stones.
5.3. Thermal Cycling Test
Tantalum tubes, 3 mm od, 2 mm id, 67 mm long, were cut longwise at one end for about 10 mm and pressed onto the ends of the smaller diameter tungsten tube using pliers and then clamped by twisting tantalum wire round the joint. A schematic of the sample assembly is shown in Figure 30.
Figure 30, schematic of the sample assembly.
The assembly was heated in vacuum by passing a dc current through it. The tungsten tube was hottest, although poor clamping at a junction of the tantalum to tungsten tube could cause local hot spots. As the DC current was slowly ramped up the first part of the sample to become incandescent was the central coated part of the tungsten tube, followed shortly by the polished bare tungsten ends. Figure 31 shows the assembly at various temperatures during the current ramp.

HPT/2015/1
30
Figure 31, the sample at room temperature (left), at about 800°C (centre), and at about 1000°C (right).
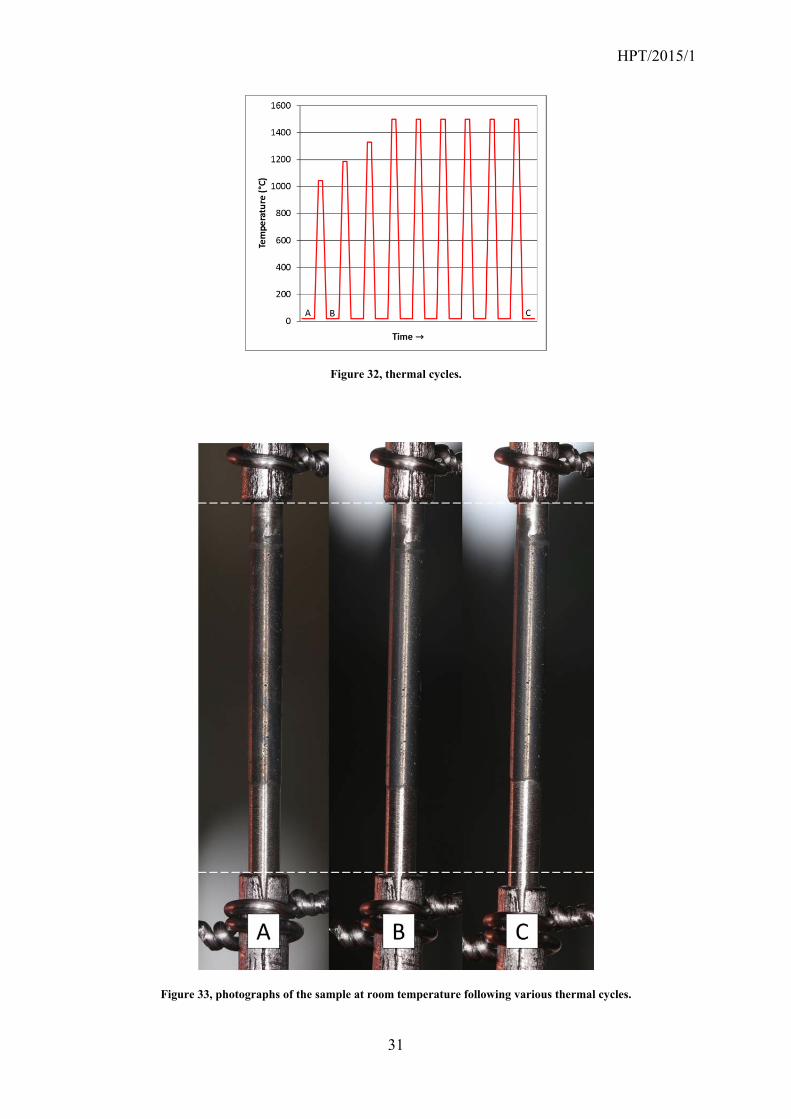
A number of thermal cycles were applied by ramping the current up and down. The sample spent a few minutes at each elevated temperature to allow thermal equilibrium to occur. The “black body” temperature was monitored by looking through the little hole with an optical pyrometer. The temperature history is illustrated in Figure 32. The sample was photographed at the times indicated as A, B, and C in Figure 32. The photos are shown in Figure 33. Close inspection of the photographs did not reveal any change or damage to the coating. Some sliding in the tied tungsten/tantalum joints was apparent, as indicated by the dashed horizontal reference lines.
HPT/2015/1
31
Figure 32, thermal cycles.
Figure 33, photographs of the sample at room temperature following various thermal cycles.

HPT/2015/1
32
5.4. Emissivity Measurements
The monochromatic emissivity of the coating in the temperature range 1000°C to 1500°C was measured at a wavelength of 0.65 microns using the disappearing filament type optical pyrometer. The emissivity was deduced by measuring both the apparent surface temperature and the temperature of the tube interior viewed through the central hole. The interior of the tube acts as a black body and the emissivity was taken as unity. As such it appears brighter than the coated surface whereas they are in fact assumed to be at the same temperature. The emissivity is calculated from the “observed” surface temperature and “true” black body temperature according to equation (7).
1
12
2
obs
true
T
C
T
C
e
e
(7)
Once the monochromatic emissivity as a function of temperature is known it can be used to “correct” observed surface temperature readings by rearranging equation (7) to yield equation (8). This method of temperature correction is standard in optical pyrometry.
11ln2
2
obsT
Ctrue
e
CT
(8)
The emissivity was measured at ten temperatures in the range 1000°C to 1500°C, starting at 1500°C and working down in steps of 5 Amps in applied current. The results are plotted in Figure 34. Across the range of measurements the emissivity was roughly constant, around 0.9. This is a very high value, and roughly double that of bare tungsten.

HPT/2015/1
33
Figure 34, Monochromatic emissivity of the coated tungsten tube as a function of temperature.
5.5. Long Bakeout
A long bakeout test was carried out where the coated sample was held at 1250°C for about ten weeks. The vacuum level remained in the mid 10-7 mbar range. The monochromatic emissivity was checked at regular intervals to give an indication of any changes in the coating. The result is shown in Figure 35. After an initial reduction of about 15% the emissivity appeared to stabilise.
Figure 35, Monochromatic emissivity variation during the long bakeout.
Figure 36 shows the coated sample after 40 days of heating at 1250°C (left) and after cooling to room temperature (right). No significant degradation of the coating was observed.

HPT/2015/1
34
Figure 36, The sample after 40 days bake-out at 1250°C, hot (left) and at room temperature (right).
5.6. High Cycle Pulse Testing
Following on from the long bakeout a high cycle pulse test was performed on the same sample in order to mimic the thermal cycling of the Mu2e target. During operation it is expected that the surface of the Mu2e target will increase in temperature and cool again by about 40°C every 1.33 seconds. It is possible that this continuous thermal cycling could eventually separate the coating from the target substrate. In order to simulate this effect the coated sample was connected to the pulsed power supply that had been previously used to perform the lifetime thermal cycling tests described in section 3 of this report. The pulsed power supply was adjusted to supply a 1.8kA pulses at 2Hz. This resulted in a mean temperature of about 1250°C with a superimposed thermal cycle of ±20°C about this value, i.e. a ΔT of 40°C. After 1 million cycles the test was stopped. No visible damage to the coating had occurred.

HPT/2015/1
35
6 Oxidation Tests On SiC Coatings
6.1. Samples
The following tungsten samples were CVD coated with silicon carbide in preparation for oxidation tests:
i) TGA samples. 6.3mm diameter by 1mm thick tungsten disks were sliced from a long tungsten rod using an electro-discharge wire cutting machine. The cut faces were then surface ground to remove any debris left behind by the wire cut and to give a good surface finish. Inside the reaction chamber the discs were positioned inside a graphite foil trough (Figure 37). A double coating was performed, turning the samples over in between the two deposition runs in order to ensure complete coverage. Each of the two SiC layers had a nominal thickness of 25 microns.
ii) Little wire samples. 0.5mm diameter by 150mm long straight tungsten wires were purchased from Goodfellow Metals [16]. Several iterations were needed before a successful method of supporting the wires and masking their ends during the coating run was identified. The solution is shown in Figure 38. The samples were suspended from a system of molybdenum support wires which could be broken off after the coating had been applied. Two successful methods of masking the ends of the samples were identified; i) dipping the ends in Johnson Matthey “orange” vacuum braze stop-off, and ii) coating the ends with a boron nitride spray.
Figure 37, Our TGA disks (together with some other components) at the point of removal from the coating chamber.

HPT/2015/1
36
Figure 38, Tungsten samples in the furnace mounting fixture prior to coating.
After removal from the reaction chamber, the samples were cut from the molybdenum suspension wires, and any coating that had formed over the stop-off in the end regions chipped away to leave only a central portion of about 50mm length coated (Figure 39). The samples could then be cut to length (about 100mm) to suit the mounting fixture in the test rig. A close-up photograph of the coated portion of the wire is shown in Figure 40. An SEM image of the wire prior to heating at 250x magnification is shown in Figure 41.
Figure 39, A typical coated wire sample with ends bared.

HPT/2015/1
37
Figure 40, close-up photograph of an unheated silicon carbide coated wire.
Figure 41, SEM image at 250x magnification of an unheated silicon carbide coated wire.

HPT/2015/1
38
6.2. Thermo-Gravimetric Analysis (TGA)
Thermo-gravimetric analyses (TGA) were performed in order to compare the high temperature oxidation resistance of bare tungsten and silicon carbide coated tungsten samples. A TGA is an industry standard tool for material characterisation. It consists of a sample pan that is supported by a precision balance. That pan resides in a furnace and is heated or cooled during the experiment. The mass of the sample is monitored during the experiment while a sample purge gas controls the sample environment. The samples tested were 6.4mm diameter by 1mm thick discs, which had been cut from a 160mm long stock tungsten rod that had supplied by MTT [11]. This was the same stock bar that had been used to form the lifetime pulse test samples described in section 3 of this report.
Initially, tests were carried out in house at RAL on a machine capable of reaching temperatures up to 1000°C. The sample was ramped from room temperature up to 1000°C under a purge of atmospheric pressure air. The results for bare tungsten and silicon carbide coated tungsten are compared in Figure 42. For the bare tungsten sample there is a clear transition at around 500°C where the sample starts to gain mass, presumably through the formation of a tungsten oxide. No such transition is apparent for the silicon carbide coated sample.
Figure 42, TGA results for a bare tungsten disc (dashed) and a silicon carbide coated tungsten disk (solid).
In order to go to beyond the temperature limit of the RAL TGA a test was arranged at a specialist external company, Netszch [25]. Recall from Figure 27 that the expected Mu2e target temperature for a silicon carbide coated (high emissivity) target is around 1250°C. In the Netzsch test a silicon carbide coated disk was ramped in temperature from room temperature up to 1650°C at a rate of 10°C/min and then back down again. The purge gas applied was a mixture of argon and air at a mixture ratio of two parts argon to three parts air.

HPT/2015/1
39
The result from the test is shown in Figure 43. During the ramp up a huge mass change is seen at around 1300°C. After cool down and inspection it was found that part of the coating had broken away from the substrate (Figure 44). However most of the coating remained intact. In addition the alumina ceramic sample carrier was completely destroyed during the test, presumably by some reaction with the tungsten oxide formed. This means that no meaningful interpretation of the cooling curve can be made. This test result highlights the importance of the coating/substrate adhesion in performing an oxidation protection role. We can assume that as soon as some small part of the coating breaks away a rapid reaction with the exposed tungsten will occur leading to further damage. It may be that the coating failure was initiated at the sharp edge of the sample disk and that this could be mitigated by designing a target with a smoother geometry. We also note that the sheer amount of oxygen present in the TGA experiment makes this a very severe test when compared to the expected Mu2e target environment.
Figure 43, TGA result for a silicon carbide coated disc.

HPT/2015/1
40
Figure 44, Optical microscope image showing a chip in the coating following the Netzsch TGA test.
6.3. Little Wire Tests
One of the coated wires was loaded into the vacuum/leak test rig. After running for five days at a vacuum level of 10-4 mbar and a peak temperature of about 1250°C a non-uniform surface texture had developed and the system was shut down to investigate. Figure 45 shows the wire mounted in the test rig prior to heating (top), after the bakeout but before opening the air leak (middle), and during the cooldown after five days running (bottom).
Figure 45, SiC coated tungsten wire in the vacuum/leak test: before heating (top), after bakeout at the start of the test (middle), during cooldown at the end of the test (bottom).

HPT/2015/1
41
Following the cooldown it became apparent that white deposits had built up near the cooler ends of the sample, and what looked like a longitudinal crack had developed in the coating (Figure 46). The central (hotter) part of the wire remained black in appearance.
Figure 46, photograph of the SiC coated wire after heating in the vacuum/leak test.
The sample was removed from the test rig and examined under a scanning electron microscope (SEM). The crack in the coating was clearly visible (Figure 47).
Figure 47, SEM images of the cracked coating at 200x magnification (left) and at 800x magnification (right).
Using the SEM a clear difference in surface texture could be seen between the black central part of the sample (Figure 48 left) and the regions with the white deposits near the ends (Figure 49 left). With the SEM in EDX mode it was possible to identify the elements present at the surface of the sample by an energy-dispersive X-ray spectroscopy method. In the black central part of the sample the EDX spectrum was dominated by peaks representing silicon and carbon (Figure 48 right). The peak for aluminium presumably comes from the aluminium sample holder. In the regions containing the white deposits oxygen was detected in addition to the elements previously identified (Figure 49 right).

HPT/2015/1
42
Figure 48, Central (black) part of the wire post heating.
Figure 49, End (white) part of the wire post heating.
In EDX mode it is possible to map the location of the various elements present. Further inspection of the black central part of the specimen revealed a separation of the silicon and oxygen (Figure 50) that was not apparent in the unheated specimens. We believe the white substance is most likely silica (SiO2).

HPT/2015/1
43
Figure 50, EDX element map (left) and SEM image (right) at 1200x magnification showing part of the coated wire post heating. A clear separation of carbon (blue) and silicon (yellow) can be seen.
A second coated wire was mounted in the vacuum/leak test rig. After bakeout it was run at about 1250°C in good (about 10-7 mbar) vacuum for three weeks. The applied current was fixed and the temperature distribution along the wire was very stable. No noticeable degradation of the coating occurred. Then, on a Monday, the air leak was opened and adjusted to run at a total pressure of 10-4 mbar. During the next few days a gradual build-up of white deposits along the full length of the wire was observed. By the Friday of that week the appearance of the wire had completely changed and it was difficult to make a reliable temperature measurement with our pyrometer. We left the system running over the weekend and by the following Monday morning the coating had almost completely disappeared leaving behind a shiny tungsten wire running at about 1700°C. Photographs of the wire before and after the test are shown in Figure 51.
Figure 51, A silicon carbide coated wire before (above) and after (below) testing in the vacuum/leak test rig.

HPT/2015/1
44
The failure mode is presumably as follows:
i) The high emissivity of (black) SiC allows the sample to reach thermal equilibrium at 1250°C.
ii) Residual oxygen is present due to air leaks in the vessel. iii) That oxygen reacts with the SiC coating to form a layer of (white) SiO2 which has
a much reduced emissivity. iv) The sample heats up, accelerating the chemical reaction. v) In only a short time the upper use temperature of the coating is reached at which
point the entire coating becomes unstable and burns off.
Depending on the oxidising environment Silicon carbide may react in either an active or a passive mode [26]. In high temperature oxidising environments SiC generally forms a passive oxide scale of SiO2 which limits further attack of the SiC:
SiC s O g
SiO s CO g
However, at higher temperatures and lower partial pressures of oxygen the volatile sub-oxide SiO forms in an active oxidation mode that bleads to recession of the SiC surface:
SiC s O g
SiO g CO g
It appears that neither of these modes is desirable for the Mu2e target application, the passive mode forming a stable but low emissivity (white) surface layer leading to higher target temperatures that are ultimately beyond the upper use temperature for SiC, and the active mode leading directly to rapid erosion of the coating.
6.4. Summary
The silicon carbide coatings tested performed very well in a good vacuum, surviving both short term thermal cycling tests between room temperature and 1500°C, and long term heating tests at 1250°C for up to 10 weeks. A thermal cycling test designed to mimic the target surface conditions was performed, and the coating survived one million cycles with a delta-T of 40°C. These trials were done with a vacuum level of 10-6 or better, and no significant degradation of the coatings was seen. In addition, all indications are that the high emissivity of the silicon carbide coating would be beneficial in significantly lowering the target temperature during operation.
The problems encountered were due to chemical processes that occurred when an air leak was introduced to simulate the potential poor vacuum conditions predicted by the Mu2e vacuum group. In our little wire tests the constant current from the power supply generates a volumetric Joule heating that is fixed and is in many ways analogous to the fixed volumetric beam heating in a target. We have no reason to believe that a silicon carbide coated Mu2e target operating in an environment subject to air leaks would behave any differently to the little coated wires in our test. For this reason the silicon carbide cannot be recommended as a target coating.
HPT/2015/1
45
7 Helium Cooling as a Backup Target Technology
7.1. Motivation for helium cooled Mu2e target
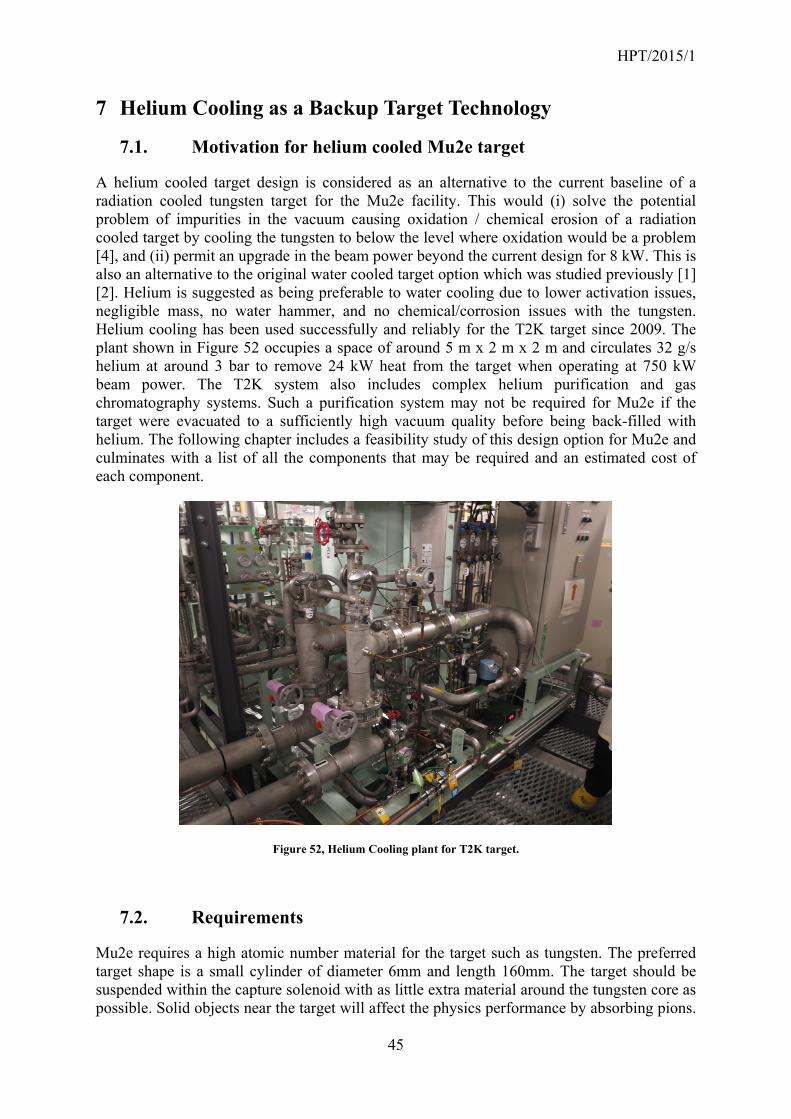
A helium cooled target design is considered as an alternative to the current baseline of a radiation cooled tungsten target for the Mu2e facility. This would (i) solve the potential problem of impurities in the vacuum causing oxidation / chemical erosion of a radiation cooled target by cooling the tungsten to below the level where oxidation would be a problem [4], and (ii) permit an upgrade in the beam power beyond the current design for 8 kW. This is also an alternative to the original water cooled target option which was studied previously [1] [2]. Helium is suggested as being preferable to water cooling due to lower activation issues, negligible mass, no water hammer, and no chemical/corrosion issues with the tungsten. Helium cooling has been used successfully and reliably for the T2K target since 2009. The plant shown in Figure 52 occupies a space of around 5 m x 2 m x 2 m and circulates 32 g/s helium at around 3 bar to remove 24 kW heat from the target when operating at 750 kW beam power. The T2K system also includes complex helium purification and gas chromatography systems. Such a purification system may not be required for Mu2e if the target were evacuated to a sufficiently high vacuum quality before being back-filled with helium. The following chapter includes a feasibility study of this design option for Mu2e and culminates with a list of all the components that may be required and an estimated cost of each component.
Figure 52, Helium Cooling plant for T2K target.
7.2. Requirements
Mu2e requires a high atomic number material for the target such as tungsten. The preferred target shape is a small cylinder of diameter 6mm and length 160mm. The target should be suspended within the capture solenoid with as little extra material around the tungsten core as possible. Solid objects near the target will affect the physics performance by absorbing pions.

HPT/2015/1
46
Consequently the design follows the same principles as the water cooled and radiation cooled target proposals, namely a ‘bicycle wheel’ arrangement with hollow spokes for inlet and outlet pipes. The channels to pipe helium in and out of the target should be made of low atomic number materials and be as small as possible. The helium mass flow rate should be high enough such that the tungsten temperature is maintained below the level where oxidation can occur. This is because it may be difficult to guarantee the purity of the helium. Thermo-gravimetric tests in air indicate that the threshold temperature for oxidation is below 500°C. This temperature is also the maximum design value being used by the engineers who are developing the helium cooled tungsten target for the European spallation source. Irradiation of the tungsten target with high energy protons will result in some production of hydrogen, tritium and other gases. A purification system may be needed in the helium circuit to control the levels of contaminant gases. Some monte carlo particle physics simulations are recommended to estimate the production rate of the different contaminants in order to specify and size an appropriate purification system.
7.3. Feasibility Study
7.3.1 Target
The thermal power deposited in the tungsten target core has been calculated using FLUKA. The model input parameters were the following:
Proton beam kinetic energy = 8GeV Beam sigma =1mm Beam power = 8kW
This gave an integrated power deposition in the tungsten of 588W.
A steady state ANSYS CFX model of the tungsten target with an annular helium flow has been setup to predict tungsten operating temperature and helium pressure drop. A helium mass flow of 1gram/s was set as this maintains the bulk helium outlet temperature at 113K above the inlet temperature. Various annular duct widths have been modelled to highlight the effect this design parameter has on tungsten temperature and helium pressure drop. The model treats the helium as a perfect gas with temperature dependant viscosity and conductivity. A shear stress transport turbulence model is used to simulate the turbulence in the helium channel. The thermal conductivity of the tungsten is also temperature dependant. There is no heat transfer from the two ends of the target in the simulation. As a result of the relatively high thermal conductivity of tungsten and small target radius the steady state simulation shows a fairly small radial variation in temperature. There is a more notable variation in temperature along the length of the target with the peak occurring near the area of where the highest thermal power density is deposited. With a helium annular gap of 1.2mm the peak tungsten temperature is 368°C (Figure 53) and the pressure drop is 0.21bar. As the annular gap is increased for the same 1 gram/s of helium the flow velocity and pressure drop can be reduced but the heat transfer coefficient also reduces resulting in higher temperature tungsten (Figure 54).

HPT/2015/1
47
Figure 53, Helium cooled tungsten target – predicted steady state operating temperature.
Figure 54, Influence of Helium annular channel gap width on pressure drop and operating temperature.

HPT/2015/1
48
The Reynolds number for the flow in the 1.2mm wide annular duct is 6200 and reduces as the duct size increases. If the duct size was increased too much for a given flow it may have a tendency towards laminar behaviour resulting in a step reduction in heat transfer and marked increase in tungsten temperature. Also considering the requirement to minimise material around the target it would seem sensible to keep towards the 1.2mm annular duct gap. The steady state model allows us to evaluate the effectiveness of the cooling however we know that there will be a fluctuation in temperature around this steady state value due to the pulsed beam. A transient model has been carried out which predicts that the target will take around 20seconds to heat up to its stable operating condition and the pulse to pulse temperature variation will be of the order of 58C (Figure 55). This temperature variation will result in a predicted Von-mises stress fluctuation of between 3.7MPa and 9.6MPa (Figure 56). The highest stress occurring just after a beam pulse and then dropping to a minimum after the cooling period. It is also worth noting that with the helium cooling some parts of the tungsten may operate below the ductile to brittle transition temperature and so may remain brittle during operation.

HPT/2015/1
49
Figure 55, Result of transient simulation of the helium cooled target.
Figure 56, Von-Mises stress before (above) and after (below) a beam pulse.

HPT/2015/1
50
7.3.2 Helium Cooling Circuit
So far we have just considered the feasibility of the target itself, it will clearly require a system to circulate and cool the helium so as to deliver fresh cold helium to the target. The basic components of such a circuit are shown in Figure 57.
The circuit will require a helium compressor or circulator to drive the gas through the circuit. Ideally the compressor would have a dry mechanism so that there is no chance of mechanism oil contaminating the helium. The compressor will need to be hermetically sealed so that the coolant gas cannot escape from the circuit through rotating shaft seals. Off the shelf dry mechanism compressors are all designed to operate with air, although they will work with helium performance is often not published and tends to be significantly lower due to their mechanisms relying on dynamic shaft seals and helium being much harder to seal than air. An oversized scroll compressor built in to a hermetically sealed container is probably the most economical approach. Two compressors would be desirable with one on standby so that operation could continue in the event of a compressor failure or scheduled maintenance being required.
The heat load on the circuit from the target is less than 1kW (i.e. less than a domestic electric element heater). As such the heat could be removed via natural convection to the target station air via a finned heat exchanger.
Depending on the quantity of residual contaminant gas produced, and to avoid a build-up of unwanted elements in the closed circuit, purification of the helium may (or may not) be necessary. A FLUKA study on the expected quantities of residual nuclei is currently underway and will inform this choice. Hydrogen (Tritium), carbon monoxide, carbon dioxide, water, oxygen, nitrogen, methane (hydrocarbons) & noble gases may all be produced. Helium purification systems have been designed to remove these components from experimental helium cooled nuclear reactors. The European Spallation Source baseline target design is a helium cooled tungsten target (note ESS has a 5MW beam with a 3kg/s helium flow where as Mu2e has an 8kW beam and would only need a 1g/s helium flow) and the engineers of the helium loop plan to employ a helium purification system that can remove all of the above mentioned components. The typical purification process can be simply split into two parts oxidation and absorption. Oxidation is achieved using a catalyst, if the helium temperature is below 400°C at entry to the catalyst which is likely to be the case for the mu2e target design then a heater will be required to ensure the catalyst activation temperature is reached. A Copper oxide bed will oxidise hydrogen, carbon monoxide and hydrocarbons to give water and carbon dioxide at an operating temperatures between 400°C and 600°C. Water and carbon dioxide can be removed by a molecular sieve trap while nitrogen, oxygen, methane and noble gases can be removed by a liquid nitrogen cooled carbon cold trap. A cooler is required after the copper oxide bed to bring the temperature back to a level that can be tolerated by the molecular sieve. Tritium which will oxidise in the same way as hydrogen will become tritiated water and can then be absorbed in the molecular sieves. It is desirable to keep the tritium concentration in the circuit down in case there is a helium leak in to the atmosphere. An alternative method of removing tritium is to react with titanium forming titanium titride. This can be removed from the titanium bed at 550 to 700°C. Figure 58 shows a schematic of the purification system that may be necessary.

HPT/2015/1
51
A control system will be required to maintain the correct helium flow through the target and the amount of helium going through the purification loop.
Figure 57 Principal elements of a helium cooling circuit (see figure 4 for more details on purification system).
Figure 58 Purification system proposed for helium cooled nuclear reactors and European Spallation Source.
7.4. Outline Costing
Table 5 contains a list of the components require for a helium cooled target along with an estimation of their size and cost and also an estimation of the effort that would be required to complete the job.

HPT/2015/1
52
Table 5, Estimated cost of Helium cooled target including helium loop and required effort.
Item (ref. Figure 57) Description Nominal Size Estimated Cost in dollars
A Helium cooled tungsten target with outer can to form helium cooling annular channel
1cm diameter x 18cm long
35k
B Thin helium lines to deliver helium into the capture solenoid
0.75k
C Large diameter helium lines to transport helium from target to helium plant area with minimum pressure drop
1inch diameter x 10s of meters long
2k
D Helium to Air heat exchanger, heat to be dissipated to hall air by convection from a finned radiator
0.125m3 10k
E Helium compressor and buffer tank if necessary
0.125m3 75k for two off the shelf machines modified for helium use
350k for two be-spoke machine
F Control Valve and control system
25k
G Purification system including CuO catalyst and molecular sieve, liquid nitrogen cold trap, heater, cooler, titanium bed for tritium conversion
200k
Vacuum pump and tank to provide helium circuit fill and emptying capability
10k
Design and Development Effort
2 man years 300k
Integration, manufacturing and installation effort
2 man years 300k
TOTAL 1232.75k$

HPT/2015/1
53
8 References
[1] C J Densham et. al., “Conceptual Design Study of Mu2e Experiment Pion Production Target Components and Systems, First Intermediate Design Study Report,” Mu2e doc-db #1477, 13 April 2011.
[2] C J Densham et. al., “Conceptual Design Study of Mu2e Experiment Pion Production Target Components and Systems, Second Intermediate Design Study Report,” Mu2e doc-db #1746, 4th July 2011.
[3] C J Densham et. al., “Design Study Report on a Radiation Cooled Target,” Mu2e doc-db #2406, August 2012.
[4] C J Densham et. al., “Design, Testing and Prototyping work relating to the Mu2e Experiment Pion Production Target,” Mu2e doc-db #4305, June 2014.
[5] R E Ray et. al., “Mu2e Technical Design Report,” doc-db #4299, October 2014.
[6] Contract between Fermi National Accelerator Laboratory (Fermilab) and Science and Technology Facilities Council (STFC) Rutherford Appleton Laboratory (RAL) for "the Design, Testing and Prototyping work relating to Mu2e Experiment Pion Production Target".
[7] R E Taylor, W D Kimbrough, R W Powell, Journal of the Less Common Metals, vol. 24, pp. 369-382, 1971.
[8] D. O'Boyle, “Observations on Electromigration and the Soret Effect in Tungsten,” Journal of Applied Physics, vol. 36, no. 9, 1965.
[9] J. C. Peacock and A. D. Wilson, “Electrotransport of Tungsten and Life of a Filament,” Journal of Applied Physics, vol. 39, no. 13, 1968.
[10] Plansee High Performance Materials, 3 Lidstone Court, George Green, Slough, SL3 6AG, UK. Tel: +44 (0)1753 576959, email: [email protected], web: www.plansee.com.
[11] MTT Limited, 4 Oban Court, Hurricane Way, Wickford, Essex, SS11 8YB. tel: +44 (0) 1268 906591, email: [email protected], web: www.molyandtantalum.com.

HPT/2015/1
54
[12] R A Pekins, W L Price and D D Crooks, “Oxidation of Tungsten at Ultra-High Temperatures,” Lockheed Missiles and Space Company, November 1962.
[13] R W Bartlett, “Tungsten Oxidation Kinetics at High Temperatures,” Transactions of the Metallurgical Society of AIME, vol. 230, p. 1097, 1964.
[14] H U Anderson, “Kinetic studies of the reactions occuring between tungsten and gasses at low pressure and high temperature,” PhD Thesis, University of California Lawrence Laboratory, UCRL-10135, Apr 1962.
[15] J Eisinger, “Adsorption of Oxygen on Tungsten,” Journal of Chemical Physics, vol. 30, p. 412, 1959.
[16] Goodfellow Cambridge Limited, Ermine Business Park, Huntingdon, England, PE29 6WR, Email: [email protected], Telephone: +44 (0)1480 424800, web: www.goodfellow.com.
[17] E Sani et.al., “Ultra-refractory ceramics for high-temperature solar absorbers,” Scripta Materiala, vol. 65, pp. 775-778, 2011.
[18] D Alfano et.al., “Emissivity and catalycity measurements on SiC-coated carbon fibre reinforced silicon carbide composite,” Journal of the European Ceramic Society, vol. 29, pp. 2045-2051, 2009.
[19] S W H Yih, C T Wang, Tungsten, Sources, Metallurgy, Properties, and Applications, New York: Plenum Press, 1981.
[20] N Jacobson, “Corrosion of Silicon Based Ceramics in Comustion Environments,” Journal of the American Ceramic Society, vol. 76, no. 1, pp. 2-28, 1993.
[21] W Gao and Z Li (ed.), Developments in high-temperature corrosion and protection of materials, Cambridge, England: Woodhead Publishing Limited, 2008.
[22] T Goto, “High-Temperature Oxidation Behavior of Chemical Vapor Deposited Silicon Carbide,” Journal of the Ceramic Society of Japan, vol. 110, no. 10, pp. 884-889, 2002.
[23] Archer Technicoat Ltd., Progress Road, Sands Industrial Estate, High Wycombe, HP12 4JD, UK. Tel: +44 (0) 1494 462101, email: [email protected], web:

HPT/2015/1
55
www.cvd.co.uk.
[24] Micronanics Limited, Rutherford Appleton Laboratory, Chilton, Oxfordshire, OX11 0QX, UK. Tel: +44 (0) 7595 411246, email: [email protected], web: www.micronanics.com.
[25] NETZSCH-Geratebau GmbH, Wittelsbacherstr. 42, 95100 Selb/Bavaria, Germany. Tel: +49 9287 881183, email: [email protected], web: www.netzsch.com.
[26] N Jacobson, “Active oxidation of silicon carbide,” Materials at High Temperatures, vol. 29, no. 3, pp. 193-198, 2012.

HPT/2015/1
56
Appendix A: Technical Goals of the Contract Extension
Statement of Work
by
Science & Technology Facilities Council (STFC), Rutherford Appleton Laboratory (RAL)
for
Mu2e Production Target Development
Background
The Production Target is required to generate pions that decay to muons as they are transported to the stopping target in the Detector Solenoid. The target is installed inside the bore of the Production Solenoid within a graded magnetic field, a configuration designed to maximize the generation and capture of low-energy negative momentum pions generated by interaction with the 8 GeV primary proton beam. The work described in this document will be carried out using the radiatively cooled tungsten target baseline design described in the Mu2e Technical Design Report (TDR) Accelerator Chapter, Fermilab document database report number Mu2e-doc-3657-v10 as a source of reference and starting point.
The High Power Targets Group at STFC-RAL has developed the conceptual design of the Mu2e Production Target and conducted R&D activities required to bring the preliminary design to the CD-2 level. The work described herein, conducted by the same engineering group will continue with development activities to bring the Target design to the CD-3 level. Objectives
The objectives of this work are:
1. Complete R&D activities necessary to enable critical design decisions, including: Emissivity, coating, oxidation lifetime, and pulsed current fatigue testing Remaining target mounting and spoke prototyping Scoping study of helium cooled target and plant
Scope
As with any development effort, the scope of work may vary as the development unfolds. Significant changes in scope will result in revision of this document and will be subjected to the standard Change Order process.
Note that this scope assumes the radiatively cooled option is viable with the He cooled option explored only through scoping calculations. A subsequent decision to choose the He cooled target option is a significant scope change and this SOW and the associated Purchase Order will require revision.

HPT/2015/1
57
Currently the scope is expected to include:
1) Task 1: Target R&D Activities a) Tungsten surface finish versus emissivity characterization b) Tungsten coating/surface/oxidation/fatigue R&D, including:
i) Various surface treatment/coating R&D ii) Emissivity measurements of surface coatings iii) Medium vacuum (10-4 to 10-5 torr) lifetime testing iv) Pulsed current fatigue testing for shaped test samples, including tests in a
horizontal configuration to make testing as realistic as possible c) High temperature creep testing of spokes and spring tensioners d) He cooling feasibility study and preliminary plant specification e) Optimization of end joints
Deliverables
Task 1: Target R&D Activities
1. Target R&D Intermediate Report- Although written input as dictated by Mu2e Project needs is expected during the course of the work period, current progress, preliminary findings and evaluation of remaining activities to complete shall be summarized in a written intermediate report at approximately halfway through the Target R&D Activities period.
2. Target R&D Final Report- Although written input as dictated by Mu2e Project needs is expected during the course of the work period, key findings, comments and recommendations (including a final recommendation on the target design principles e.g. cooling method) shall be summarized in a written final report at the end of the Target R&D Activities period.
Schedule
It is expected that the periods of performance and delivery dates will be as follows:
1. Task 1 - Target R&D Activities: July 1, 2014 – June 1, 2016 1.1. Target R&D Intermediate Report: February 1, 2015 1.2. Target R&D Final Report due: June 1, 2016
Progress Reporting and Communication
The contact person for this scope of work at STFC-RAL is Dr. Chris Densham. Progress will be reported by Dr. Densham or his delegate via regularly-scheduled Mu2e Project conference calls. Informal communications may be conducted with a variety of STFC-RAL staff as technical needs dictate, but Dr. Densham shall be copied on all communications between RAL and FNAL.