MTWARA-LINDI WATER MASTER PLAN · PDF file4.45 Kilwa District 37 ... The Mtwara-Lindi Water...
254
REPUBLIC OF TANZANIA THE REPUBLIC OF FINLAND MTWARA-LINDI WATER MASTER PLAN REVISION Part: WATER SUPPLY VOLUME 2 STUDIES April 1986 A FINNWATER HELSINKI,
Transcript of MTWARA-LINDI WATER MASTER PLAN · PDF file4.45 Kilwa District 37 ... The Mtwara-Lindi Water...
REPUBLIC OF TANZANIATHE REPUBLIC OF FINLAND
MTWARA-LINDI WATER MASTER PLAN
REVISIONPart: WATER SUPPLY
VOLUME 2STUDIES
April 1986
A FINNWATER
HELSINKI,
THE UNITED REPUBLIC OF TANZANIATHE REPUBLIC OF FINLAND
MTWARA-LINDI WATER MASTER PLAN
REVISIONPart: WATER SUPPLY
VOLUME 2STUDIES
LIBRARY,CENTRE• . , . 0 ^ A h
;''.O. •:_!:;;<I..;!. (Q70)
INTERNATIONALFOR COMMUNITYÏTATION (irtC))3190, 2503 AD
REFERENCEWAT
The :814311 ext 141/142
H
£R SUPPLY
ivgue
April 1986
A FINNWATERCONSULTING ENGINEERS
HELSINKI, FINLAND
MTWARA-LINDI WATER MASTER PLAN REVISION
WATER SUPPLY DEVELOPMENT PLAN 1986 - 2001
V O L U M E 2 STUDIES
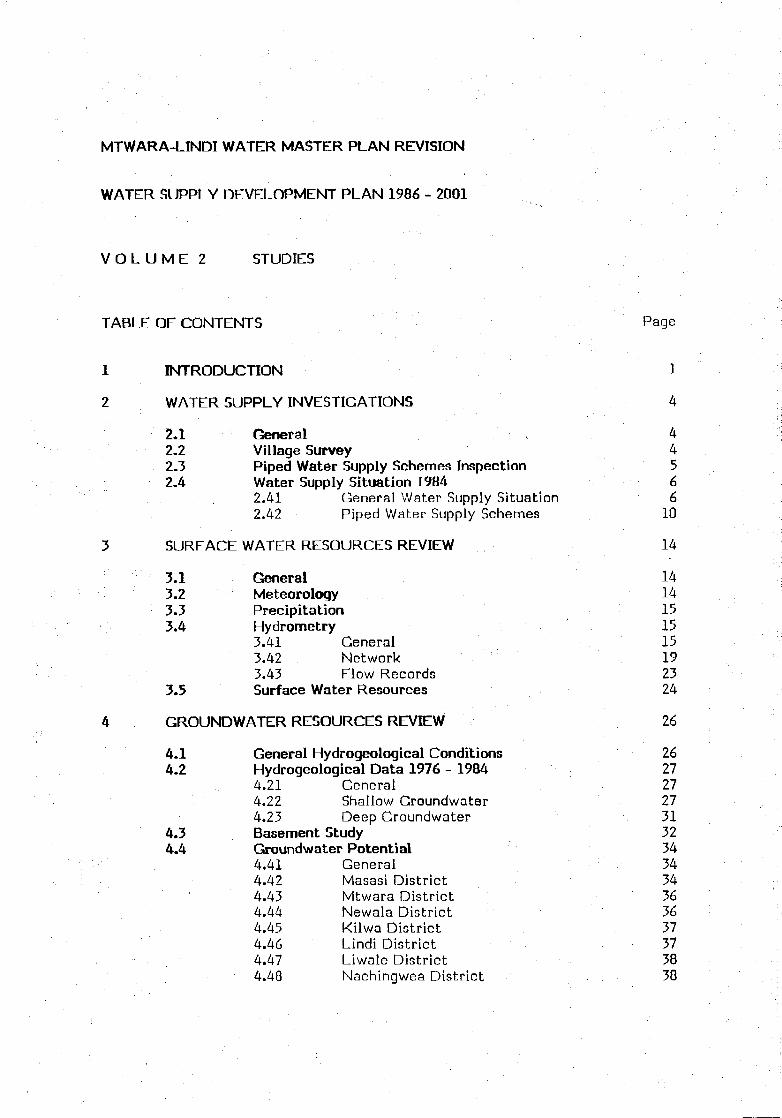
TABLE OF CONTENTS Page
1 INTRODUCTION 1
2 WATER SUPPLY INVESTIGATIONS 4
2.1 General 42.2 Village Survey 42.3 Piped Water Supply Schemes Inspection 52.4 Water Supply Situation 1984 6
2.41 General Water Supply Situation 62.42 Piped Water Supply Schemes 10
3 SURFACE WATER RESOURCES REVIEW 14
3.1 General 143.2 Meteorology 143.3 Precipitation 153.4 Hydrometry 15
3.41 General 153.42 Network 193.43 Flow Records 23
3.5 Surface Water Resources 24
4 GROUNDWATER RESOURCES REVIEW 26
4.1 General Hydrogeological Conditions 264.2 Hydrogeological Data 1976 - 1984 27
4.21 General 274.22 Shallow Groundwater 274.23 Deep Groundwater 31
4.3 Basement Study 324.4 Groundwater Potential 34
4.41 General 344.42 Masasi District 344.43 Mtwara District 364.44 Newala District 364.45 Kilwa District 374.46 Lindi District 374.47 Liwale District 384.48 Nachingwea District 38
LIST OF FIGURES
No. Title
Planning Area: Mtwara and Lindi Regions
Mean Annual Precipitation 1936 - 1983
Precipitation during the Rainy Seasons 1976 - 1983
Precipitation during the Rainy Seasons 1976 - 1983
Hydrometric Stations
Dam Storage, Shallow Wells and Precipitation in Masasi 1980 - 1983
General Shallow Groundwater Potential
LIST OF TABLES
No. Title
1 Main Water Supply Systems; Mtwara Region
2 Main Water Supply Systems; Lindi Region
3 Distance to Main Supply
4 Use of Different Types of Water Supplies
5 Water Supply Service Level
6 Main Complaints on the Water Supply Situation
7 Piped W/S Coverage
8 Sources of Piped Water Supply
9 Operation of Piped W/S
10 Climatological Statistics in Mtwara and Lindi Regions
11 Hydrometric Station
12 Periods of Hydrometric Records
13 Recorded Minimum Flows 1968 - 1983
14 Annual Surface Water Resources
15 Hydrogeological Zones
16 Handpump Wells Constructed 1976 - 1984
17 Water Availability in Hand Pump Wells
18 Reliability of Wells in 1983 Dry Season
19 Boreholes Drilled in 1976 - 1984
20 Yield of the Boreholes

LIST OF APPENDICES
No. Title
1 Village Questionnaire Form
2 Village Data Form
3 Basic Village Data
4 Selected Village Data
5 Piped Water Supply Questionnaire Form
6 Piped Water Supply Schemes
7 Precipitation Stations
8 Precipitation During Rainy Seasons 1976 - 1983
9 River Flow Data
10 Groundwater Quality Data
11 Borehole Data
12 Basement Study

ABBREVIATIONS AND ACRONYMS
1(2)
AfDB
AFYA
CCT
C.I.
DED
DP
DTH
DWE
EC
EEC
FIM
FINNIDA
FW
GDP
G.S.
led
MAJI
ODA
O & M
African Development Bank
Ministry of Health
Christian Council of Tanzania
Cast Iron
District Executive Director
Domestic Water Point (public tap)
Down-the-Hole Hammer (drilling rig)
District Water Engineer
Electrical Conductivity
European Economic Community
Finnish Mark
Finnish International Development Agency
Finnwater Consulting Engineers
Gross Domestic Product
Galvanized Steel
Litres per capita per day
Ministry of Water, Land, Housing and Urban Development
Overseas Development Administration (United Kingdom)
Operation and Maintenance

PMO
Project
PVC
RDD
RWE
TAS
UNDP
UNICEF
USD
WMP-77
WMPCU
Prime Minister's Office
Mtwara-Lindi Rural Water Supply Project
Polyvinyl Chloride
Regional Development Director
Regional Water Engineer
Tanzanian Shilling
United Nations Development Programme
United Nations Children's Fund
United States Dollar
The Mtwara-Lindi Water Master Plan (1977)
Water Master Planning Coordination Unit
- 1 -
1 . • . . • • • • . . • . • • , • •• • • • •
INTRODUCTION
The Mtwara-Lindi Water Master Plan Study was carried out in 1974-76 and a
report was completed in 1977.
The need to update the WMP-77 has already been recognized for some time and
this work was included in the Phase III Programme of the Mtwara-Lindi Rural
Water Supply Development Project. The importance of the updating was
ernphazised during the evaluation of the Project at the beginning of 1994 and
Terms of Reference for it were included in the evaluation report.
Due to the financial constraints it was agreed that the revised plan shall deal with
the water supply sector only.
The objectives of the updating work were outlined in the evaluation report:
(a) To update the assessment of both groundwater and surface water
resources.
(b) To assess the present level of water service and the relationship of this
to the pre-Project level.
(c) To make a proposal for the future water supply development, taking into
account following aspects:
. ' • • • - community involvement in Project activities,
district focus (district and village councils),
selection of suitable technologies,
- the current national economic situation,
- population growth since the 1978 census,
any other local factor.
The work was started in June, 1984 and was carried out by the Finnwater
organization which has been strengthened by experts specifically assigned to this
work. Co-operation with the local MAJI organization has been close and staff
were made available for this work, particularly for the village survey. Contacts
with the Water Master Planning Co-ordination Unit and other authorities
especially on the regional and district levels have been frequent.
- 2 -
The Draft Interim Report including the assessment of the present water supply
situation, the water resources review, water demand estimates and the proposed
planning criteria was presented in May, 1985. The report was discussed and
commented upon in May-July, 1985.
The Draft Water Supply Development Plan including presentation of water supply
methods and their costs, alternative projects, and the actual water supply
development plan, was completed in October, 1985. The report was discussed and
commented upon in December, 1985.
This Final Report comprises three volumes:
Volume
Volume
Volume
1
2
3
Main Report
Studies
Maps
The area covered by the plan - Mtwara and Lindi Regions - is shown in Figure 1.

- 3 -
FIGURE 1 PLANNING AREA: MTWARA AND LINDI REGIONS
100 km
LEGEND
•_ •_» international border
»——•>_ Regional boundary
_ . — . _ . Dlalncl boundary
lwa Masoko
Nachingwaa i
NACHINGWEA ,'
/MTWARA REGION

- 4 -
2 . • ! • • . i :- ' . • : • • • • : • . • • ' ' • • ' • :
. . . . •
WATER SUPPLY INVESTIGATIONS
2JL General
The aim of the investigations has been to establish a true picture of the prevailing
water supply situation in different parts of the area. For that purpose following
investigations have been carried out:
village survey
piped water supply schemes inspection
Information gathered in the field has been checked and compared with the data
collected from MAJI Headquarters and regional and district offices and from
other regional and district authorities. Records kept by Finnwater have also been
used. Aerial photographs taken in 1981 were used when locating the villages and
settlements were pinpointed in.
The water supply situation of the major urban settlements, Mtwara-Mikindani
town and Lindi town were studied separately.
2.2 Village Survey
During the village survey, practically all of the 900 registered villages were
visited. In addition, about 200 sub-villages were also surveyed. The total number
of sub-villages and other rural settlements is not known since their official status
is not always clear, but their number can be estimated at around 700 -800.
The survey was carried out between August 1984 and March 1985 by survey teams
of 1 - 2 water supply technicians. The number of teams in the field varied from 1
to 3 at a time. During the survey, village officials were interviewed on the precise
location, population, livestock, present water situation, future water supply,
health, sanitation of the villages, village economy and willingness to participate in
the water supply development. Water supply systems of the villages were also
visited by the teams. The Questionnaire Form used in the survey can be seen in
- 5 -
Appendix 1. The data collected in the villages were checked and then processed
by a computer. The format of the computer listing on which all that information
is available, is reproduced in Appendix 2. The basic village data are presented in
Appendix 3. Selected data are summarized in Appendix 4.
Based on the results of the survey and other studies, the maps included in WMP-77
showing the villages and administrative areas have been updated. They are shown
on Drawings 2, 3 and 4, 1:250,000, of Volume 3.
Village survey can be considered fairly successful and the picture it gives on the
water supply situation accurate, although mistakes can be found in the data of
individual villages. Figures on population and livestock in particular, obtained
from different sources, are often contradictory.
2.3 Piped Water Supply Schemes Inspection
All the existing 143 piped supply schemes were visited by a senior officer between
August 1984 - February 1985. During the visit, the different parts of each scheme
were inspected and evaluated and the need and usefulness of rehabilitation was
assessed. The form used in the investigations is in shown Appendix 5. The
important data of the rural water supplies are in Appendix 6. The locations of the
water supplies are shown on Drawings 7, 8 and 9, 1:250,000, Volume 3.
There are a number of incomplete or fully abandoned piped water supply schemes
in the area. Most of them were not included in the inspection. The same applies to
those private water schemes which are of little public importance.

2.4 Water Supply Situation 1984
2.21 General Water Supply Situation
The water supply situation in the area can be described in terms of water supply
systems used by the people and by the levels of service of these systems.
The use of different types of water systems as the main supply is summarized in
Tables 1 and 2. The term "main water supply" represents the villagers' opinion as
to which was their most important source of water at the time of the survey
during the dry season 1984.
TABLE 1 Main Water Supply Systems; Mtwara Region
Population 1984
1. Piped W/S
2. Handpumps
3. Open well or pit
4. River
5. Dam
6. Spring
7. Rainwater
Masasi
307,400
34 %
27 %
33%
6 %
<1 %
-
-
Mtwara
142,100
27 %
33 %
28 %
4 %
5 %
3 %
Newala
328,200
54 %
4 %
16 %
1 %
<1 %
22 %
2 %
MtwaraUrbanDistrict
90,600
85 %
15%
-
-
-
-
-
Mtwara R.Total
868,300
46%
18 %
2 2 %
3 %
1 %
9 %
1 %
TABLE 2 Main Water Supply Systems; Lindi Region
Popul. 1984
1. Piped W/S
2. Handpump
3. Open wellor pit
4. River
5. Dam
6. Spring
7. Rainwater
Kilwa
130,500
23 %
39%
29 %
9 %
-
-
Lindi
260,000
14 %
46 %
25 %
13 %
2 %
-
-
LindiUrbanDistrict
36,600
68 %
-
32 %
-
-
-
-
Liwale
49,900
34%
26 %
33 %
7 %
-
-
-
Naching-wea
117,400
37 %
30 %
28 %
3 %
2 %
-
-
Lindi R.Total
594,400
25 %
37 %
28 %
9 %
1 %
-
-

- 7 -
The distance to the nearest water abstraction point varies greatly and is normally
longer to traditional water sources. The average distance to the main water
supply is 1.8 km in Mtwara Region and 1.1 km in Lindi Region. The distribution of
population at various distances from water is shown in Table 3.
TABLE 3 Distance to Main Supply
Distance
0 - 0.5 km
0.6- 1.0 km
1.1- 2.0 km
2.1 - 5.0 km
> 5.0 km
% of Population
66 %: 4 %
10 %
8 %
12 %
Normally there are several water supply systems in the villages and their use
often depends on the season and the purpose for which water is needed. Thus
nearby seasonal water sources are used during the rainy season and more distant
perennial water sources mainly during the dry season. Pits and surface water
sources are used for livestock whereas piped water and handpump wells are mainly
reserved for human consumption. The existence of different types of water
systems and numbers of people using them are shown in Table 4.
TABLE 4 The Use of Different Types of Water Supplies
1. Piped W/S
2. Handpump
3. Open well or pit
4. River
5. Dam
6. Spring
7. Rainwater collect
Mtwara
576
311
490
102
61
92
204
Region
,200
,600
,500
,800
,200
,100
,200
66 %
26 %
56 %
12 %
7 D/c
11 %
24%
Lindi Region
320,200
234,600
393,600
90,400
, 7,800
4,000
-
76 %
39 %
66 %
15 %
1 %
± /a
0 %
- 8 -
Rainwater is collected only in Makonde Plateau in Newala District, where 42 % of
the population have rainwater collection systems in their villages. Water is
normally collected from the surface into 5 - 1 5 m-̂ chambers dug into the ground.
The chambers are usually lined with cement, fenced but covered only with tree
brances or loose iron sheets. The systems are normally individually owned and
maintained. Water quality in the chambers is usually very poor. The rainwater
collection systems supply water during the rainy season and 2 - 3 months after i t.
In villages which have been served by Kitangari W/S, most rainwater systems have
been abandoned. Their upkeep should be encouraged, however, as useful stand-by
systems during break-downs.
The coverage of the different types of water système is not a sufficient index to
give an accurate picture of the actual situation of water supply. Some sources
are seasonal, and quite often improved water systems, especially piped water
schemes, do not function. In order to describe the situation a "service level"
criterion has been developed. It measures the improvement of the water supply
situation and the functioning of the improved systems. Four different categories
have been used:
0: No service. No improved water systems (piped W/S or hand pump)
constructed.
1: No real service. Improved W/S constructed but not functioning.
2: Limited service. Improved W/S constructed but operation, capacity or
water quality unsatisfactory.
3: Full service. Improved W/S functioning according to design criteria.
The water supply service level in each village is listed in Appendix 3 where also
the detailed description of each category appears. Piped W/S and handpumps are
first considered separately and the higher category of these two determines the
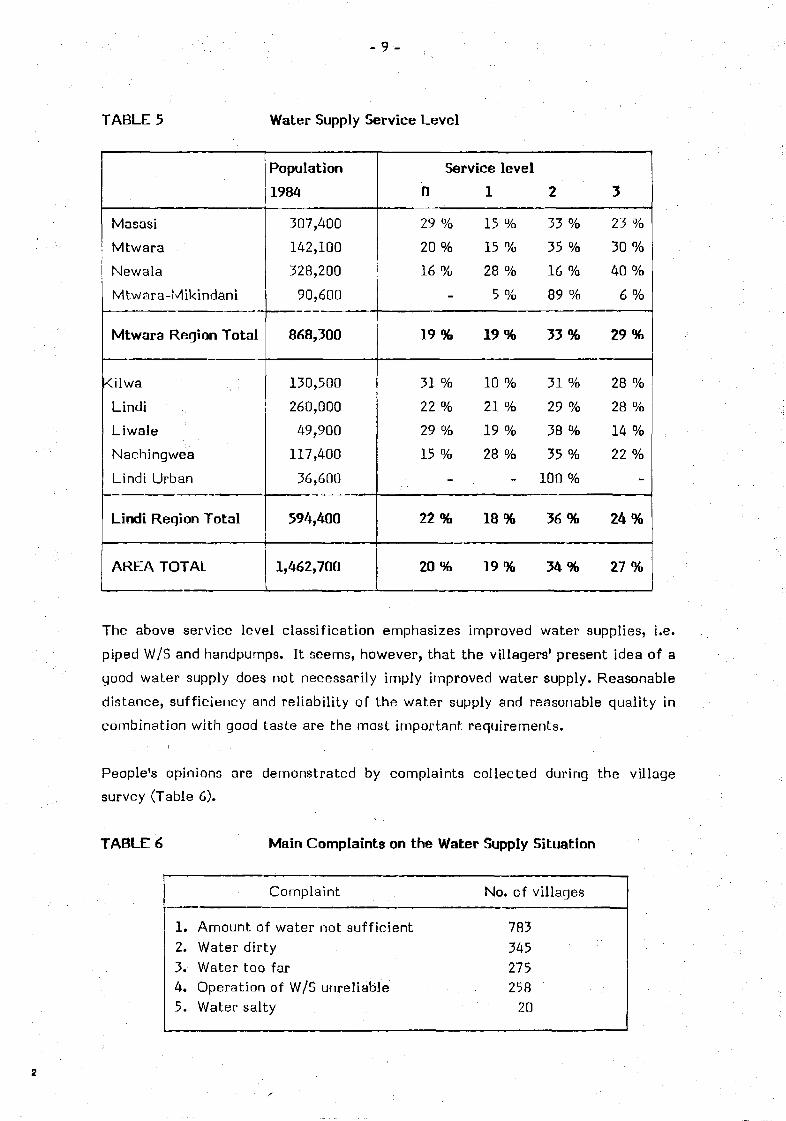
service level in the village. Table 5 shows the service levels in the regions and
districts.
- 9 -
TABLE 5 Water Supply Service Level
Masasi
Mtwara
Newala
Mtwara-Mikindani
Mtwara Region Total
Kilwa
Lindi
Liwale
Nachingwea
Lindi Urban
Lindi Region Total
AREA TOTAL
Population
1984
307,400
142,100
328,200
90,600
868,300
130,500
2é0,000
49,900
117,400
3ô,éOO
594,400
1,462,700
Service level
0 1 2 3
29 % 15 % 33 % 23 %
20 % 15 % 35 % 30 %
lé % 28 % lé % 40 %
5 % 89 % é %
19 % 19 % 33 % 29 %
31 % 10 % 31 % 28 %
22 % 21 % 29 % 28 %
29 % 19 % 38 % 14 %
15 % 28 % 35 % 22 %
- 100 %
22 % 18 % 36 % 24 %
20 % 19 % 34 % 27 %
The above service level classification emphasizes improved water supplies, i.e.
piped W/S and handpumps. It seems, however, that the villagers1 present idea of a
good water supply does not necessarily imply improved water supply. Reasonable
distance, sufficiency and reliability of the water supply and reasonable quality in
combination with good taste are the most important requirements.
People's opinions are demonstrated by complaints collected during the village
survey (Table 6).
TABLE 6 Main Complaints on the Water Supply Situation
Complaint
1. Amount of water not sufficient2. Water dirty3. Water too far4. Operation of W/S unreliable5. Water salty
No. of villages
783
345
275
258
20

- 10 -
2.42 Piped Water Supply Schemes
The coverage of the piped water schemes, i.e. the number of people within the
service areas of the schemes, is presented in Table 7. It should be noted that this
table does not take into consideration the level of service the schemes are giving.
TABLE 7 Piped W/S Coverage
Masasi
Mtwara
Newala
Mtwara-Mikindani
Mtwara RegionTotal
Kilwa
Lindi Rural
Liwale
Nachingwea
Lindi Urban
Lindi RegionTotal
AREA TOTAL
Totalpopulation1984
307,400
142,100
328,200
90,600
868,300
130,500
260,000
49,900
117,400
36,600
594,400
1,462,700
No.ofschemes
26
18
6
2
52
18
31
15
26
1
91
143
Piped schemes coveragepopulation %
147,500 48 %
75,700 53 %
252,800 77 %
58,000 64 %
534,000 62%
49,700 38 %
118,200 45 %
28,700 57 %
84,600 72 %
36,600 100 %
317,800 53%
851,800 53 %
Although 58 % of the population is living in the service areas of piped water
supply schemes, only 37 % consider the piped W/S as their main source of water.
(See Tables 1 and 2)
- 1 1 -
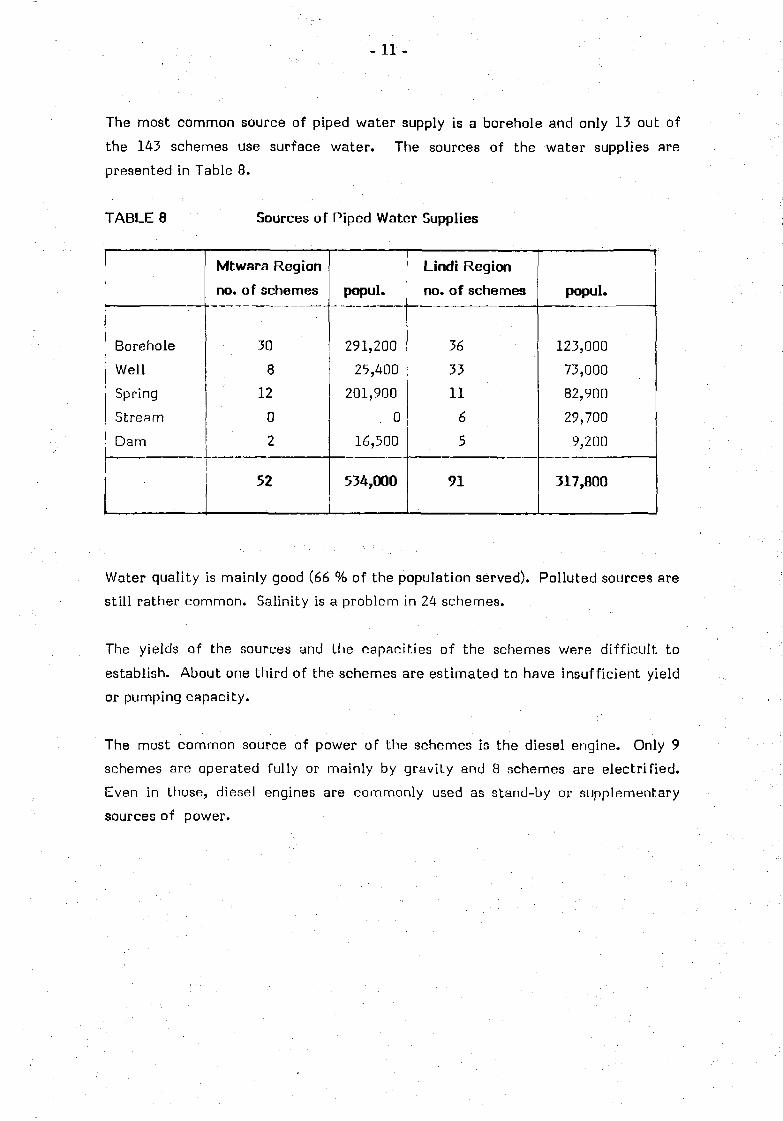
The most common source of piped water supply is a borehole and only 13 out of
the 143 schemes use surface water. The sources of the water supplies are
presented in Table 8.
TABLE 8 Sources of Piped Water Supplies
Borehole
Well
Spring
Stream
Dam
Mtwara Region
no. of schemes
30
8
12
0
2
52
popul.
291,200
25,400
201,900
0
16,500
534,000
Lindi Region
no. of schemes
36
33
11
6
5
91
popul.
123,000
73,000
82,900
29,700
9,200
317,800
Water quality is mainly good (66 % of the population served). Polluted sources are
stil l rather common. Salinity is a problem in 24 schemes.
The yields of the sources and the capacities of the schemes were diff icult to
establish. About one third of the schemes are estimated to have insufficient yield
or pumping capacity.
The most common source of power of the schemes is the diesel engine. Only 9
schemes are operated fully or mainly by gravity and 8 schemes are electrified.
Even in those, diesel engines are commonly used as stand-by or supplementary
sources of power.
- 12 -
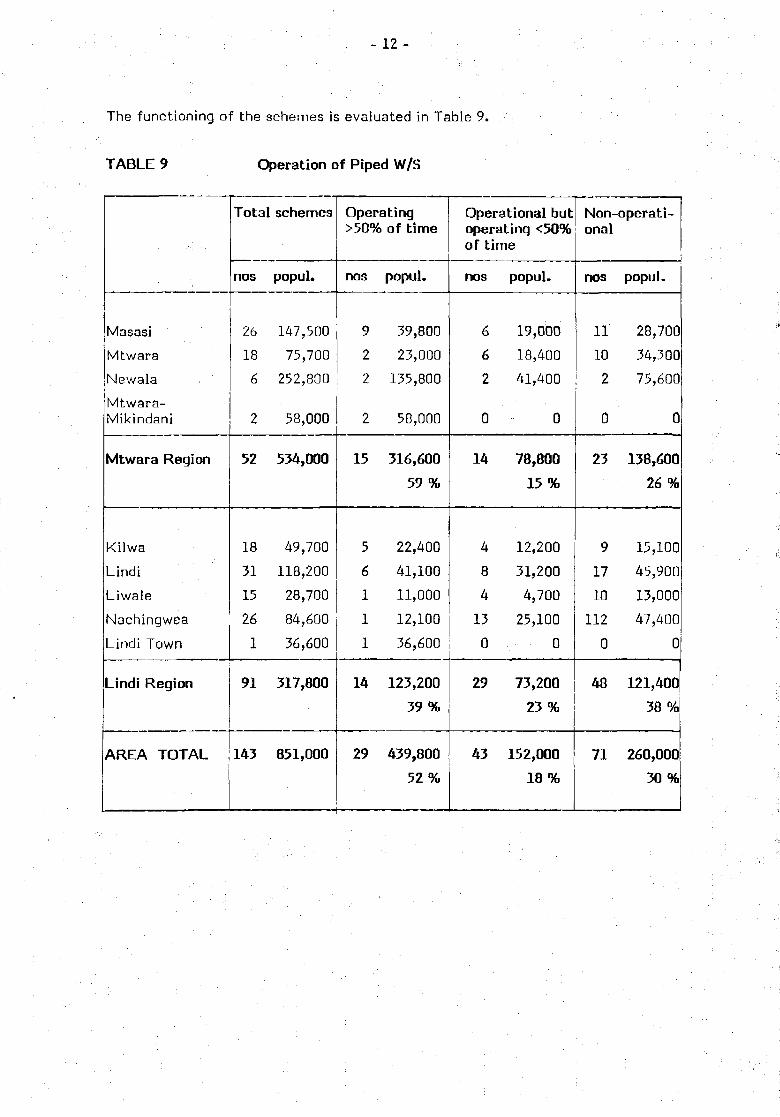
The functioning of the schemes is evaluated in Table 9.
TABLE 9 Operation of Piped W/S
Masasi
Mtwara
Newala
Mtwara-Mikindani
Mtwara Region
Kilwa
Lindi
Liwale
Nachingwea
Lindi Town
Lindi Region
AREA TOTAL
Total
nos
26
18
6
2
52
18
31
15
26
1
91
143
schemes
popul.
147,500
75,700
252,800
58,000
534,000
49,700
118,200
28,700
84,600
36,600
317,800
851,000
Operating>50% of time
nos
9
2
2
2
15
5
6
1
1
1
14
29
popul.
39,800
23,000
135,800
58,000
316,600
59%
22,400
41,100
11,000
12,100
3é,600
123,200
39%
439,800
52%
Operational butoperating <50%of time
nos
6
6
2
0
14
48
4
13
0
29
43
popul.
19,000
18,400
41,400
0
78,800
15%
12,200
31,200
4,700
25,100
73,200
23%
152,000
18%
Non-operati-onal
nos
11
10
2
0
23
9
17
10
112
0
48
71
popul.
28,700
34,300
75,600
0
138,600
26 %
15,100
45,900
13,000
47,400
0
121,400
38 %
260,000
30%

- 13 -
The operational status of the schemes varies from excellent to very poor, several
schemes having stayed out of operation for several years. Gravity schemes and
those located in major centres are performing better than the rest. The same
applies to the schemes constructed by the Project and thus getting special
assistance in their operation.
Where 52 % of the population within the service areas of all piped schemes are
getting reasonable service (> 50 % of the time), the figure with the urban schemes
is 76 %, and 42 % with the rural schemes. Of those rural schemes which are
supported by the Project, 86 % are working more than 50 % of the time whereas
the corresponding figure with the rest of the rural schemes is as low as 25 %,
practically all them gravity schemes.
The difference between Mtwara Region and Lindi Region in the coverage of well
operating schemes is caused by Kitangari W/S, which serves 120,000 people and
operates continuously.
The most important reasons for the poor operation are the lack of fuel and spare
parts. Poor standard of operation also seems to be a common problem. The poor
quality (salinity or bad taste) or insufficient yield of the source seem to lead to
operational problems in some cases, particularly in the Basement area and in the
Coastal strip.
If the present diff icult situation with regard to and spare parts could be solved, a
reasonable water supply service could be offered to about 150,000 more people.

- 1 4 -
SURFACE WATER RESOURCES REVIEW
3.1 General
The run-off in an area depends mainly on the precipitation, its seasonal
distribution and evaporation conditions. These vary considerably as to both the
total yield and seasonal distribution. Observations over several years are needed,
in order to establish a reliable picture of the mean value and fluctuations of the
run-off.
The observations of WMP-77 were based on the data available at that time.
Especially the records on river flows covered very short periods since most of the
recording stations as late as in the early 1970's. The additional data of 1976-84
improve the reliability of the observations although closures and non-functioning
of the stations have been frequent.
3.2 Meteorology
The most important climatological statistics of Mtwara and Lindi Regions are
presented in Table 10.
TABLE 10 Climatological Statistics in Mtwara and Lindi Regions
Stationandperiod
Lindi1935-55
Mtwara1957-70
Nachingwea1 Qf\1 -7f i
Liwale1969-76
Max+Min Mean
• °C X
26.1 30.5
25.7 30.2
24.5 30.2
MeanMjn
21.7
21.1
18.7
25.3 29.4 21.2(1971-72)
Kilwa K iv in je 27.0 30.0 24.01972-75 (1972-75)
TemperaturesExtremes
36.2 12.3
35.1 14.7
38.5 7.7
-
-
Dr°&24
25
23
-
-
y
C
.9
.4
.3
Bulb1200
&C
29.0
28.7
28.8
-
-
Dew Pointogoo igoo
21.7 22.0
21.9 21.4
19.2 17.9
19.2(69-72)
21.4(72-75)
Relat iveHumidity
* %
93 67
94 66
77 53
78.2(70-72)
77.9(72-75)
AverageWind Speed0600 1200
knots
5 9
9 11
6 6
km/day86.1
(71-72)
179.8(72-75)
AtmosphericPressure0600 1200mb. mb.
1010.8 1007.8
1002.2 999.4
-
-

- 1 5 -
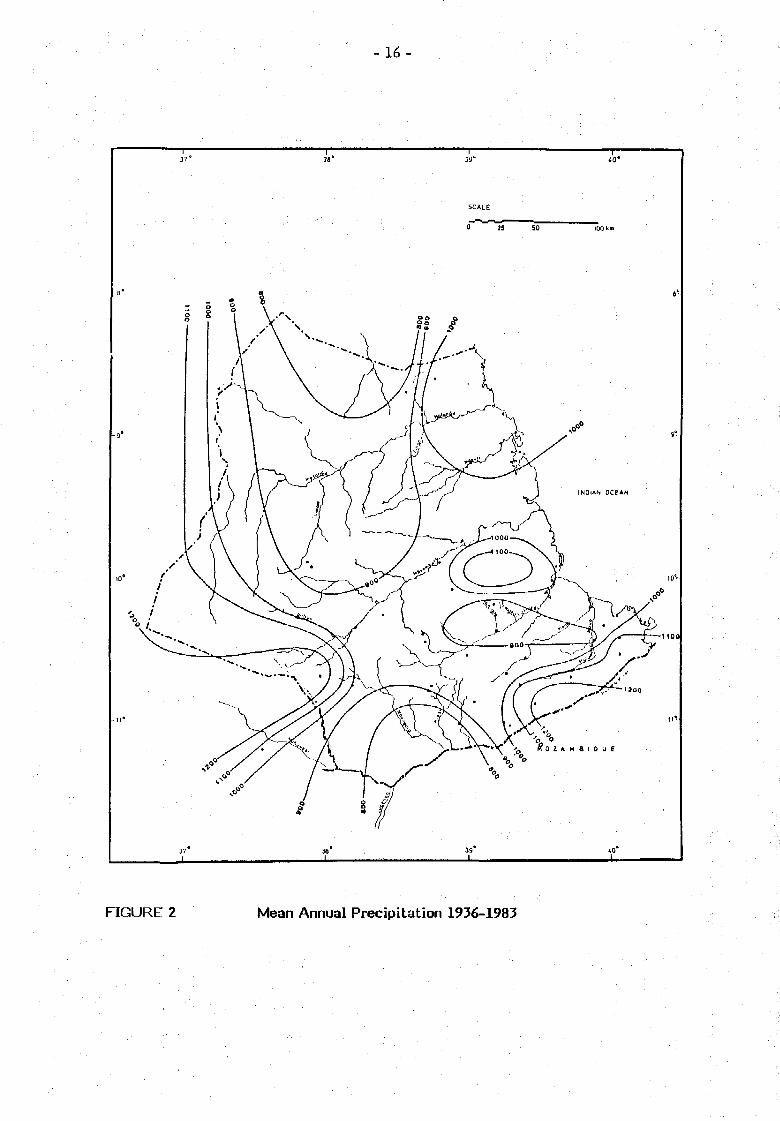
3.3 Precipitation
The mean annual precipitation of the area is relatively even varying from
1,200 mm to 800 mm. Annual variations, on the contrary, are rather large.
Precipitation rises up to 2,000 mm once in twenty years on the average. On the
other hand, an annual precipitation of 500 mm occurs once in twenty years.
Variations between individual stations are even greater. The highest annual
precipitation reading registered in the area was over 2,700 mm in a year and the
lowest below 200 mm.
There are, according to the records of the Meteorological Department and Maji,
96 precipitation recording stations in the area, 48 in both regions. The list of the
stations, their locations, years of operation and mean annual rainfall are listed in
Appendix 7. It can be seen that only about half of the stations have operated for
more than 5 full years. The data are often incomprehensive with a number of
months missing, and several stations are non-operational. The situation with the
precipitation recording can be considered unsatisfactory, especially in the
northern and western parts of the area.
The mean annual precipitation map is presented in Figure 2.
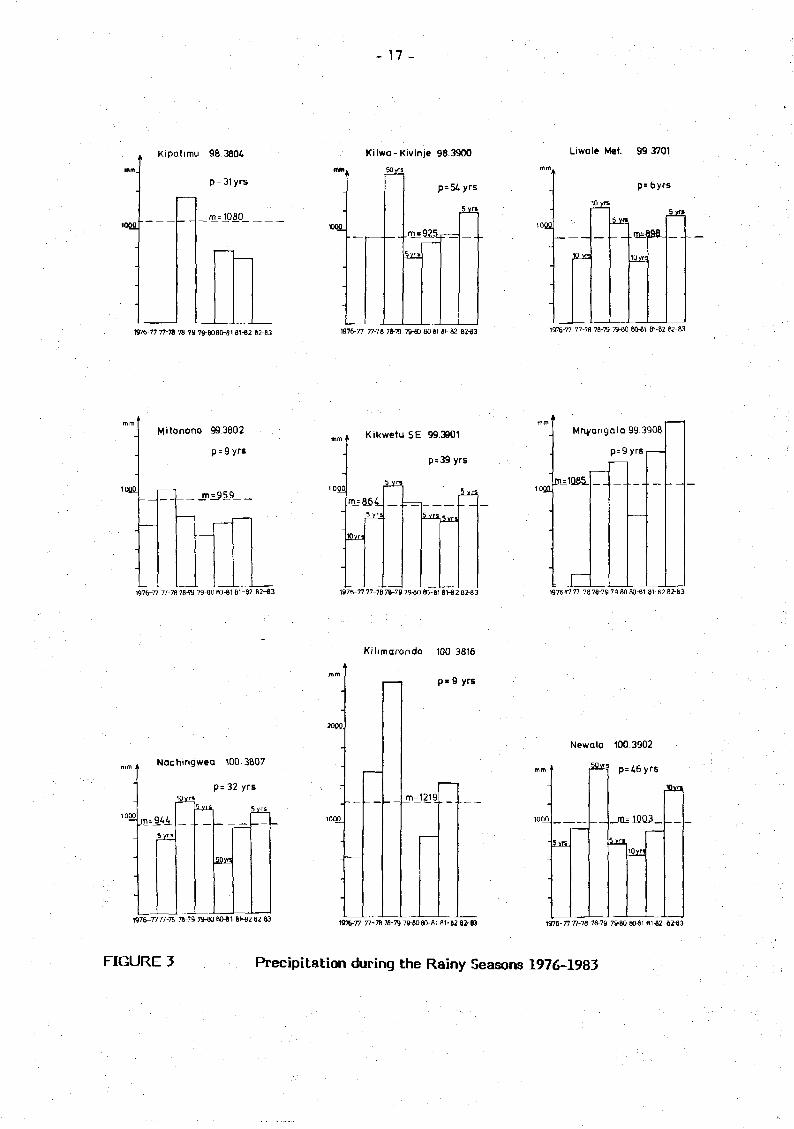
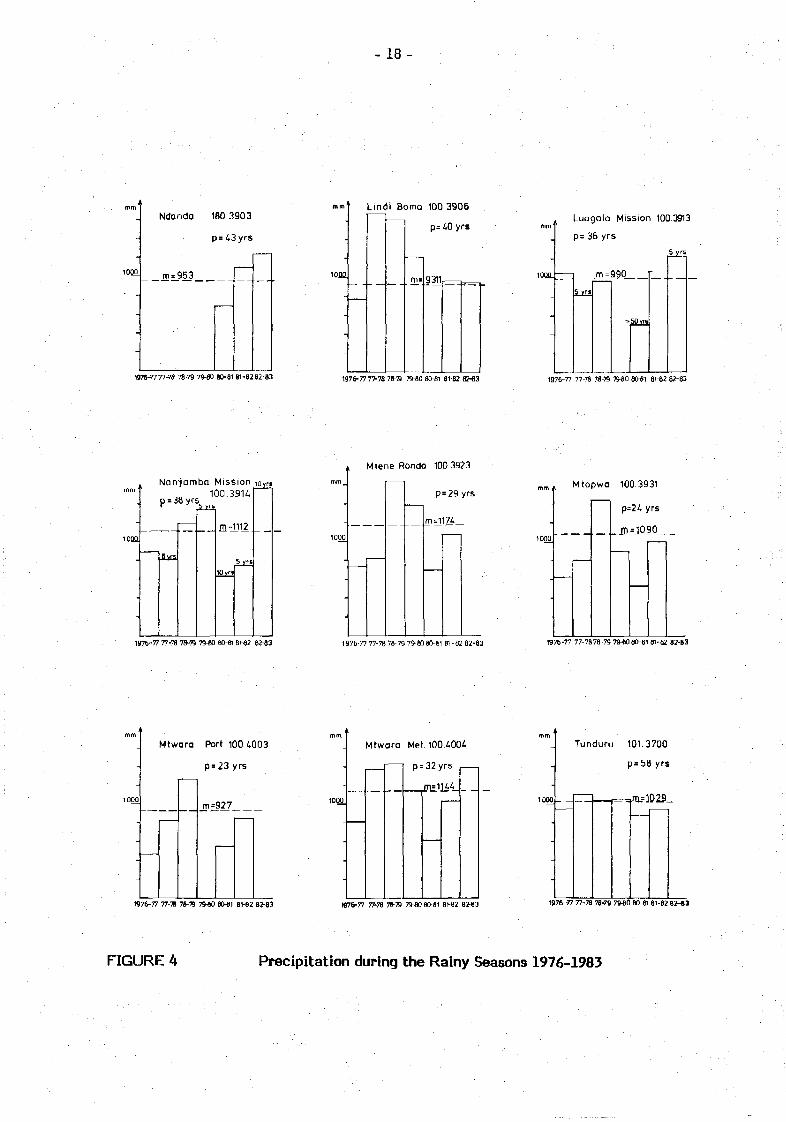
The average precipitation during the period 1976-1983 does not differ much from
that of the period 1931-1976 and can be considered as normal although regional
variations occur. The individual years vary more. The precipitations of the rainy
seasons at 18 stations during the period 1976-1983 are shown in Figures 3 and 4
and in Appendix 8. It can be clearly seen that the rainy season 1980-1981 was
below the average at all stations and in most cases represents a dry period
occuring only once in 10-50 years. The effect of that dry season was strengthened
by the season 1981-1982, which also was slightly below normal.
3.4 Hydrometry
3.41 General
There are five large rivers in the project area flowing into the Indian Ocean . The
rivers are the Matandu, the Mavuji, the Mbwenkuru, the Lukuledi and the Ruvuma.
The basins of the four first mentioned rivers vary in size from 3,000 to 15,000
krri2 which shows that they are rather large water courses. In spite of the large
- 1 6 -
FIGURE 2 Mean Annual Precipitation 1936-1983
- 17 -
10QO
Kipatimu 98 3804
p = 31 yrs
_mj=1080
1976-77 77-78 78-73 79-8OBO-81 81-82 82-83
Kilwa-Kivinje 98.3900
10QS..m = 92_V=
1976-77 77-78 78-79 79-80 8M1 81- 62 82-63
Liwole Met. 99 3701
10QJ2
10 yn
P = 6 yrs
1376-77 77-78 76-79 79-60 60-81 81-82 82-83
Mitonono 99 3602
m = 959
1976-77 7/-7B 78-™ 79-80 BO-81 81 -82 82-83
100.2
Kikwetu SE 99,3901
p=39yrs
1976-77 77-7B 78-73 79-80 SO-81 81-«2 82-83
102LBU1QB5.
Mr\yangala 99.3908
p=9yrs
7878-797980 80-81 8182 82-83
mm i
000
_
„Nachingweo
10yrs
5 yrs
5 yrs
100-3607
p= 32 yrs
5vrs
SPY"
«76-7777-76 78-79 79-80 8M1 8M2 82-63
20QSI
Ki l imarondo 100 3816
p « 9 yrs
1376-77 77-78 78-79 79-6080-81 81-82 82-83
Newala 1003902
50yrj
5 v n
1376-77 77-78 7S-79 79^0 8M1-81-82 62-83
FIGURE 3 Precipitation during the Rainy Seasons 1976-1983
- 1 8 -
Ndando 180 3903
p=43yrs
= 953
1876-7777-7$ 78-79 79-80 «0-81 81-B2B2B3
Lindi Borna 1003906
p=iO yrs
1976-77 77-7« 7S-B 79-80 80-81 81-82 82-83
loon.
Luagala Mission 100.3313
p= 36 yrsS yr
s_yll
1976-77 77-78 7a-79 TWO « M l 81-82 82-83
Nan^amba Mission100.391&
p = 38 yrs
5 yrs
1376-77 77-78 78-79 79-80 80-81 8V92 62-83
Mtene Rondo 100 3923
p = 29yrs
1976-77 77-78 78-79 79-80 80-61 81-82 82-83
10Q0
Mtopwa 100 3931
p=24 yrs
1976-77 77-7878-79 7M080-81 81-82 82-83
Mtwara Port 100 4003
p=23 yrs
m=927
«76-77 77-78 78-79 7W0 8W1 B1-82 82-83
10Q0.
Mtwara Met 100.4004
32yrs
1144
1976-77 77-78 7»-79 79-80 80-81 81-82 82-83
Tunduru 101 3700
p= 58 yrs
1976-77 77-78 78-79 79flO 80-81 81-82 82-83
FIGURE 4 Precipitation during the Rainy Seasons 1976-1983
- 19-
basins, the rivers dry up regularly for most parts every year. Only some minor
tributaries, mainly originating from springs on the slopes of the plateaus, cause
perennial flow in the actual tributaries and in the lower courses of some main
rivers.
There are five rather small lakes in the area which carry water all the year round,
i.e. Lake Chidya, Lake Kitere, Lake Rutamba, Lake Mkoe and Lake Maliwe. The
lake areas vary with the season. The total lake area is estimated at 18 knri2 only.
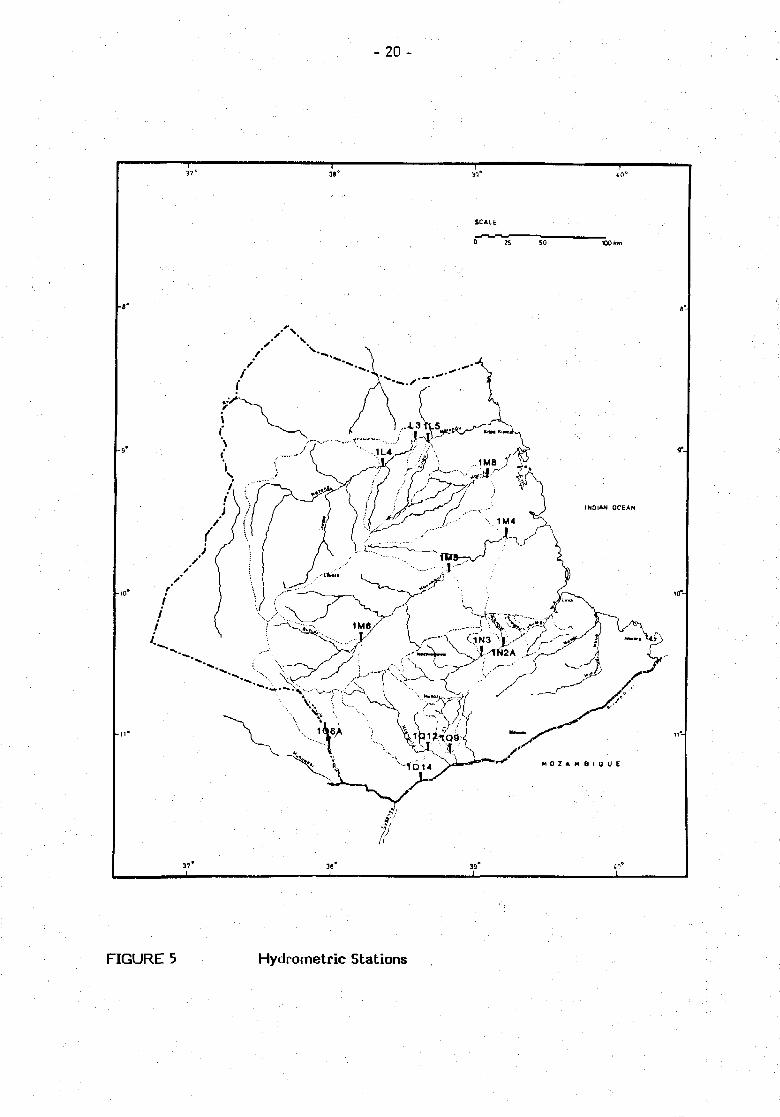
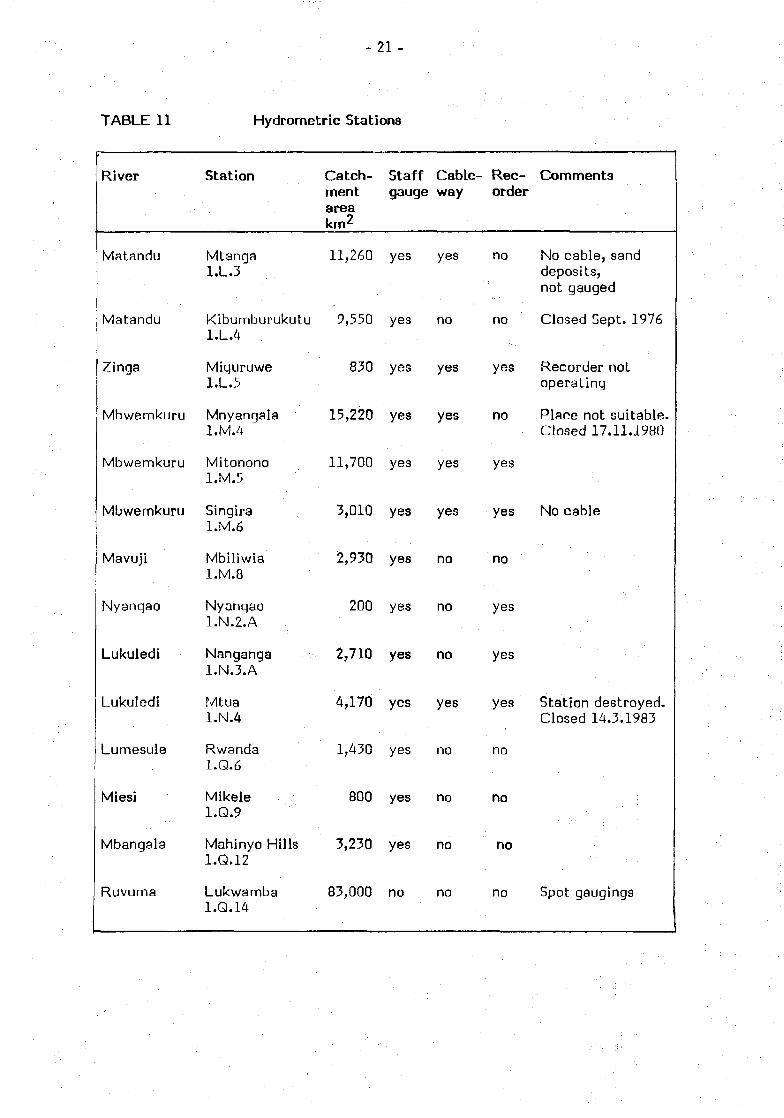
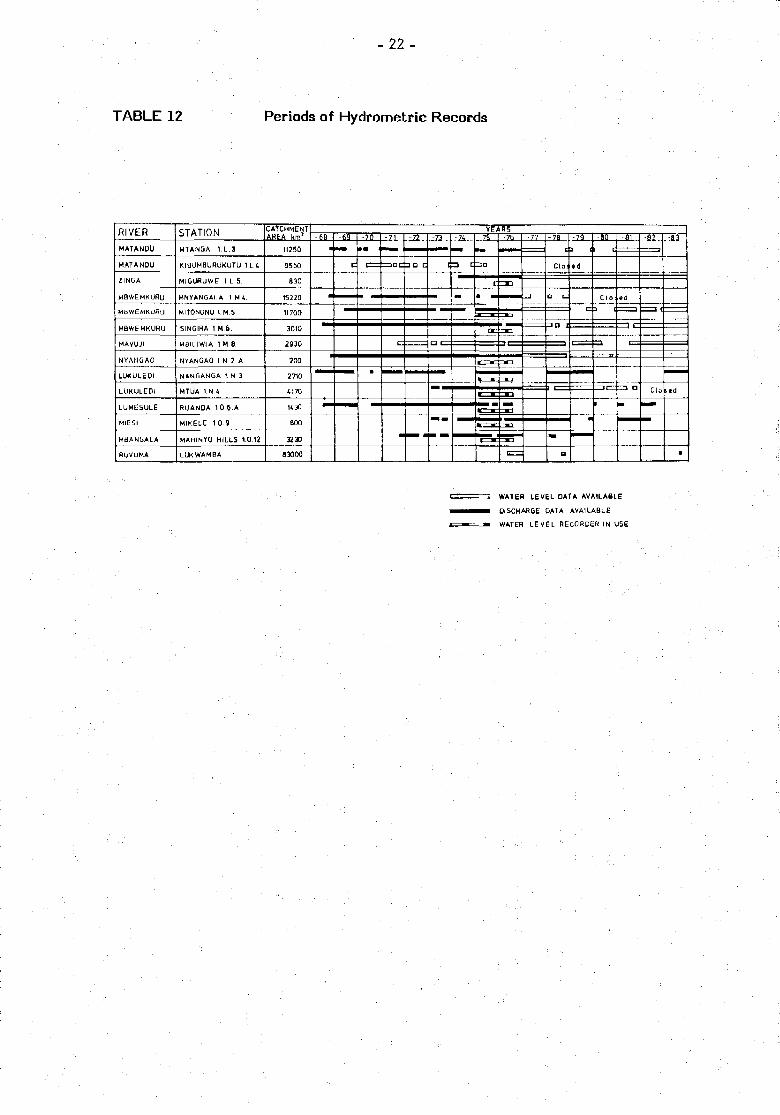
3.42 Network
The present hydrometric network in Mtwara and Lindi Regions consists of 12
stations. With one exception all stations are equipped with staff gauges, nine
stations have a recorder, although none of them is operating, and 11 stations are
eguipped with a cable way, of which only three are operational. The stations are
shown in Figure 5 and in Tables 11 and 12.
- 2 0 -
FIGURE 5 Hydrometric Stations
- 21 -
TABLE 11 Hydrometric Stations
River
Matandu
Matandu
Zinga
Mbwemkuru
Mbwemkuru
Mbwemkuru
Mavuji
Nyangao
Lukuledi
Lukuledi
Lumesule
Miesi
Mbangala
Ruvuma
Station
Mtanga1.L.3
Kibumburukutu1.L.4
Miguruwe1.L.5
Mnyangala1.M.4
Mitonono1.M.5
Singiral.M.é
Mbiliwia1.M.8
Nyangao1.N.2.A
Nanganga1.N.3.A
Mtua1.N.4
Rwanda1.Q.6
Mikele1.Q.9
Mahinyo Hills1.Q.12
Lukwamba1.Q.14
Catch-mentareakm2
11,260
9,550
830
15,220
11,700
3,010
2,930
200
2,710
4,170
1,430
800
3,230
83,000
Staffgauge
yes
yes
yes
yes
yes
yes
yes
yes
yes
yes
yes
yes
yes
no
Cable-way
yes
no
yes
yes
yes
yes
no
no
no
yes
no
no
no
no
Rec-order
no
no
yes
no
yes
yes
no
yes
yes
yes
no
no
no
no
Comments
No cable, sanddeposits,not gauged
Closed Sept. 1976
Recorder notoperating
Place not suitable.Closed 17.11.1980
No cable
Station destroyed.Closed 14.3.1983
Spot gaugings
- 22 -
TABLE 12 Periods of Hydrometric Records
RIVER
MATANDU
MATANOU
ZINGA
MBWEMKURu
MBWEMKURU
MBWFHKLIRIJ
MAVUJI
LUKULEDI
LUMESULE
MIESI
MBANGALA
RUVUMA
STATION
MTANGA I L , 3
KIBUMBURUKUTU 1 H
MIGURUWE 1 L 5
MNVANGAI A 1 M L
MITONONO I.M.S
SINGIRA I M G .
M8IUWIA 1 H 8
NYAN6A0 I N 2.A
MTUA I N 4
RUANDA 10 6 A
MIKELE 1 0.9
MAHINYO HILLS 10.12
LUKWAMBA
CATCHMENTAREA km 1
11250
3550
830
15220
11700
3010
2930
200
4170
UJtJ
BOO
3230
93000
VEAKS ' ' ~-66
*
-69
C
•7(1 -ZL
m c c
^^m m
-7J...
c
~1
- —
:1k..
-
13 D
C
• H
m—•-
H •-!
^ ^ 1T • ;
- • I
ncn
pn
ZM3
_ ^
E =
-77 -7(1c
Clo
D C
3 D J
-
D
-70
3 1
«d
c
•BO
C I S
1-
J 3 |
Clo ,»d
•
WATER LEVEL DATA AVAILABLE
DISCHARGE DAT* AVAILABLE
WATER LEVEL RECORDER IN USE
- 23 -
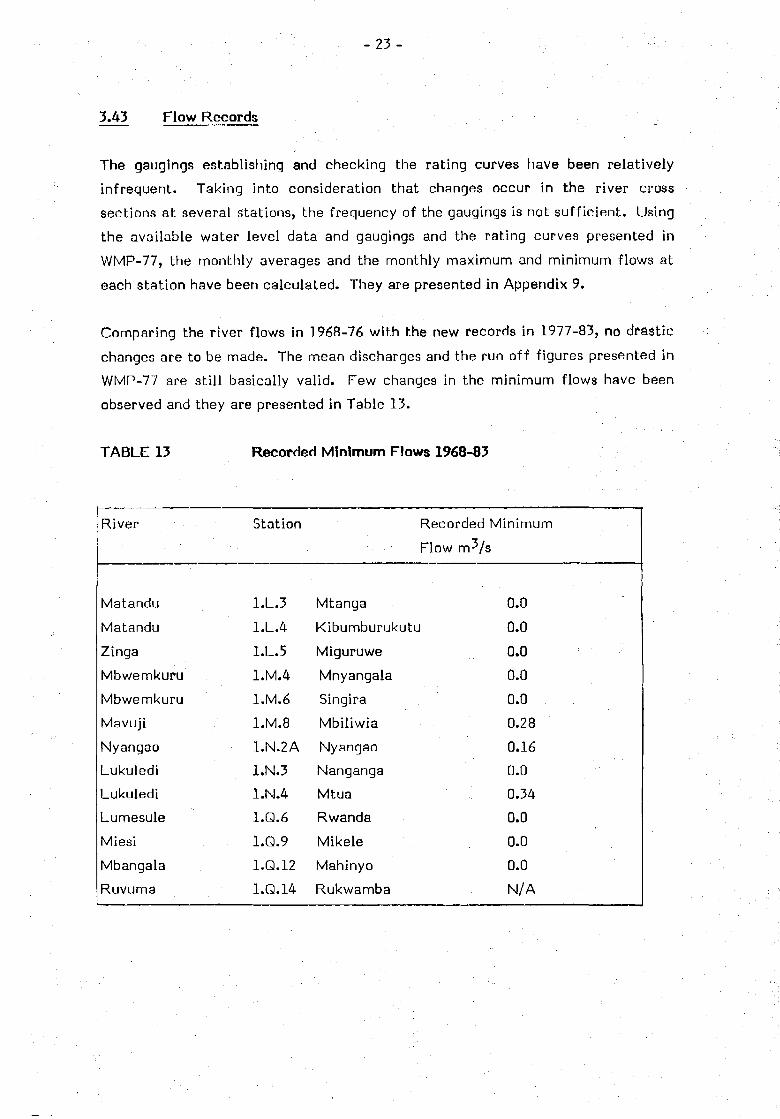
3.43 Flow Records
The gaugings establishing and checking the rating curves have been relatively
infrequent. Taking into consideration that changes occur in the river cross
sections at several stations, the frequency of the gaugings is not sufficient. Using
the available water level data and gaugings and the rating curves presented in
WMP-77, the monthly averages and the monthly maximum and minimum flows at
each station have been calculated. They are presented in Appendix 9.
Comparing the river flows in 1968-76 with the new records in 1977-83, no drastic
changes are to be made. The mean discharges and the run off figures presented in
WMP-77 are sti l l basically valid. Few changes in the minimum flows have been
observed and they are presented in Table 13.
TABLE 13 Recorded Minimum Flows 1968-83
River
Matandu
Matandu
Zinga
Mbwemkuru
Mbwemkuru
Mavuji
Nyangao
Lukuledi
Lukuledi
Lurnesule
Miesi
Mbangala
Ruvuma
Station
1.L.3
1.L.4
1.L.5
1.M.4
1.M.6
1.M.8
1.N.2A
1.N.3
1.N.4
1.Q.6
1.Q.9
1.Q.12
1.Q.14
Recorded
Flow m-V
Mtanga
Kibumburukutu
Miguruwe
Mnyangala
Singira
Mbiliwia
Nyangao
Nanganga
Mtua
Rwanda
Mikele
Mahinyo
Rukwamba
Minimum
s
0.0
0.0
0.0
0.0
0.0
0.28
0.16
0.0
0.34
0.0
0.0
0.0
N/A

- 2 4 -
3.5 Surface Water Resources
The surface water data collected during 1977-83 is incomprehensive and
additional information in it is limited. It supports the conclusions of the earlier
WMP-77.
The potential surface water resources of the different river basins are shown in
Table 14. The run-off values are based on the results of the earlier report
corrected in view of the recent data. The figures represent the minimum run-offs
occuring once in five to ten years.
TABLE 14 Annual Surface Water Resources
River Basin
Matandu
Mavuji
Mbwemkuru
Lukuledi
Lindi Region Total
Mwiti
Miesi
Mbangala
Lukwimba
Lumesule
Mtwara Region Total
Ruvuma River
Catchment Areaassessedkm*
11,700
2,900
11,600
4,200
30,200
900
520
3,200
370
1,880
6,870
Annual
mm
3.73.3
7.63.0
5.1
2.8
2.8
9.9
12.0
12.8
9.8
Net Run Off
103 m3/day
119.3
26.0
240.0
34.5
419.8
6.8
6.8
87.1
12.2
65.5
177.4
2,500.0
- 25 -
The present source of water supplies in Mtwara and Lindi Regions is almost
entirely groundwater. The same trend appears to continue. As a source of water
supplies, therefore surface water is of limited importance. In some areas,
however, the use of surface water may become important. Big towns, Mtwara,
Lindi, Masasi, Liwale and Kilwa-Masoko with upcoming industry are likely to use
surface water in the future.
Although the water supply for livestock, in most cases, is arranged together with
the domestic water supply, the incresing number of livestock represents in some
areas, especially in Masasi, a special water demand which can be separately
satisfied with surface water. Small dams can be constructed by local means and
they can, if properly located, designed and constructed, supply low quality
surface water for livestock. Water in a dam, however, is not suitable for human
consumption without treatment. One method of arranging a domestic water supply
at a darn is constructing hand pump wells on the sides of the dam and arranging
permeable but sufficiently long connections between the dam and the wells.
In areas where no ground or surface water is available, such as Makonde Plateau,
Rondo Plateau and along the coast, rainwater collection can be used as an
addition or alternative to other types of water supplies.
Considering the above observations together with the possible future irrigation
projects, it is important to continue collecting data on precipitation and river
flows. The present deteriorating networks should be rehabilitated and the
reliability and continuity of the readings and record collection should be
improved.
GROUNDWATER
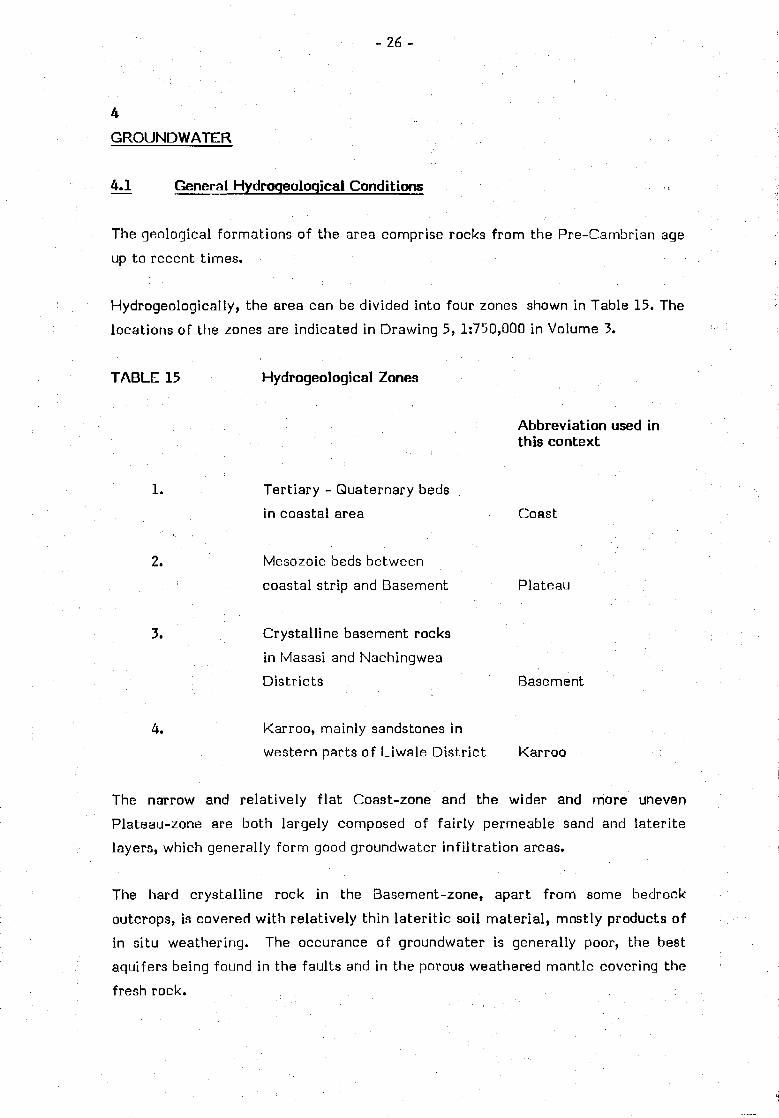
4.1 General Hydroqeoloqical Conditions
The geological formations of the area comprise rocks from the Pre-Cambrian age
up to recent times.
Hydrogeologically, the area can be divided into four zones shown in Table 15. The
locations of the zones are indicated in Drawing 5, 1:750,000 in Volume 3.
TABLE 15 Hydrogeological Zones
Abbreviation used inthis context
1. Tertiary - Quaternary beds
in coastal area Coast
2. Mesozoic beds between
coastal strip and Basement Plateau
3. Crystalline basement rocks
in Masasi and Nachingwea
Districts Basement
4. Karroo, mainly sandstones in
western parts of Liwale District Karroo
The narrow and relatively flat Coast-zone and the wider and more uneven
Plateau-zone are both largely composed of fairly permeable sand and latérite
layers, which generally form good groundwater infiltration areas.
The hard crystalline rock in the Basement-zone, apart from some bedrock
outcrops, is covered with relatively thin lateritic soil material, mostly products of
in situ weathering. The occurance of groundwater is generally poor, the best
aquifers being found in the faults and in the porous weathered mantle covering the
fresh rock.

- 27 -
The Karroo sediments comprise mainly sandstones, the other main rock types
being l imestone, mudstone, claystone and conglomerate. The hydrogeology of
Karroo is not wel l known, but the general groundwater potent ia l is assumed to be
good.
4^2 Hydroqeoloqical Data 1976-1984
4.21 General
After the completion of the Water Master Plan Study in 1976, additional
information on ground-water conditions in Mtwara and Lindi Regions has been
accumulated during the planning, construction and operation of the boreholes and
shallow wells. The information collected during the actual implementation of the
water supplies and no special surveys or observations on the groundwater situation
were carried out during the period.
In general, the recent data supports the conclusions of WMP-77. Nevertheless, the
Basement-zone in Masasi as well as some coastal areas, such as Pande, have
proved more difficult than estimated from the groundwater point of view.
4.22 Shallow Groundwater
During the period 1976-1984, altogether 1,817 handpump wells were constructed.
The list of the wells by districts is in Table 16. The well construction areas are
marked in Drawing 5 of Volume 3.
TABLE 16 Handpump Wells constructed 1976-1984
District
MasasiMtwaraNewalaKilwaLindiLiwaleNachingwea
Total
Ring wells
416173
4190
318
60
169
1,330
Tube wells
68
143
3521
169
59
450
HandpumpTotal
484316
39
211
487
55178
1,780
wellsAbandoned
142372
10-
2
58
- 2 8 -
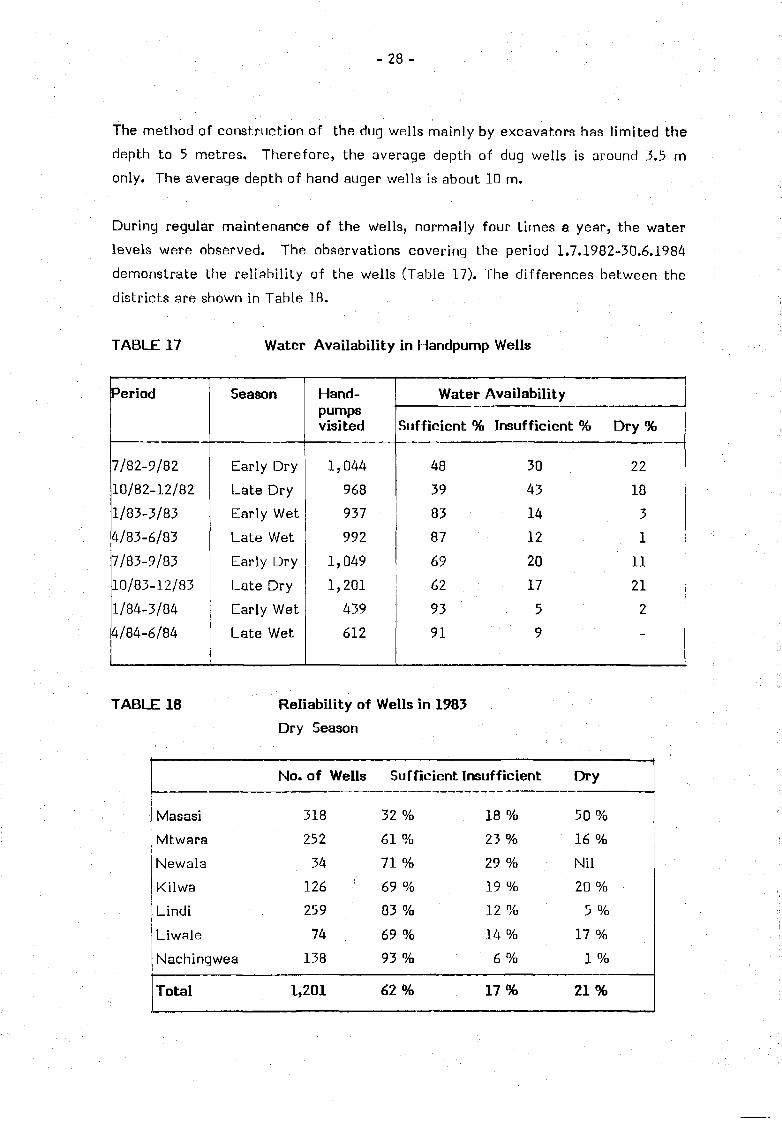
The method of construction of the dug wells mainly by excavators has limited the
depth to 5 metres. Therefore, the average depth of dug wells is around 3.5 m
only. The average depth of hand auger wells is about 10 m.
During regular maintenance of the wells, normally four times a year, the water
levels were observed. The observations covering the period 1.7.1982-30.6.1984
demonstrate the reliability of the wells (Table 17). The differences between the
districts are shown in Table 18.
TABLE 17 Water Availability in Handpump Wells
Period
7/82-9/82
10/82-12/82
1/83-3/83
4/83-6/83
7/83-9/83
10/83-12/83
1/84-3/84
4/84-6/84
Season
Early Dry
Late Dry
Early Wet
Late Wet
Early Dry
Late Dry
Early Wet
Late Wet
Hand-pumpsvisited
1,044
968
937
992
1,049
1,201
439
612
Water
Sufficient %
48
39
83
87
69
62
93
91
Availability
Insufficient %
30
43
14
12
20
17
5
9
Dry %
22
18
3
1
11
21
2
-
TABLE 18 Reliability of Wells in 1983
Dry Season
Masasi
Mtwara
Newala
Kilwa
Lindi
Liwale
Nachingwea
Total
No. of Wells
318
252
34
126 '
259
74
138
1,201
Sufficient Insufficient
32 %
61 %
71 %
69 %
83 %
69 %
93 %
62%
18 %
23%
29 %
19 %
12 %
14 %
6 %
17%
Dry
50%
16 %
Ni l
20 %
5 %
17 %
1 %
2 1 %

- 29 -
Rainfall in 1983 was relatively normal but ground water levels were sti l l affected
by the exceptionally dry period 1981-82. The rainy season 1983-84 was normal or
above normal. Dug wells, which normally have been constructed in poorer
aquifers, dry easier than hand auger wells. 3y the end of the 1983 dry season, 53
% of the dug wells were sufficient whereas the corresponding figure of the hand
auger wells was 75 %. ;
The large fluctuations of the water table was the most important reason for the
unreliability of the wells.
The fluctuation comes from the perched water sources utilized by the majority of
the hand pump wells both in sedimentary and in basement areas. In the Basement,
the small perched water aquifers lie at the depth of 1.5...3.5 m. Underneath there
are normally about 20 m thick impermeable clayey formations above the porous
weathered zone of the basement rock. Because of the limited storage capacity of
the upper aquifer, many of the wells dry up or have insufficient yields during dry
seasons. The deepening of wells is normally also useless as the next aquifer, if i t
exists, is too far down for dug wells.
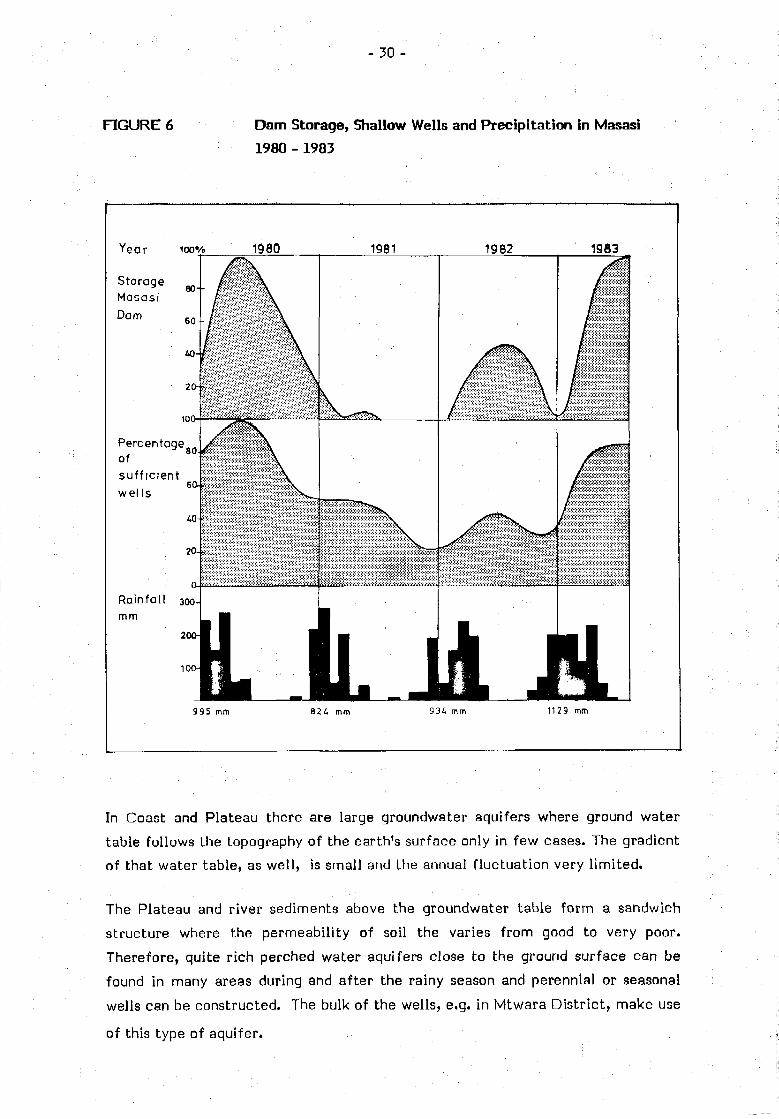
The importance of the rainfall and its pattern in the Basement is demonstrated by
the situation in Masasi during the period 1981-84. The Masasi dam, with a
capacity of 110,000 m^ and a catchment area of about 20 km^, relies entirely on
surface water flow. The 40 handpump wells located partly in the same basin rely
on the shallow groundwater, in most cases perched water, which has limited
storage capacity. Figure 6 demonstrates the changes in the amount of water in
the dam, the number of dry wells and the rainfall. The relationship is clear, and it
can be observed that insufficient rainfall during exceptionally dry years neither
produces surface runoff nor causes any significant ground water infi ltration.
- 3 0 -
FIGURE 6 Dam Storage, Shallow Wells and Precipitation in Masasi
1980 - 1983
Year
Storage
100% 1980 1981 1982 1983
Rainfall 300
mm
9 9 5 mm 8 2 4 mm 934 mm 112 9 mm
In Coast and Plateau there are large groundwater aquifers where ground watertable follows the topography of the eartIVs surface only in few cases. The gradientof that water table, as well, is small and the annual fluctuation very limited.
The Plateau and river sediments above the groundwater table form a sandwichstructure where the permeability of soil the varies from good to very poor.Therefore, quite rich perched water aquifers close to the ground surface can befound in many areas during and after the rainy season and perennial or seasonalwells can be constructed. The bulk of the wells, e.g. in Mtwara District, make use
of this type of aquifer.
- 3 1 -
In many cases the slow downwards infi ltration of perched water continues and will
lead to the sinking of the water table with several metres (up to 4...8 m) and the
drying up of dug wells. A typical example is Ziwani village located at about 10
km SW from Mtwara town at roughly 31 m above the sea level. There is a high
yield borehole there (No. 86/76) with a static water level at 28.6 m below the
ground level and an annual fluctuation only a few centimetres. In the same area
there are 7 dug handpump wells about 5 m deep. During a normal year three of the
wells have been perennial and others have had enough water for about 8 months.
In 1982 all the wells dried up.
To solve the problem of the dry and insufficient wells, altogether 300 wells have
been deepened since 1980. Although no reliable data on the results exist,
experience has not been encouraging and generally only limited improvement has
been achieved.
Chemical water guality data for the different types of wells according to
hydrogeological zones are presented in Appendix 10. Although the records are not
very representative, it can be concluded that salinity seems to be the most
important problem. Otherwise well water is normally of acceptable quality.
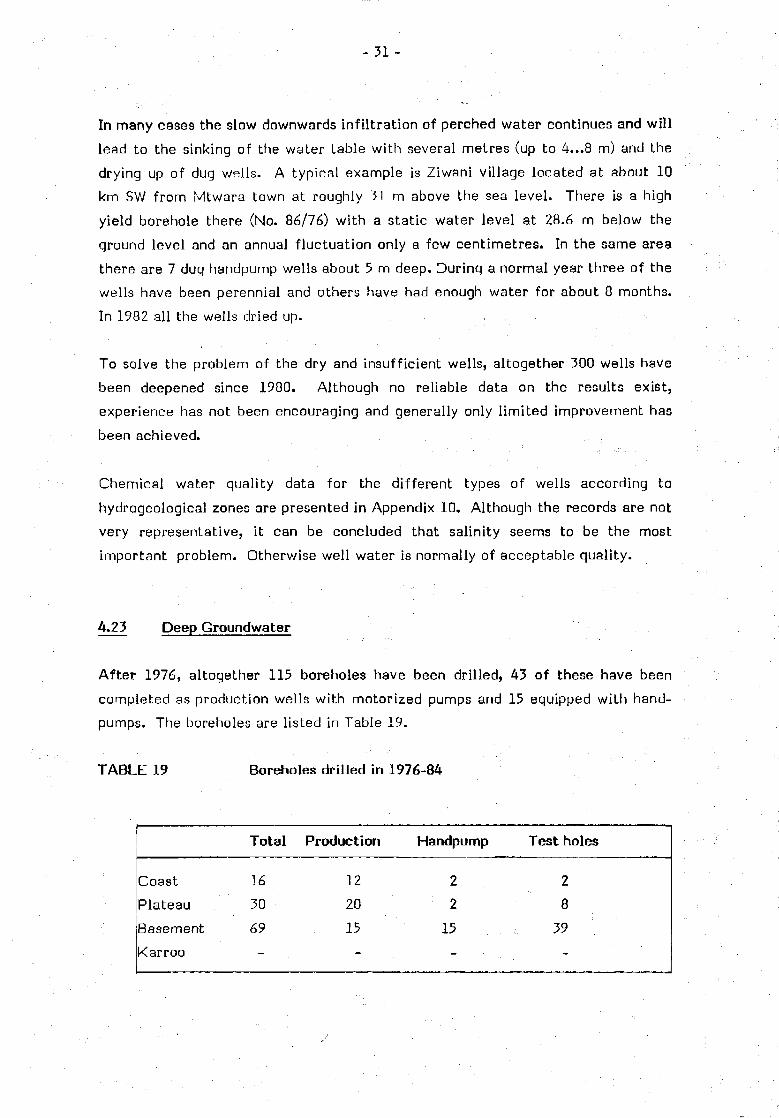
4.23 Deep Ground water
After 1976, altogether 115 boreholes have been drilled, 43 of these have been
completed as production wells with motorized pumps and 15 equipped with hand-
pumps. The boreholes are listed in Table 19.
TABLE 19 Boreholes drilled in 1976-84
Coast
Plateau
Basement
Karroo
Total
16
30
69
-
Production
12
20
15
-
Handpump
2
2
15
-
Test holes
2
8
39
-
- 32 -
65 of the boreholes were drilled by rotary drills, 37 by down-the-hole hammer
drills and 13 by percussion drills. Most of the test holes were drilled during the
present hammer-drill programme in the Basement area.
Locations of the boreholes have been marked in Drawing 5 of Volume 3. The data
on the boreholes are given in Appendix 11.
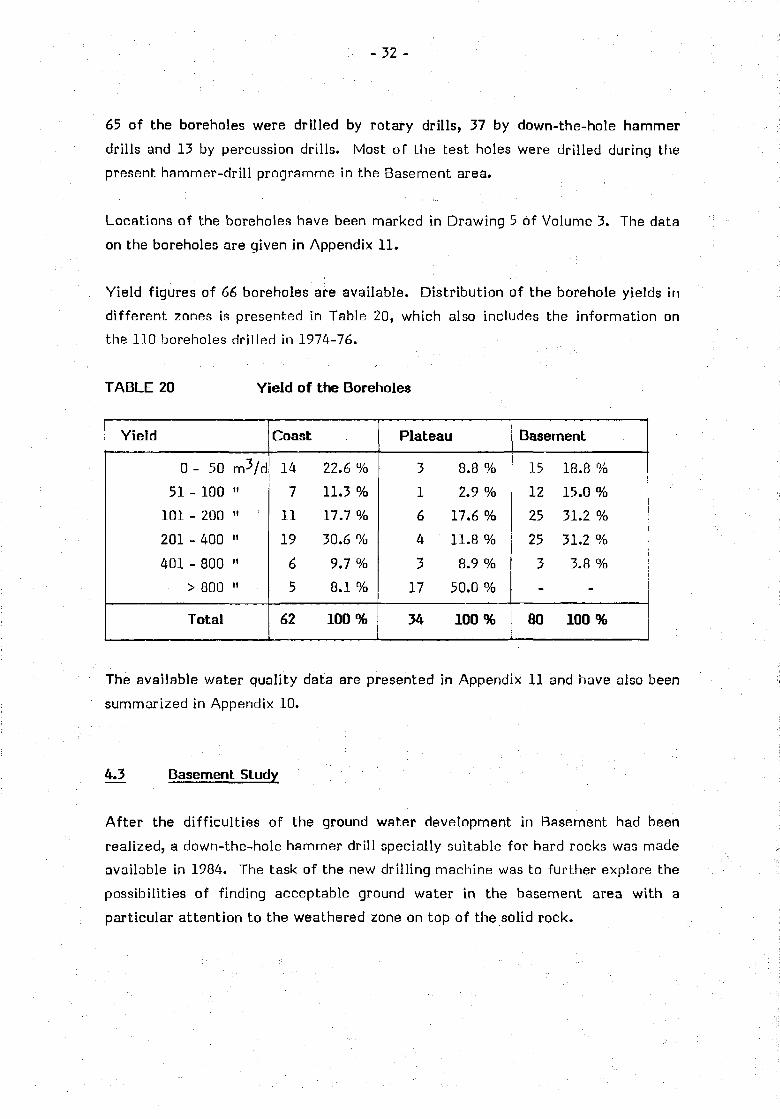
Yield figures of 66 boreholes are available. Distribution of the borehole yields in
different zones is presented in Table 20, which also includes the information on
the 110 boreholes drilled in 1974-76.
TABLE 20 Yield of the Boreholes
Yield
C
51
101
201
401
- 50
- 100
- 200
-400
-800
> 800
Total
m3/dH
H
H
H
Coast
14
7
11
19
6
5
62
22.6 %
11.3 %
17.7 %
30.6 %
9.7 %
8.1 %
100%
Plateau
3
1
6
A
3
17
34
8.8 %
2.9 %
17.6 %
11.8 %
8.9 %
50.0 %
100%
Basement
15
12
25
25
3
-
80
18.8 %
15.0 %
31.2 %
31.2 %
-
100%
The available water quality data are presented in Appendix 11 and have also been
summarized in Appendix 10.
4.3 Basement Study
After the difficulties of the ground water development in Basement had been
realized, a down-the-hole hammer drill specially suitable for hard rocks was made
available in 1984. The task of the new drilling machine was to further explore the
possibilities of finding acceptable ground water in the basement area with a
particular attention to the weathered zone on top of the solid rock.

- 33 -
In connection with the new drilling machine, it was decided to carry out a more
detailed hydrogeological study in the Basement area utilizing the results of the
drilling. In the study, special emphasis was placed on the water supplies for
Nachingwea and Masasi town. The Study was carried out at the end of 1984 and
the report is attached to this report as Appendix 12.
The principal observations of the study can be summarized as follows:
1. The capacity of the Nachingwea water supply can be improved by
increasing abstraction in the well fields of Mkumba Shamba and Mkumba
Pacha. The safe yields of Mkumpa Shamba and Mkumba Pacha are
estimated at 1,500 m^/d and 500 m^/d respectively. Developing and
extending the well fields there may be possibilities of increasing the
' - abstraction even further.
2. The safe yield of Magumchila well field, which is one of the two main
sources of Masasi Water Supply, is confirmed as 1,000 m-Vd, which also
is the earlier design capacity. The possibilities of finding other
considerable groundwater sources in the area are limited.
3. Shallow groundwater potential is generally poor since aquifers near the
surface are nearly always perched water and of limited capacity. Wells
dug in these aquifers are liable to dry up during dry seasons.
4. The deep groundwater potential of the Basement is poor, especially in
Masssi where the baserock is covered by thick impermeable clays. High
yielding aquifers can be found in major faults but they seem to be saline
nearly without exceptions. Sufficient amounts of water for handpumps
appear to be available on higher grounds where the mobility of
groundwater is greater than in valleys and its quality sti l l fresh. Water is
normally found in the weathered zone of the basement rock at a depth of
10-40 m.
5. The down-the-hole hammer dril l seems to be suitable for groundwater
exploration in the Basement area and in developing medium depth
boreholes for hand pumps.
- 3 4 -
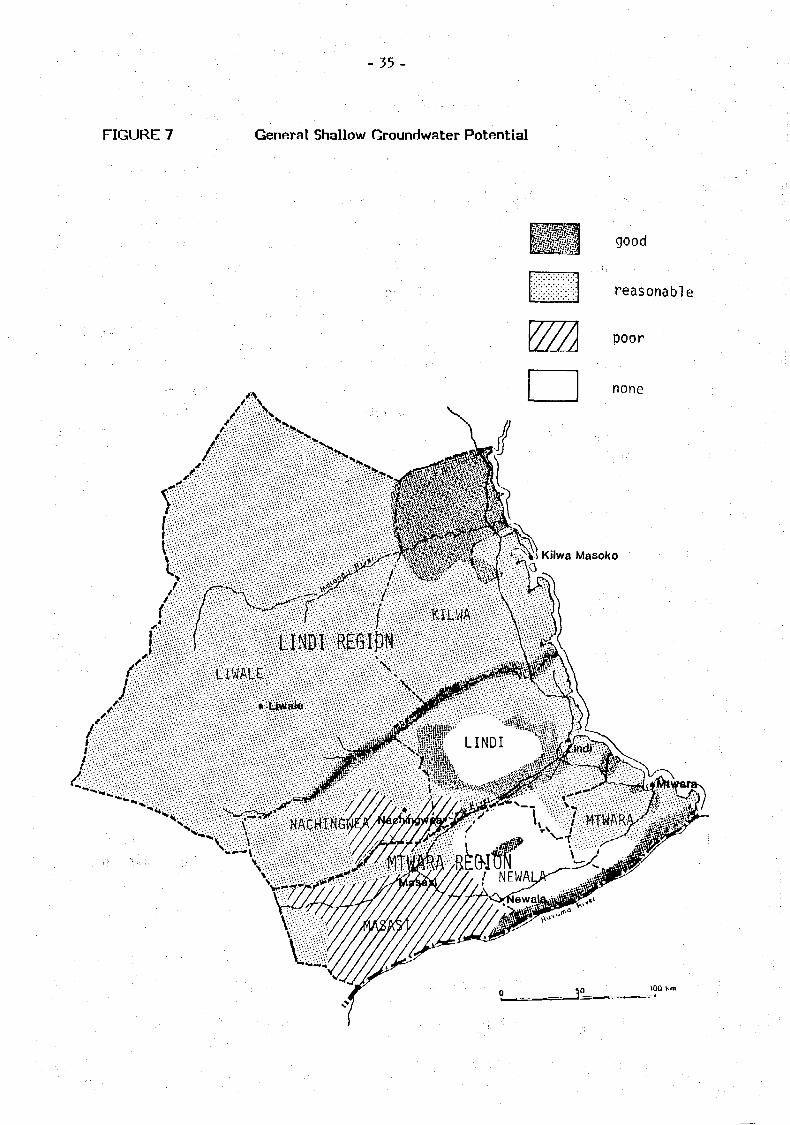
4.4 Groundwater Potential
4.41 General
Potential of groundwater as a source of domestic water supply has been estimated
based both on the investigations carried out during the preparation of WMP-77 and
on the data accumulated after the completion of the study in 1976. Estimating
the potential, quantity and quality and the accessiability have been considered-
Shallow groundwater potential is shown in Figure 7 and, in more detail, in Drawing
6, where four different categories are indicated. Generally, the potential is
reasonably good although large difficult areas exist, such as Makonde and Rondo
Plateaus and most of the Basement. Deep groundwater potential follows quite
well the shallow groundwater potential, although high yielding aquifers are usually
only found in rather limited ares. A more detailed description of the groundwater
potential is given below for the different districts.
4.42 Masasi District
Masasi District belongs to the Basement-zone which is generally a poor ground-
water area.
Shallow groundwater exists nearly entirely as a form of perched water thus being
available normally only in small quantities and liable of drying up during periods
of small groundwater recharge. Deepening of a dry well does not normally
increase the amount of water because it only increases the storage capacity of
the well. In general, shallow groundwater quality is not very good but mostly
acceptable. In river valleys and depressions, where water would otherwise be
available in large quantities, it is often too saline for human consumption.
When utilizing shallow groundwater, soil conditions favour dug wells rather than
tube wells, because sandy layers are rare.
Deep groundwater is usually found at depths of 10-40 metres and it occurs mainly
in the weathered zone of the basement rock or in faults. The amount is usually
sufficient only for hand pumps. Water quality is generally poor, especially salinity
is high, which is the main reason for abandoning of sufficiently yielding boreholes.
It has been observed that better groundwater quality can be found in
topographically higher areas rather than in valleys.
- 3 5 -
FIGURE 7 General Shallow Groundwater Potential
M good
reasonable
poor
none
4.43 Mtwara District
Mtwara District belongs partly to the Coast-zone and partly to the Plateau-zone.
Groundwater infi ltration is good but the groundwater table lies deep because of
the thick formations except in valleys and low laying areas. Relatively large
perched water aquifers are common in the western areas near the coast and can
be used for ring wells or tube wells. In these aquifers, groundwater level
fluctuations are large and great well depths are therefore required. Further
inland in the Plateau, shallow wells are normally not possible.
Deep groundwater has been found in large quantities in several locations such as
Mtawanya, Ziwani, Mikindani and Nanyamba, which all are located on the edge of
the Plateau. Further inland, sandy formations are thick and the groundwater
table lies very deep even in the deep river valley.
Water quality is usually good although excessive salinity and hardness occur in
some wells where sea water influence exists. In western Plateau-zone, deep
groundwater often contains a high amount of carbon dioxide.
4.44 Newala District
Newala District belongs to the Plateau-zone. Groundwater potential is
theoretically good but economically exploitable only in deep river valleys and at
the lower edges of the Plateau due to the deep groundwater level.
Shallow groundwater can be found only in Kitangari valley and in Ruvuma valley.
Springs are found on the lower reaches of the Makonde Plateau. Water quality has
been good in all the few dug wells constructed in the area.
Deep groundwater has been successfully exploited in Kitangari valley where
aquifers are located at reasonnable depths. The groundwater potential of
Kitangari valley is at least 12,000 m^/d but may be even more than double of that
amount. Water quality is good although high carbon dioxide contents cause
aggressiveness.
In other parts of the district, economically feasible deep groundwater does not
exist.
- 3 7 -
4.45 Kilwa District
Kilwa District belongs mainly to the Plateau-zone with a narrow Coastal strip on
the east and the Basement-zone in the west.
The availability of groundwater has generally been good although difficult areas
such as Pande exist. There are also large unpopulated areas where groundwater
availability is unknown.
Shallow groundwater, mostly is perched water, has been found in all geological
zones although the Western Basement-area has not been explored. The best
shallow groundwater aquifers have been found along the river-beds where sandy
sediments are common. In the Coastal strip, there are areas where caral rocks
are dominating and sandy deposits uncommon. The groundwater level is near the
sea level and the groundwater quality affected by the sea water. In other parts of
the district, the shallow groundwater quality is normally good.
Deep groundwater has not been much explored in Kilwa District except for Kilwa
peninsula where considerable quantities of good groundwater have been found. A
potentially good area is also Mbarawala Plateau west of Kilwa Masoko where
more than 25,000-30,000 m^ of groundwater is estimated available. A rich aquifer
has been found near Ruhatwe where the yield has been estimated at about 2,500
m3/d.
The quality of deep groundwater has been good in all boreholes.
4.46 Lindt District
The bulk of the Lindi District belongs to the Plateau-zone with a narrow Coastal-
zone and the western parts of the District being part of the Basement-area.
Groundwater potential varies but is generally good due to the varying geological
conditions.
Shallow groundwater has been taken into use successfully except in Rondo Plateau
where the groundwater table is too deep. Most of the shallow wells seem to tap
the basic groundwater or large perched water aquifers. The majority of the wells
are therefore perennial. Water quality is generally acceptable.
- 38 -
Deep groundwater has been found in Lukuledi valley and on the lower reaches of
Rondo Plateau. Water quality has been good except in the two boreholes drilled in
the Basement-area in Ruangwa where salinity has been excessive. Groundwater
table in Rondo Plateau is too deep for economical boreholes.
4.47 Liwale District
The eastern part of Liwale District belongs to the Basement-zone whereas the
western part belongs to the Karroo. Only few water supplies have been
constructed in the scarcely populated area. Thus experience on groundwater is
limited. Groundwater potential can be estimated to be generally limited in the
Basement-zone and reasonably good in Karroo.
The shallow wells constructed in the eastern Basemënt-zone have been variably
successful with often limited yields. A considerable number of wells dry up during
dry seasons. Salinity has caused problems as well. In Karroo, wells have been
more successful and of good quality. It seems that most of the shallow aquifers
are perched water.
Only few boreholes have been drilled in Liwale and not very successfully. It can
be assumed that their potential is small in the Basement and reasonable in Karroo.
4.48 Nachingwea District
Nachingwea District belongs to the Basement-zone. Therefore the general
groundwater potential is l imited, although better than in Masasi, due to the higher
rainfall and thicker and more sandy soil layers on top of the baserock.
Shallow groundwater has been taken into use successfully, and most of the wells
give sufficient amount of water and are perennial. This is partly a result of more
crit ical and careful site selection, which has been the practice after the dry
period of 1981-82. Typical for the Basement, salinity has been high on several
occations.
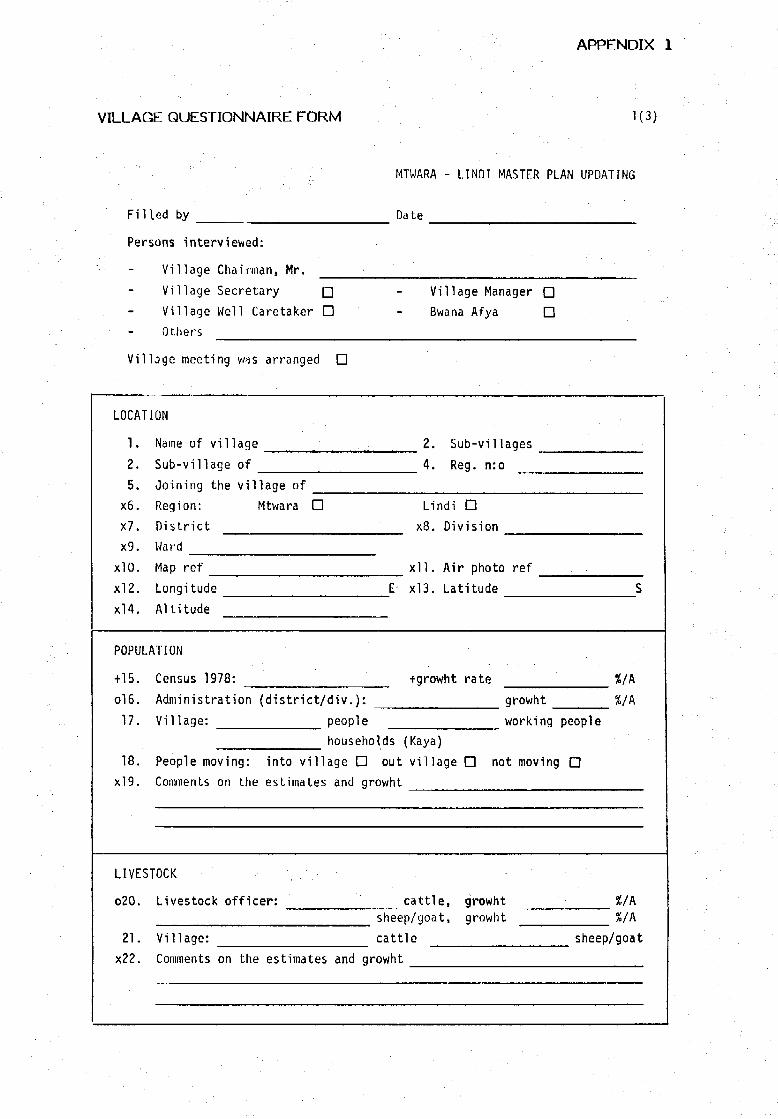
APPENDIX 1
VILLAGE QUESTIONNAIRE FORM 1(3)
Filled by
Persons interviewed:
Village Chairman, Mr.
Village Secretary •
Village Well Caretaker •
Others
Village meeting was arranged •
MTWARA - LINDI MASTER PLAN UPDATING
Date
Village Manager •
Bwana Afya Q
LOCATION
1.
2.
5.x6.
x7.
x9.
xlO.
xl2.
xl4.
Name of village
Sub-village of
Joining the village of
Region; Mtwara •
District
Ward
Map ref
Longitude
Altitude
POPULATION
+15.
ol6.
17.
18.
xl9.
Census 1978:
Administration (district/div.)
Village: peopl
2. Sub-villages
4. Reg. n:o
Lindi D
x8. Division
xll. Air photo ref
E- xl3. Latitude
+growht rate
: growht
e working
households (Kaya)
People moving: into village [
Comments on the estimates and
LIVESTOCK
o20.
21.
x22.
Livestock officer:
Village:
Comments on the estimates and
J out village • not moving
growht
•• • .
cattle, growhtsheep/goat, growht
cattle
growht
S
Vh%/A
people
D
«/A%/A
sheep/goat
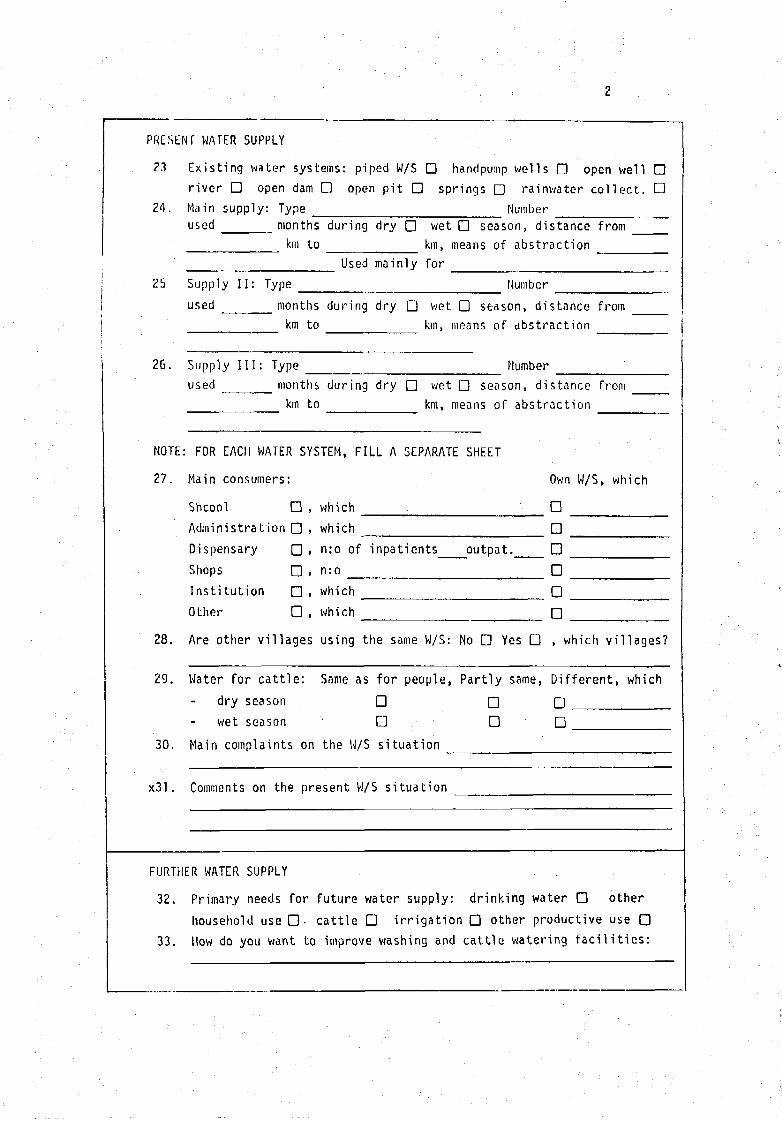
PRESENT WATER SUPPLY
?3 Existing water systems: piped W/S D handpump wells Q open well Driver D open dam D open pit Q springs D rainwater collect. •
24. Main supply: Type Numberused months during dry D wet D season, distance from
km to km, means of abstractionUsed mainly for
Number25 Supply II: Typeused months during dry Q wet Q season, distance from
km to km, means of abstraction
Number26. Supply III: Typeusec' ______ months during dry D wet Q season, distance from
km to km, means of abstraction
NOTE: FOR EACH WATER SYSTEM, FILL A SEPARATE SHEET
27. Main consumers:
Shcool D , which
Administration Q , which
Dispensary • , n:o of inpatients outpat.
Shops D , n:oInstitution _ , which
Other D , which
Own W/S, which
DDD•D•
28. Are other villages using the same W/S: No D Yes D , which villages?
29. Water for cattle: Same as for people, Partly same, Different, which
dry season • _ __
wet season D D D
30. Main complaints on the W/S situation
x31. Comments on the present W/S situation
FURTHER WATER SUPPLY
32. Primary needs for future water supply: drinking water D other
household use • • cattle • irrigation • other productive use D33. How do you want to improve washing and cattle watering facilities:
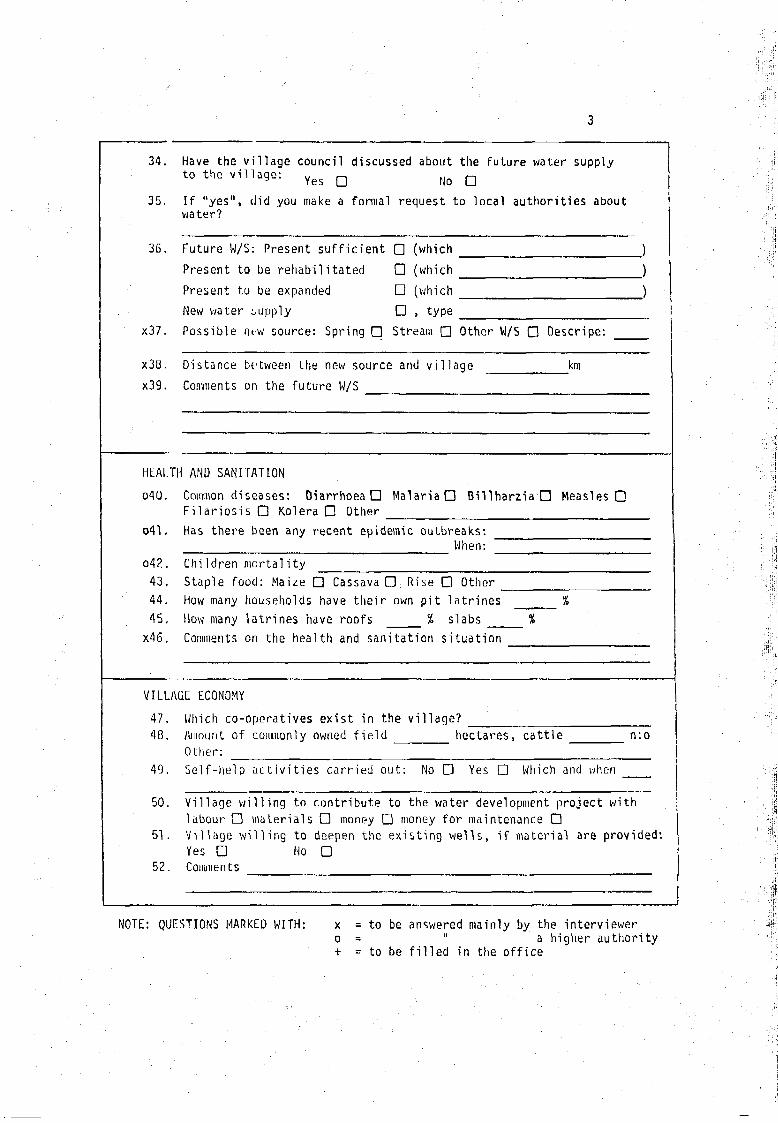
34. Have the village council discussed about the future water supplyh ill
35.
gto the village:
If "yes"water?
did you make a formal request to local authorities about
36. Future W/S: Present sufficient Q (which
Present to be rehabilitated D (which
Present to be expanded D (which
New water supply D , type
x37. Possible m-w source: Spring • Stream Q Other W/S Q Descripe;
x38.
x39.
Distance
Comments
be
on
tween
the
the new source
future W/S
and vil lage km
HEALTH AND SANITATION
o40
o41.
042.43.44.45.
x46.
Common diseases: Diarrhoea D Malaria • BillharziaO Measles DFilariosis D Kolera D Other
Has there been any recent epidemic outbreaks:When: ~
Children mortalityStaple food: Maize D Cassava D : Rise D OtherHow many households have their own pit latrinesHow many latrines have roofs % slabsComments on the health and sanitation situation
VILLAGE ECONOMY
47.4B.
49.
50.
51.
52.
Which co-operatives exist in the village?Amount ofOther:Self-help
commonly owned field
activities carried out: No
hectares,
D Yes D
cattle
Which and when
n:o
Village willing to contribute to the water development project withlabour • materials • money D money for maintenance DVillage willing to deepen the existing wells, if material are provided:Yes D No DComments
NOTE: QUESTIONS MARKED WITH: x = to be answered mainly by the interviewero = " a higher authority+ = to be filled in the office

APPENDIX 2
VILLAGE DATA FORM
Name of the Village:
Sub-villages:
Sub-village of:
Ward, Name: Code:
Division, Name: [ •
Population, village 1984:
Population, census 1978:
Estimated 1984 population:
Growth rate, % p.a.
Cattle 1984: :
Growth rate cattle, % p.a.
Sheep 1984:
Goats 1984:
Pigs 1984:
Small livestock growth rate, % p.a.
Livestock U3ing W/S in 1984, %i
Livestock using W/S in 2001, %:
Existing W/S:
Distance to main supply, km:
Distance to secondary supply, km:
Improved W/S constructed:
Piped W/S in operation during visit:
Number of hand pump wells:
Main complaints on W/S situation:
. Proposed future W/S:
Source of future W/S:
Households having latrines, %:
Standars of latrines:
Village ready to contribute towards W/S construction:
Village ready to contribute towards W/S maintenance:
N. of sufficient hand pump wells:
N. of insufficient hand pump wells:
N. of hand pump wells, which dry up:
N. of hand pump wells with salty water:
N. of hand pump wells with dirty water:
Piped W/S service level:
Handpump W/S service level:

APPENDIX 3
BASIC VILLAGE DATA
Masasi District
Mtwara District
Newala District
Mtwara-Mikindani Town
Kilwa District
Lindi District
Liwale District
Nachingwea District
Lindi Town
Key for the abréviations and symbols
Column 3: Livestock in livestock units
1 unit = 1 cow
= 5 sheep or goats or pigs
Column 4:1 —
1 -
3
4
5
6
7
8
piped water supply
hand pump
open well
river
dam
open pit
spring
rainwater harvesting
Columns 5 and 6: Distances in kilometres
Column 7:
0 - piped W/S not in operation
1 = piped W/S in operation
2 = piped W/S under construction
Columns 13 and 14:
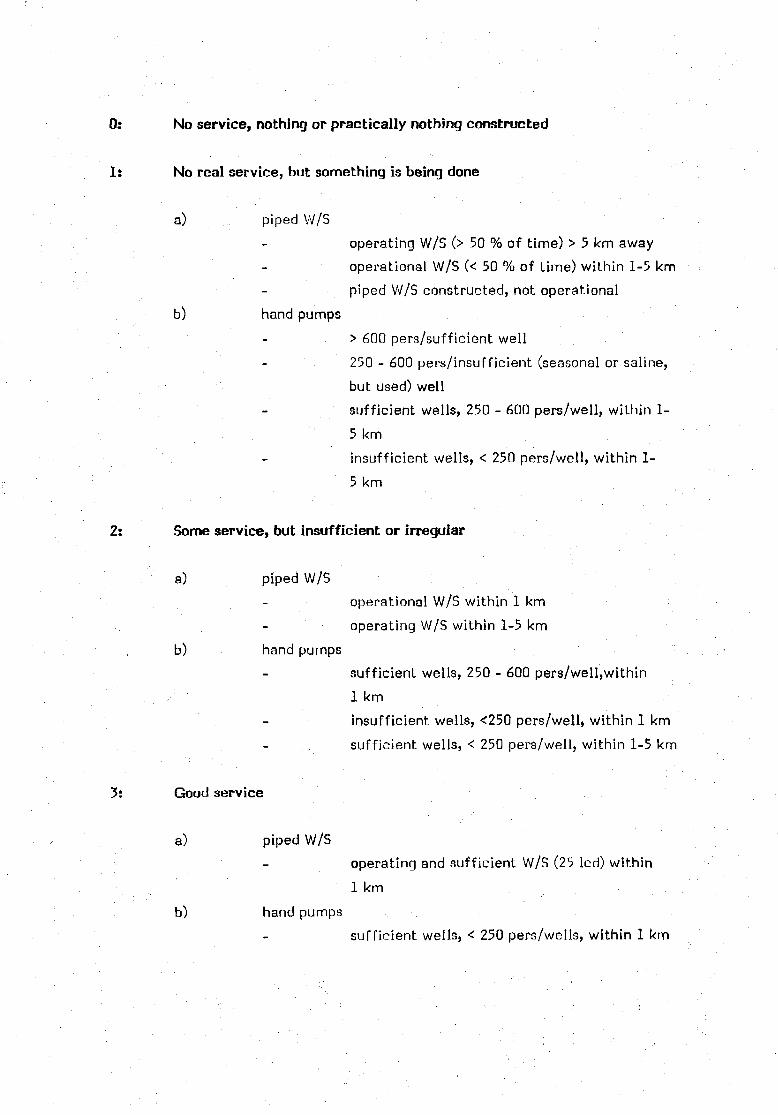
OÏ No service, nothing or practically nothing constructed
1: No real service, but something is being done
a) piped W/S
operating W/S (> 50 % of time) > 5 km away-
operational W/S (< 50 % of time) within 1-5 km
piped W/S constructed, not operational
b) hand pumps
> 600 pers/sufficient well
- 250 - 600 pers/insufficient (seasonal or saline,
but used) well
sufficient wells, 250 - 600 pers/well, within 1-
5 km
• - insufficient wells, < 250 pers/well, within 1-
5 km
2: Some service, but insufficient or irregular
a) piped W/S
operational W/S within 1 km
operating W/S within 1-5 km
b) hand pumps
sufficient wells, 250 - 600 pers/well,within
1 km
insufficient wells, <250 pers/well, within 1 km
sufficient wells, < 250 pers/well, within 1-5 km
3: Good service
a) piped W/S
• - operating and sufficient W/S (25 led) within
1 km
b) hand pumps
sufficient wells, < 250 pers/wells, within 1 km
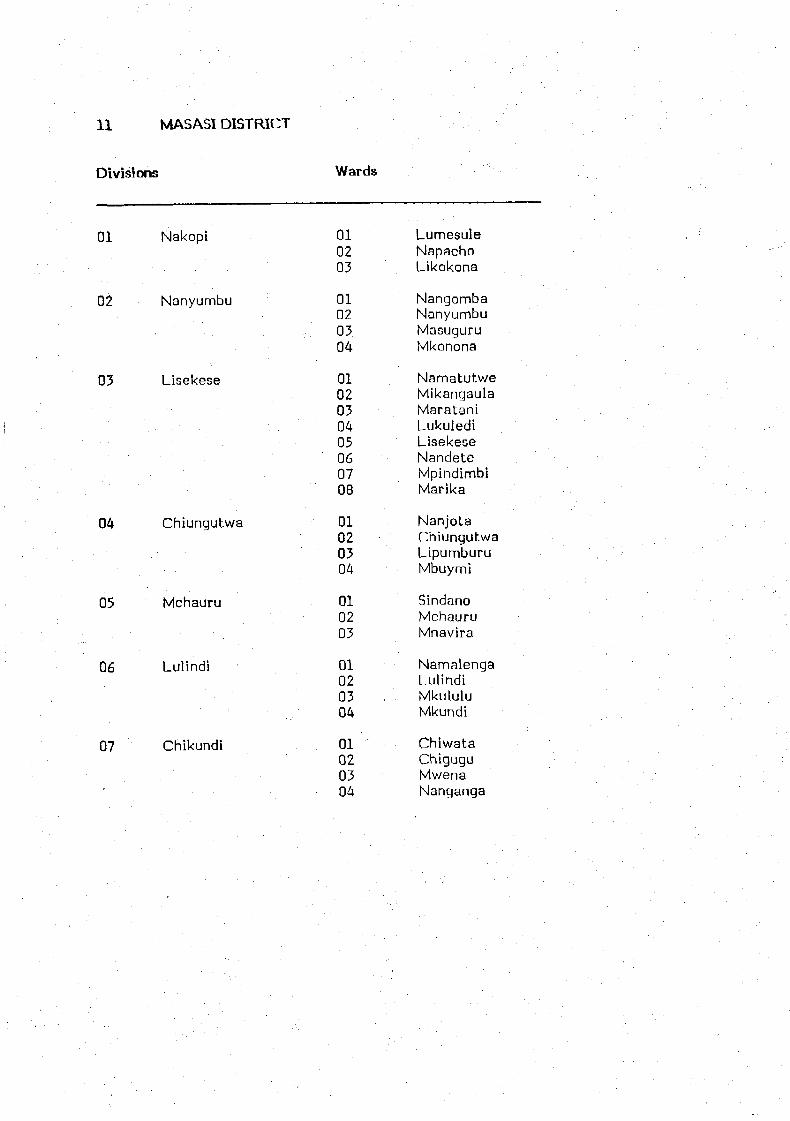
11 MASASI DISTRICT
Divisions
01 Nakopi
02 Nanyumbu
03 Lisekese
04 Chiungutwa
05 Mchauru
06 Lulindi
07 Chikundi
Wards
010203
01020304
0102030405060708
01020304
010203
01020304
01020304
LumesuleNapachoLikokona
NangombaNanyumbuMasuguruMkonona
NarnatutweMikangaulaMarataniLukulediLisekeseNandeteMpindimbiMarika
NanjotaChiungutwaLipumburuMbuymi
SindanoMchauruMnavira
NamalengaLulindiMkululuMkundi
ChiwataChiguguMwenaNanganga
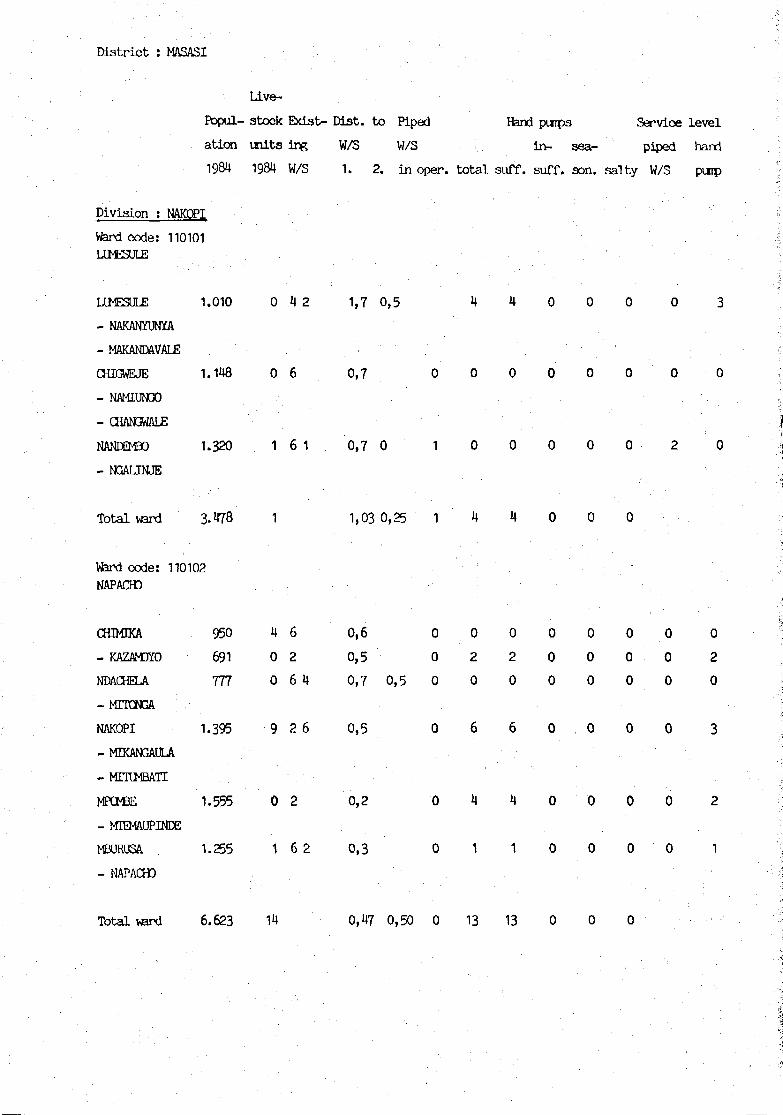
Dis t r ic t : MASASI
Live-
Popul- stock Exist- Dist . to Piped Hand purps Service level
at ion m i t s ing W/S W/3 in - 3ea- piped harri
1984 1984 W/S 1. 2. in oper. t o t a l suff. suff. son. s a l ty W/3 pmp
Division : NAKOPI
Ward code: 110101IXMESULE
UMESULE 1.010 0 4 2 1,7 0,5 4 4 0 0 0 0 3
- NAKANYUNYA
- MAKANDAVALE
CHIGWEJE 1 . 1 4 8 0 6 0,7 0 0 0 0 0 0 0 0
- NAMIUNGO
- CHANGWALE
NANEEMBO 1.320 1 6 1 0 , 7 0 1 0 0 0 0 0 2 0
- NGALJNJE
Total ward 3.478 1 1,03 0,25 1 4 4 0 0 0
Ward code: 110102NAPACHD
aïïMDCA 950 4 6 0 , 6 0 0 0 0 0 0 0 0
- KAZAM3Y0 691 0 2 0,5 0 2 2 0 0 0 0 2
NDACHELA 777 0 6 4 0,7 0,5 0 0 0 0 0 0 0 0
- MTTCNGA
NAKOPI 1.395 9 2 6 0,5 0 6 6 0 0 0 0 3
-MKANGAULA
- MTITMBAH
MPC^BE 1.555 0 2 0,2 0 4 4 0 0 0 0 2
- MIÏMAUPINDE
M B U R U S A 1 . 2 5 5 1 6 2 0 , 3 0 1 1 0 0 0 0 1
- NAPACHO • ' , . • • •
Total verd 6.623 14 0,47 0,50 0 13 13 0 0 0
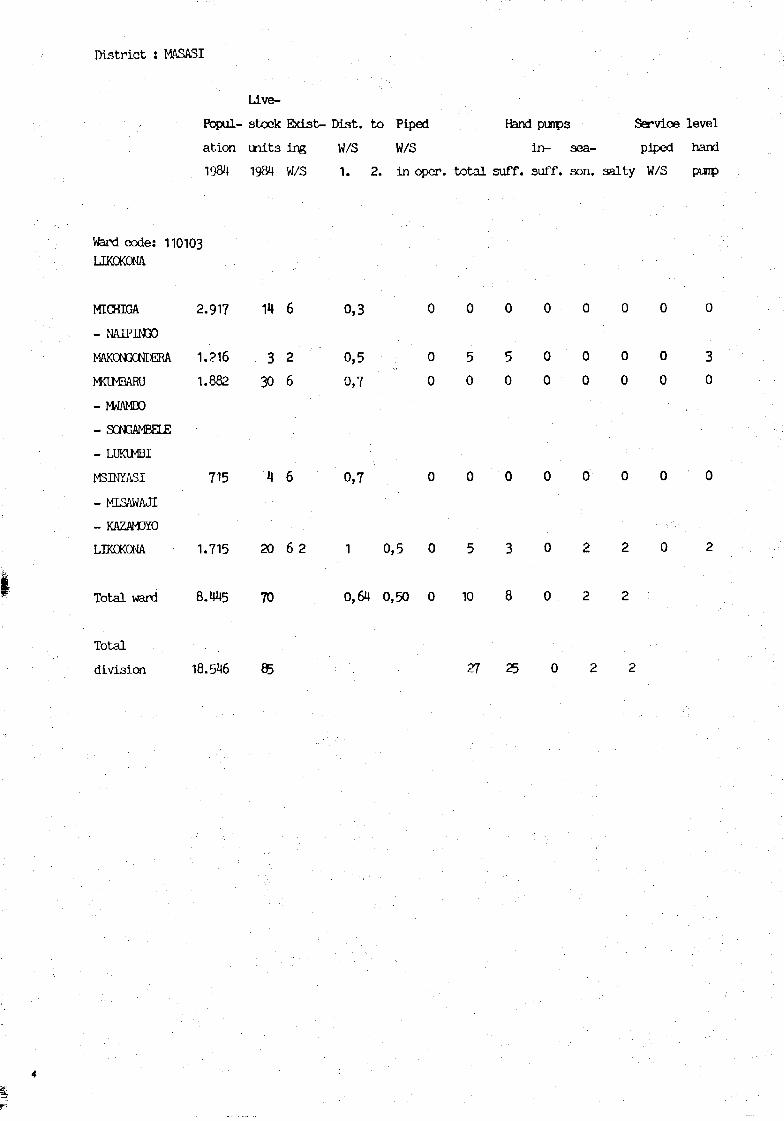
District : MASASI
Live-
Fbpul- stock Exist- Dist. to Piped Hand punps Service level
ation units ing W/S W/5 in- sea- piped hand
1984 1984 W/5 1. 2. in oper. total suff. suff. son. 3alty W/S pimp
Ward code: 110103LIKOKONA
MICHIGA 2.917 11 6 0,3 0 0 0 0
- NAIPINGO
MAKQNGCNDERA 1 . 2 1 6 3 2 0,5 0 5 5 0
MOMBAHJ 1.882 30 6 0,7 0 0 0 0
- NWAMBO .
- 30NGAMBELE
- LUKIMBI
^EINYASI 715 1 6 0,7 0 0 0 0
- MISAWAJI
- KAZAM3YO
LIKDKONA 1.715 20 6 2 1 0,5 0 5 3 0
Total ward 8.445 70 0,64 0,50 0 10 8 0
Total • ... .
division 18.546 85 27 25 C
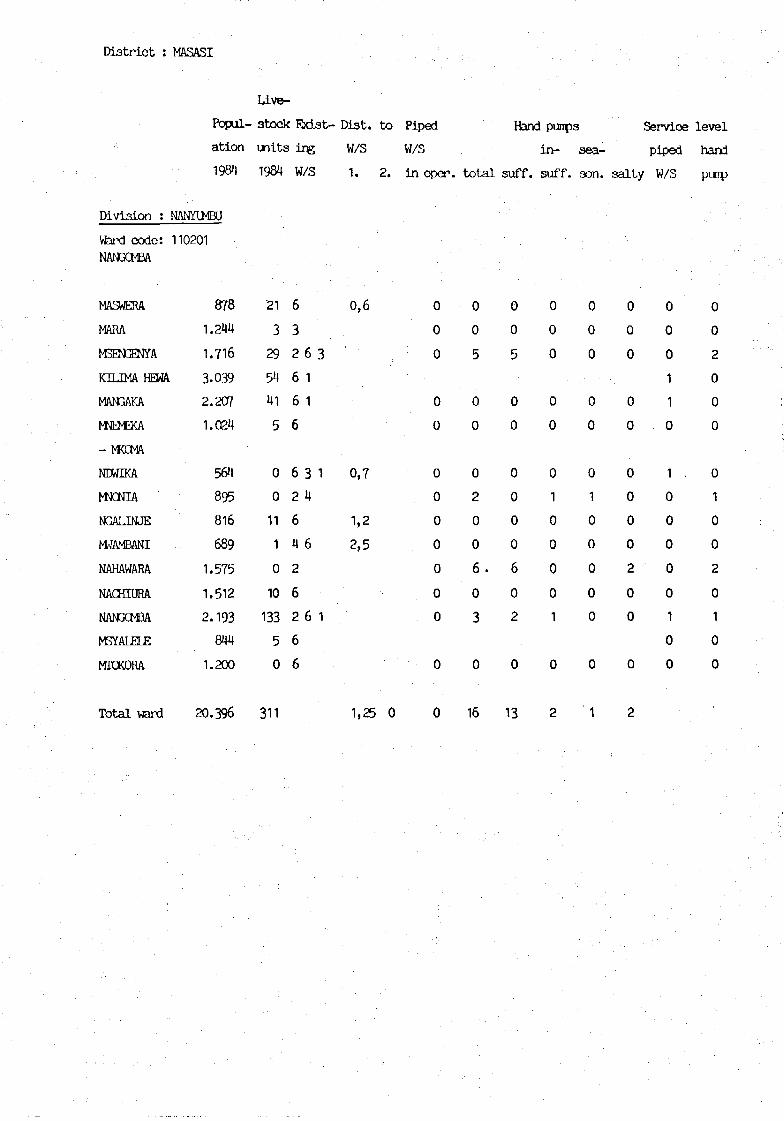
District : MASASI
LAve-
Popul- stock Ebdst- Dist. to Piped Hand punps Sendee level
ation wits ing W/S W/S in- sea- piped hard
1984 W/S 1. 2. in oper. total suff. suff. son. salty W/S puip
Division : NANYIMBU
Ward c o d e :NANGCMBA
MASWERA
MARA
NEEHENYA
KUJMA HEWA
MANC&KA
WJEM3CA
- MKCMA
NDWIKA
bWCNIA '
NGALINJE
HJAMBANI
NAHAWARA
NACHÏURA
NANXMBA
M3YALELE
MTOKORA
Total ward
110201
878
1.244
1.716
3-039
2.207
1.024
564
895
816
689
1.575
1.512
2.193
844
1.200
20.396
21
3
29
54
41
5
0
0
11
1
0
10
133
5
0
311
6
3
2 6 3
6 1
6 1
6
63 1
2 4
6
46
2
6
26 1
6
6
0,6
0,7
1,2
2,5
1,25 0
0
0
0
0
0
0
0
0
0
0
0
0
0
0
0
0
5
0
0
0
2
0
0
6 .
0
3
0
16
0
0
5
0
0
0
0
0
0
6
0
2
0
13
0
0
0
0
0
0
1
0
0
0
0
1
0
2
0
0
0
0
0
0
1
0
0
0
0
0
0
1
0
0
0
0
0
0
0
0
0
2
0
0
0
2
0
0
0
1
1
0
1
0
0
0
0
0
1
0
0
0
0
2
0
0
0
0
1
0
0
2
0
1
0
0
Dist r ic t : MASASI
U v e -
Popul- stock Brijst- Dist. to Piped Hard puips Service level
ation units ing W/S W/5 in- sea- piped hard
1984 1984 W/5 1. 2. in oper. total suff. suff. son. salty W/S pwp
Ward code:
NANYIWEU
NANYWBU
CHUNGU
MAKANÏA
NAMA3CNGO
MANEME
CHIPOPUTA
SHULENI
CHITCWE
- NAKARARA
NAMAGURUVI
MFWAHA
- TAWINI
MKUULA
NANDERU
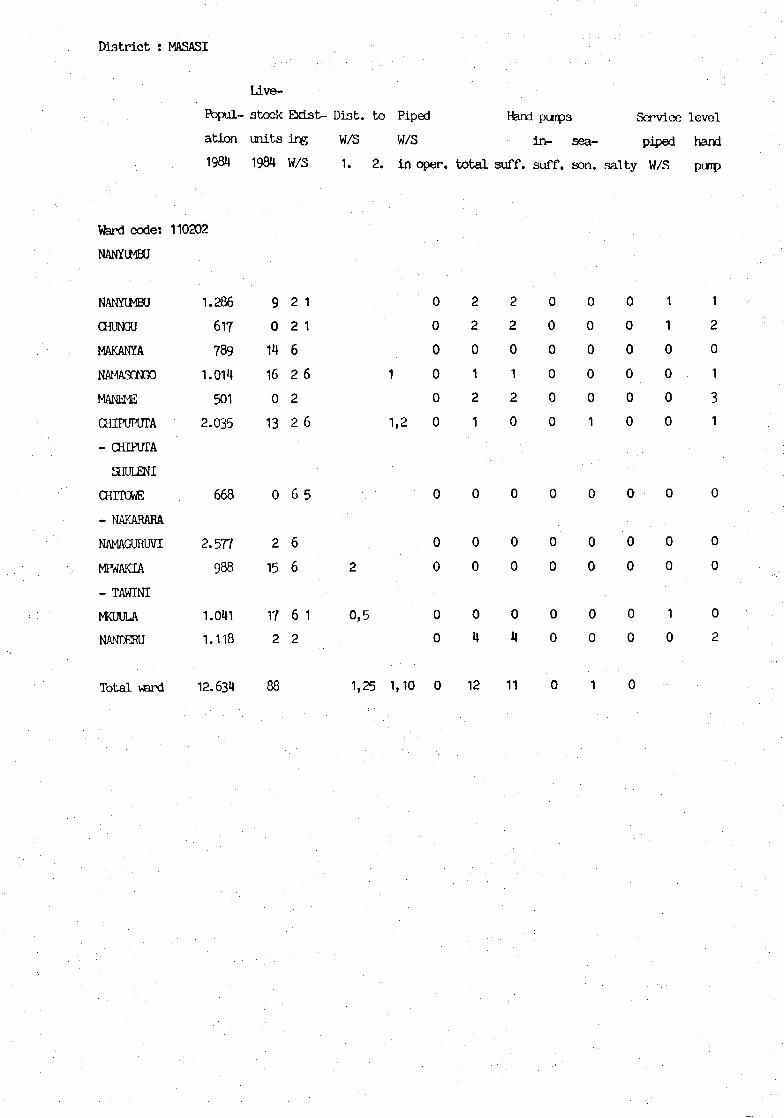
110202
1.286
617
789
1.014
501
2.035
668
2.577
988
1.041
1.118
9
0
14
16
0
13
0
2
15
17
2
2
2
6
2
2
2
6
6
6
6
2
1
1
6
6
5
1
2
0,5
1,2
0
0
0
0
0
0
2
2
0
1
2
1
2
2
0
1
2
0
0
0
0
0
0
0
0
0
0
0
0
1
0
0
0
0
0
0
1
1
0
0
0
0
1
2
0
1
3
1
0 0 0 0 0 0 0 0
0 0 0 0 0 0 0 0
0
Total ward 12.634 88 1,25 1,10 0 12 11 0 1 0
District : MASASI
Live-
Popul- stock Exist- Dist. to Piped Hand pumps Service level
ation units ing W/S W/S in- sea- piped hand
1984 1984 W/S 1. 2. in oper. total suff. suff. son. salty W/S puip
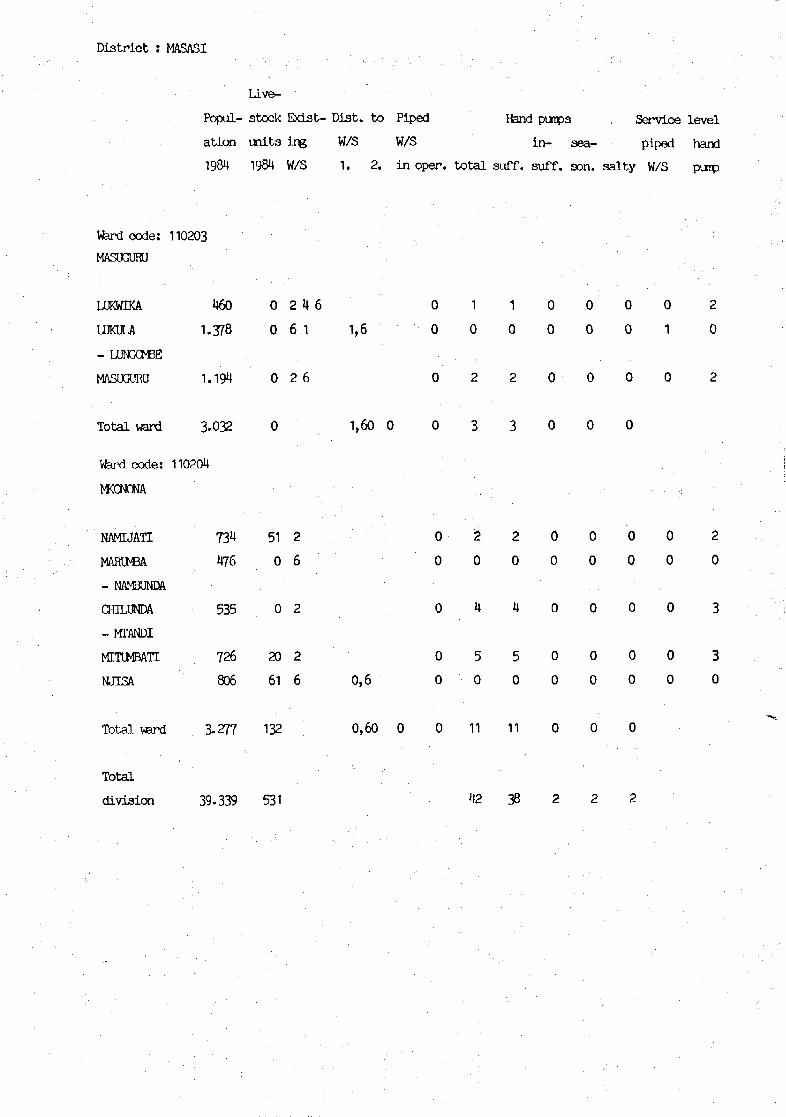
Ward code: 110203
MASUGURU
LUKWKA 460 0 2 4 6 0 1 1 0 0 0 0 2
LUKULA 1.378 0 6 1 1,6 0 0 0 0 0 0 1 0
- LUNGOBE
MASUGURU 1.194 0 2 6 0 2 2 0 0 0 0 2
Total wanl 3-032 0 1,60 0 0 3 3 0 0 0
Ward code: 110204
HK0N0NA
NAMIJATI
MARIMBA
- NAMBUNDA
CfflLUNDA
- MTANDI
MITUMBATI
NJISA
734
476
535
726
806
51
0
0
20
61
2
6
2
2
6
2 0 0 0 0 2
0 0 0 0 0 0
0 5 5 0 0 0 0 3
0,6 0 0 0 0 0 0 0 0
Total ward 3-277 132 0,60 0 0 11 11 0 0 0
Total
division 39.339 531 42 38 2 2 2

District : MASASI
Division : NANYtMBU
Ward code: 110204
Live-
Popul- stock Exist- Dist. to Piped Hand punps Service level
ation units ing W/5 W/S in- sea- piped hand
1984 1984 W/5 1. 2. in oper. total suff. suff. son. salty W/S punp
WCNONA.
NAMTJATI
MARIMBA
- NAMBUNDA
CHILUNDA
-MTANDI
MTTLMBATI
NJISA
Total ward
Total
division
734
476
535
726
806
3.277
39.339
51
0
0
20
61
132
531
2
6
2
2
6 0,6
0 2 2 0 0 0 0 2
0 0 0 0 0 0 0 0
0 4 4 • 0 0 0 0 3
0 5 5 0 0 0 0 3
0 0 0 0 0 0 0 0
0,60 0 0 11 11 0 0 0
42 33
District : MASASI
Ltve-
Popul- stock Exist- Dist. to Piped Hand punps Service level
ation units ing W/S W/S in- sea- piped hand
1984 1984 W/S 1. 2. in oper. total suff. suff. son. salty W/S puip
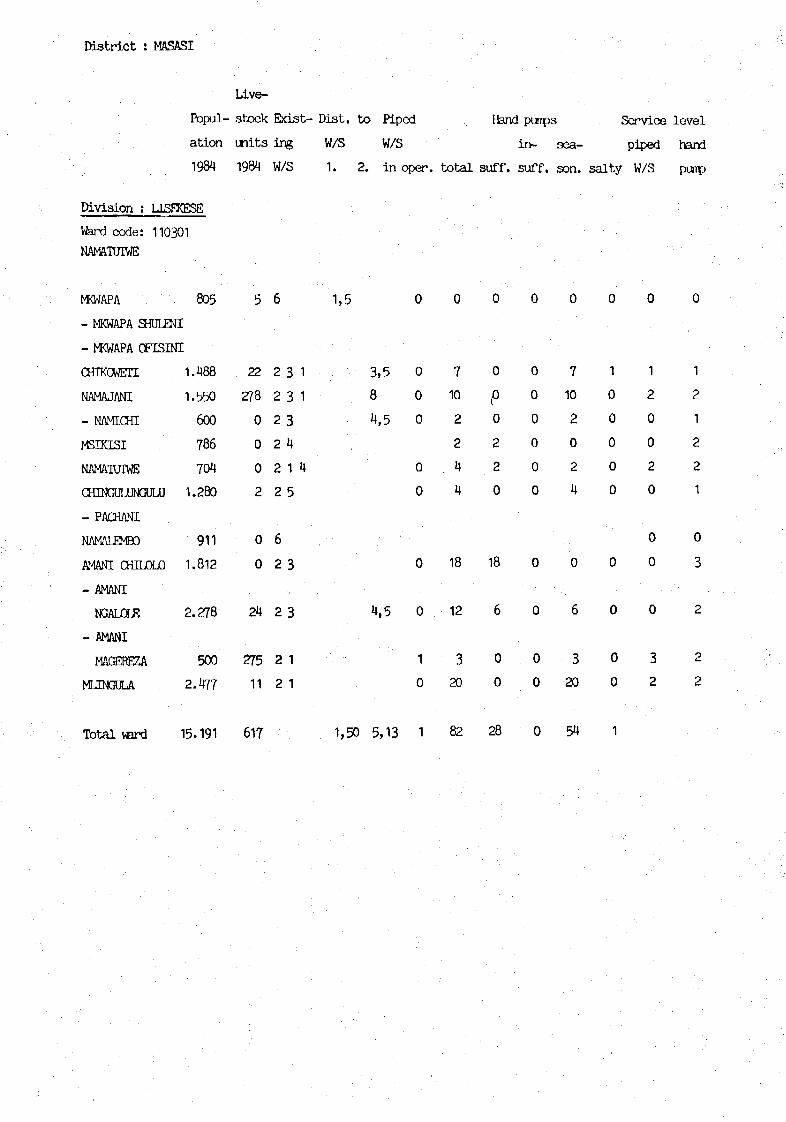
Division : LLSEXESE
Ward code: 110301
NAMATLTIWE
MKWAPA
- MKWAPA SHULENI
- MKWAPA C e i S M C
CfflKOWETI
NAMAJANI
- NAMICHI
MSÏÏŒSI
NAMATUTWE
CHINGULUNGULU
- PACHANI
NAMALEMBO
AMANI CMLOJÛ
- AMANI
NGALOLE
- AMANI
MAGEREZA
MUNGULA
Total ward 1
805
1.488
1.550
600
786
704
1.280
911
1.812
2.278
500
2.477
15.191
5
22
278
0
0
0
2
0
0
24
275
11
617
6
2
2
2
2
2
2
6
2
2
2
2
3 1
3 1
34
1 4
5
3
3
1
1
1,5
3,5
8
4,5
4,5
1,50 5,13
0
0
0
0
0
0
0
0
1
0
1
0
7
10
2
2
4
4
18
12
320
82
0
0
P0
2
2
0
18
6
0
0
28
0
0
0
0
0
0
0
0
0
0
0
0
0
7
10
2
0
2
4
0
6
320
54
0
1
0
0
0
0
0
0
0
0
0
1
0
1
2
0
0
2
0
0
0
0
3
2
0
1
2
1
2
2
1
0
3
2
2
2

District : MASASI
Lâve-
Popul- stock Exist- Dist. to Piped Hand punps Service level
ation units ing W/3 W/S in- sea- piped hand
1984 1984 W/3 1. 2. in oper. total suff. stiff, son. salty W/S puip
Ward code: 110300MTKANGAULA
NANGARAMO 510 989 6 2 1,2 0,5 0 2 2 0 0 0 0 3
MDCANGAULA 3-989 35 6 2 1 0,3 0 4 2 0 2 0 1 1
NAHIMBA 1.161 31 6 1,8 0 0 0 0 0 0 0 0
- MSANGUSANGU
- NGALINJE :
KILQSA 1.587 4 16 1,2 1 0 0 0 0 0 1 0
- M B A R A .• ;•
-MBARUKU
MWAJUNI 1.090 17 6 0 0 0 0 0 0 0 0
- NAWAJI : ,
- KUJMAHEWA
- CHriWANGULE
KAMJNDI 634 1 4 6 1,7 1,7 0 0 0 0 0 0 0 0
- MKDROWANA
- CHTTANDI
- KTTANGAU [
NAMATWBUSI 1.918 357 6 1 2,7 0 0 0 0 0 0 2 0
- NAPAKO
Total vard 10.889 1.433 1,54 1,13 1 6 4 0 2 0

D i s t r i c t : MASASI
LAve-
Popul- stock Exist- Dist. to Piped Hand pimps Service level
ation units ing W/5 W/S in- sea- piped hand
1984 1984 W/S 1. 2. in oper. total suff. suff. son. salty W/S pmp
Ward code: 110303
MARATANI
MAMTANI 2.099 111 6 7 0,2 4,5 0 0 0 0 0 0 0 0
- MALEMA
- MCHANGANI A , B
- MAJENGO
- M R A U S H I
MTKUVA 1.400 45 6 0 0
LIPUPU 577 1 6 0,2 0 0 0 0 0 0 0 0
- NAMH0L0
H0D3LA 1.165 39 6 M 4,5 1,7 0 0 0 0 0 0 0 0
- WAMBA
- MTTIMIN3I
MJANJE 1.781 H5 6 1,5 0 0 0 0 0 0 0 0
- CHIKONJA
SHULENI :..
-NKANJE CHINI
NCÏUPE 1.674 15 5 6 0,7 0,7 0 0 0 0 0 0 0 0
- M A P M X J Z I • • , .
Total ward 8.696 256 1,42 2,30 0 0 0 0 0 0

District : MASASI
Live-
Popul- stock Exist- Dist. to Piped Hand punpa Service level
ation unit3 ing W/S W/3 in- sea- piped hand
1984 1984 W/S 1. 2. in oper. total suff. suff. son. salty W/5 pump
Ward code: 110304UJKULEDI
NAMBAWALA 1 . 0 9 4 1 1 2 6 6 6 0 8 8 0 0 1 0 3
- MACHITE
MRAUSHI 1.945 1 2 3 6 2 2 0 2 1 0 1 0 0 1
- WAN0AWAK0
- MAS0NGA
- M C H O L I
NANYINDWA 1.188 7 1 6 2 0,7 0,7 0 3 1 0 2 0 1 1
ULALA. 1.172 11 2 3 0 3 3 0 0 0 0 2
CHIWALE 1.284 0 2 3 1 0 5 0 0 5 0 2 2
LUKULEDI 3.780 92 2 6 5 0,7 0,7 0 11 8 3 0 0 0 2
MCOROPOLA. 1.153 17 6 1,5 0 0 0 0 0 0 0 0
NASINDE 1.035 78 2 6 0,7 0 2 2 0 0 0 0 2
- NASINDE ' . . . :
NANGCMBA.
NAPATA 1.544 44 2 6 0,2 0,2 0 3 3 0 0 0 0 2
- MAGIMHUE
- MKALINGA
- NAGAGA
CHIKUNJA 1.898 46 2 6 0,7 0,4 0 6 5 0 1 1 0 2
- NANDrrr
Total ward 16.093 308 1,69 1,53 0 43 31 3 9 2

District : MASASI
Live-Popul- stock Exist- Dist. to Piped Hand punps Service levelation uiits ing W/S W/S in- sea- piped hand1984 1984 W/S 1. 2. in oper. total suff. suff. son. salty W/S purp
Ward code: 110305
MBONDBTEMEKE- NAMKARAWETUKAEWOIE- NGAilNJE- CHIWISIMKARANGOMTAKUJA- MAROKOPALENINANGOSEMAKULANIMKARAKATESUUJLU- CHIUNGUTWAMKAPUNDA- NAMXMBILIMPEKE30- M P E K E 3 0 JUU- MPEKESO O H M
2.0301.293
1.630
1.9491.489
1.0002.5421.5042.091
2.084
1.713
- N O T E MACHENJEMATAWALEMrfENGE MTAPIKANAMKUNCMt- MTOWASIRIMTANDI- KACHUUU-MCHOKONYOMASASI TOWN-MKCMAINDO
BLOCK- MAKW1 BLOCK
Total ward
1.3241.5621.088
2.035
19.700
45.034
11951
48
6018
38763333
37
46
15544
88
355
1.074
26
6
62
2216
2
6
621
1
1
6
7 4
6
61
1
6
66
2
2
0,5
1
0,5
0
0,7
0,7
1,2
0,71,2
0
0,65
0,2
4
1,2
1,2
1,29
0,5
2,47
00
0
0
0010
0
0
001
1
1
4
80
0
8
3200
11
0
060
5
50
93
50
0
5
1200
10
0
050
3
20
51
00
0
0
1000
0
0
000
0
20
21
30
0
3
1000
1
0
010
2
10
21
00
0
0
0000
0
0
000
0
0
00
0
00
0222
0
0
002
3
2
20
0
03
1100
3
0
020
1
2

D i s t r i c t : MASASI
Live-
Popul- stock Exis t - Dis t . t o Piped Hand punps Service l eve l
a t ion un i t s ing W/S W/S i n - sea- piped hand
1984 1984 W/S 1. 2 . i n oper. t o t a l suff. suff. son. s a l t y W/S pmp
Ward code: 110306NANDËTE
NANDETE 1.750 30 6 1 1,5 0 0 0 0 0 0
- KALOLENI
- NAKOPWITI
CHAKAMA. 1.656 44 2 6 1,5 0 8 7 0 1 0
NAVAI 1.219 23 6 7 0,7 0,2 0 0 0 0 0 0
- MKANGARA
MTAUXACHAU 990 3 6 1,2 0 0 0 0 0 0
- MTENDACHI
ULANGA 1 .468 4 4 6 1,5 0 0 0 0 0 0
- SEMENI
CHIVIRIKITI 1 .045 2 67 0,7 0 0 0 0 0 0
- MiALENDO
NAKOLE 1.020 0 0
- NKARAKATE
- CHTTUKANI
Total vard 9.150 147 1,18 0,20 0 8 7 0 1 0
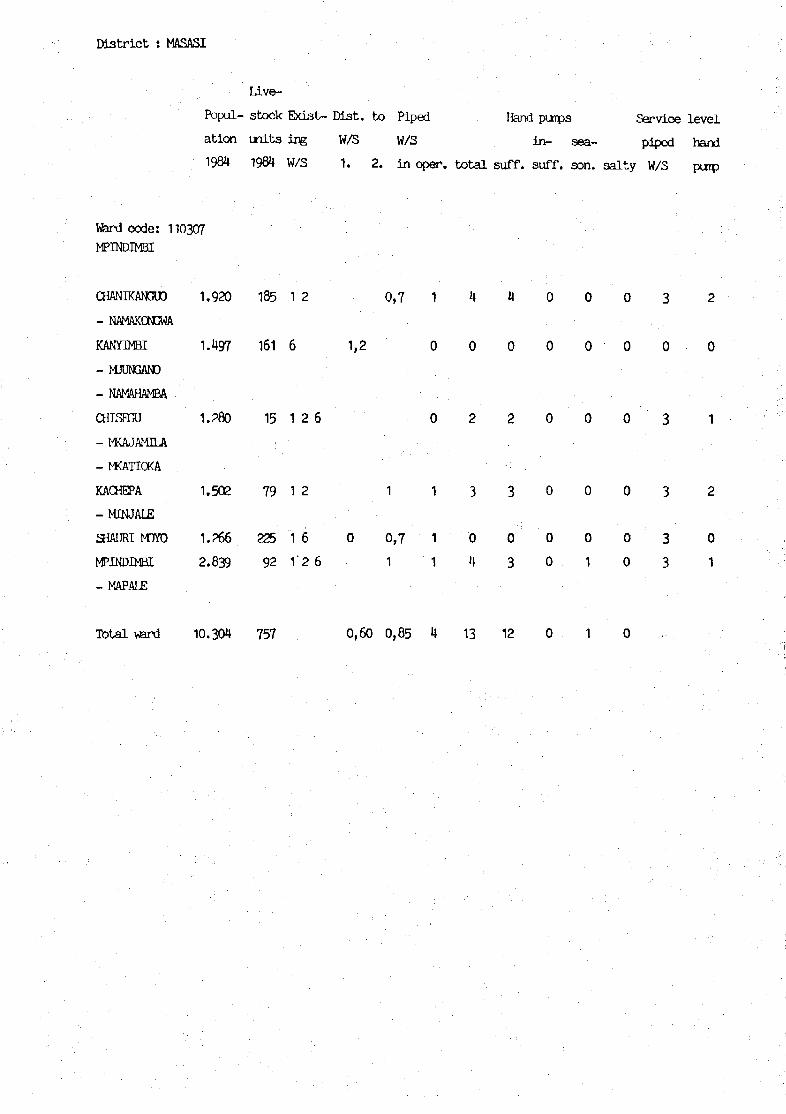
District : MASASI
Live-
Popul- stock Ebdst- Dist. to Piped Hand puips Service level
ation units ing W/3 W/S in- sea- piped hand
1984 1984 W/S 1. 2. in oper. total suff. suff. son. salty W/S putp
Ward code: 110307
CHANIKAN3UD 1.920 1Ô5 1 2 0,7 1 4 4 0 0 0 3 2
- NAMAKONGWA
KANYIMBI 1.497 161 6 1,2 0 0 0 0 0 0 0 0
- MJUNGANO
- NAMAHAMBA
CHISEEU 1 . 2 8 0 1 5 1 2 6 0 2 2 0 0 0 3 1
- MKAJAMILA
- MKATÏOKA :
KACHEPA 1.502 79 1 2 1 1 3 3 0 0 0 3 2
- MDWALE
EHAURI M3Ï0 1.266 225 1 6 0 0,7 1 0 0 0 0 0 3 0
MPDTOIMBI 2 . 8 3 9 9 2 1 2 6 1 1 4 3 0 1 0 3 1
- MAPALE
Total ward 10.304 757 0,60 0,85 4 13 12 0 1 0
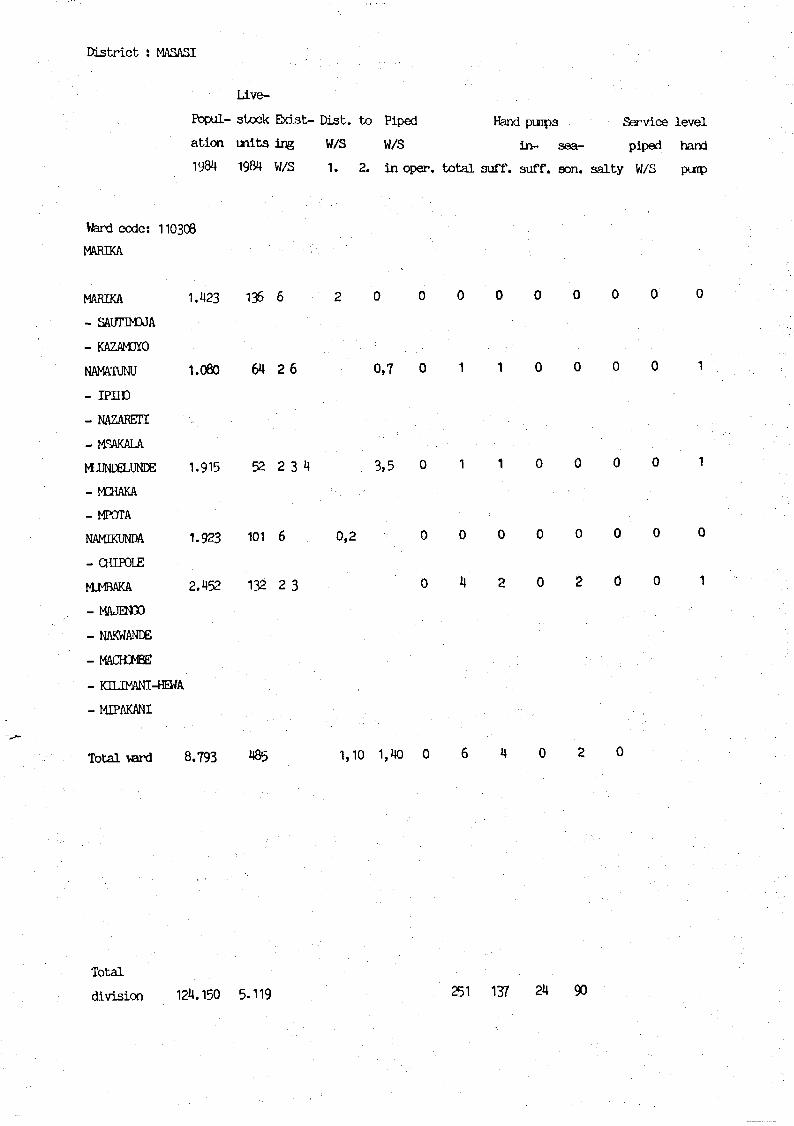
District : MASASI
L i v e - • . . . '
Popul- stock Exist- Dist. to Piped Hand punps Service level
ation inits ing W/S W/S in- sea- piped hand
1984 1984 W/S 1. 2. in oper. total suff. suff. son. salty W/S
Ward code: 110308
MARIKA ;;
MARIKA 1.423 136 6 2 0 0 0 0 0 0 0 0 0
- SAUTCMDJA
- KAZAMOYO
NAMATONU 1.080 64 2 6 0,7 0 1 1 0 0 0 0 1
- IPIH0
- NAZARETI
- MSAKALA
MUNDELUNDE 1.915 52 2 3 4 3,5 0 1 1 0 0 0 0 1
- M C H A K A •
- MPOTA
NAMKUNDA 1-923 101 6 0,2 0 0 - 0 0 0 0 0 0
- CHIFOLE
KMBAKA 2.452 132 2 3 0 4 2 0 2 0 0 1
- MAJEN30
- NAKWANDE
-MAŒCMBE
- KUJMANI-HEWA . ..
-MTPAKAbtt ;
Total verd 8.793 ^85 1,10 1,40 0 6 4 0 2 0
Total
division 124.150 5.119 251

District : MASASI
Live-
Popul- stock Exist» Dist. to Piped Hand punps Service level
ation units ing W/S W/S in- sea- piped hand
1984 1984 W/S 1. 2. in.oper. total suff. suff. son. salty W/S punp
Division : CHKJNGTOJA
Ward code: 110401NANJOTA
NANJOTA
-MtGONOO
NAMBUNDA
- MPWAPWA JUU
- TUPENDANE
MLJELEJELE
- TULEANE-
MPUTENI
- MIENGULA
- MPWAPWA
NAIRCMBO
2.395
2.716
42 2 3 4 0 12
112 6 2 0,7 1,2 0 6
1.606 90 2 3 4
987 100 6 2 4 5,5
0 0 12 0 0
6 0 0 0 0
0 5 5 0 0 0 0
0 6 3 0 3 0 0
Total ward 7.704 345 3,10 2,60 0 29 14 0 15 0
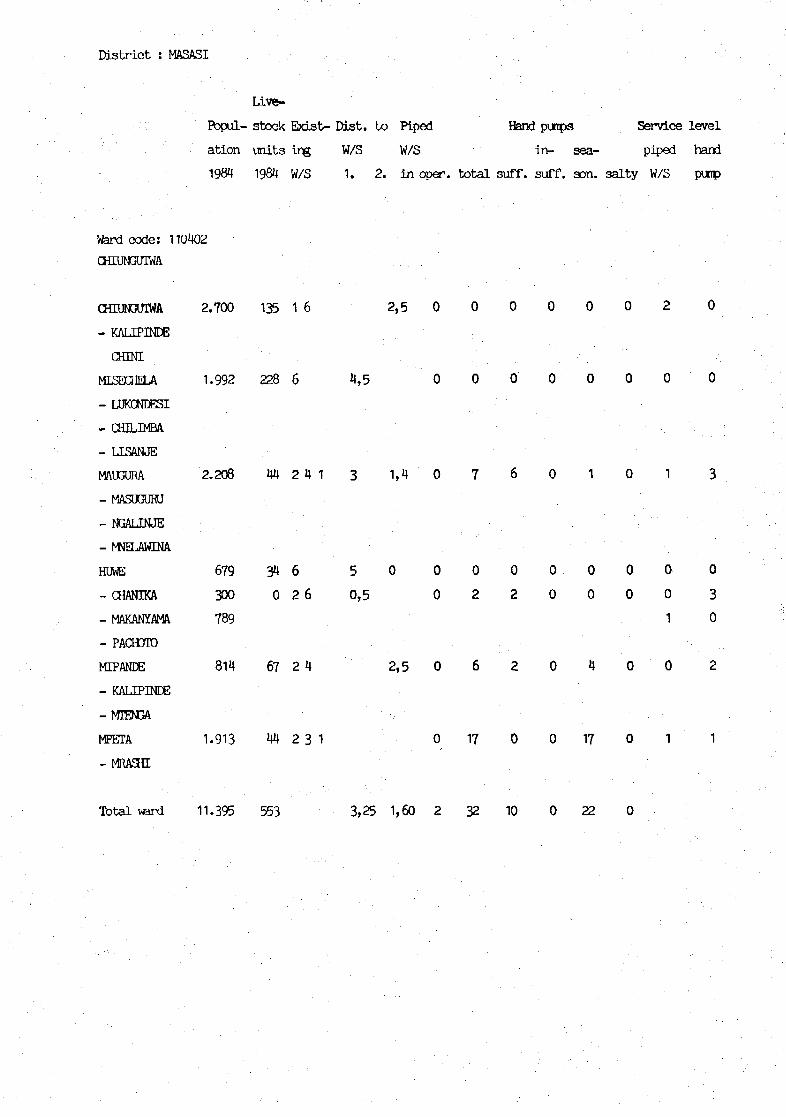
District : MASASI
Live-
Popul- stock Exista Dist. to Piped Hand pumps Service level
ation units ing W/S W/S in- sea- piped hand
1984 1984 W/S 1. 2. in oper. total suff. suff. son. salty W/S punp
Ward code: 110402
CHIUNGOTWA
CHIUNCWIWA 2.700 135 1 6
- KALIPINDE
2 , 5 0 0 0 0 0 0 2
MISEHŒLA 1.992 228 6 4,5 0 0 0 0 0 0 0 0
- LUK0NDESI
- CH3LIMBA
- LISANJE
MAUGURA 2 . 2 0 8 4 4 2 4 1 3 1,4 0 7 6 0 1 0 1 3
- MASU3UKU
- NGALINJE
- MNELAWINA
HUWE
- CHANIKA
679 3 4 6
300 0 2 6 0,5
- MAKANYAMA 789
- PACHJTO
MTPANEE
- KALIPINDE
- MIENGA
MPETA
- MRASHI
5 0 0 0 0 0 0 0 0
0 2 2 0 0 0 0
1
814 67 2 4
1.913 4 4 2 3 1
2,5 0 6 2 0 4 0 0
0 17 0 0 17 0 1 1
Total ward 11.395 553 3,25 1,60 2 32 10 0 22 0
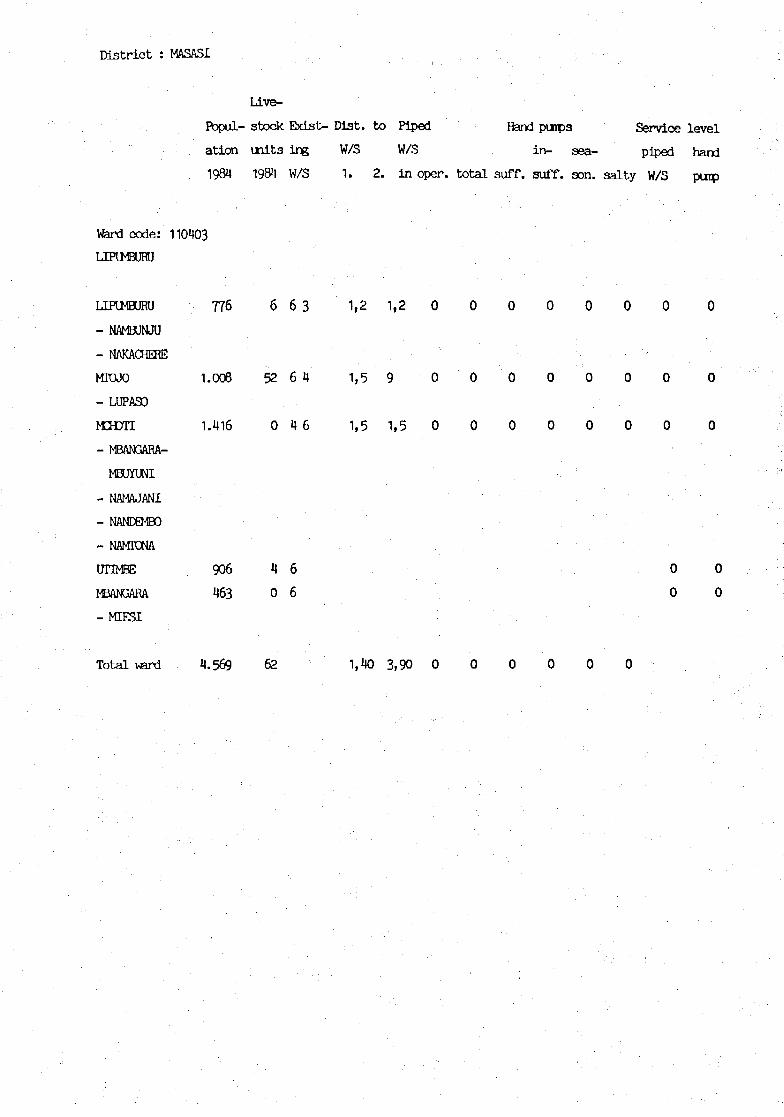
Dis t r ic t : MASASI
LLve-
Fopul- stock Exist- Dist. to Piped Hand pwps Service level
ation i n i t s ing W/S W/S in - sea- piped hand
1984 1984 W/S 1. 2. in oper. to ta l suff. suff. aon. sa l ty W/S pmp
Ward code: 110403
LIHWBURU
LIHJMEURU 776 6 6 3 " 1,2 1,2 0 0 0 0 0 0 0 0
- NAMBUNJU
- NAKACHERE
MTOJO 1 .003 5 2 6 4 1,5 9 0 0 0 0 0 0 0 0
- LUPASO
KH3TI 1.416 0 4 6 1,5 1,5 0 0 0 0 0 0 0 0
- MBANGARA-
MBUYUNI
- NAMAJANI
- NANDEMBO :
- NAMTONA
OTIMBE 906 H 6 0 0
MBAN3ARA 4 6 3 0 6 0 0
- M I E S I " : \ • ,: •
Total vjard 4.569 62 1,»«D 3,90 0 0 0 0 0 0

District : MASASI
Live-1 Fbpul- 3took Exist- Dist. to Piped Hand punpa Service level
ation units ing W/S W/S in- sea- piped hand
1984 1984 W/S 1. 2. in oper. total suff. suff. son. salty W/S pump
Ward code: 110404
MBUYUNI
MDIBWA 1.798 5 3 1 6 1,5 1 0 0 0 0 0 2 1
- MATOGORO
MIUNGO 1.325 60 4 2 0 4 0 0 4 0 0 1
- CHIPINDIMHI
MPULJMA 1.644 73 6 2 2,5 2,5 0 7 1 0 6 0 1
- MAJEMBE NDAGO
- LJXANGA JUU
- ULAWA
MTTONJI 701 40 4 6 4,5 4,5 0 0 0 0 0 0 0 0
- MKHJINI
MBUYUNI 1.385 70 1 6 1 0 0 0 0 0 2 0
- NAMBARAPI
- LUCHELEWA
Tbtalverd 6.853 296 3,50 2,83 2 11 1 0 10 0
Ibtal
division 30.521 1.256 77 25 0 47 0
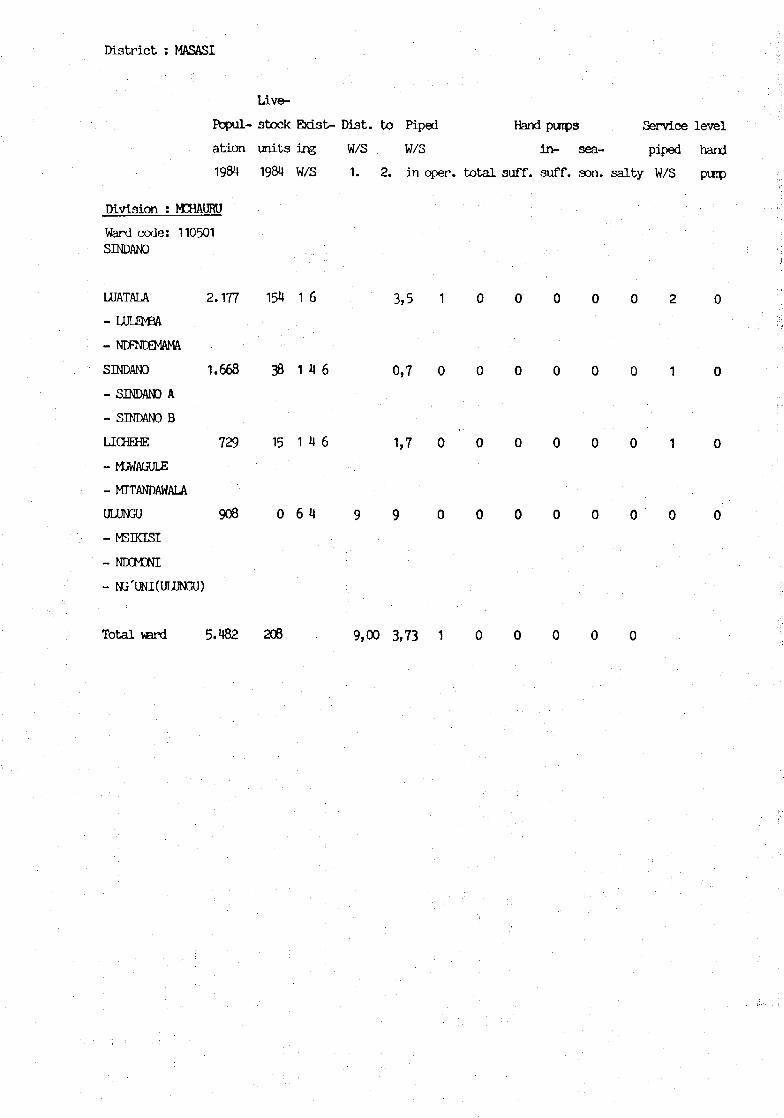
District : MASASI
LAve-
Pbpul- stock Exist- Dist. to Piped Hand puips Service level
ation units ing W/S W/S in- sea- piped hand
1984 1984 W/S 1. 2. in oper. total suff. suff. son. salty W/3 pwp
Division :
Ward code: 110501SINDANO
LUATALA 2.177 154 1 6 3,5 1 0 0 0 0 0 2 0
- LULQ-BA
- NDENDEMAMA >
SINDANO 1.668 38 1 4 6 0 , 7 0 0 0 0 0 0 1 0
- SINDAND A
- SINDANO B
LICHEHE 729 15 1 4 6 1,7 0 0 0 0 0 0 1 0
- hCWAGULE
- MITANDAWALA
ULUNGU 908 0 6 4 9 9 0 0 0 0 0 0 0 0
- NBIKISI
- NDCKHI
- NG'UNI(UUUNGU)
Total ward 5.482 208 9,00 3,73 1 0 0 0 0 0
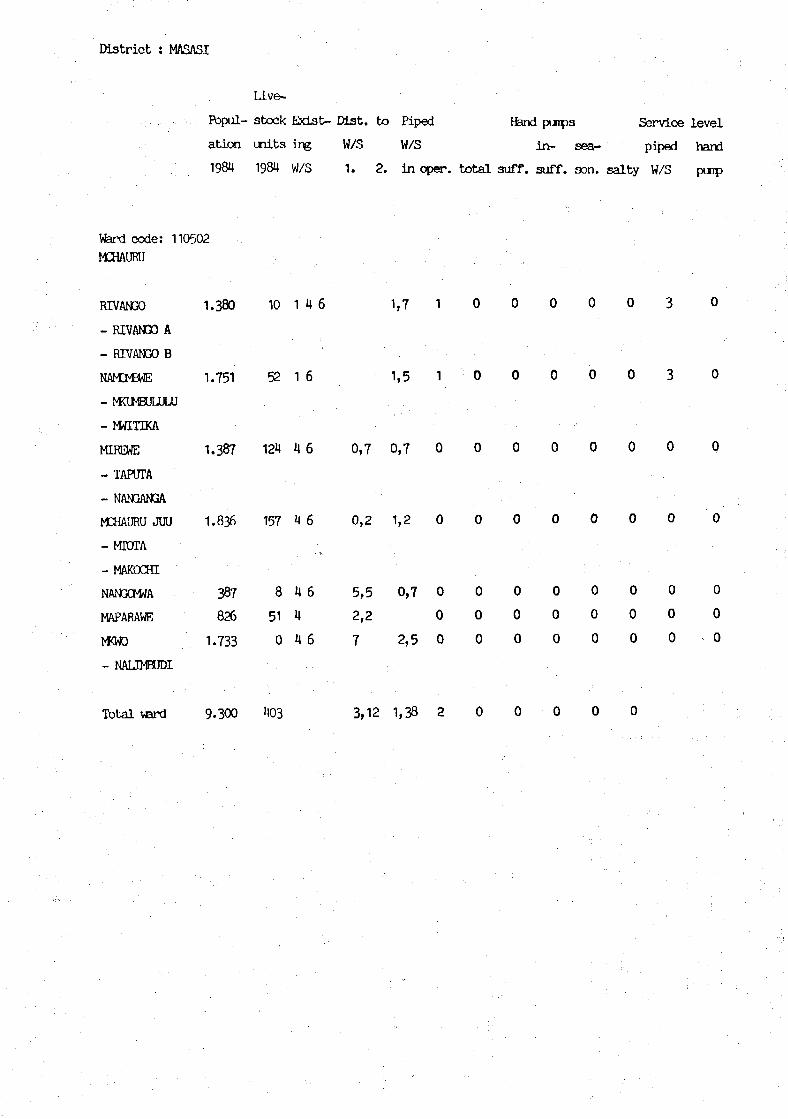
District : MASASI
LLve-
Popul- stock Exist- Dist. to Piped Hand punps Service level
ation units ing W/S W/S in- sea- piped hand
1984 1984 W/S 1. 2. in oper. total suff. suff. son. salty W/3 punp
Ward code: 110502MCHAURU
RIVANGO 1.380 10 1 4 6 1,7 1 0 0 0 0 0 3 0
- RIVAN00 A
- RIVANGO B
NANEMBWE 1.751 52 1 6 1,5 1 0 0 0 0 0 3 0
- MOJMBUUJIJJ
- WITIKA
MIREWE 1.387 124 4 6 0,7 0,7 0 0 0 0 0 0 0 0
- TAPOTA
- NANGANGA
M3ÎAURU JUU 1.836 157 4 6 0,2 1,2 0 0 0 0 0 0 0 0
- MIUTA
- MAKDCHI
NANGCMrfA 387 8 46 5,5 0,7 0 0 0 0 0 0 0 0
MAPARAWE 826 51 4 2,2 0 0 0 0 0 0 0 0
mtO 1.733 0 4 6 7 2 , 5 0 0 0 0 0 0 0 0
- NA1JMBUDI
Total vard 9.300 403 3,12 1,38 2 0 0 0 0 0
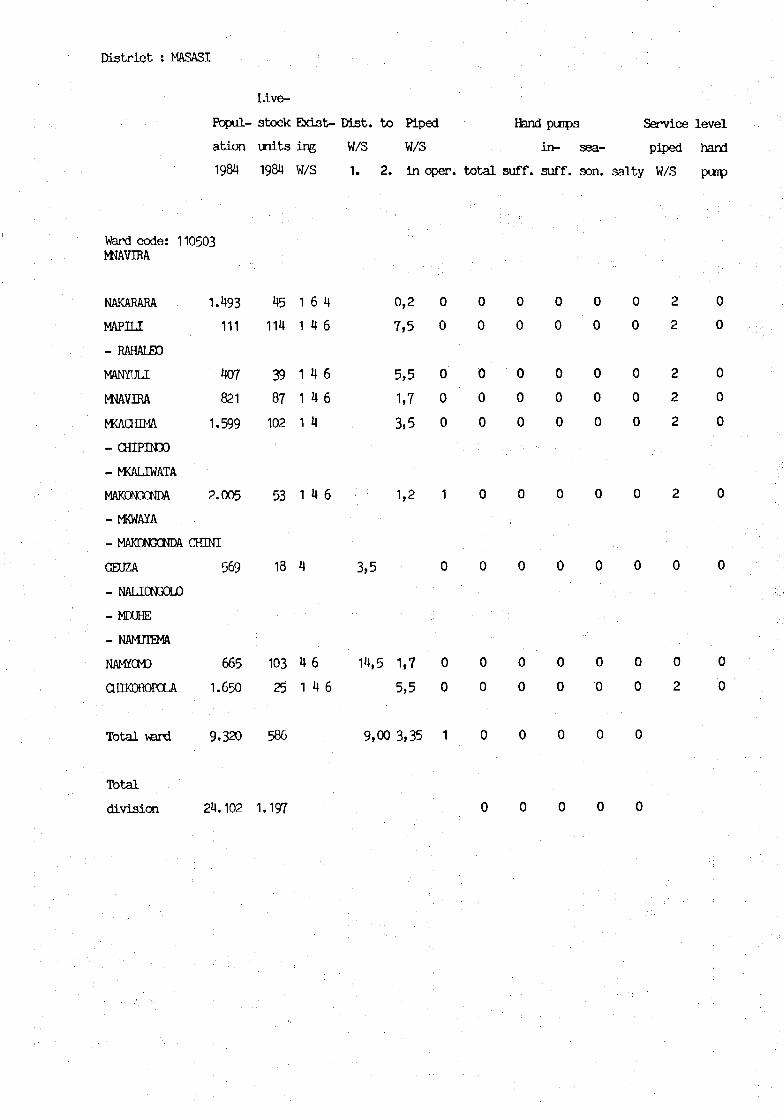
District ; MASASI
Live-
Popul- stock Exist- Dist. to Piped Hand punps Service level
ation units ing W/S W/S in- sea- piped hand
1984 1984 W/S 1. 2. in oper. total suff. suff. son. salty W/S punp
Ward c o d e : 110503WAVTRA
NAKARAM
MAPILI
- RAHALBO
MANYULI
WAVIRA
MCACfflM
- CHIPIN3O
- MCALIWATA
MAKDNGONDA
-MKWAYA
1.493
111
407
821
1.599
2.005
- MAKDNGCNDA CHINI
GEUZA
- N A L K H X L O
- MDUHE
- NAMJTEMA
NAMYCTC)
OttKQROPOLA
569
665
1.650
45
114
39
87102
53
18
103
25
1
1
1
1
1
1
4
4
1
6
4
4
4
4
4
6
4
4
6
6
6
6
6
0,2
7,5
5,5
1,7
3,5
1,2
3,5
14,5 1,7
5,5
0
0
0
0
0
1
0
0
0
0
0
0
0
0
0
0
0
0
0
0
0
0
0
0
0
0
0
0
0
0
0
0
0
0
0
0
0
0
0
0
0
0
0
0
0
0
0
0
0
0
0
0
0
0
2
2
2
2
2
2
0
0
2
0
0
0
0
0
0
0
0
0
Tbtal ward 9.320 586 9,00 3,35 1 0 0 0 0
Tbtal
division 24.102 1.197
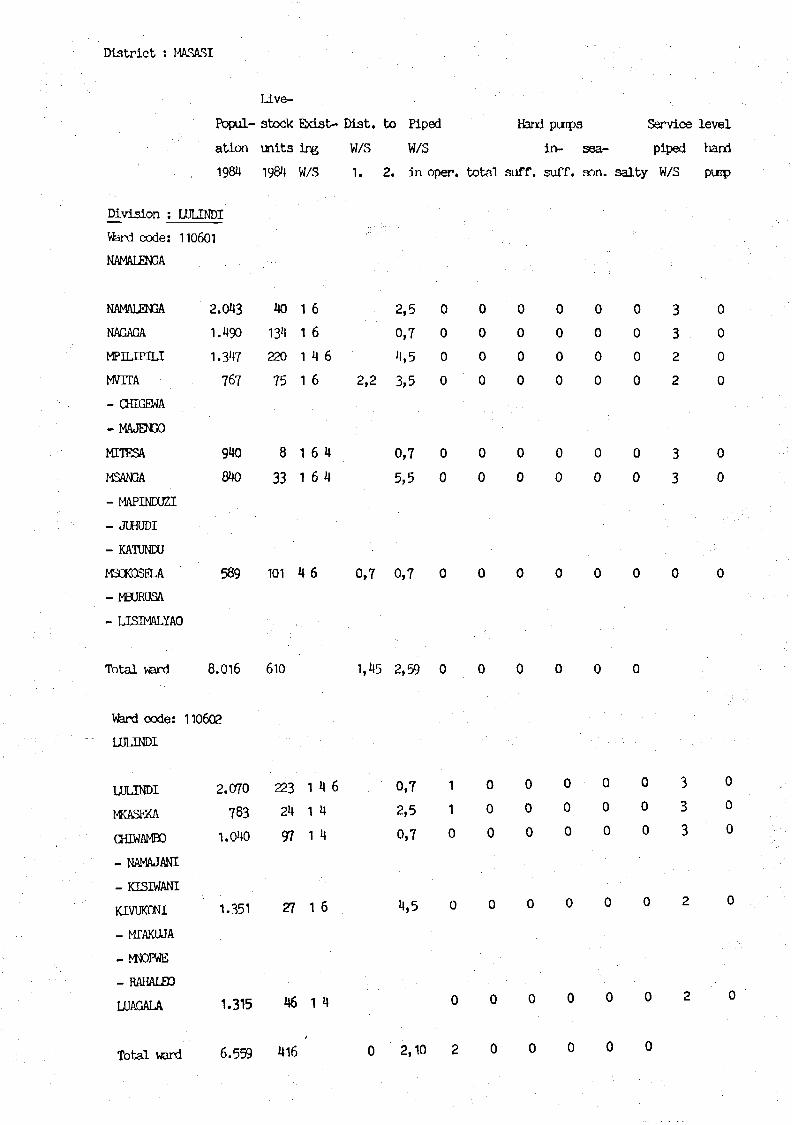
District : MASASI
Uve-
Popul- stock Exist- Dist. to Piped Hand punps Service level
ation units ùig W/S W/5 in- sea- piped hand
1984 19814 W/S 1. 2. in oper. total suff. suff. son. salty W/S puip
D i v i s i o n : LULTNDI
Ward c o d e : 110601
NAMALENGA
NAMALEN3A 2
NAGAGA 1
MPHJPHJ 1
MVTTA
- CHIGEWA
-MAJENGO
MTTESA
MSANGA
- MAPINDUZI
- JUHUDI
- KATUNDU
MSCKQSELA
- MBURUSA
- LISMALYAO
.043
.490
•347
767
940
840
589
40
134
220
75
8
33
101
1
1
1
1
1
1
U
6
6
4 6
6
64
64
6
2,5
0,7
4,5
2,2 3,5
0,7
5,5
0,7 0,7
0
0
0
0
0
0
0
0
0
0
0
0
0
0
0
0
0
0
0
0
0
0
0
0
0
0
0
0
0
0
0
0
0
0
0
0
0
0
0
0
0
0
3
32
2
3
3
0
0
0
0
0
0
0
0
Total ward 8.016 610 1,45 2,59 0 0
Ward c o d e :
LULINDI
LULINDI
MKASEKA
QflWAMBO
- NAMAJANI
- KISIWANI
KIVUKDNI
- MTAKUJA
- W0PWE
- RAHALBO
LUAGALA
110602
2.070
783
1.040
1.351
1.315
223
24
97
27
46
1
1
1
1
1
46
4
4
6
4
0,7
2,5
0,7
1
1
0
0
0
0
0
0
0
0
0
0
0
0
0
0
0
0
33
3
0
0
0
4,5
Total ward 6.559 416 0 2,10 2 0 0 0
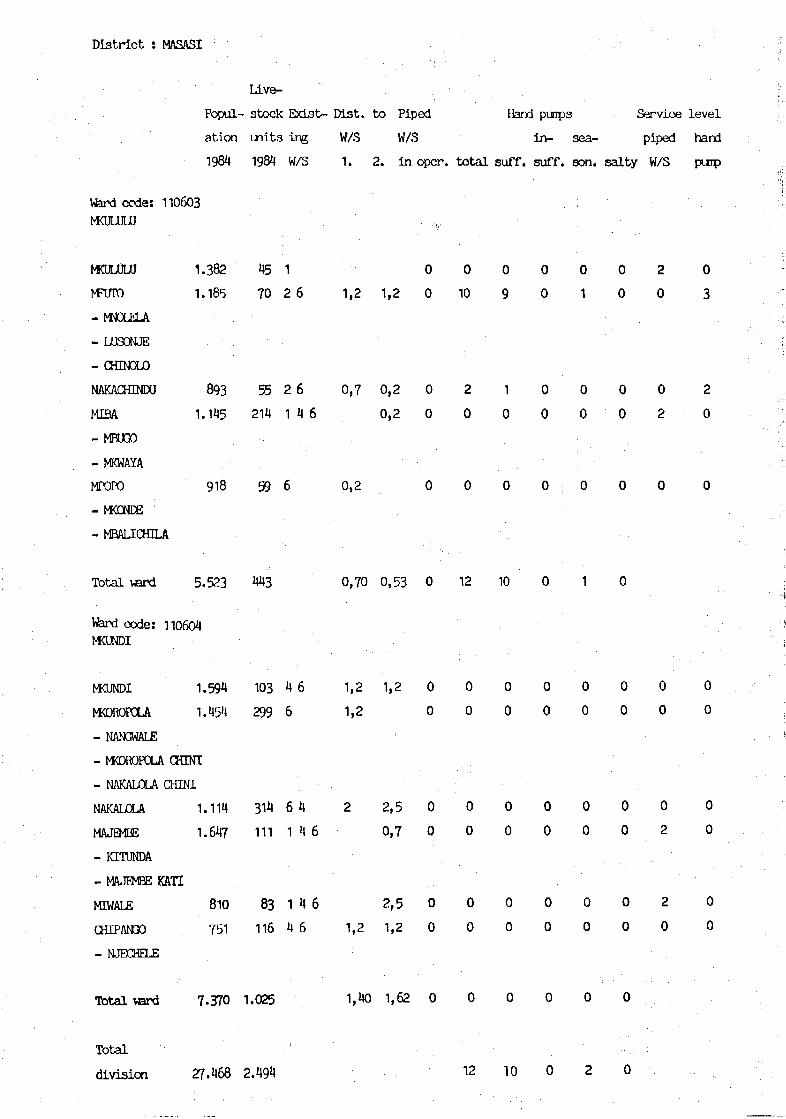
District : MASASI
Uve-
Popul- stock Exist- Dist. to Piped Hand pumps Service level
ation units ing W/5 W/S in- sea- piped hand
1984 1984 W/S 1. 2. in oper. total suff. suff. son. salty W/S pmp
Ward code: 110603MKULULU . ..,,, :
WCULUUJ 1.382 45 1 0 0 0 0 0 0 2 0
MFUTO 1.185 70 2 6 1,2 1,2 0 10 9 0 1 0 0 3
- MNOLELA
- LUSONJE
» CHTNOLO
NAKACHINDU 893 55 2 6 0,7 0,2 0 2 1 0 0 0 0 2
MIBA 1.145 214 1 4 6 0,2 0 0 0 0 0 0 2 0
- M E U O O
- M K W A Y A . • '.
MPOPO 918 59 6 0,2 0 0 0 0 0 0 0 0
-M0ONDE
- MBALICH3LA
Total ward 5.523 443 0,70 0,53 0 12 10 0 1 . 0
Ward code: 110604MKUNDI
MKUNDI 1.594 103 4 6 1,2 1,2 0 0 0 0 0 0 0 0
MKDROPOLA 1.454 299 6 1,2 0 0 0 0 0 0 0 0
- NANGWALE
- MKDROPOLA CfflMI
- NAKALOLA CHINI
NAKALCLA 1.114 314 6 4 2 2,5 0 0 0 0 0 0 0 0
MAJEMBE 1.647 111 1 4 6 0,7 0 0 0 0 0 0 2 0
- KITUNDA
- MAJEMBE KATI
MIWAUE 810 83 1 4 6 2,5 0 0 0 0 0 0 2 0
CHIPAN30 751 116 4 6 1,2 1,2 0 0 0 0 0 0 0 0
- NJECHELE ,
Tbtalward 7.370 1.025 1.U0 1,62 0 0 0 0 0 0
Total
division 27.468 2.494 12 10 0 2 0
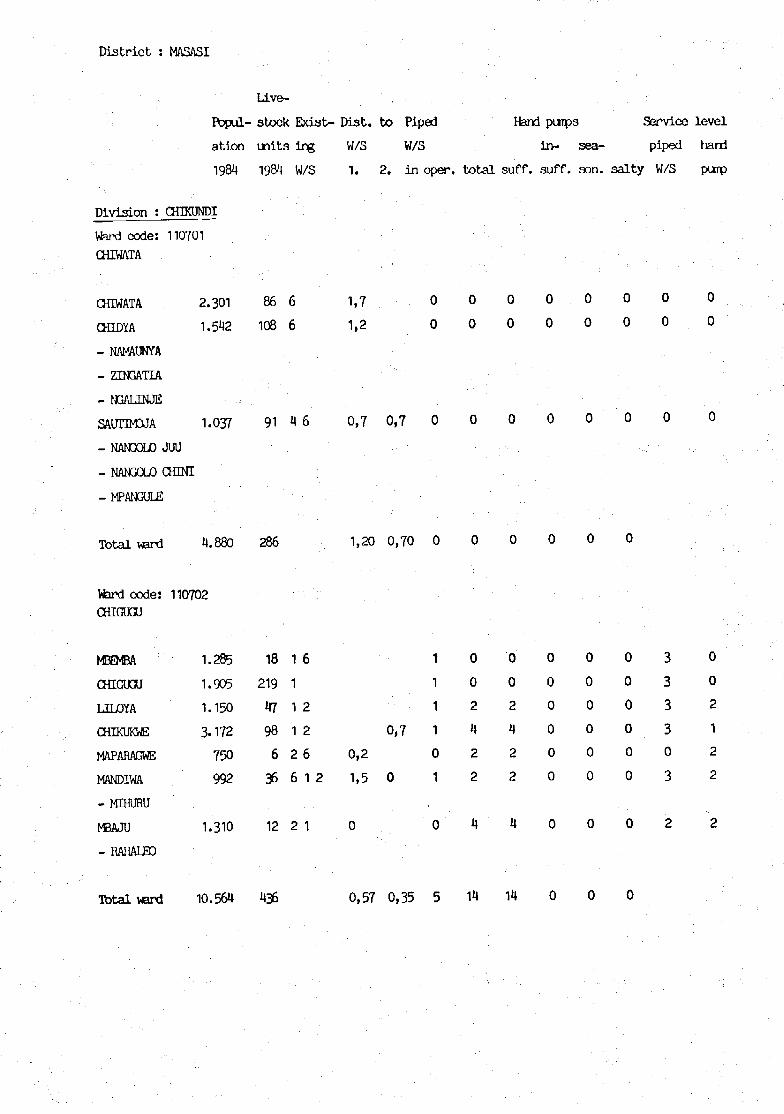
District : MASASI
Uve-
Pdpul- stock Exist- Dist. to Piped Hand puips Service level
ation units ing W/S W/5 in- sea- piped hand
1984 1984 W/S 1. 2. in oper. total suff. suff. son. salty W/S purp
Division : CHBCUNDI
Ward code:CHIWATA
CHIWATA
CHIDYA
- NAMAUNYA
- ZIN3ATIA
- N3ALINJE
SAUTMXJA
110701
2.301
1.542
1.037
- NANGOUO JUU
- NANGOLO CHML
- MPANGULE
Total ward
Ward code:CHIGUGU
MBEMBA
CHIGUGU
LILOYA
CHIKUKWE
MAPARAGWE
MANDIWA
- MIHURU
MBAJU
- RAHAliD
Total ward
4.880
110702
1.285
1.905
1.150
3-172
750
992
1.310
10.564
86
108
91
286
18
219
47
98
6
36
12
436
6
6
4
1
1
1
1
2
6
2
6
6
2
2
6
1 2
1
1,7
1,2
0,7
1,20
0,2
1,5
0
0,57
• : •
0,7
0,70
0,7
0
0,35
0
0
0
0
1
1
1
1
0
1
0
5
0
0
0
0
0
0
2
4
2
2
4
14
0
0
0
0
0
0
2
4
2
2
4
14
0
0
0
0
0
0
0
0
0
0
0
0
0
0
0
0
0
0
0
0
0
0
0
0
0
0
0
0
0
0
0
0
0
0
0
0
0
0
0
333
30
3
2
0
0
0
0
0
2
1
2
2
2
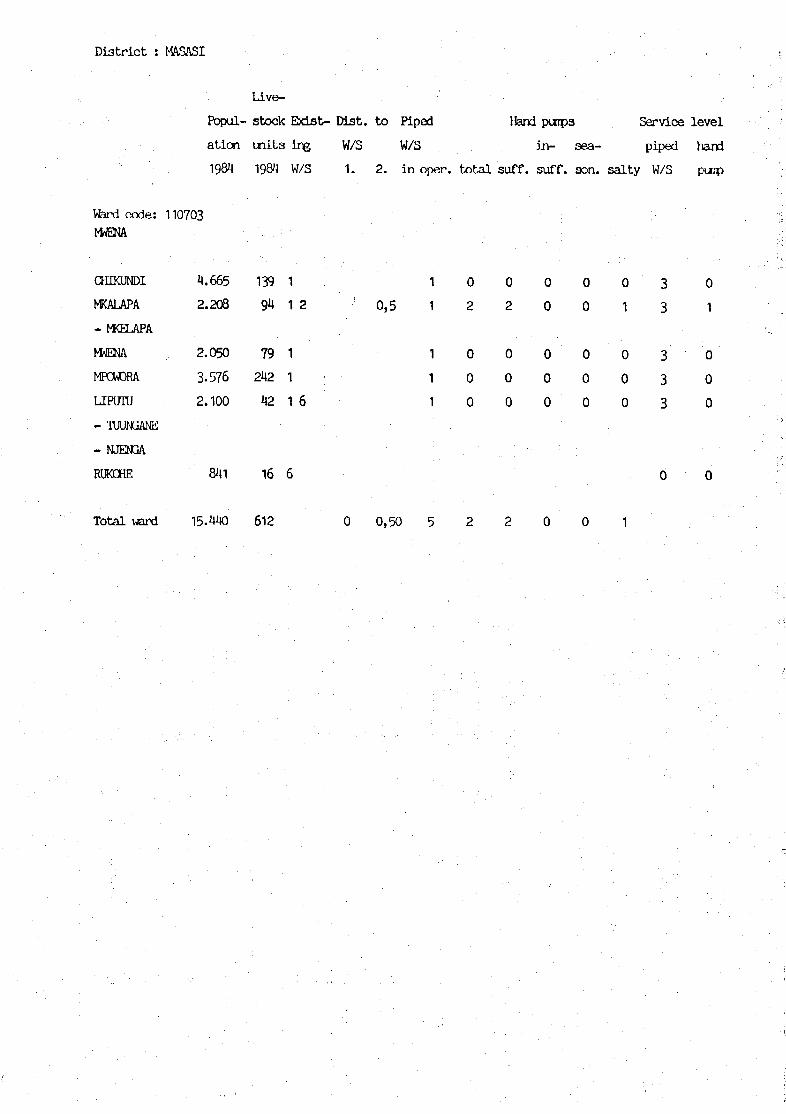
District : MASASI
Live-
Popul- stock Exist- Dist. to Piped Hand purrps Service level
ation inita ing W/S W/S in- sea- piped hand
1984 1984 W/3 1. 2. in oper. total suff. suff. son. salty W/S puip
Ward c o d e :WENA
CHIKUNDI
MKALAPA
- MKELAPA
WENA
MPCWDRA
LlPimj
- TUUNGANE
- NJEtGA
RUKDHE
Total ward
110703
4.665
2.208
2.050
3.576
2.100
841
15.440
139
94
79242
42
16
612
1
1 2
1
1
1 6
6
0,5
1
1
1
1
1
0
2
0
0
0
0
2
0
0
0
0
0
0
0
0
0
0
0
0
0
0
1
0
0
0
3
3
3
3
3
0
1
0
0
0
0,50
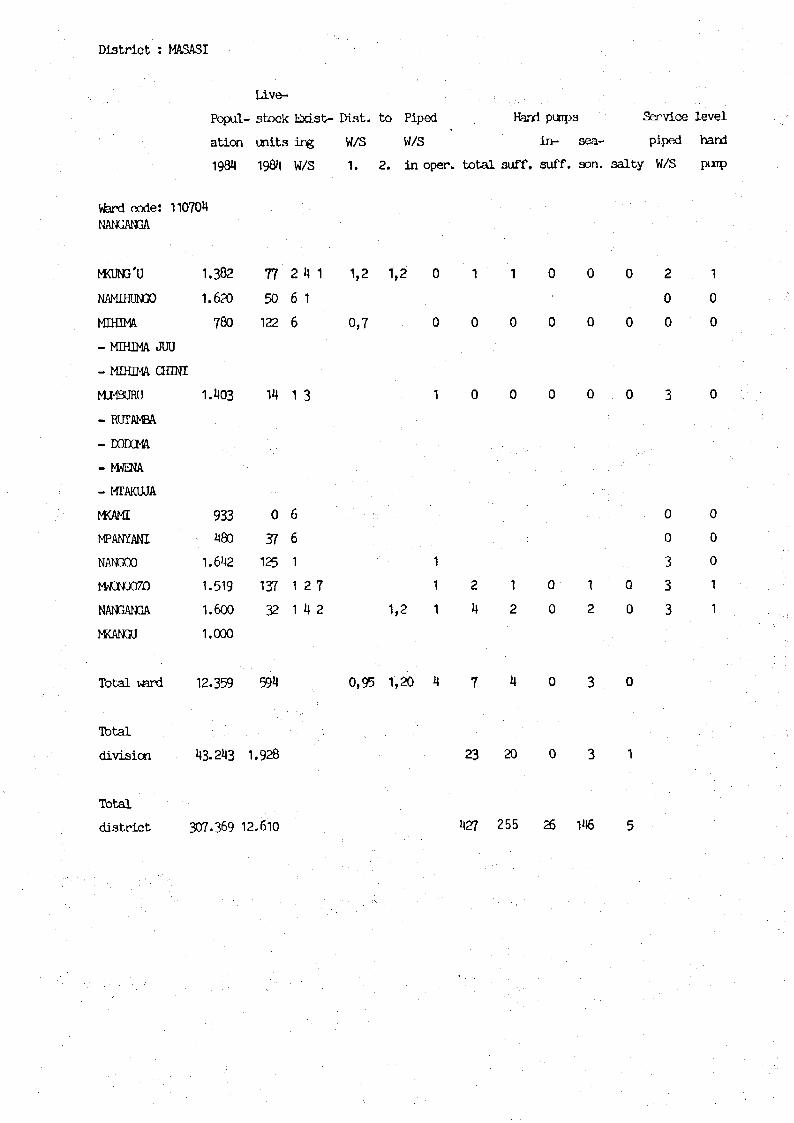
District : MASASI
LAve-
Popul- stock Exist- Dist, to Piped Hand punps Service level
ation unit3 ing W/S W/S in- sea- piped hand
1984 1984 W/S 1. 2. in oper. total suff. suff. son. salty W/S punp
Ward code: 110704NANGANGA
MKUNG'U
NAMMMJO
MIHIMA
- MIHIMA JUU
- M I H I M A CHINI
MJM8URU
- RUTAMBA.
- DODCMA
- MWENA
- MTAKUJA
MKAMI
MPANÏANI
NANGOO
WCNGQZO
NANGANGA
MKANGU
1.382
1.620
780
1.403
933
480
1.642
1.519
1.600
1.000
7750
122
14
0
37
125
137
32
2
6
6
1
6
6
1
1
1
4 1 1,2 1,2
1
0,7
3
2 7
4 2 1,2
0
Q
1
1
1
1
0 0 0 2 1
0 0
0 0 0 0 0
0 0
0 0
3 0
0 1 0 3 1
0 2 0 3 1
Total wrû 12.359 594 0,95 1,20 4 7 4 0 3 0
Total
division 43.243 1.928 23 20 0 3 1
Total
district 307.369 12.610 427 255 26 1U6 5
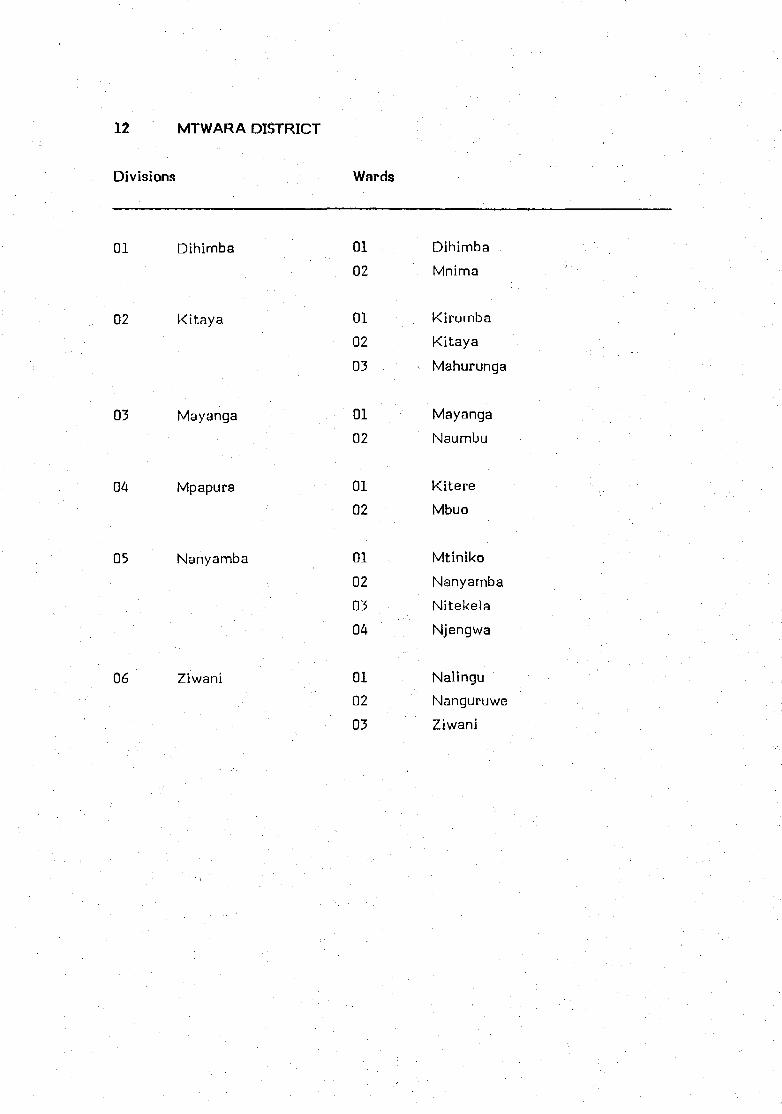
12 MTWARA DISTRICT
Divisions Wards
01
02
03
05
Dihimba
Kitaya
Mayanga
Mpapura
Nanyamba
Ziwani
01
02
01
02
03
01
02
01
02
01
02
03
04
01
02
03
DihimbaMnima
Kiromba
Kitaya
Mahurunga
Mayanga
Naumbu
Kitere
Mbuo
Mtiniko
Nanyamba
Nitekela
Njengwa
Nalingu
Nanguruwe
Ziwani
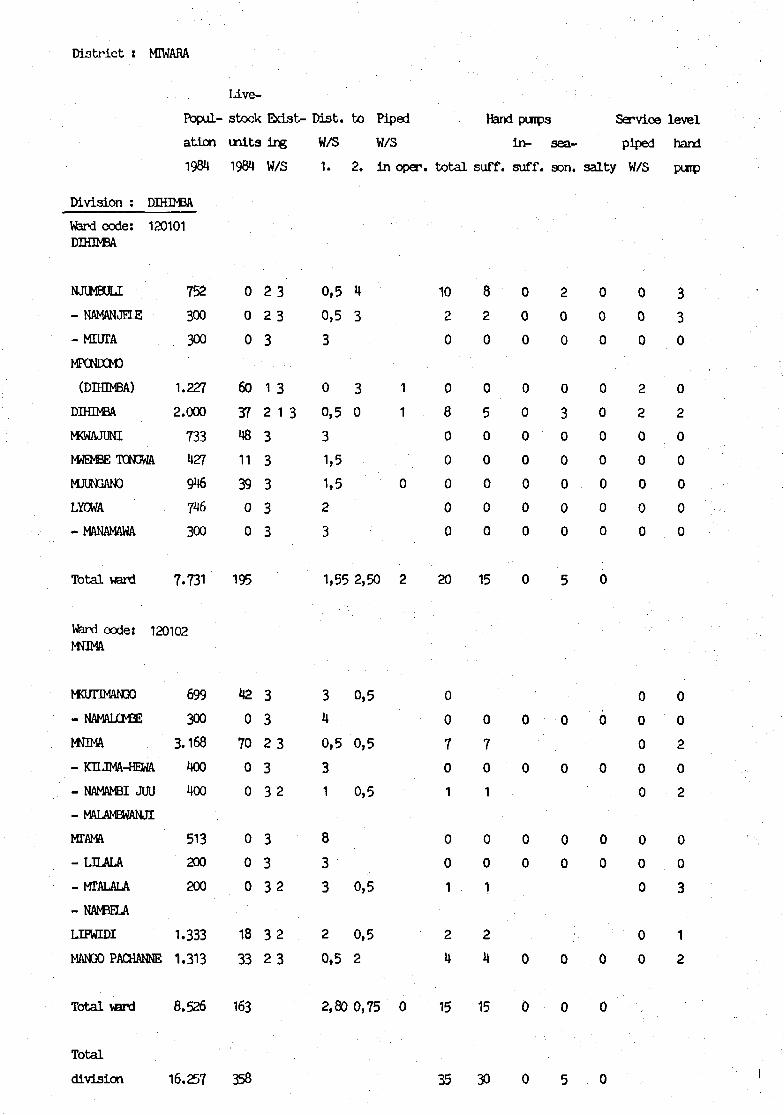
District : MIWAM
LAve-
Popul- stock Exist- Dist. to Piped Hand puips Servioe level
ation units ing W/S W/S in- sea- piped hand
1984 1984 W/S 1. 2. in oper. total suff. suff. son. salty W/S pmp
Division : DIHUCA
Ward c o d e : 120101DIHIMBA
NJIMBULI
- NAMANJELE
- MTUTA
MPCNDCMD
(DÏÏÏÏMBA)
DDHMBA
MKWAJUNI
WBtëETONGWA
MUUNGANO
LYCWA
-MANAMAWA
Total ward
752
300
300
1.227
2.000
733
427
946
746
300
7.731
Ward o o d e : 1 2 0 1 0 2MNIMA
MKUT3MANG0
- NAMALCMBE
MNIMA
- KILIMA-HEWA
- NAMAMBI JUU
- MALAMEWANJI
MTAMA
- LJLALA
- MTALALA
699
300
3.168
400
400
513
200
200
0
0
0
60
37
48
11
39
0
0
195
\z0
70
0
0
0
0
0
2 3
2 3
3
1 3
2 1 3
33
333
332 3
33 2
333 2
0,5
0,5
3
0
0,5
3
1,5
1,5
2
3
1,55
34
0,5
3
1
833
4
3
30
2,50
0,5
0,5
0,5
0,5
1
1
0
2
10
2
0
0
8
0
0
0
0
0
20
0
0
7
0
1
0
0
1
82
0
0
5
0
0
0
0
0
15
0
70
1
0
0
1
0
0
0
0
0
0
0
0
0
0
0
0
0
0
0
2
0
0
0
30
0
0
0
0
5
0
0
0
0
0
0
0
0
0
0
0
0
0
0
0
0
0
0
0
0
0
0
2
2
0
0
0
0
0
0
0
0
0
0
0
0
0
330
0
2
0
0
0
0
0
0
0
2
0
2
0
0
3
LIFWIDI 1.333 18 3 2 2 0,5
MANX PACHANNE 1.313 33 2 3 0,5 2
2 2
4 4 0
0
0
1
2
Total ward 8.526 163 2,80 0,75 0 15 15
Total
division 16.257 358 35 30

Dis t r i c t : MIWARA
l ive-
l - stock Exist- Dist. to Piped Hand puips Service level
ation w i t s ing W/S W/S in- sea- piped hand
1984 1984 W/S 1. 2. in oper. total suff. suff. son. salty W/S puip
D i v i s i o n : KCTAYA
Ward c o d e : 120201
KIRCMiA JUU
- KIRCM3A CfflNI
- MMMBI
KIYANGA
- MYAMBO
-MKAHARA
MISUFINI
- NACHUMA
MAYEMBE
MPAYANI
Total ward
1.285
300
962
300
300
1.211
400
2.275
750
7.783
27
0
40
0
0
0
0
95
31
193
1
3
2
3
3
3
3
1
4
3
3 5
7
0
8
0,5
2
2
8
8
0
0,5
3,22
8
2
5
5,00
1
0
0
1
0
0
5
0
0
o0
0
5
0
0
5
0
0
0
0
0
5
0
0
0
0
0
0
0
0
0
0
0
0
0
0
0
0
0
0
0
0
0
0
0
0
2
0
0
0
0
0
0
2
0
0
0
3
0
0
0
0
0
0
Ward code:KTTAYA
ARUSHACHINI
- JŒHAMBE
- ARUSHA JUU
- NGONJA
CHAWI
- NAVIKDLE
- N J O R O N O O R O
- MKCMA
KITAYA
- MCHANJE
Total ward
120202
630
200
830
344
747
451
373
495
3.859
356
8.285
39
0
0
0
42
0
0
0
117
0
197
1 3
2 4
1 3
3
3 5
3
3
3
1 2
4 7
0
0,5
0
3
3
3
3
3
0
1,7
1,72
2
3
0,5
0
1,2
1,34
1
1
0
0
2
0
2
0
0
0
0
0
0
30
5
0
2
0
0
0
0
0
0
3
0
5
0
0
0
0
0
0
0
0
0
0
0
0
0
0
0
0
0
0
0
0
0
0
0
0
0
0
0
2
0
2
0
0
0
0
0
2
0
0
3
0
0
0
0
0
0
1
0

Dis t r ic t : MIWARA
lAve-
Popul- stock Exists Mat. to Piped Hand pump3 Service level
ation u i i t s i re W/S W/S in- sea- piped hand
1984 1984 W/S 1. 2. in oper. total suff. suff. son. salty W/S purtp
Ward code:MAHURJNGA
TANGAZO
- MAGOBJI
- KILAMBO
KtLOEERO
FOTON3ULI
MAHIMJNGA
- KIYONCX)
KEflMIKA
120203
2.337
300
985
1.101
2.085
788
111
0
0
6
46
14
2
2
2 7
1 2
1 2
5 2
1
0,5
0,5
0
0
1
0,5
0,5
0,5
0,5
0
1
1
12
5
5
5
6
4
9
5
2
4
2
1
0
0
0
0
0
0
3
0
31
4
3
1
0
0
0
0
1
0
0
0
1
1
0
3
32
2
1
2
Total waM 7.596 177 0,50 0,50 2 37 23 0 14 2
Total
division 23.669 567 47 33 0 14 2
Division : MAYANGA
Ward code:
MAYANGA
KAWAWA
120301
- MBAWALA-CHBJI
- NANYATI
- NYENGEDI
MOJNWA
LIKCNDE
- LIKONDB
GODAUNI
MSIJUTE
Total ward
1.
1.
4.
816
300
200
300
160
675
165
616
26
0
0
0
50
22
67
165
1
1
1
1
6
6
2
3
3
3
35
5 1
0
0
0
0
0,7
3,1
0,7
0.64
3
2
4
1
0
2.00
1
1
1
1
0
0
4
3
33
31
1
0
0
0
0
0
0

Dis t r i c t : MIWARA
Uve-
Popul- stock Exist- Dist. to Piped Hand purps Service level
ation i n l t s i i B W/S W/3 in- sea- piped hand
1984 1984 W/S 1. 2. in oper. total suff. suff. aon. salty W/S puip
Ward code: 120302NAUMEU
IMEXUWA 2.029 28 6 5 1 0,7 0,5
-MAWILO
- NACHMfiE
NAM3OGOLI
- USOt t )
- KISIWA
NAIMBU
- KTTOPE
- SAN3WANQE
- MrfTTA PWANI
- PEMBA PWANI
- MKUNGU
- KABISELA
W3AO
Total ward
1.100
400
1.699
600
906
6.734
40
20
281
578
167
1.114
6 1
2 6 1
6 1
1
1
3 3
2,7 0
0
0
1,28 1,17
0
0
0
0
0
0
2
0
2
2
0
2
0
0
0
0
0
0
2
0
2
1
1
1
1
1
0
1
0
cc
Total
division 11.350 1.279
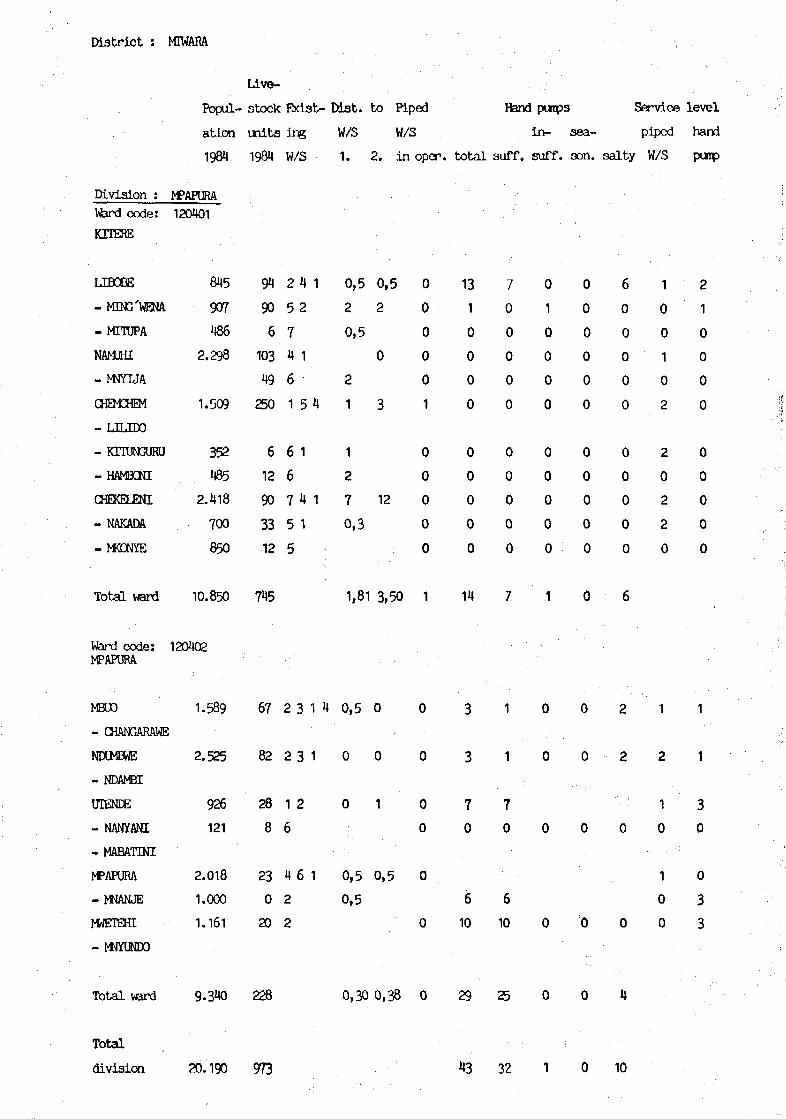
D i s t r i c t : MTWARA
Live-
Popul- stock Bds t - Wat. to Piped Ifend pumps Service level
ation i n i t s Ing W/S W/S i n - sea- piped hand
1984 1984 W/S 1. 2. i n oper. to ta l suff. suff. son. salty W/S pump
Divis ion :Ward code:
HTERE
LIBOBE
-MMG'WENA
-MITUPA
NAMJHI
- W Y I J A
CHEMCHEM
- LHJDO
- KTIUNGURU
- HAMBCNI
CHEKE1ENI
- NAKADA
-t t fONYE
Tota l ward
Ward code:MPAPURA
MPAPURA120401
845
907
486
2.298
1.509
352
485
2.418
700
850
10.850
120402
94
90
6
103
49
250
6
12
90
3312
745
2
5
74
6
1
6
6
7
5
5
4 1
2
1
5 4
1
4 1
1
0,5
2
0,5
2
1
1
2
7
0,3
1,81
0,5
2
0
3
12
3,50
0
0
0
0
0
1
0
0
0
0
0
1
13
1
0
0
0
0
0
0
0
0
0
14
7
0
0
0
0
0
0
0
0
0
0
7
0
1
0
0
0
0
0
0
0
0
0
1
0
0
0
0
0
0
0
0
0
0
0
0
6
0
0
0
0
0
0
0
0
0
0
6
1
0
0
1
0
2
2
0
2
2
0
2
1
0
0
0
0
0
0
0
0
0
MBUO 1.589 67 2 3 1 4 0 ,5 0 0 3 1 0 0 2 1 1
- CHANOARAWE
MXMBWE 2.525 8 2 2 3 1 0 0 0 3 1 0 0 2 2 1
- NDAMBI
UIENDE 926 28 1 2 0 1 0 7 7 1 3
- NANYANI 121 8 6 0 0 0 0 0 0 0 0
- MABAITNI
MPAPURA 2.018 23 4 6 1 0,5 0,5 0 1 0
- MNANJE 1.000 0 2 0,5 6 6 0 3
WETEHI 1.161 20 2 0 10 10 0 0 0 0 3
- MTCUNDO
Total ward 9.340 228 0,30 0,38 0 29 25 0 0 4
Total
division 20.190 973 43 32 1 0 10
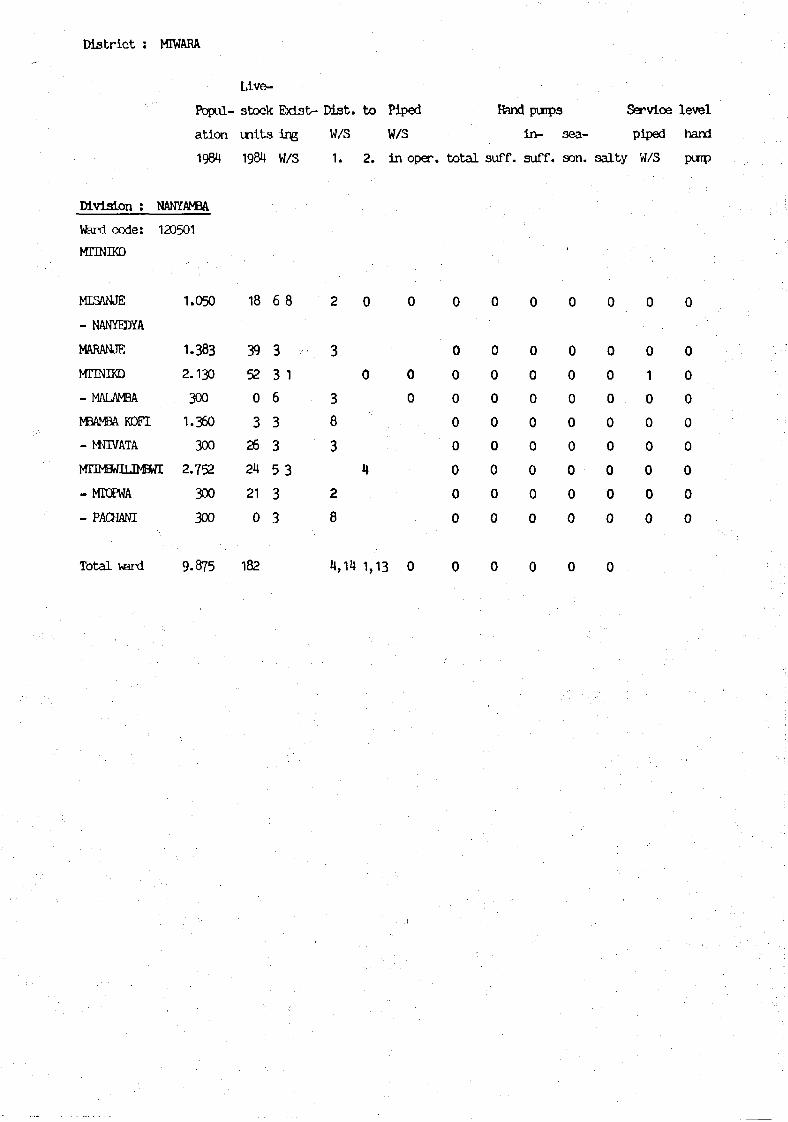
Dis t r i c t : MIWARA
Live-
Popul- stock Exist- Dist . to Piped Hand poips Sa*vioe level
ation uni ts ing W/S W/S in - sea- piped hand
1984 1984 W/S 1. 2. in oper. t o t a l suff. suff. son. sa l ty W/S purp
Division : NANYAMBA
Vferd code: 120501
MTINIKQ
MTSANJE
- NANYEDYA
MARANJE
MTO1IKD
- MALAMBA
1ŒAMBA KOFI
- WIVATA
MTIMBWI1JMEWI
-MTOPWA
- PACHANI
T o t a l ward
1 .050
1.383
2.130
300
1.360
300
2.752
300
300
9.875
18
39
52
0
326
24
21
0
182
68
3
3 1
6
3
3
5 3
33
2
3
3
8
3
2
8
4,
0
0
U
14 1,13
0
0
0
0
0
0
0
0
0
0
0
0
0
0
0
0
0
0
0
0
0
0
0
0
0
0
0
0
0
0
0
0
0
0
0
0
0
0
0
0
0
0
0
0
0
0
0
0
0
0
0
0
0
0
0
0
1
0
0
0
0
0
0
0
0
0
0
0
0
0
0
0
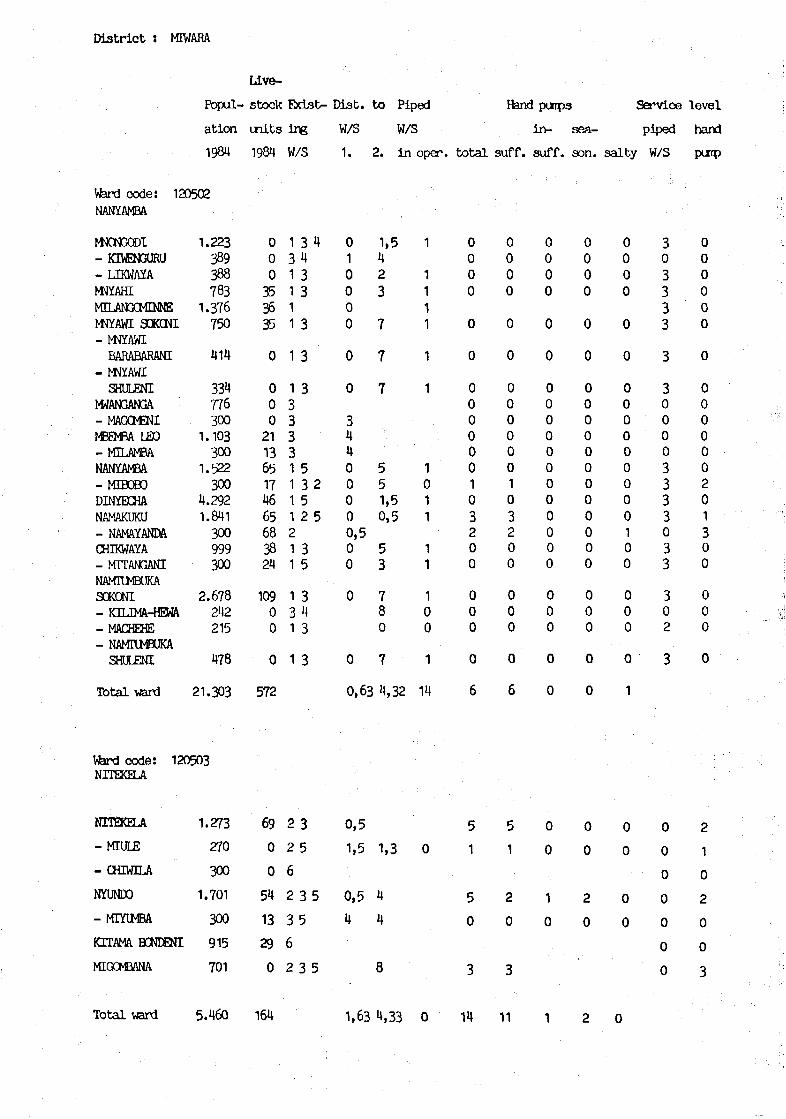
District : MTWARA
Live-
Fopul- stock Ebdst- Dist. to Piped Hand punps Sa*viœ level
ation units ing W/S W/3 in- sea- piped hand
1984 1984 W/S 1. 2. in oper. total suff. suff. son. salty W/3 punp
Vferd code: 120502NANYAMBA
WCNGODI- FŒWEMJURU
- LIKWAYAW Ï A H IKELANGCMMEMJYAWI SOKCNI- MTCAWI
BARABARANI- MIYAWI
SHULENIWANGANGA- MAGOtNINBEMBA LEO-MILAMBANANYANBA- MIBOBODINYECHANAMAKUKU- NAMAYANMCHIKWAYA- MTTANGANINAMRWBUKASCKONI- KILIMA-HEHA- MACHEHE- NAMTUMBUKA
SHULENI
Total ward
1.223389388783
1.376750
414
334776300
1.103300
1.522300
4.2921.841
300999300
2.678242215
478
21.303
000
353635
0
000
211365174665683824
10900
0
572
131111
1
133331111211
131
1
3H433
3
3
3
53 252 5
35
343
3
010000
0
0
34400000,500
0
0
0,63
1,5423
7
7
7
551,50,5
53
780
7
4,32
1
1111
1
1
1011
11
100
1
14
0000
0
0
000000103200
000
0
6
0000
0
0
000000103200
000
0
6
0000
0
0
000000000000
000
0
0
0000
0
0
000000000000
000
0
0
0000
0
0
000000000100
000
0
1
303333
3
300003333033
302
3
000000
0
000000201300
000
0
Ward code: 120503NKEKELA
NITEKÈLA
- MTULE
- CHIWILA
NYUNDO
- MTYUMBA
KTTAMAKNDENI
MIGCMBANA
Total ward
1.273
270
300
1.701
300
915
701
69 2 3
0 2 5
0 6
54 2 35
13 3 5
29 6
0 2 3 5
0,5
1,5 1,3
0,5 4
4 4
5.460 164 1,63 4,33 0
5
1
5
0
3
14
5
1
2
0
0
0
1
0
0
0
2
0
0
0
0
0
0
0
0
0
0
0
0
2
1
0
2
0
0
3
11

D i s t r i c t î MIWARA
U v e -
Popul- stock Exis t - Dis t . t o Piped ffend puips Service l eve l
a t lon u i i t s ing W/S W/S i n - sea- piped hand
1984 1984 W/S 1. 2 . i n oper. t o t a l suff. suff. son. s a l t y W/3 poip
Vfard oode:NJEN3WA
CHIWINDI
NARUNGA
NJEtEWA
- MAJENGO
NANGAWAN3A
- MALCNGO
HBUU
120504
840
861
1.521
550
498
402
1.600
- MTULI HJEN3WA 211
0
32
47
0
0
0
14
0
6
32
2
3
2
2
2
332
3
35
31
1
1,5
0,5
0,5
0,5
1
0,5
2,5
1
1
0
4
5
2
1
2
2
0
1
5
2
1
2
2
0
0
0
0
0
0
0
0
3
0
0
0
0
0
0
0
0
0
0
0
0
0
0
0
0
0
0
0
0
0
0
2
3
32
1
3
Total ward 6.483 93 1,14 1,20 0 16 13
Total
division 43-131 847 36 30
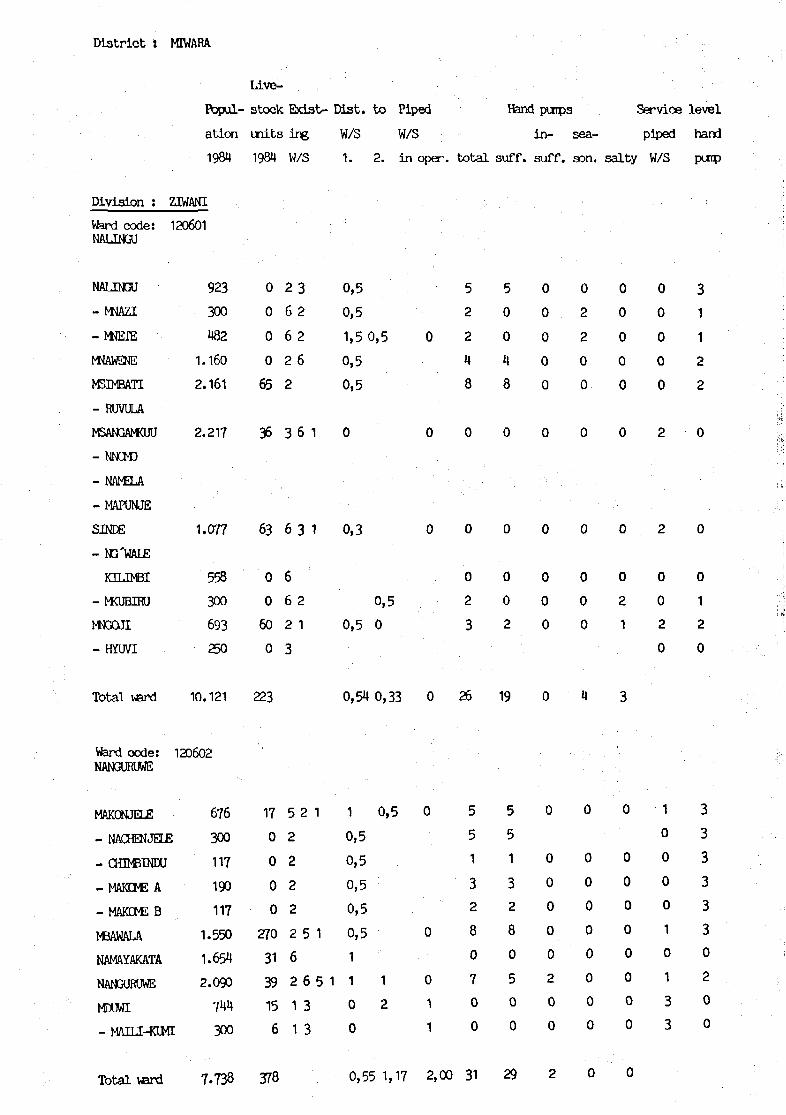
District ! MIWARA
Ldve-
ïtapul- stock Exist- Dist. to Piped Hand puips Service level
ation init3 ing W/3 W/S in- sea- piped hand
1984 1984 W/3 1. 2. in oper. total suff. suff. son. salty W/S puip
Division : ZIWANI
Ward c o d e : 120601NALENGU
NALINCU
- MNAZI
- NNEIE
NNAWENE
M3IMBATI
- RUVULA
MSANGAMCUU
- N N O D
- NAMELA
- M A P U N J E
SM)E
- IG'WALE
K7T.TMBT
-MEOJBIRU
NNGOJI
- HYUVI
Total ward
923
300
482
1.160
2.161
2.217
1.077
558
300
693
250
10.121
Vfard c o d e : 120602NANGURUWE
MAKONJELE
- NACHENJELE
- CfflMBINDU
-MAHOME A
- MAKCtE B
MBAWALA
NAMAYAKATA
NANGURUWE
MDUWI
- MAILT-KUMT
Total ward
676
300
117
190
117
1.550
1.654
2.090
744
300
7.738
0
0
0
0
65
36
63
0
0
60
0
223
17
0
0
0
0
270
31
39
15
6
378
2 3
6 2
6 2
2 6
2
36 1
63 1
6
6 2
2 1
3
5 2 1
2
2
2
2
2 5 1
6
2 6 5 1
1 3
1 3
0,5
0,5
1,5 0,5
0,5
0,5
0
0,3
0,5
0,5 0
0,54 0,33
1 0,5
0,5
0,5
0,5
0,5
0,5
1
1 1
0 2
0
0,55 1,17
0
0
0
0
0
0
0
1
1
2,00
5
2
2
4
8
0
0
0
2
3
26
5
5
1
32
8
0
7
0
0
31
5
0
0
4
8
0
0
0
0
2
19
5
5
1
32
8
0
5
0
0
29
0
0
0
0
0
0
0
0
0
0
0
0
0
0
0
0
0
2
0
0
2
0
2
2
0
0
0
0
0
0
0
4
0
0
0
0
0
0
0
0
0
0
0
0
0
0
0
0
0
0
2
1
3
0
0
0
0
0
0
0
0
0
0
0
0
0
0
0
2
2
0
0
2
0
1
0
0
0
0
1
0
1
33
31
1
2
2
0
0
0
1
2
0
• ' • • • •
33
3
33
30
2
0
0

District : MIWARA
Live-
Popul- stock Bdst- Mat. to Piped Hand purps Service level
ation wits ing W/S W/S in- sea- piped hand
1984 1984 W/S 1. 2. in oper. total suff. suff. son. salty W/S
Ward code: 120603ZIWANI
ZIWANI 2.470 30 2 1 5 0,5 0 1 10 10 0 0
- NAMBELEIECELA
- MSAKALA
WYEMBE
-NCMA
- DING'WIDA
-MIHURU
LITEMBE
- LITEMBE
PACHANI
-MITAMB0
PATAKUWA
MADIMBA
- M U E P A
MIENDACHI
- NAMINDCNDI
1.320
500
300
300
1.774
1.565
1.120
300
58
0
0
0
47
27
10
0
2
2
2
2
2
2 1
1 2
2 1
0,5
0,5
0,5
0,5
0,5
0,5 0 0
0 0,5 0
0,5
16
7
36
4
6
2
1
14
7
36
4
6
2
1
Total ward 9.649 173 0,44 0,17 1 55 53 2
Total
division
Total
district
27.508
142.105
774
4798
0 0
112 101
261 229 6 28 15
0
0
0
0
0
333
32
2 1
2 2

13 NEW ALA DISTRICT
Divisions Wards
01
02
03
04
05
Newala
Chilangala
Kitangari
Litehu
Mahuta
Namikupa
0102030405060708
010203
0102030405
01020304
010203040506070809
: io
0102030405060708
LuchinguMakoteNanguruweMkunyaMcholiNamiyongaMnekachiChitekete
MnyambaChilangalaMkoma II
KitangariMalatuMchemaMtopwaChiwonga
LuagalaNgunjaMkwitiMkonjowano
MahutaMcholi IIMkundiMnyawaLukokodaNanhyangaMdimbaChingungweMakukweMkwedu
NamikupaTandahimbaKitamaMihambweMichenjeleMkorehaNaputaMaundo
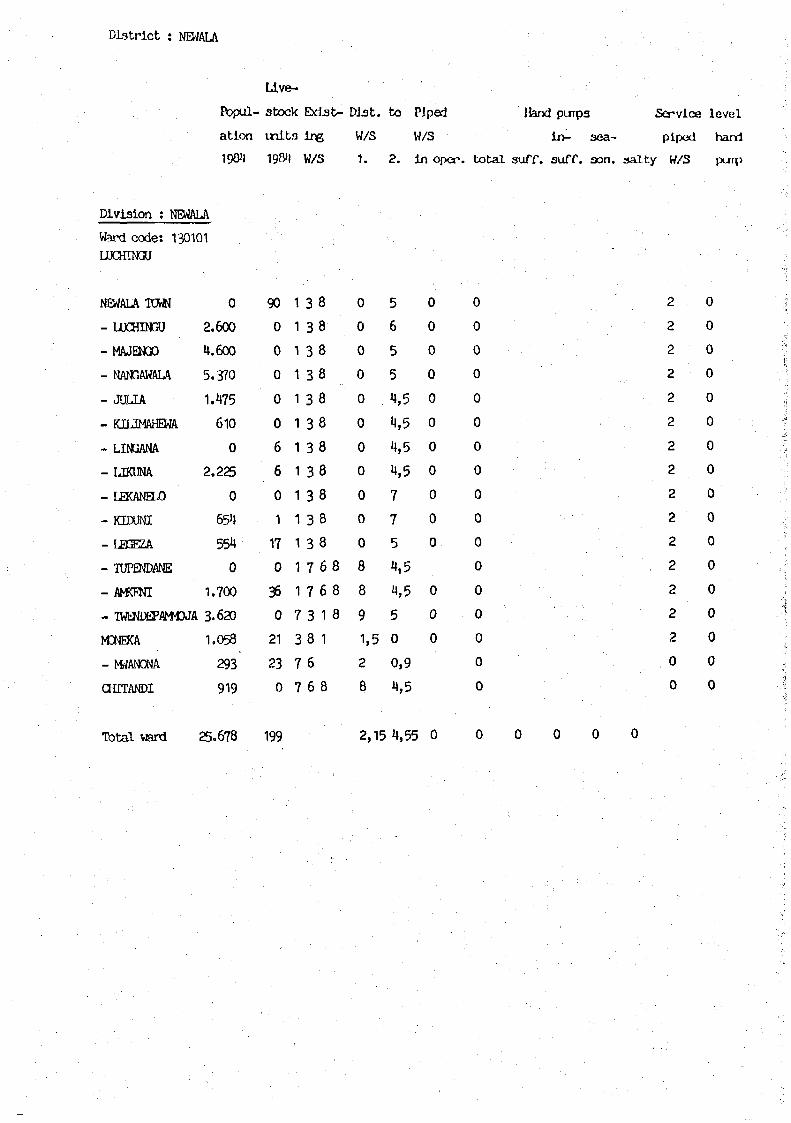
District : NEWALA
Llve-
Popul- stock Exist- DIat. to Piped Hand pinpa Service level
ation tnita i re W/S W/3 IJV- sea- piped hard
1901» 198'! W/S 1. 2. in oper. total suff. suff. son. salty W/S putp
Division : NEWALA
Ward code: 130101UXHINGU
NEWALA TCWN
- LUCHOGU
-MAJENGO
- NANGAWALA
- JULIA
- KHJMAHEWA
- LINGANA
- LJKUNA
- LEKANELO
- KIDUNI
- LEGEZA
- TUPENDANE
- ArfCENI
0
2.600
4.600
5.370
1.475
610
0
2.225
0
654
554
0
1.700
- TWENDEPANtOJA 3 . 6 2 0
MDNEKA
- NWANONA
CHTTANDI
Total ward
1.058
293
919
25.678
90
0
0
0
0
0
6
6
0
1
17
0
36
0
21
23
0
199
1
1
1
1
1
1
1
1
1
1
1
1
1
7
3
7
7
3
3
3
3
3
3
3
3
3
3
3
7
7
3
8
6
6
8
8
8
8
8
8
8
8
8
8
8
6 8
6 8
1 8
1
8
0
0
0
0
0
0
0
0
0
0
0
8
8
9
1,
2
8
2,
5
6
5
5
.1,5
4,5
4,5
4,5
7
7
5
4,5
4,5
5
5 0
0,9
4,5
15 4,55
0
0
0
0
0
0
0
0
0
0
0
0
0
0
0
0
0
0
0
0
0
0
0
0
0
0
0
0
0
0
0
0
0
2
2
2
2
2
2
2
2
2
2
2
2
2
2
2
0
0
0
0
0
0
0
0
0
0
0
0
0
0
0
0
0
0
0
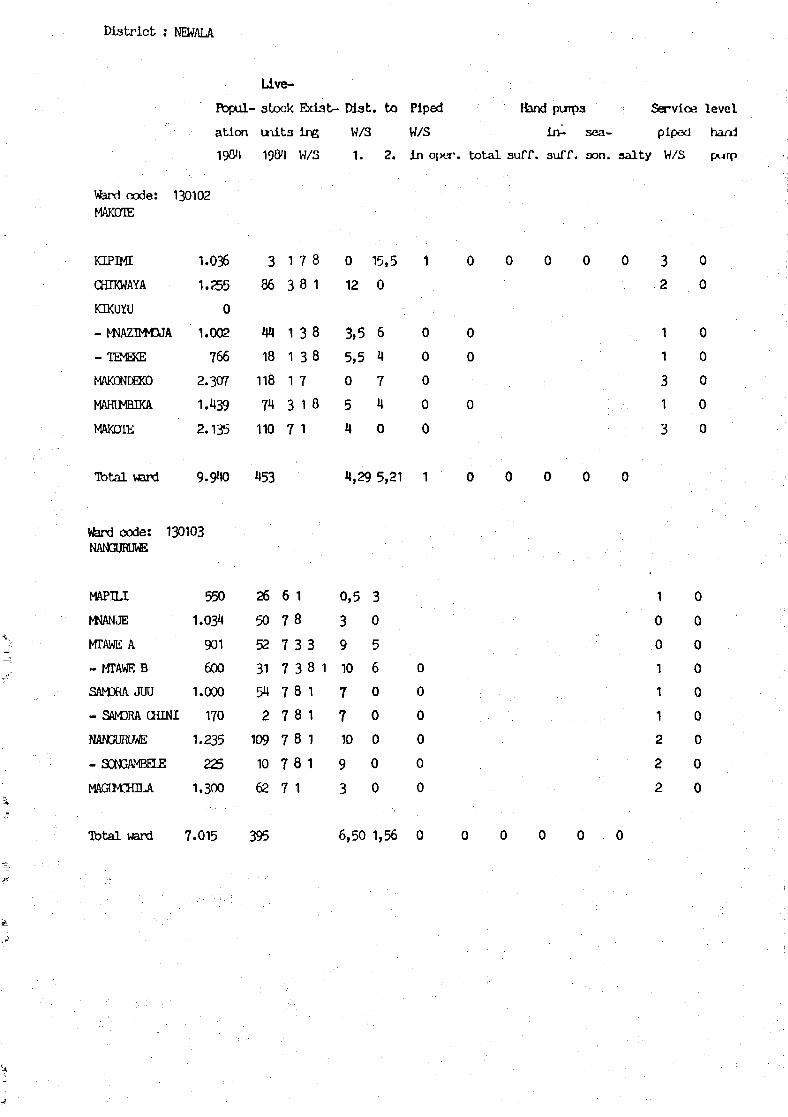
Dis t r i c t : NEHAL/V
Llve-
Ibpul- stock Ebdab- M a t . to Piped Hand purpa Servloe leve l
at ion un i t s ing W/3 W/5 In- sea- piped havri
19Qi| igfVl W/3 1. 2. in oper. t o t a l suff. auff. son. s a l t y W/S
Vfard code: 130102MAKOIE
KIPM
CHIKWAYA
KUflJYU
- WAZIM0JA
MAKQNDEXO
MAHUMBIKA
MAKOTE
1.036
1.255
0
1.002
766
2.307
1.439
2.135
3 17 8 0 15,5
86 3 8 1 12 0
i|4 1 3 8
18 1 3 8
118 1 7
74 3 1 8
110 7 1
3,5 6
5,5 4
0 7
5 4
4 0
0
0
0
0
0
0 0
0
0
0 0 32
1
1
3
1
3
0
0
0
0
0
0
0
Tbtal ward 9.940 453 4,29 5,21 1 0 0 0 0
Vfard c o d e : 130103NANGURUWE
MAPHJ 550
MMNJE 1.034
MTAWE A 901
-MTAWEB 600
SAMDRA JUU 1.000
- SAMDRA au ra 170
NANGURUWE 1.235
- SONGAMBELE 225
MAOWCHILA 1.300
26 6 1
50 78
52 7 3 3
31 7 3 8
54 7 8 1
2 7 8 1
109 7 8 1
10 7 8 1
62 7 1
0,5 3
3
9
10
7
710
9
3
0
5
6
0
0
0
0
0
0
0
0
0
0
0
1
0
0
1
1
1
2
2
2
0
0
0
0
0
0
0
0
0
Total ward 7.015 395 6,50 1,56 0
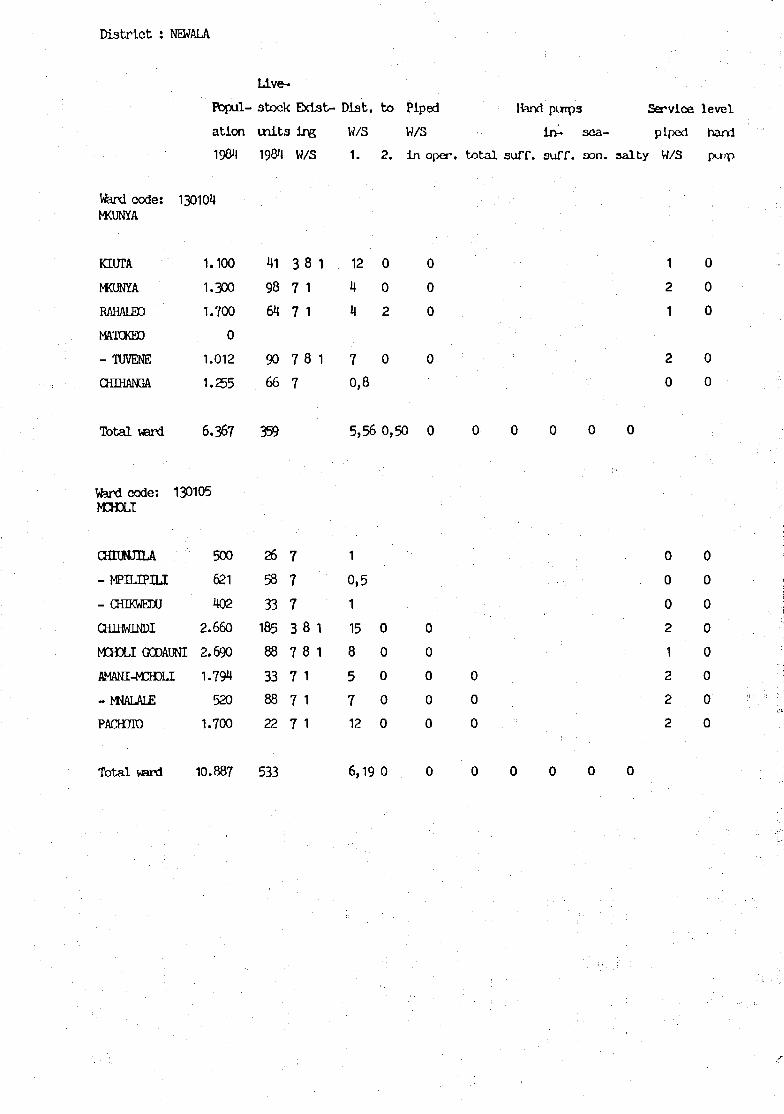
District : NEWALA
Uve-
Popul- stock Exist- Mat. to Piped Hand purps Service level
ation units ing W/S W/3 In- sea- piped hard
$ 19&I W/S 1. 2. in oper. total suff. suff. oon. salty W/S
Ward code: 1MOJNYA
KTUTA
MCUNYA
RAHALBO
MATOKED
- TUVENE
CHIHANGA
Ttotal ward
30104
1.100
1.300
1.700
0
1.012
1.255
6.367
Vfard code: 130105M3DL2
CHTUNJILA
- MPILIPILI
- OÏÏKWEIXJ
CKfflHDffil
500
621
402
2.660
M3OLI GODAUNI 2.690
AMANI-MCHXI
- MiALALE
PAOCTO
1.794
520
1.700
41
98
64
90
66
359
26
58
33
185
88
33
88
22
3
7
7
7
7
7
7
7
3
7
7
7
7
8
1
1
8
8
8
1
1
1
1
1
1
1
12
4
4
7
0,8
5,56
1
0,5
1
15
8
5
7
12
0
0
2
0
0,50
0
0
0
0
0
0
0
0
0
0
0
0
0
0
0
c
0
0
0
1
2
1
2
0
0
0
0
0
0
0
0
0
2
1
2
2
2
0
0
0
0
0
0
0
0
Total ward 10.887 533 6,19 0

: NEWALA
Uve-
flopul- stock B d s t - Dist . to Piped Hand puips Service level
ation i n i t a i i ^ W/3 W/S ixi- sea- piped harrf
19&I W/S 1. 2. In oper. t o t a l staff, suff. oon. sa l ty W/3
Ward code :NAMIYONGA
MANOMBA
- LGNDO
NAMTYONGA
NAKACHELA
130106
1.000
1.737
1.500
MAGCM80 SHULENI 1.512
- MAGONBO
BARABANI
T o t a l ward
Ward code :MŒXACHI
WAKWEMBE
- NAMHJNGA
-MtoMBE
- CHIWAMBO
NANYONDA
- NANYUWILA
IOLIDU
MCCMA I
MTANGALANGA
MAKONGA
JUHUDI
T o t a l ward
870
7.118
130107
0
1.212
267
1.000
933
158
945
2.541
1.117
1.968
3.162
13.303
105
116
54
78
57
104
514
60
0
0
0
0
0
204
38
49
39
390
3
3
3
3
3
3
7
6
7
2
2
2
7
7
1
7
8
8
1
8
8
8
8
8
8
8
8
8
8
8
8
8
8
1
1
1
1
3
3
15
15
7
12
10
15
12,33
7,5
10,5
0
15,5
17,5
19,5
15
10
0,5
1 4
10,00
0
0
2
0
0
0
0,33
0
0
0
0
0
0
0
0
0
0
i 0
0
0
0
0
0
0
0
0
0
0
0
0
0
0
0
0
2
0
0
0
2
0
0
0
0
0
0
0
0
0
0
0
0
0
0
0
0
0
0
0
0
2
0
0
2
0
0
0
0
0
0
0
0
0
0
1
0
0
0
1
1
1
0
0
0
1
2
2
1
0
0
0
0
0
0
0
0
0
1
0
0
0
0
0
0
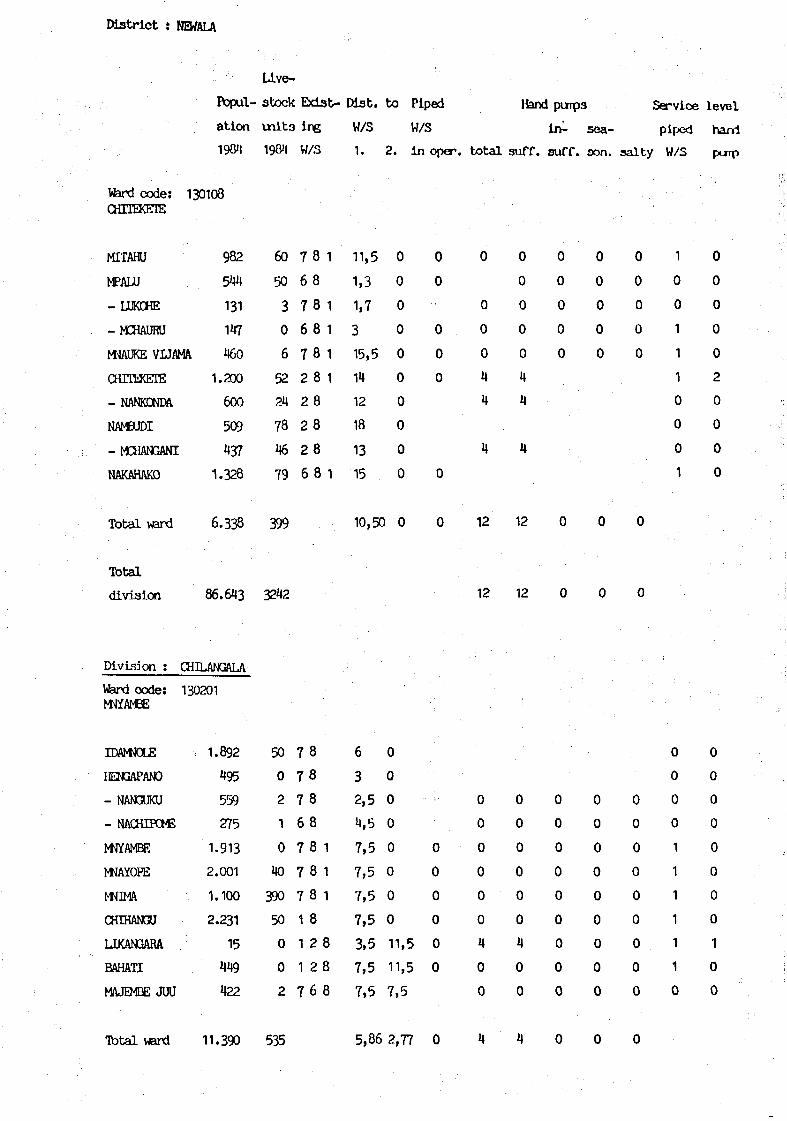
Dist r ic t : NEWALA
U v e -
l - stock EbdaU Dist. to Piped Hand puipa Servloe level
atlon units in& W/S W/S 1J>- sea- piped harri
1904 190"! W/S 1. 2. in oper. total 3uff. suff. oon. salty W/S
Divis ion : CHILANGALA
Vferd code: 130108CHi l tKBlK
MITAHU
MPALU
- UJKCHE
-hCHAURU
WAUKE VUAMA
CHTTEKETE
- NANRONnA
NAMBODI
- MCHANGANI
NAKAHAKD
T o t a l ward
T o t a l
division
982
544
131
147
450
1.200
600
509
U37
1.328
6.338
86.643
60
50
30
6
52
24
78
46
79
399
3242
76
76
72
2
2
2
6
8
8
8
8
8
8
8
8
88
1
1
1
1
1
1
11,5
1,3
1,7
315,5
14
12
18
13
15
10,50
0
0
0
0
0
0
0
0
0
0
0
0
0
0
0
0
0
0
0
0
0
0
4
4
4
12
12
0
0
0
0
0
4
4
4
12
12
0
0
0
0
0
0
0
0
0
0
0
0
0
0
0
0
0
0
0
0
0
1
0
0
1
1
1
0
0
0
1
0
0
0
0
0
2
0
0
0
0
Ward c o d e :MIYAMBE
IDAM«DLE
HENGAPANO
- NANGUKU
- NACHIBM:
MJYAMBE
MJAYOPE
MIMA
CHIHAN3U
LJXAN3ARA
BAHATI
MAJEMBE JUU
Total ward
130201
1.892
495
559
275
1.913
2.001
1.100
2.231
15
449
422
11.390
50
0
2
1
0
40
390
50
0
0
2
535
7
7
7
6
7
7
7
1
1
1
7
8
8
8
8
8
8
8
8
2
2
6
1
1
1
8
8
8
6
3
2,5
4,5
7,5
7,5
7,5
7,5
3,5
7,5
7,5
5,86
0
0
0
0
0
0
0
0
11,5
11,5
7,5
2,77
0
0
0
0
0
0
0
0
0
0
0
0
0
4
0
0
4
0
0
0
0
0
0
4
0
0
4
0
0
0
0
0
0
0
0
0
0
0
0
0
0
0
0
0
0
0
0
0
0
0
0
0
0
0
0
0
0
0
0
0
0
1
1
1
1
1
1
0
0
0
0
0
0
0
0
0
1
0
0

District : NEHAU
Live-
fbpul- stock Exist- Wat. to Piped Hand purp3 Service level
atlon mi t3 ir\g W/3 W/3 in- sea- piped hand
19011 19811 W/S 1. 2. in oper. total suff. auff. oan. salty W/S
Ward code:CHÏLANGALA
NANYAMBA
-MOJIXMBA
- NANDIMBA
- MWEMÎACHI
MTYUYU
CHILANGALA
SHULENI
- NAWANGA
mmiNAMAN3UDU
M M M B I
Total ward
130002
100
493
717
191
547
1.018
406
2.402
490
1.600
7.964
0
1
32
4
20
370
2
22
0
42
493
7 8
7 8
7 8
7 8
6 4
6 8
7 8
6 8
6 8
7 8
1
1
1
1
8 1
1
1
1
1
8
11,7
4,2
11,5
1,2
7,5
17,5
18,5
16,5
15,5
11,21
0
0
0
0
4,5
0
0
0
0
0
0,45
0
0
0
0
0
0
0
0
0
0
0
0
0
0
0
0
0
0
0
0
0
0
0
0
0
0
0
0
0
0
0
0
0
0
0
0
0
0
0
0
0
0
0
0
0
0
0
0
0
0
0
0
0
0
0
0
0
0
0
0
1
1
1
1
1
1
1
1
0
1
0
0
0
0
0
0
0
0
0
0
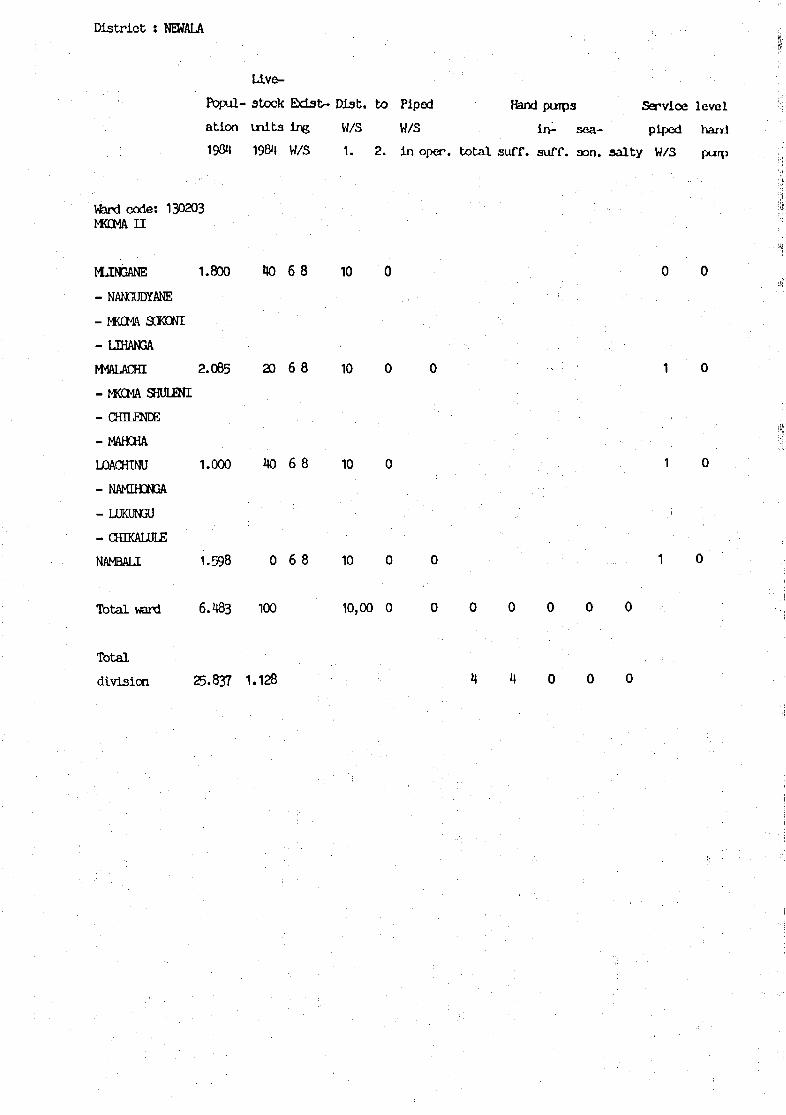
District : NEWALA
Llve-
Fopul- stock Exists Dlat. to Piped Hand puips Service level
ation unit3 Ing W/S W/S in- sea- piped hani
198M W/S 1. 2. in open, total suff. suff, son. salty W/S
Ward code: 130203mm. ii
MJNSANE 1.800 10 6 8 10 0 0 0
- NAN3JDYANE ,
- MKCMA SOOONI
- LfflANGA
hWALACHI 2.085 20 6 8 10 0 0 1 0
- MÎCMA SHULENI
- CfflLENDB
- MAHCHA
LOACHINU 1.000 M0 6 8 10 0 1 0
- NAMIH3NGA
- LUKUN5U '
- CHDCALOLE
NAMBALI 1.598 0 6 8 10 0 0 1 0
Total ward 6.483 100 10,00 0 0 0 0 0 0 0
Total
division 25.837 1.128 4 4 0 0 0

Dis t r i c t : NEWALA
Uve-
Pbpul- stock Exist- ttbt. to Piped Hand purpa Servloe level
ation uiita ing W/S W/S in -̂ sea- piped hand
1984 W/5 1. 2. in oper. total suff. 3uff. son. salty W/3
Division ; KTTANGARI
Ward code:
KTIANGARI
W 3 V 0
NANDA
MKWANGA
- MITANGA
- UKWAYA
MANDALA
- MTTEMA
- NANKGNDA
-MIQPOLA
MAPOTI
NIANDJA
- M I N 3 A L I E
KTTANGARI
(MAJENGO)
MTCtCWELE
MNAUYA
KADEM3WA
Total ward
130301
800
923
0
MOO
299
1.151
1.500
700
337
1.787
1.400
713
552
10.562
110
140
22
17
134
135
73
0
120
120
60
60
991
1
1
3
31
1
1
1
1
1
6
1
6
8
8
8
8
36
6
2
6
8
8
8
8
0
0
7
7
1
0
2,5
2,5
0
0
2
0
1,83
3
0
0
0
0
1
5
6
0
1
1,60
1
1
1
1
1
1
1
1
1
9
3 0
3 0
0 0
0 0
2 0
3 0
2 0
2 0
3 2
3 0
0 0
3 0
Ward code: 130302MALATU
MOJNJO 0
- MALATU 3WLENI 761
- DODCMA
- MTANDA
MALATU
MOLELACHINI
- W0LELA JUU
To ta l ward
520
476
1.500
1.209
216
4.682
60
60
0
0
60
60
0
240
2
2
2
2
2
3
3
3
8
8
8
1,
1,
2,
0,
0,
1,
2
2
5
5
5
18
1,2
1,2
2,5
1,63
0
0
0
0
0
0
0
5
6
11
0
0
0
5
6
11
0
0
0
0
0
0
0
0
0
0
0
0
0
0
0
0
0
0
0
1
1
0
3
3
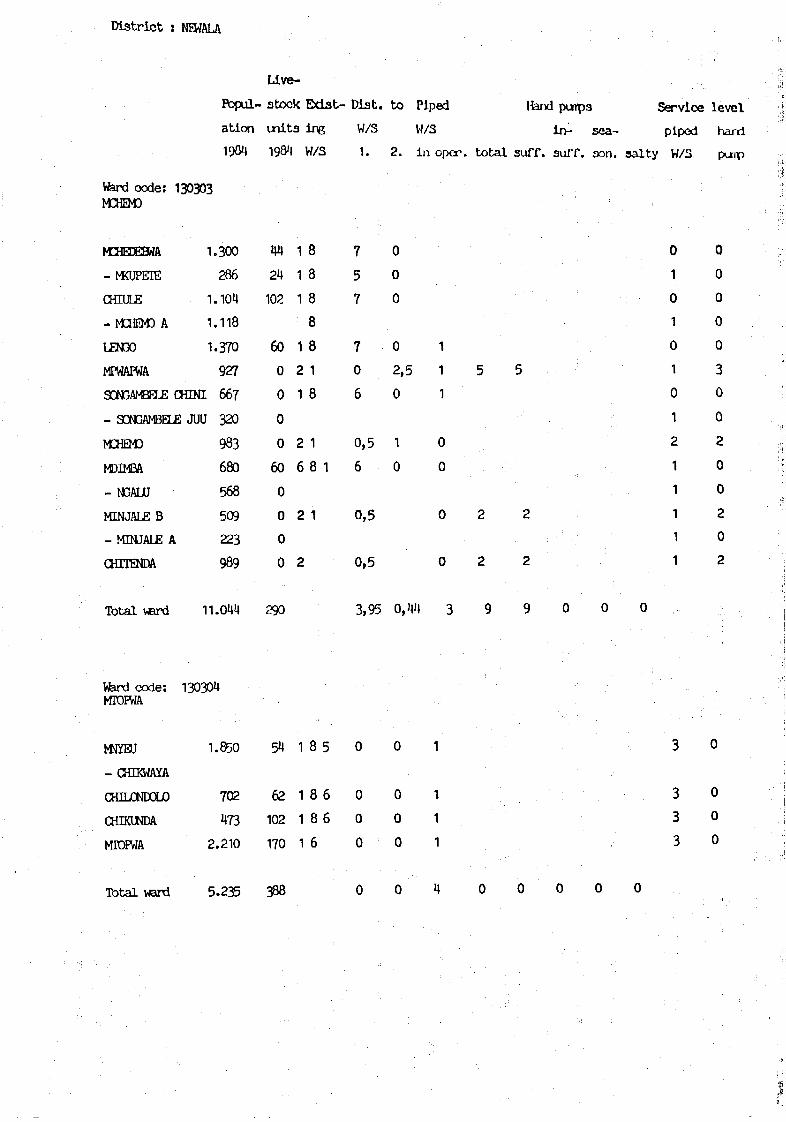
Distr ict : NEWALA
Live-
Popul- stock B d a t - Diat. to Piped ifand putpa Servloe level
ation m i t a ing W/S W/5 in- sea- piped harri
198"! W/S 1. 2. in oper. to ta l suff. suff. son. sa l ty W/S
Ward code:M3ŒMD
M3ŒBEBWA
- MOJPEIE
CHIULE
- M 3 ΠM D A
LEN30
MPWAPWA
SONGAMBELE
130303
1.300
286
1.104
1.118
1.370
927
CHINI 667
- SONGAMBELE JUU 3 2 0
M3HEMD
MDIMBA
- NGA1JU
MINJALE B
- MDUALE J
CHITENDA
Total ward
983
680
568
509
\ 223
989
11.044
m24
102
60
0
0
0
0
60
0
0
0
0
290
1
1
1
1
2
1
2
6
2
2
8
8
8
8
8
1
8
1
8 1
1
7
5
7
7
0
6
0,5
6
0,5
0,5
3,95
0
0
0
0
2,5
0
1
0
0,44
1
1
1
0
0
0
0
Ward c o d e :MTOFWA
WYEU
- CfflKHAÏA
CHEJONDOLO
CHBCUNDA
MKDPWA
Tbtal ward
130304
1.
2.
5.
850
702
473
210
235
54
62
102
170
388
1
1
1
1
8
8
8
6
5
6
6
0
0
0
0
0
0
0
0
0
0
1
1
1
1
1
0
1
0
1
0
1
0
1
2
1
1
1
1
1
0
0
0
0
0
30
0
2
0
0
2
0
2
3 0
3 0
3 0

District ; NEHALA
Live-
Popul- stock Ebdat- Diat. to Piped Hand purpa Service level
ation tnita ing W/S W/S irv- sea- piped hanl
19&\ W/S 1. 2. in oper. total suff. suff. aon. salty W/3
Ward o o d e :CHIHONGA
MZIMXKA
- CHIKUNDA
- MPILANI
- VIHDKDLI
NANDWAHI
CHIWDNGA
- PACHANNE
- C H M N D I
/ ^ T T V T PI' f
WULUNGA
- ZIARANI
M2AUENDO
- MBEMBERE
- cHiPrro
Total ward
Ttotal
division
130305
300
UEEBO 359
347411
1.467
698
739
430
548
776
577
1.036
334
333
8.342
39.865
20
22
27
20
190
132
22
1
17
70
33
26
70
40
689
2.598
1
1
1
1
1
6
6
6
6
1
1
1
1
1
7
6
6
6
8
8
8
8
8
6
8
6
6 8
8
8
8
6
8
6
0
0
0
0
0
11
11
11
10
9
9
0
0,5
2
10
12
12
15
0
0
0
0
0
0
0
9
4,83
1
1
1
1
1
0
1
1
1
0
1
9
33
33
31
0
0
0
1
1
31
2
0
0
0
0
0
0
0
0
0
0
0
0
0
0
27 27
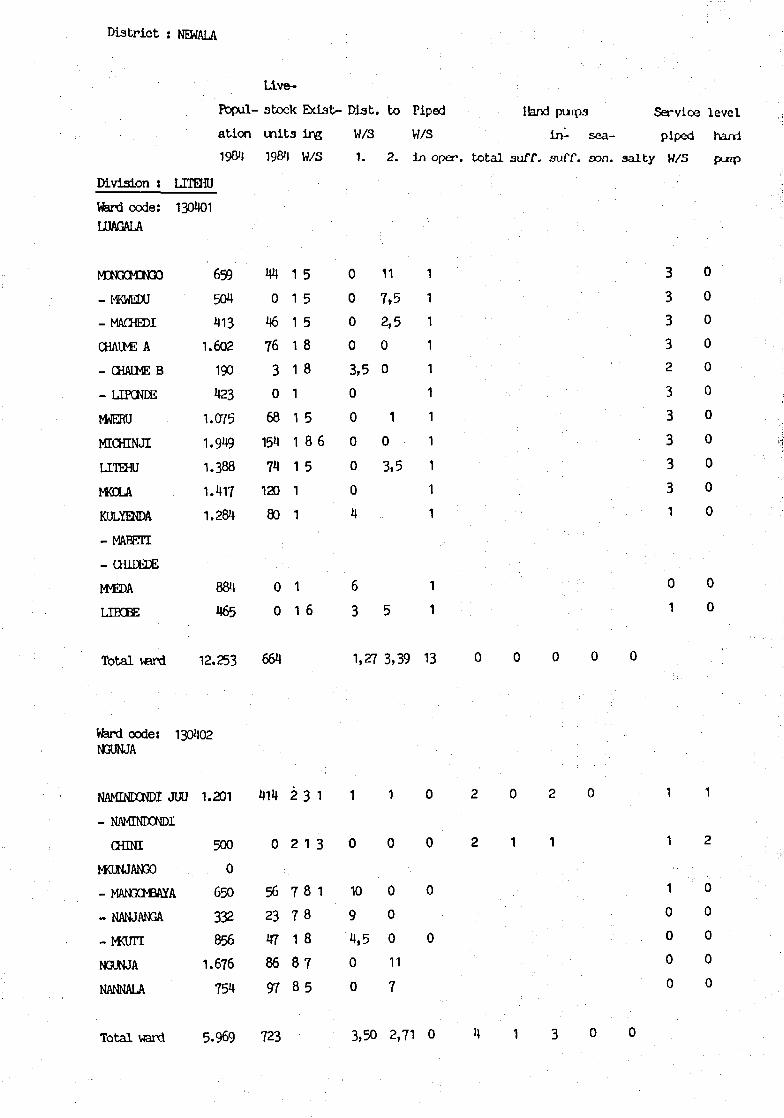
Dis t r i c t : NEWALA
Live-
Popul- stock Exista Dist . to Piped Hand purpa Service level
at ion m i t a ing W/S W/S In - sea- piped ha/vl
I W 19G"I W/S 1. 2. in oper. t o t a l suff. suff. son. s a l t y W/S
Division : LITEHU
Vfard code:
LUAGALA
KNGCKNOO
- MKWEDU
- MACHEDI
CHAINE A
- CHAUME B
- LIPCNDE
MrtERU
MICHINJI
LITEHU
MKDLA
KULYENDA
- MABETI
- OÏÏEGDE
MNEDA
LJBCBE
Total ward
130401
1.
1.
1.
1.
1.
1.
659504
413
602
190
423
075
949,388
,417,284
884
465
12.253
44
0
46
76
30
68
154
74
120
80
0
0
664
1
1
1
1
1
1
1
1
1
1
1
1
1
55
5
8
8
586
5
6
0
0
0
0
3,50
0
0
0
0
4
6
3
1,27
11
7,5
2,5
0
0
1
0
3,5
5
3,39
1
1
1
1
1
1
1
1
1
1
1
1
1
13
Ward c o d e : 130402NGUNJA
NAMTNDCNDI JUU 1 .
- NAMTNDONDI
CHDŒ
MOJNJANGO
- MANGCMBAYA
- NANJANGA
- M O J T I
NGUNJA 1 .
NANNALA
201
500
0
650
332
856
676
754
Total ward 5.969
414
0
56
23
4786
97
723
•CM
2
7
71
88
3
1
88
8
75
1
3
1
1
0
10
9
4,5
0
0
3,50
1
0
0
0
0
11
7
2,71
0
0
0
0
0
3
3
3
3
2
3
3
3
3
3
1
0
0
0
0
0
0
0
0
0
0
0
0 0
1 0
1 0
0 0
0 0
0 0
0 0

District : NEWALA
Llve-
Fbpul- stock Exist- Diat. to Piped Hand purpa Servloe level
ation units ing W/S W/3 in- sea- piped harri
19Qi| 19&I W/S 1. 2. in oper. total suff. auff. son. salty W/3
Ward c o d e :MKWTIT
UXOLCMBE
CHCNI
- KHXX)
- LIKDLCMBE
MKWITI A
-M<wrnB
Total ward
130403
1.891
340
JUU 225
1.180
508
4.144
364
16
0
112
70
562
6
6
6
4
4
8
8
0,4
0,5
1
7,5 0
8 0
3,48 0
0
0
0
0
0
0
0
0
0
0
Ward c o d e :
MKCNJOWANO
MCONJOWANO
- ULODA LED
- NAMBUTUKA
NACHUNYU
MOJLA
- M K U Ï U
OUMIIfl)
- CUIrfJNM
IM,V«:VH
- MAUQHA
MEVANSA
- WAIDA
MŒMBBWDJA
LYENJE
T o t a l ward
Total
division
130404
485
424
263
728
420
388
751
214
1 , 1 *
293
565
126
791
748
7.322
29.688
14
16
34
147
53
43
62
23
153
49
16
6
21
26
679
2.628
1
1
1
1
1
1
1
1
l
1
1
6
1
1
58
8 6
8
5 8
6 8
6 8
8 5
5 3
0 '.
86
68
1
58
5
0
7
3
0
7
7
0
0
• ' )
7
0
2
0
0
2,36
7,5
0
0
7,5
15
12
0
1.5
t
0
3,5
4
0,5
0,5
3,71
1
1
1
1
1
1
1
1
i
1
1
1
1
1
14
3
0
2
3
0
0
3
3
J
0
3
2
3
3
0
0
0
0
0
0
0
0
0
0
0
0
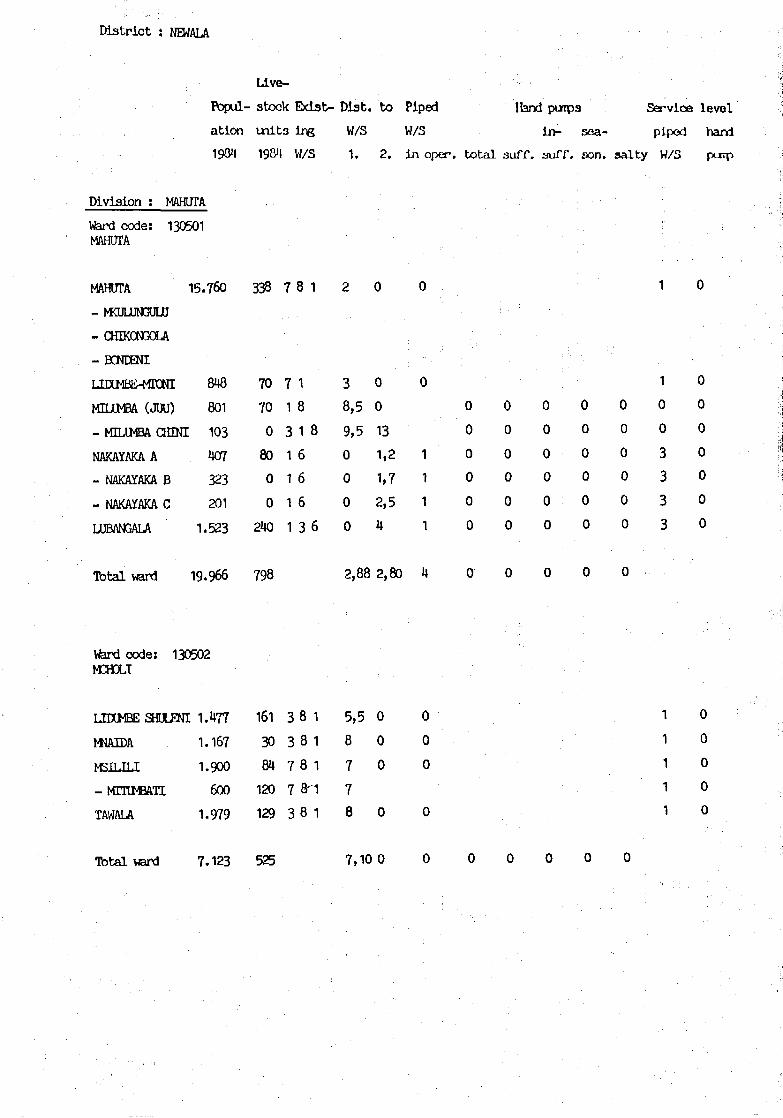
D i s t r i c t : NEWALA
LJLve-
Fopul- stock Esdst- Wat. to Piped Hand pumps Sa-vlce level
ation units ing W/S W/5 in- sea- piped hand
190*1 19^1 W/S 1. 2. in oper. total suff. suff. aon. sa l ty W/5 puip
Division : MAHUTA
Ward code: 130501MAHUTA
MAHJTA 1 5 .
- hKULUNGULO
- CHIKONGOLA
- BCNEENI
LUXMBE-MTONI
MILCMBA (JUU)
- MILIMBACHINI
NAKAYAKA A
- NAKAYAKA B
- NAKAYAKA C
LUBANGALA 1.
Total ward 19.
760
848
801
103
407
323
201
.523
.966
338
70
70
0
80
0
0
2U0
798
7
7
1
3
1
1
1
1
8 1
1
8
1 8
6
6
6
36
2
3
8,5
9,5
0
0
0
0
2,88
0
0
0
13
1,2
1,7
2,5
4
2,80
0
0
1
1
1
1
4
0
0
0
0
0
0
0
0
0
0
0
0
0
0
0
0
0
0
0
0
0
0
0
0
0
0
0
0
0
0
0
0
0
0
0
1
1
0
0
3
3
3
3
0
0
0
0
0
0
0
0
Ward code:NCHXI
130502
LKWBE SHULENI 1.477
MMIDA
HSTT.T1.T
-MTTu>BAn
TAWALA
1.167
1.900
600
1.979
161
30
84
120
129
3
3
7
7
3
8 1
8 1
8 1
8-1
8 1
5,5
8
7
7
8
0
0
0
0
0
0
0
0
1
1
1
1
1
0
0
0
0
0
Tbtal ward 7.123 525 7,10 0
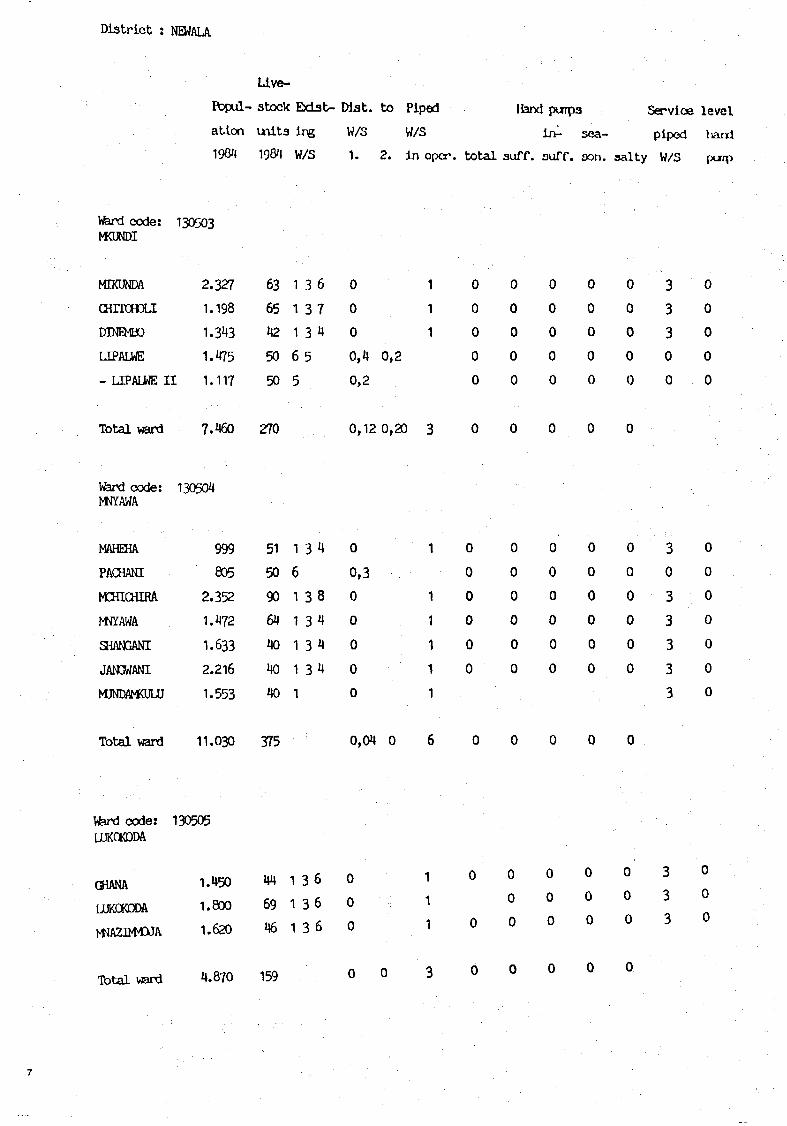
Dist r ic t : NEWALA
Uve-
Popul- stock Ebdat- Dist. to Piped Hand purpa Service level
ation inita ing W/S W/S 1J>- sea- piped hand
190*1 W/S 1. 2. in oper. total auff. suff. oon. salty W/3 ptnp
Ward code:
mmi
MIKUNDA
CHrrcHOLi
DINEMBO
LIPALHE
130503
2.327
1.198
1.343
1.475
- LIPAUWE I I 1.117
Total ward
Vferd code:WIYAWA
MAHEHA
PACHANI
MCHICHIRA
WYAWA
SHANGANI
JANGWANI
MJNDAMCULU
Total ward
7.460
130504
999
805
2.352
1.472
1.633
2.216
1.553
11.030
63
65
42
50
50
270
51
50
90
64
40
40
no
375
1
1
1
6
5
1
6
1
1
1
1
1
3
3
3
5
3
3
3
3
3
6
74
4
8
4
4
4
0
0
0
0,4 0,2
0,2
0,12 0,20
0
0,3
0
0
0
0
0
0,04 0
1
1
1
3
1
1
1
1
1
1
6
0
0
0
0
0
0
0
0
0
0
0
0
0
0
0
0
0
0
0
0
0
0
0
0
0
0
0
0
0
0
0
0
0
0
0
0
0
0
0
0
0
0
0
0
0
0
0
0
0
0
0
0
0
0
0
0
0
0
0
0
0
0
0
0
0
3
3
3
0
0
3
0
3
3
3
3
3
0
0
0
0
0
0
0
0
0
0
0
0
Vferd code:UK0KDDA
O1ANA
UKCKDDA
M^AZI>MDJA
Total ward
130505
1.
1.
1.
4.
450
800
620
,870
44
69
46
159
1
1
1
36
36
36
0
0
0
0 0
1
1
1
3
0
0
0
0
0
0
0
0
0
0
0
0
0
0
0
0
0
0
0
3
3
3
0
0
0
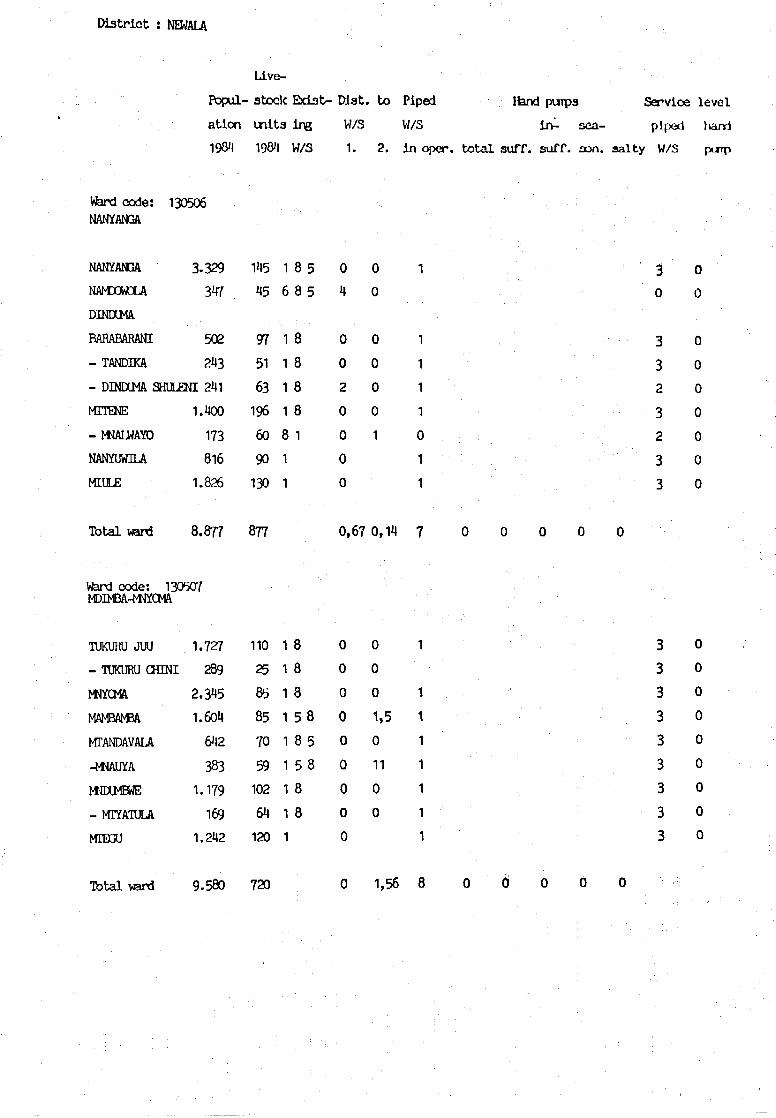
District : NEWALA
Live-
Popul- stock Exist- Diat. to Piped Hand purpa Service level
atlon inita ing W/S W/3 ii>- sea- piped harri
19011 W/S 1. 2. in oper. total suff. suff. son. salty W/S
Ward c o d e :NANYANGA
NANYAN3A
NAMDOWOLA
DINIXMA
BAHABARANI
- TANDKA
130506
3.329
347
502
243
- DMXMA SHULENI 241
MTTENE
- WtAUJAYO
NANYUWILA
MIULE
T o t a l ward
1.400
173
816
1.826
8.877
Ward code : 130507MDIMBA-WYCMA
TUKURU JUU 1.727
- TOKURU CHINI 289
WYCMA
MAMBANBA
MTANDAVALA
-MWUÏA
MflXMBWE
- MTÏATULA
MIH3U
Tbtal ward
2.345
1.604
642
383
1.179
169
1.242
9.580
145
45
97
51
63
196
60
90
130
877
110
25
85
85
70
59
102
64
120
720
1
6
1
1
1
1
8
1
1
1
1
1
1
1
1
1
1
1
8
8
8
8
8
8
1
8
8
8
5
8
5
8
8
5
5
8
5
8
0
4
0
0
2
0
0
0
0
0,67
0
0
0
0
0
0
0
0
0
0
0
0
0
0
0
0
1
0,14
0
0
0
1,5
0
11
0
0
1,56
1
1
1
1
1
0
1
1
7
1
1
1
1
1
1
1
1
8
3 0
0 0
3 0
3 0
2 0
3 0
2 0
3 0
3 0
3 0
3 0
3 0
3 0
3 0
3 0
3 0
3 0
3 0
0
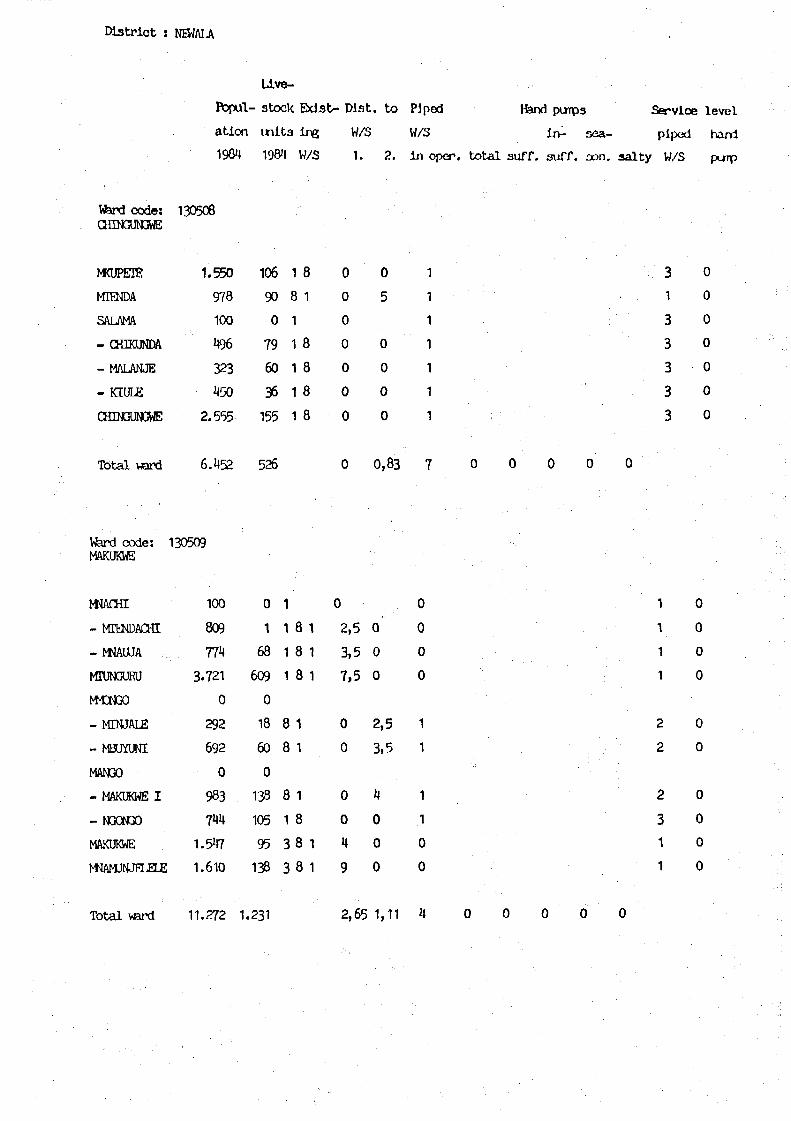
Dist r ic t : NEWALA
Llve-
l - stock Eidst- Dlst. to Piped Hand punrpa Service level
atlon uii ta ing W/S W/3 in- sea- piped hand
19CI 198M W/S 1. 2. in oper, total suff. suff. aon. salty W/S punp
Ward code : 130508
MCUPETS
MTENDA
SALAMA
- CHIKUNDA
- MALANJE
- KIULE
CHIN3UNGIWE
Total ward
1.550
978
100
496
323
450
2.555
6.452
106
90
0
7960
36
155
526
1
8
1
1
1
1
1
81
8
8
8
8
0
0
0
0
0
0
0
0
0
5
0
0
0
0
0,83
1
1
1
1
1
1
1
7
Ward code:MAKUKWE
W ACHI
- MTENDACHI
- MNAUJA
MTUNGURU
M £ N G 0
- MTNJALE
- MBUYUNI
MANGO
- MAKUKWE I
- NGOtCO
MAKUKWE
WAMJNJELELE
Total ward
130509
100
809
774
3.721
0
292
692
0
983
744
1.547
1.610
11.272
0
1
68
609
0
18
60
0
138
105
95
138
1.231
1
1
1
1
8
8
8
1
3
3
8
8
8
1
1
1
8
8
8
1
1
1
1
1
0
2,5
3,5
7,5
0
0
0
0
u9
2,65
0
0
0
2,5
3,5
4
0
0
0
I 1 , 1 1
0
0
0
0
1
1
1
1
0
0
4
31
3
3
3
3
3
0
0
0
0
0
0
0
1
1
1
1
2
2
2
31
1
0
0
0
0
0
0
0
0
0
0
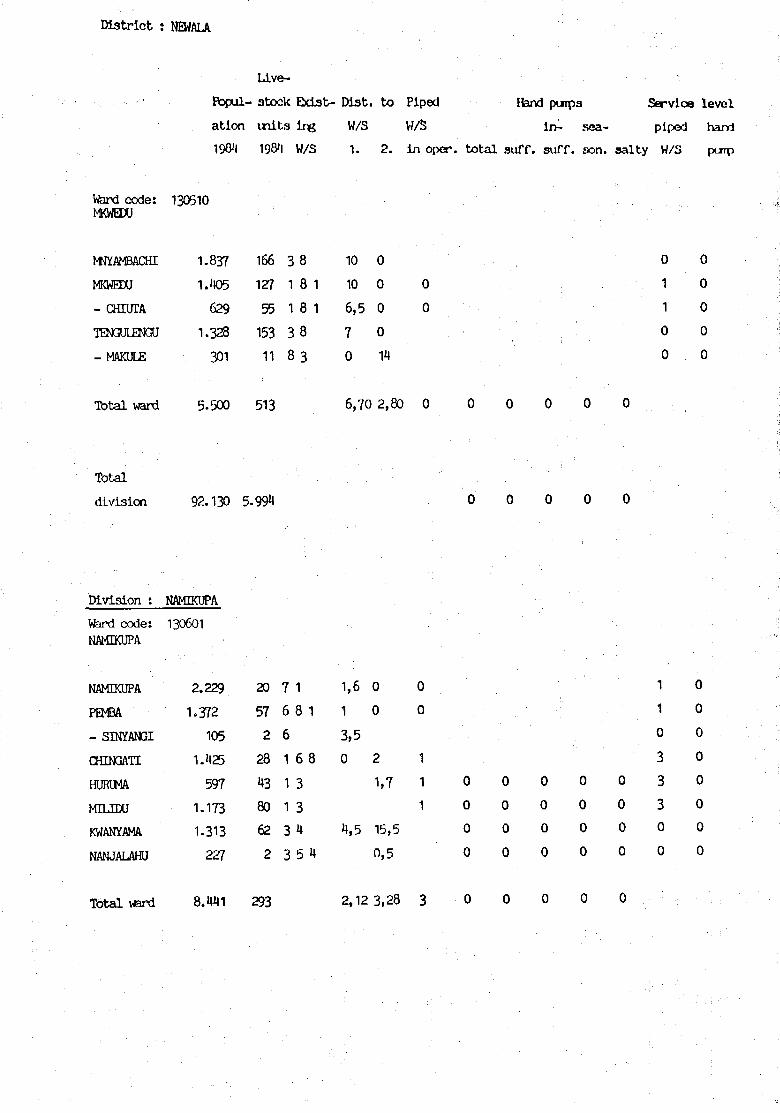
Dis t r i c t : NEWALA
Uve-
Fopul- stock Exis t - Dlat. to Piped Hand pijipa Service leve l
at lon m i t a ing W/S W/S i n - sea- piped harri
190*1 W/S 1. 2. ir> oper. t o t a l suff. 3uff. oon. s a l t y W/S
Ward code:MKWBDU
NNYAMBACHI
MKWEHJ
- CHIUTA
TENGULENGU
-MAKULE
T o t a l ward
130510
1.
1.
1.
5.
837
405
629
328
301
500
166
127
55
153
11
513
3
1
1
3
8
8
8 1
8 1
8
3
10
10
6,5
70
6,70
0
0
0
0
14
2,80
0
0
0
0 0
1 0
1 0
0 0
0 0
Total
division 92.130 5.994
D i v i s i o n : NAMKUPA
Warxi c o d e :NAMDCUPA
NAMDCUPA
mm- SINÏANGI
CHINGATI
HURIMA
MTLIDU
KWANYAMA
NANJALAHU
Total ward
130601
2.229
1.372
105
1.425
597
1.173
1-313
227
8.441
20
57
2
28
43
80
62
2
293
7
6
6
1
1
1
3
3
1
8
6
3
34
5
1
8
4
1,6
1
3,5
0
4,5
2,12
0
0
2
1,7
15,5
0,5
3,28
0
0
1
1
1
3
0
0
0
0
0
0
0
0
0
0
0
0
0
0
0
0
0
0
0
0
0
0
0
0
0
1
1
0
3
3
30
0
0
0
0
0
0
0
0
0
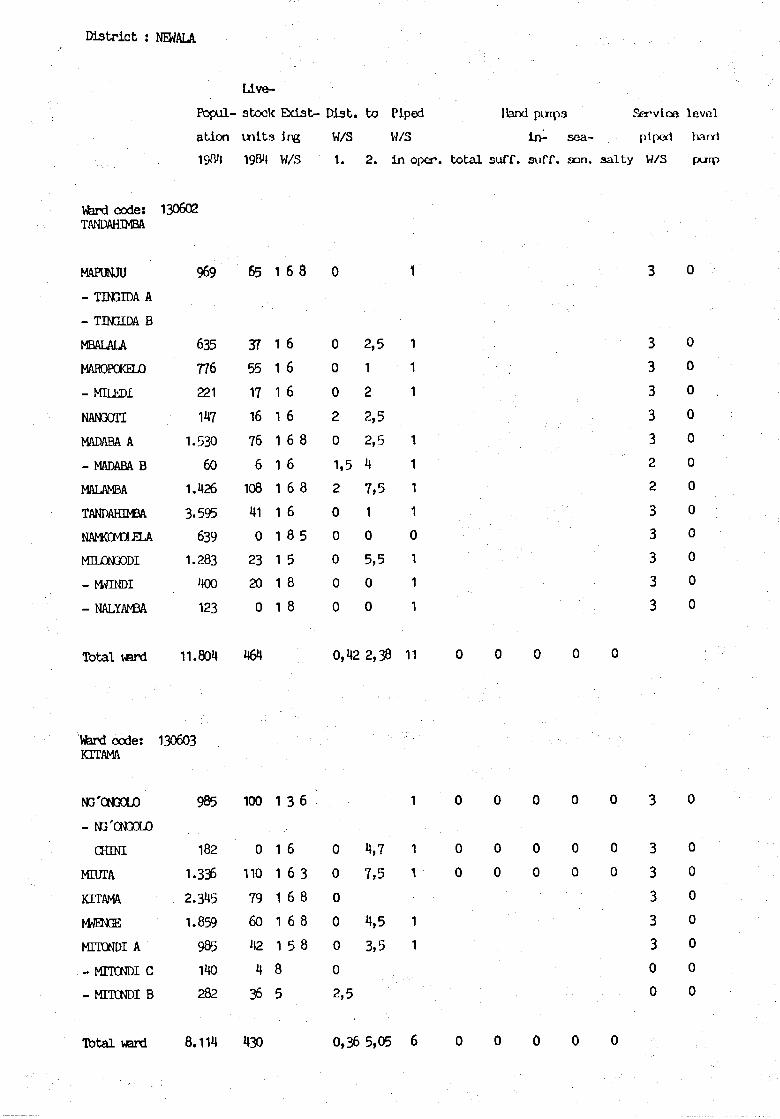
Dist r ic t : NEWALA
Ftopul- stock Exist- Dist . to Piped Hand puips Servioe level
ation units i i ^ W/S W/S in- sea- piped hand
1984 W/S 1. 2. in oper. total suff. suff. {an. salty W/S
Vfard code:TANDAHIMBA
MAPUNJU
- TINGIDA A
- T D C I D A B
MBALALA
MAR0P0KEL0
- MTLEDI
NANGOTI
MADABA A
- MADAM B
MALAMBA
TANDAHIMBA
NAMKOMXELA
M H J O N G O D I
- NWINDI
- NALYAMBA
Total ward
130602
969
635
776
221
147
1.530
60
1.426
3.595
639
1.283
400
123
11.804
65
37
55
17
16
76
6
108
41
0
23
20
0
464
1
1
1
1
1
1
1
1
1
1
1
1
1
6
6
6
6
6
6
6
6
6
8
5
8
8
8
8
8
5
0
0
0
0
2
0
1,5
2
0
0
0
0
0
0,42
2,5
1
2
2,5
2,5
4
7,5
1
0
5,5
0
0
2,38
1
1
1
1
1
1
1
1
0
1
1
1
11
3 0
3 0
3 0
3 0
3 0
2 0
2 0
3 0
3 0
3 0
3 0
3 0
Ward c o d e :KTTAMA
NG'ONOOLO
- tC'CNGOJO
CHINI
MTtTTA
K1TAMA
MITONDI A
- MITONDI C
- MITCNDI B
Total ward
130603
1.
2.
1.
8.
985
182
336
345
859
985
140
282
114
100
0
110
79
60
42
4
36
430
1
1
1
1
1
1
8
5
3
6
6
6
6
5
6
3
8
8
8
0
0
0
0
0
0
2,5
0,36
4,7
7,5
4,5
3,5
5,05
1
1
1
1
1
6
0
0
0
0
0
0
0
0
0
0
0
0
0
0
0
0
0
0
0
0
3
3
3
3
3
3
0
0
0
0
0
0
0
0
0
0
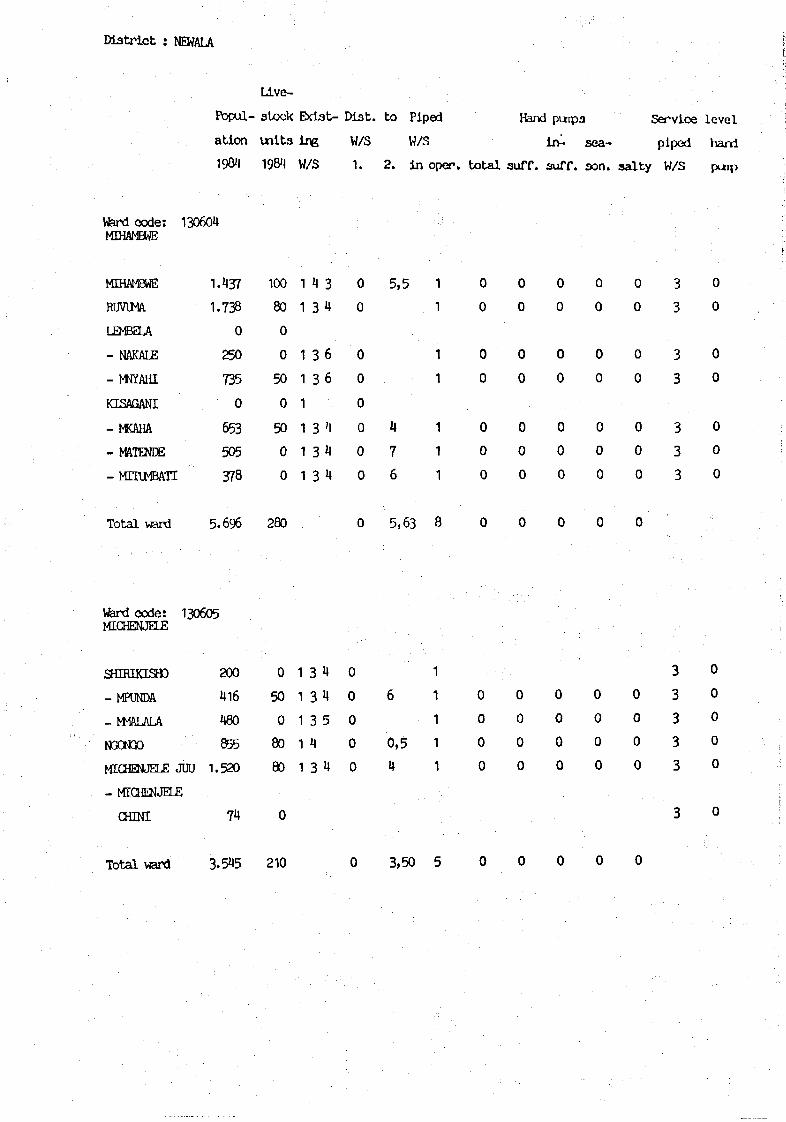
Dist r ic t : NEWALA
Llve-
flopul- stock E>ct3t- Diab. to Piped Hand pinpa Service level
ation units ir^ W/S W/5 liy. sea- piped hand
190*1 1984 W/S 1. 2. in oper. total suff. suff. son. salty W/S purip
Ward code:MfflWCWE
MIHAMBWE
RIMMA
LEMBELA
- NAKALE
- MtfAHI
KISAGANI
- KKAHA
-MATENDE
- MTÏÏJMBATI
Tota l ward
130604
1.
1.
437
738
0
250
735
0
653
505
378
5.696
100
80
0
0
50
0
50
0
0
280
1
1
1
1
1
1
1
1
4 3
34
36
36
3 4
3 4
34
0
0
0
0
0
0
0
0
0
5,5
4
76
5,63
1
1
1
1
1
1
1
8
0
0
0
0
0
0
0
0
0
0
0
0
0
0
0
0
0
0
0
0
0
0
0
0
0
0
0
0
0
0
0
0
0
0
0
0
0
0
0
0
3
3
3
3
3
3
3
0
0
0
0
0
0
0
Ward code: 130605MICHENJELE
SHIRIKISK)
-MPUNDA
- WALALA
NGONGO
MICHENJELE JUU 1 .
- MICHENJELE
CHINI
200
416
480
855
520
74
0
50
0
80
80
0
1
1
1
1
1
3 4
34
3 5
4
3 4
0
0
0
0
0
6
0,5
4
1
1
1
1
1
0
0
0
0
0
0
0
0
0
0
0
0
0
0
0
0
0
0
0
0
3
3
3
3
3
3
0
0
0
0
0
0
Tbtal ward 3-545 210 0 3,50 5
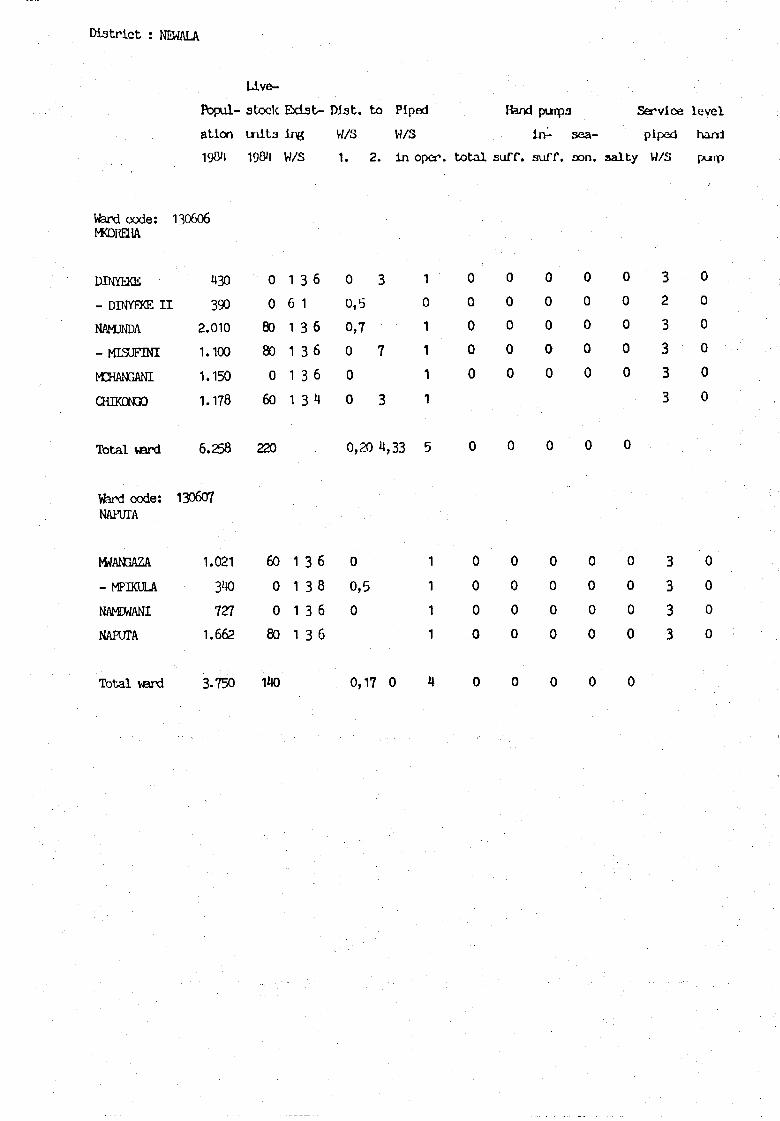
District : NEWALJV
Llve-
l - stock Exist- IMst. to Piped Hand punpa Service level
atlon inita ing W/S W/S iiy- sea- piped hand
190M 190*1 W/S 1. 2. in oper. total surf, suff. son. salty W/S
Ward code: 130606MKDREHA
DINYEKE 430 0 1 3 6 0 3 1 0 0 ° ° 0 3 0
- DINYEKE I I 390 0 6 1 0,5 0 0 0 0 0 0 2 0
NAMJNDA 2.010 80 1 3 6 0,7 1 0 0 0 0 0 3 0
-MISUFINI 1.100 8 0 1 3 6 0 7 1 0 0 0 0 03 0
t*HANGANI 1.150 0 1 3 6 0 1 0 0 0 0 0 3 0
CHIKCHX) 1.178 60 1 3 4 0 3 1 3 °
Tbtalverd 6.258 220 0,20 U,33 5 0 0 0 0 0
Ward code: 130607NAPUTA
WAN3AZA 1.021 60 1 3 6 0
- MPIKULA 340 0 13 8 0,5
NAMDWANI 727 0 1 3 6 0
NAFUTA 1.662 80 1 3 6
Tbtal vgard 3-750 140 0,17 0
1
1
1
1
0
0
0
0
0
0
0
0
0
0
0
0
0
0
0
0
0
0
0
0
33
3
3
0
0
0
0
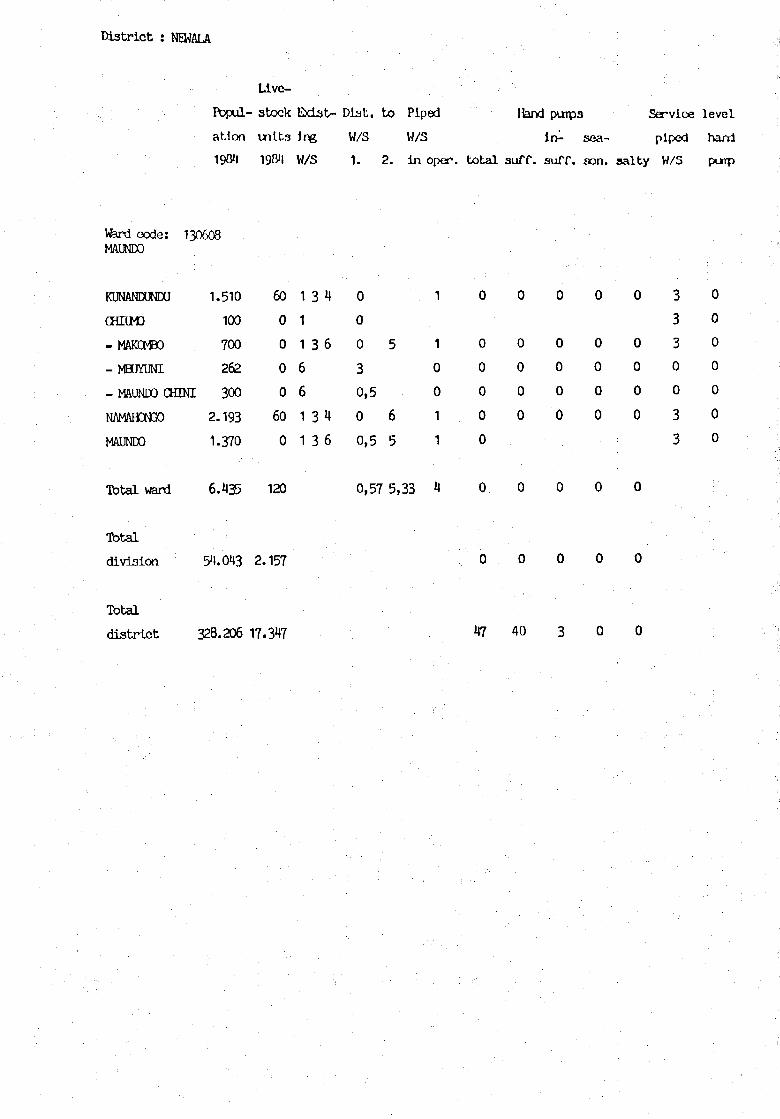
District : NEHALA
Uve-
l - stock Exist- Diat. to Piped Hand puipa Service level
ation uilta l i ^ W/3 W/3 iiv- sea- piped harri
190*1 19&\ W/S 1. 2. in oper. total suff. suff. oon. salty W/3
Ward code:MAUNDO
KUNANDUNDU
CHIIMD
- MAKCMBO
- MBUYUNI
130608
1.510
100
700
262
- MAUNDÛ CHINE 300
NAMAHONGO
MAUNDO
Tbtal ward
Total
division
Total
district
2.193
1.370
6.435
5U.0H3
328.206
60
0
0
0
0
60
0
120
2.157
17.347
1
1
1
6
6
1
1
3
3
3
3
4
6
4
6
0
0
0
3
0,5
0
0,5
0,57
5
6
5
5,33
1
1
0
0
1
1
4
0
0
0
0
0
0
0
o
47
0
0
0
0
0
0
0
40
0
0
0
0
0
0
0
3
0
0
0
0
0
0
0
0
0
0
0
0
0
0
0
0
3
3
3
0
0
3
3
0
0
0
0
0
0
0

14 MTWARA-MIKINDANI TOWN
Division
01 Mtwara
02 Mikindani
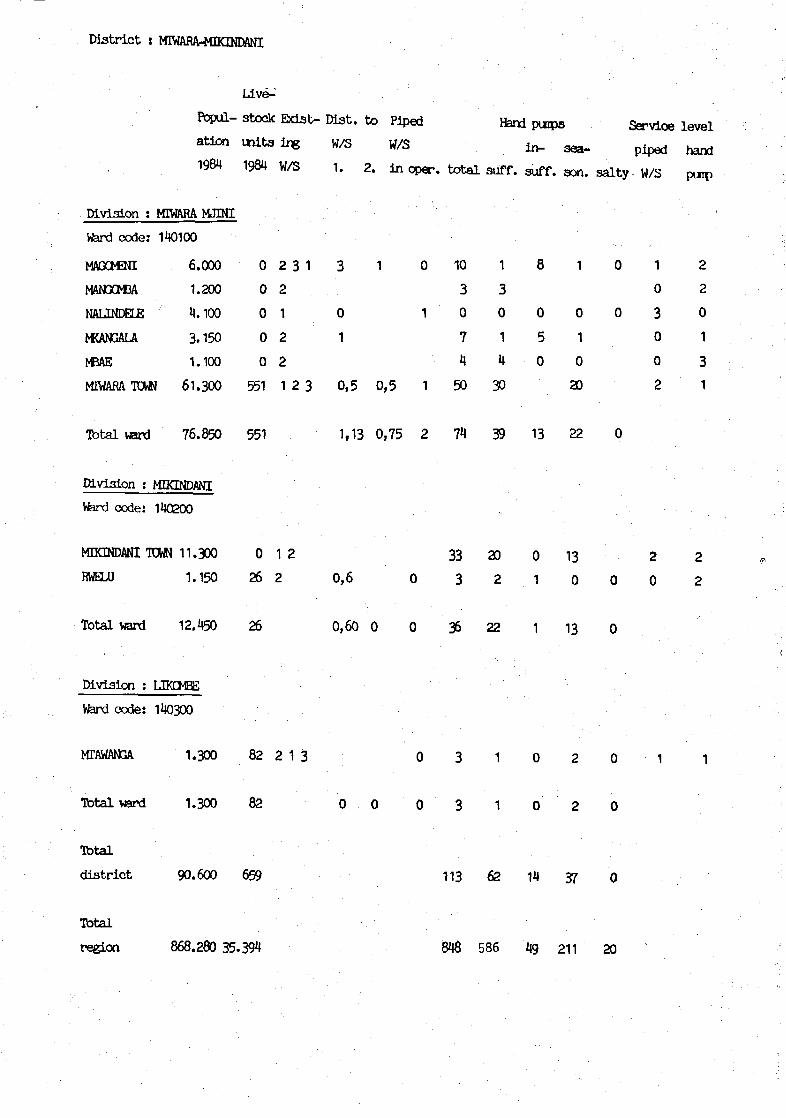
District : MIWARA-MIKINDANI
Live-'
Popul- stock Eds t - mat . to Piped fend pmps Service level
ation ui i t s U s W/S W/S in- sea- piped hart
1984 1984 W/S i. 2. in oper. total suff. suff. « « . salty- W/S
Division : MTWARA MJINI
Ward code:
MAGOENI
MAN3CM3A
NALINDELE
MCANOALA
NBAE
140100
6.000
1.200
4.100
3.150
1.100
0
0
0
0
0
2 3 1
2
1
2
2
3
0
1
10 1 8 1 1
0
30
0
2
2
2
0
1
31MIWARA TOWN 61.300 551 1 2 3 0,5 0,5 1 50 30 20
Total ward 76.850 551 1,13 0,75 2 74 39 13 22 0
Division ; MOgNDANI
Ward code: 140200
MDCINDANI TOWN 11.300 0 1 2 33 20 0 13 2 2
HWELU 1.150 26 2 0,6 0 3 2 1 0 0 0 2
Total ward 12.450 26 0,60 0 0 36 22 1 13 0
Division : LJKCMBE
Ward code: 140300
MTAWANGA 1.300 82 2 1 3 0 3 1 0 2 0 1 1
Tbtal ward 1.300 82 0 0 0 3 1 0 2 0
Total
district 90.600 659 113 62 14 37 0
Tbtal
region 868.280 35.394 848 586 49 211 20
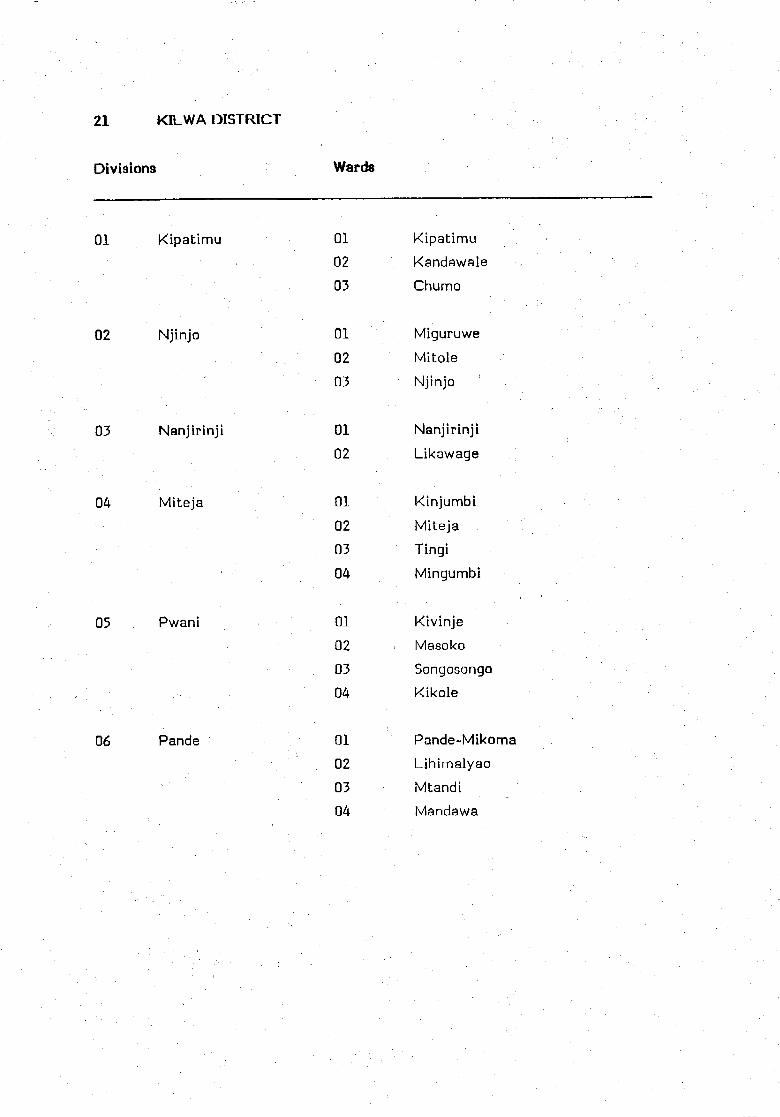
21 KILWA DISTRICT
Divisions Wards
01 Kipatimu
02 Njinjo
03 Nanjirinji
Miteja
05 Pwani
Pande
01
02
03
01
02
03
01
02
01
02
03
04
01
02
03
04
01
02
03
04
KipatimuKandawale
Chumo
Miguruwe
Mitole
Njinjo
Nanjirinji
Likawage
Kinjumbi
Miteja
Tingi
Mingumbi
Kivinje
Masoko
Songosongo
Kikole
Pande-Mikoma
Lihimalyao
Mtandi
Mandawa

Dis t r i c t : K3LWA
H v e -
Popul- stock Exist- Mat. to Piped Hand purps Service level
ation uiits ing W/S W/S in- sea- piped hand
1984 1984 W/S 1. 2. in oper. total suff. suff. son. salty W/S putp
Division : JŒPATIM3
Ward c o d e :HPATIMJ
HANOA
HPATIMJ
KIBATA
MKWDO WA
OMtfAGA
-MKONGO
MfêNGEI
NANDEMBO
NANDETE
MCARAN3O
Total ward
210101
964
4.002
1.143
1.662
300
837
1.046
1.907
1.000
12.861
0
0
0
0
0
0
0
0
0
0
2
2
6
2
2
2
62
2
3 6
3 1 6
6
6
66
2
0
3
0,5
0,5
0,5
30,5
0,5
1,17
0 2
0
1
1
0,50 2
2
14
0
730
9
4
39
2
14
73
9
4
39
Ward c o d e :KANDAWAIE
NAMATEWA
NGARAMBI
MrWBEt-MPO
KANDAWALE
Total ward
210102
700
1.750
PERA 1.256
1.731
5.477
0
0
0
10
10
63
4
3
6
36
0 20 30 0
0 3
0 3
0 2
0 0
0 3
0 3
0 0
0 0
0 0
0 0
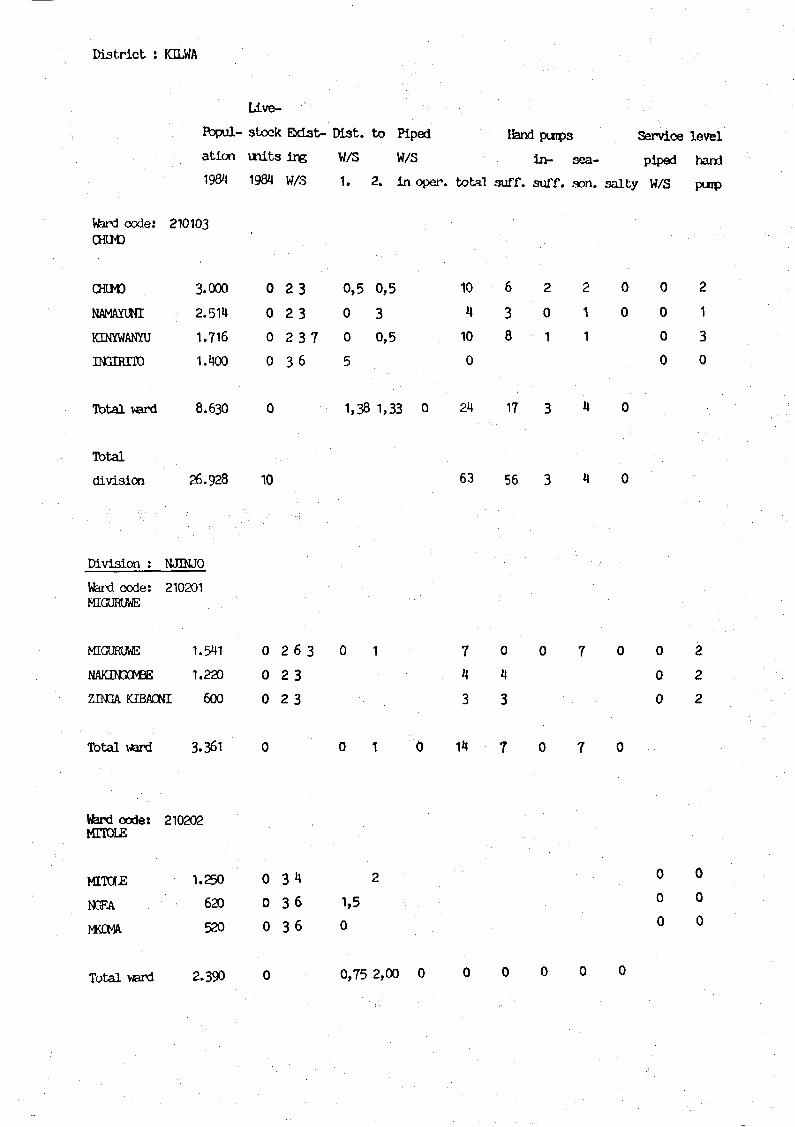
District : KILWA
LAve-
Papul- stock Bdat- Dist. to Piped Hand pimps Service level
at ion i n i t s ing W/S W/S i n - sea- piped hand
1984 1984 W/S 1. 2. in oper. t o t a l auff. suff. son. s a l t y W/S puip
Ward code: 210103CHIM3
CHIM)
NAMAYUNI
KINYWANYU
3.000
2.514
1.716
1.400
0 23
0 23
0 2 370 3 6
0,5 0,5
0 3
0 0,5
5
10 6
4 3
10 8
0
2
0
1
2
1
1
0
0
0 2
0 1
0 3
0 0
Total verd 8.630 1,38 1,33 0 24 17
Total
division 26.928 10 63 56
Division : NJINJO
Ward c o d e : 210201MIGURUWE
MIGURUWE
NAHNGOtëE
ZINGA KIBAÛNI
T b t a l ward
1.
1.
3.
541
220
600
361
0
0
0
0
2
2
2
6 3
3
3
7
4
3
14
0
4
3
0 2
0 2
0 2
Ward code :MTIOLE
MITOLE
NŒA
MffiMA
T o t a l ward
210202
1.250
620
520
2.390
0
0
0
0
34
36
36
1,5
0
0,7
0 0
0 0
0 0

Dis t r i c t : K3LWA
U v e -
Fopul- stock Exis t - M a t . t o Piped tend purps Service level
at ion t n l t s ing W/S W/S in - sea- piped harxl
1984 1984 W/S 1. 2. in oper. t o t a l suff. suff. son. s a l t y W/S puip
Vferd code: 210203NJDJJO
NJINJO 3.400 0 2 1 1 0 1 16 16 0 0 0 1 3
FŒPINDIMPI 2 .015 0 2 3 0 1 5 0 0 5 0 0 1
KISIMA-MKUCA 1.400 0 3 1 5 0 1 0
-total ward 6.815 0 2,00 0,50 1 21 16 0 5 0
Total
division 12.455 0 35 23 0 12 0
Division : NANJIHINJI
Vferd code :NANJIKENJI
NANJIRINJI
NANJIRINJI
NAKIU
T o t a l ward
Vferd code :LIKAWAŒ
LIKAWAŒ
-MHJNJA
NAIKOKWE
Liwrn
Total ward
Total
division
210301
B 1.500
A 1.200
2.600
5.300
210302
2.200
370
485
1.000
4.055
9.355
0
50
5
0
0
0
0
0
5
6
33
3
3
3U
1
3 1
4
1
6
2
2
2,00
1
4
1
3
2,25
n3
3,50
0
0
0
2
1
0
3
0
0
0
0
0
0
0
0
0
0
0
0
0 0
2 0
0 0
1 0
0 0
0 0
0 0

District : K3LWA
Live-
Popul- stock Exist- Dist. to Piped Hand puipa Service level
ation uvLts ing W/S W/S in- sea- piped harel
1984 1984 W/3 1. 2. i n oper. t o t a l suff. suff . son. s a l t y W/S ptnp
Division : MTIEJA
Ward code: 210401KDWIWBI
KIHEMA
(KMJIMBI)
MftLEMHX)
SCMANOA NDvMBO
SCMAN3A S M J
MTÏALAMBUKO
T o t a l ward
3.400
800
1.793
810
1.506
8.309
40
6
10
29
0
85
2
2
2
2
3
3
3
3
34
0
0,
o,0
1
o,
5
5
40
30
38
3,50 0
8
4
11
50
28
8
4
10
2
24
0
0
0
1
1
0
0
2
1
3
0
0
0
0
0
0
0
0
0
0
2
3
32
0
Ward c o d e : 210402MITEJA
MTTEJA
MTCNI
MTUKWAO
TILAWANDU
2.900
1.710
810
500
11 2 3
12 3 6
4 36
4 3
0 1
0 3
0 2
0 1,5
6
0
0
0
0 2
0 0
0 0
0 0
Total ward 5.920 31 0 1,88 0
Ward code:TDCI
TDCI
MTANDAN30
NJIANNE
210403
2.000
683
1.300
- MATAPATAPA 2 0 0
Total ward 4.183
15
30
10
0
55
12 3
2 3
1 6
6
0
0
0
0
O
32
1,67
1
1
2
6
50
11
0
5
5
0
0
0
6
0
6
0
0
0
2
0
2
0
1
30
0
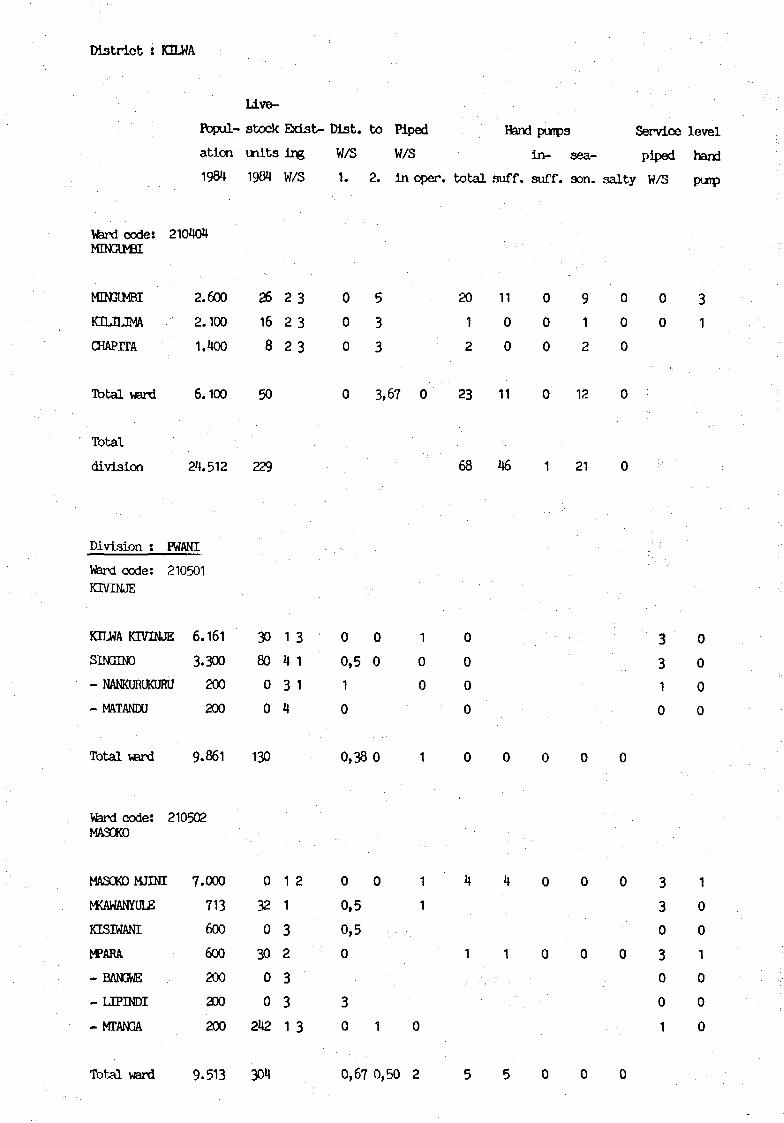
D i s t r i c t : KILWA
Llve-
I^^pul- stock E>dst- W a t . t o Piped Ifend puips Servioe l eve l
a t ion u i i t s ing W/S W/S In - sea - piped hanj
1984 1984 W/S 1. 2. i n oper. t o t a l suff. suff. son. s a l t y W/S putp
Ward c»de:MTNGIMBI
MDOMBI
KUJLJMA
CHAPITA
T o t a l ward
Total
division
210104
2.600
2.100
1.400
6.100
24.512
26
16
8
50
229
2 3
2 3
2 3
0
0
0
0
5
33
3,67 0
20
1
2
23
68
' : . . •
11
0
0
11
46
0
0
0
0
1
9
1
2
12
21
0
0
0
0
0
0
0
31
D i v i s i o n ; PWANI
Ward code :KIVINJE
210501
KILWA KIVBUE 6.161
SINGIN0 3.300
- NANKURUKURU 200
- MATANDU
T o t a l ward
Ward code :MASOKD
200
9.861
210502
MASOKDMJINI 7 .000
MfCAWANYULE
KISIWANI
M>ARA
- BANGWE
_ L J P I N D I
- MTANGA
Total ward
713
600
600
200
200
200
9.513
30
80
0
0
130
0
32
0
30
0
0
242
304
1
4
34
1
1
32
331
31
1
2
3
0
0,5
1
0
0,38
0
0,5
0,5
0
30
0,67
0
0
0
0
1
0,50
1
0
0
1
1
1
0
2
0
0
0
0
0
4
1
5
3 0
3 0
1 0
0 0
3 1
3 0
0 0
3 1
0 0
0 0
1 0
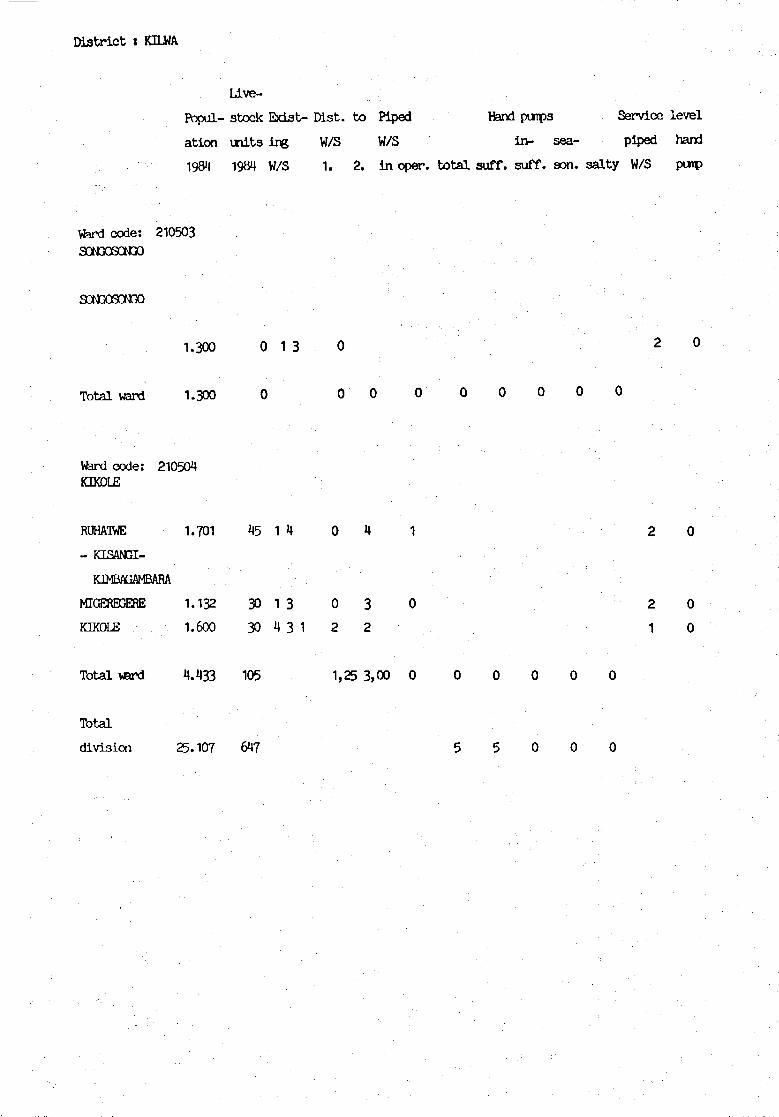
District I KHWA
Live-
Popul- stock Exist- Dist. to Piped Hand pumps Servioe level
ation inits ing W/S W/S in- sea- piped hand
1984 1984 W/S 1. 2. in oper. total suff. suff. son. salty W/S pinp
Ward code: 210503S0N3OSÛN3O
SONJOSONSO
1.300 0 1 3 0 2 0
Total ward 1.300 0 0 0 0 0 0 0 0 0
Ward code: 210504ÏŒKDLE
RUHATOE 1.701 45 1 4 0 4 1 2 0
- FŒSAN3I-
KIMBflGAMBARA
MIŒREEERE 1.132 3 0 1 3 0 3 0 2 0
KKOLE 1.600 3 0 4 3 1 2 2 1 0
Total ward 4.433 105 1,25 3,00 0 0 0 0 0 0
Total
division 25.107 647 5 5 0 0 0
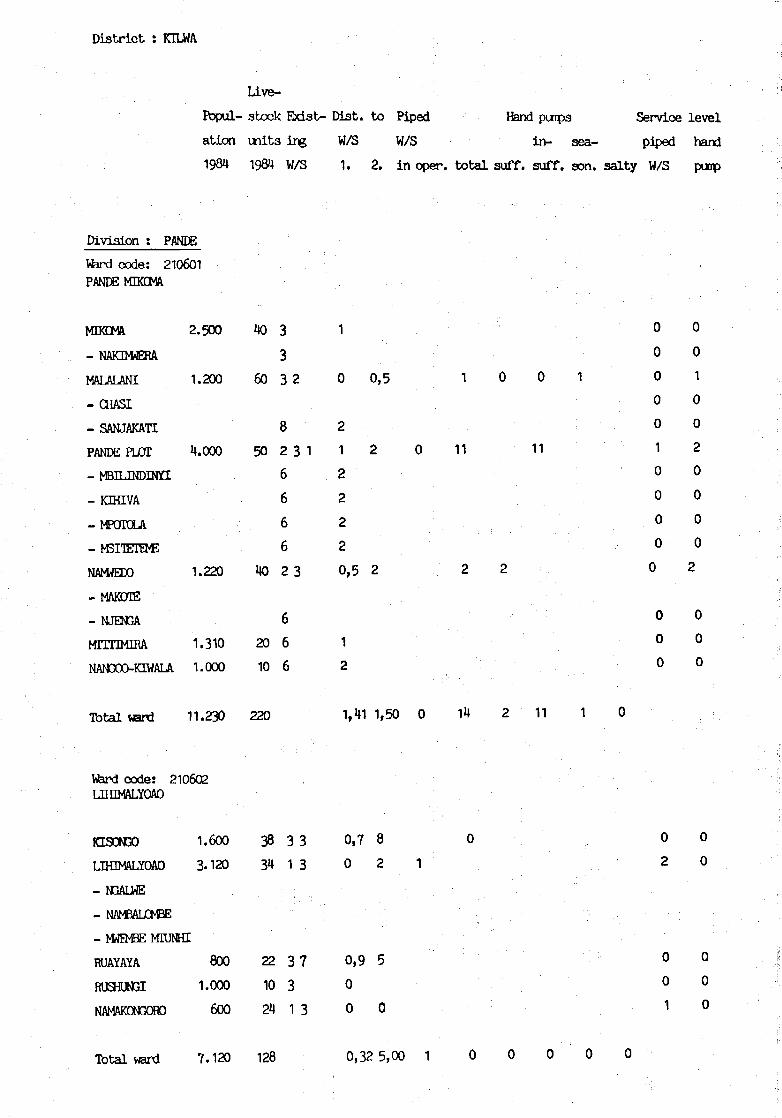
District : KHWA
IAve-
Popul- stock Ebdst- Mat. to Piped Hand puips Service level
ation units ing W/S W/S in- sea- piped hand
1984 1984 W/S 1. 2. in oper. total suff. suff. son. salty W/S pmp
Division : PME
Vfard c o d e : 210601PANDE MKCMA
MKCMA
- NAKIMERA
MALALANI
- CHASI
- SANJAKATI
PANDE PLOT
- MBHJNDINYI
- KJHIVA
-MPOTOLA
NAWEDO
- MAKOIE
- NJEN3A
MITTIMIRA
NAN300-KIWALA
Total ward
2.500
1.200
4.000
1.220
1.310
1.000
11.230
Vfard c o d e : 210602LIHIMALYOAO
KISONGO
LXfflMALYOAO
- NAMBALOMBE
1.600
3.120
- MfêMBE MTUNHI
RUAYAYA
RUSHUNGI
NAMAKONGORO
800
1.000
600
40
60
50
40
20
10
220
38
34
22
10
24
3
3
3 2
8
231
6
6
6
6
2 3
6
6
6
3 3
1 3
37
3
1 3
1
0
2
1
2
2
2
2
0,5
1
2
1,41
0,7
0
0,9
0
0
0,5
2 0
2
1,50 0
8
2 1
5
0
0 0
0 0
1 0 0 1 0 1
0 0
0 0
11 11 1 2
0 0
0 0
0 0
0 0
2 2 0 2
0 0
0 0
0 0
14 2 11 1 0
0 0
2 0
0 0
0 0
1 0
Total ward 7.120 128 0,32 5,00 1

District : KILWA
Live-
Popul- stock Eidat- Dist. to Piped Hand pwps Service level
ation units ing W/S W/S in- sea- piped hartl
1984 1984 W/S 1. 2. in oper. total suff. suff. son. salty W/S puip
Vfard code: 210603MTANDI
MAKANGAGA
HRANJERANJE
MBWEMCURU
KISWERE
MTANDI
Total ward
1.290
2.660
1.565
910
1.300
7.725
0
50
40
0
10
100
31
2
31
33
2
2
0
0
0,
0,5
1
0,5
67 0,67 0
30,
3
3
9
0 2
2 0
0 1
0 0
2 2
Vfard c o d e :MANDAWA
HOTELITATU
MAVUJI
- MEHAKAMA
MANDAWA
HWAWA
KDC0N30
210604
1.
2.
1.
500
614
250
600
500
0
0
30
0
0
3
4
4
4
1 2
3
1
0,5
0
0
0,5
0,5
0
0
4
0
0
0
0
0
2
0
0
0
0
0
2
0
Tbtai ward 6.464 30 0,38 0,50 0 4
Totaldivision
Total
district
32.539
130.500
530
1.421
27 10 11
195 HO 15 43 1
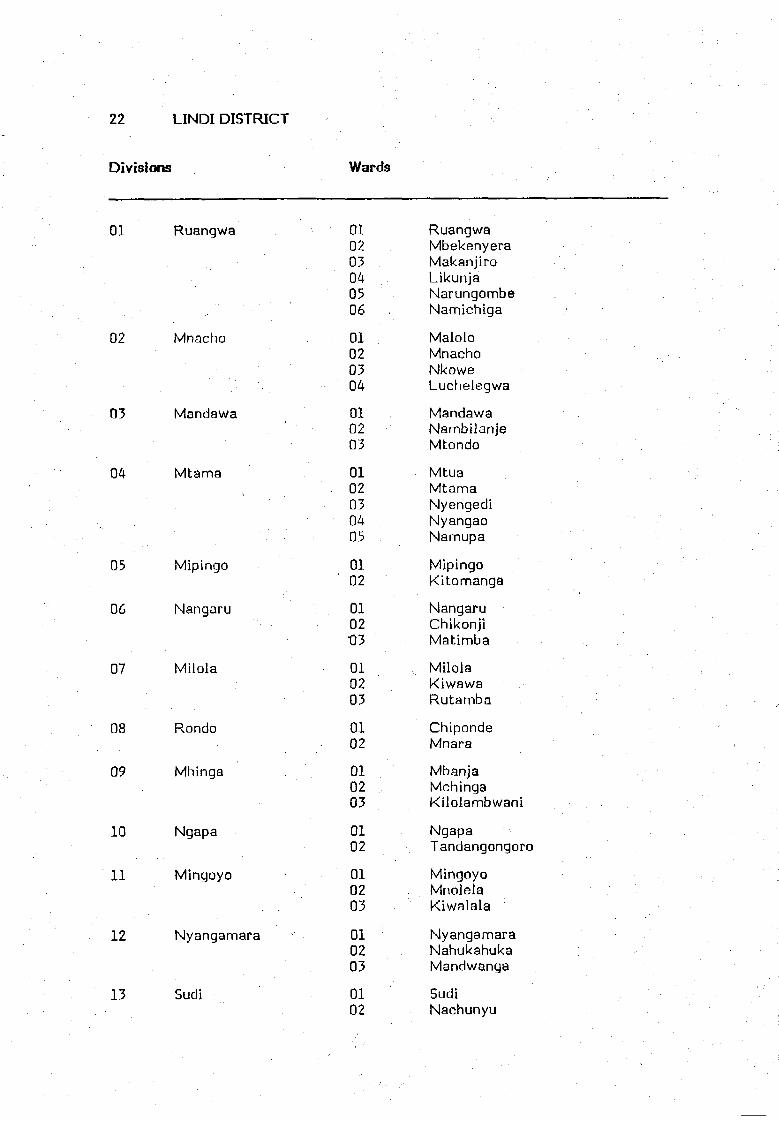
22 LINDI DISTRICT
Divisions Wards
01
02
03
04
05
06
07
08
09
10
11
12
13
Ruangwa
Mnacho
Mandawa
Mtama
Mipingo
Nangaru
Milola
Rondo
Mhinga
Ngapa
Mingoyo
Nyangamara
Sudi
010203040506
01020304
010203
0102030405
0102
0102•03
010203
0102
010203
0102
010203
010203
0102
RuangwaMbekenyeraMakanjiroLikunjaNarungombeNamichiga
MaloloMnachoNkoweLuchelegwa
MandawaNambilanjeMtondo
MtuaMtamaNyengediNyangaoNarnupa
MipingoKitomanga
NangaruChikonjiMatimba
MilolaKiwawaRutamba
ChipondeMnara
MbanjaMchingaKilolambwani
NgapaTandangongoro
MingoyoMnolelaKiwalala
NyangamaraNahukahukaMandwanga
SudiNachunyu

District : 1INDI
Live-
PDpul- stock Exist- Dist. to Piped Hand punpa Servioe level
ation vnits ing W/S W/S in- sea- piped hand
1984 1984 W/S 1. 2. in oper. total suff. suff. aon. salty W/S puip
Division : RUAN3WA
Ward c o d e : 220101RUAN3WA
RUAN3WA
- HLMAHEWA
- NACHINGWEA
- DODCMA
- LIPANDE
-M31AN3ANI
MANDARAWE
NACHTNYIMBA
LJKANGARA
NANDENJE
Total ward
0
1,255
1.196
1.382
300
1.255
990
888
1.223
870
9.359
Ward c o d e : 220102MBEXENYERA
NAUNAMEE
NAMHOJLO
MBEKENYERA
CHUNYU
NAMIUMA
Total ward
2.196
1.287
1-739
2.450
1.585
972
10.229
0
24
24
28
0
100
14
24
24
24
262
36
36
36
86
3614
244
2
1
2
2
2
2
2
2
1
2
3
332
2
3
1 3
3
1 3
1 3
3
1 3
3
3
3
3
32
2
3
32
0
0
0
0
0,5
0,5
0,5
0,5
0
0,5
0,25
0,5
0,5
0,5
0,5
0,5
0,50
0
6
6
0
4
0
6
2
6
2
3,20
8
0,5
0,5
3
0,5
0,5
2,17
1
1
1
1
1
1
6,00
0
0
0
6
4
36
6
30
5
33
3
712
98
39
0
6
4
3
36
3
4
29
3
712
9
8
39
0
0
0
0
0
0
0
0
0
0
0
0
0
0
0
0
0
30
0
1
4
0
0
0
0
0
0
0
0
0
0
0
0
0
0
0
0
2
2
2
2
0
2
0
0
2
0
0
0
0
0
0
2
0
2
2
32
3
2
0
2
0
2
32
33
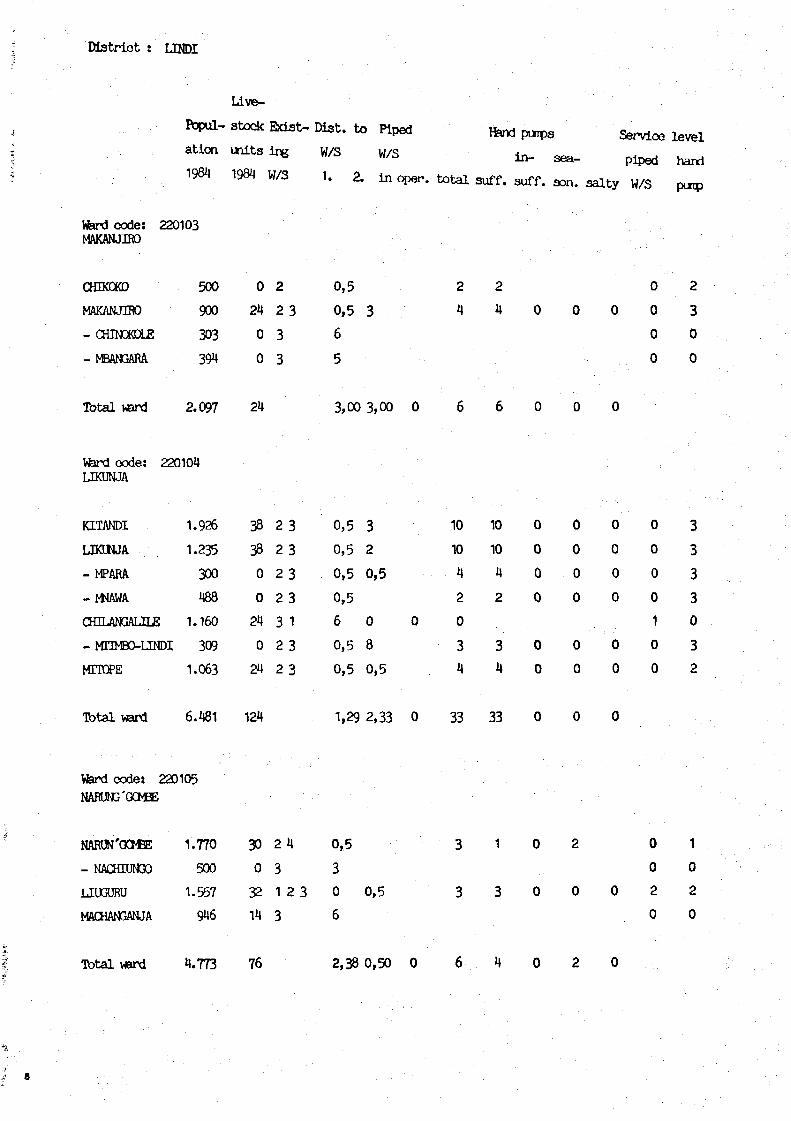
District :
Uve-
l - stock Exist- Dtat. to Piped Hand pxrps Service level
ation ^ t s i n g W/S w/5 ^ ^ p l p e d
1984 1984 W/S 1. 2. ta oper. total suff. suff. son. salty W/S
Ward code: 220103MAKANJIRO
CHIKOKD
MAKANJIRO
- CHINOKDL£
-MBANGARA
T o t a l ward
500
900
303
394
2.097
Ward c o d e : 220104LMJNJA
KITANDI
LJKUNJA
- MPARA
- hNAWA
CHILANGA1JLE
1.926
1.235
300
488
1.160
- MTMBO-LENDI 309
MITOPE
T b t a l ward
1.063
6.481
. • • . • . • • • . . . • • • •
Ward code: 220105HMUE'OMe
0
24
0
0
24
38
38
0
0
24
0
24
124
2
2
3
3
2
2
2
2
32
2
3
3
3
3
3
1
3
3
0,5
0,5
6
5
3,00
0,5
0,5
0,5
0,5
6
0,5
0,5
1,29
3
3,00 0
32
0,5
0 0
8
0,5
2,33 0
2
4
6
10
10
4
2
0
34
33
2
4
6
10
10
4
2
3
4
33
0
0
0
0
0
0
0
0
0
0
0
0
0
0
0
0
0
0
0
0
0
0
0
0
0
0
0
0
0
0
0
0
0
0
0
1
0
0
2
30
0
3
3
3
3
0
3
2
NARUN'GCtfiE 1.770 30 2 4 0,5
- NAOfflJNQO 500 0 3 3
LIU3URU 1.557 32 1 2 3 0 0,5
MACHANGANJA 946 14 3 6
3
3
0
0
2
1
0
2
Tbtal ward 4.773 76 2,38 0,50 0

District : UNDI
Live-
Popul- stock Bd3t- Diat. to Piped Hand piiips Service level
ation units iflg W/S W/S in- s ^ . piped ^
1984 1984 W/S 1. 2. in oper. total suff. suff. aon. salty W/S puip
Ward code: 220106NAMICHIGA
MDŒWE 855 10 2 3 0,5 5 3 0 2 0 0 2
MMWfiALAlE 1.440 03 0 0
NANDANDARA 761 10 3 3 0 0
NAMTCHIGA 2.447 36 2 3 1 0,5 6 0 10 3 0 7 1 2
Total ward 5.503 56 1,33 6,00 0 15 6 0 9 0
Total
division 33.442 786 132 117 0 15 0
Division : MNAQP
Ward code: 220201MALOLO
MICHEN3A 1.996 0 2 3 0,5 9 8 0 1 0 3
NANGANGA 959 38 1 2 4 0 0,7 1 4 2 2 0 0 3 2
NANCKMBU 4.223 39 2 0,7 19 19 0 3
MALOLO 1.240 117 2 6 0,7 0,7 6 5 0 1 0 0 2
Total ward 8.418 194 0,48 0,70 1 38 34 2 2 0
Ward code:MNACHD
NGAU
NAMAHEWA
NANDAGALA
CHIMBILA A
- CHIMBILA
MANOKWE
220202
B
1.
1.
2.
2.
750
313
857
375
400
10
10
20
20
0
1
1
31
2
1
3
3
333
0
5
0,5
0,5
0,5
3 0
0 0
3 0
0 2
2 0
0 0
Total ward 8.695 61 1,30 0 2 4 4 0 0 0
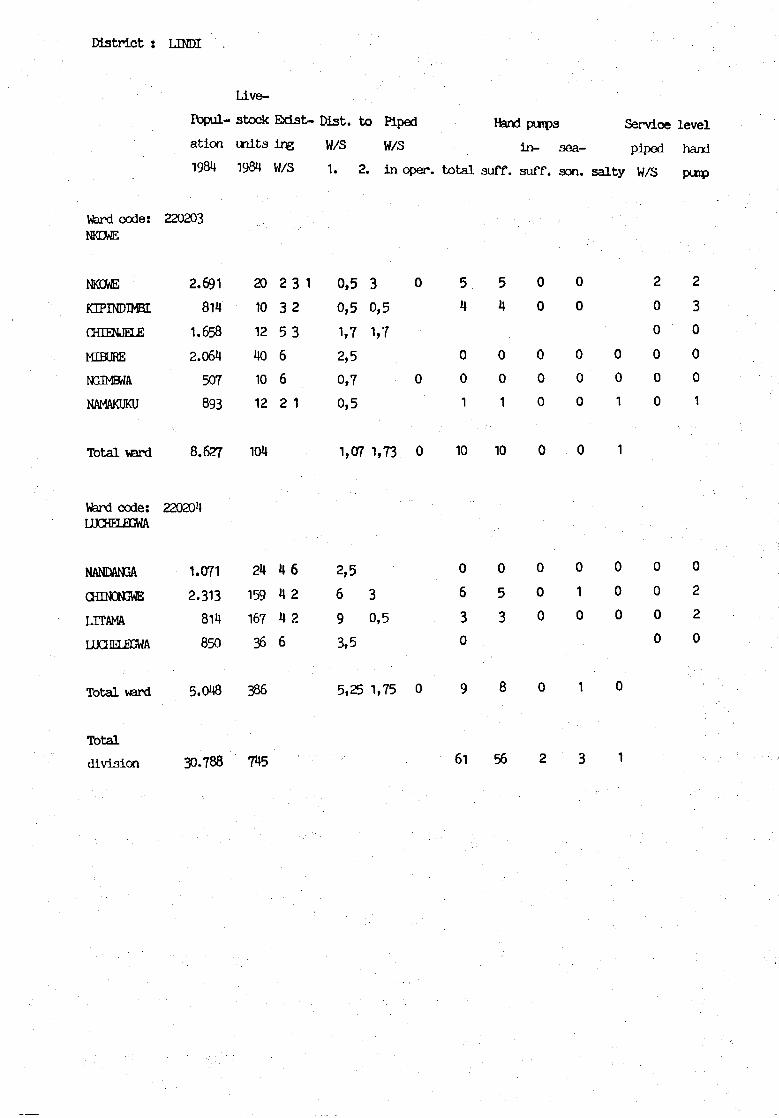
District : UNDI
Live-
Fopul- stock Exist- Dist. to Piped Hand pmps Service level
ation units ing W/S W/S in_ sea- piped hand
1984 1984 W/S 1. 2. in oper. total suff. suff. son. salty W/S puip
Ward code:NKDWE
NKDWE
KIPINDIMBI
( H ΠN J E L E
MESURE
NGIMBWA
NAMAKUKU
Total ward
Ward code:UUCHELEGWA
NANDANGA
(HDKH3WE
LTTAMA
L U C H E L B J W A
Total ward
Total
division
220203
2.691
814
1.658
2.064
507
893
8.627
220204
1.071
2.313
814
850
5.048
30.788
20
10
12
40
10
12
104
24
159
167
36
386
745
2
3
5
6
6
2
4
4
4
6
3 1
2
3
1
6
2
2
0,5
0,5
1,7
2,5
0,7
0,5
1,07
2,5
6
9
3,5
5,25
3
o,1,
1,
3
0,
1,
5
7
73
5
75
0
0
0
0
5
4
0
0
1
10
0
6
3
0
9
61
5
4
0
0
1
10
0
5
3
8
56
0
0
0
0
0
0
0
0
0
0
2
0
0
0
0
0
0
0
1
0
1
3
0
0
1
1
0
0
0
0
1
2
0
0
0
0
0
0
0
0
0
2
3
0
0
0
1
0
2
2
0

District : LtNDI
Live-
Fopul- stock Exist- Mat. to Piped Hand pumps Service level
ation units ing W/S W/S in- sea- piped hand
1994 1984 W/S 1. 2. in oper. total suff. suff. son. salty W/5 puip
Division : MflNDAWA
Ward code:
MANDAWA
CHD3ULA
M3Ï ÏCHILI
(MANDAWA)
NAHANGA
CHIKUNDI
LICHWACHWA
220301
1.242
2.916
1.812
647
366
20
84
23
20
20
1
1
1
1
4
3
3
3
3
3 1
0
0
0
0
5
5
5
6
4
0
0
0
1
0
Total ward 6.983 167 0 5
Ward code:NAWILANJE
MKARANGA
NAMBILANJE
NANJARU
T o t a l ward
220302
908
878
789
2.575
35
20
20
75
2 3
3
3
0,5 8
3
3
2,17 8
3 0
3 0
3 0
1 0
0 2
0 0
0 0
Ward code : 220303MTCNDO
MTCNDO 1.147 20 1 3 0 1 3 0
MJHURU 300 0 3 1 5 0 0 1 0
Total ward 1.447 20 2,50 0 1 0 0 0 0 0
Total
division 11.005 262 6 2 0 4 0
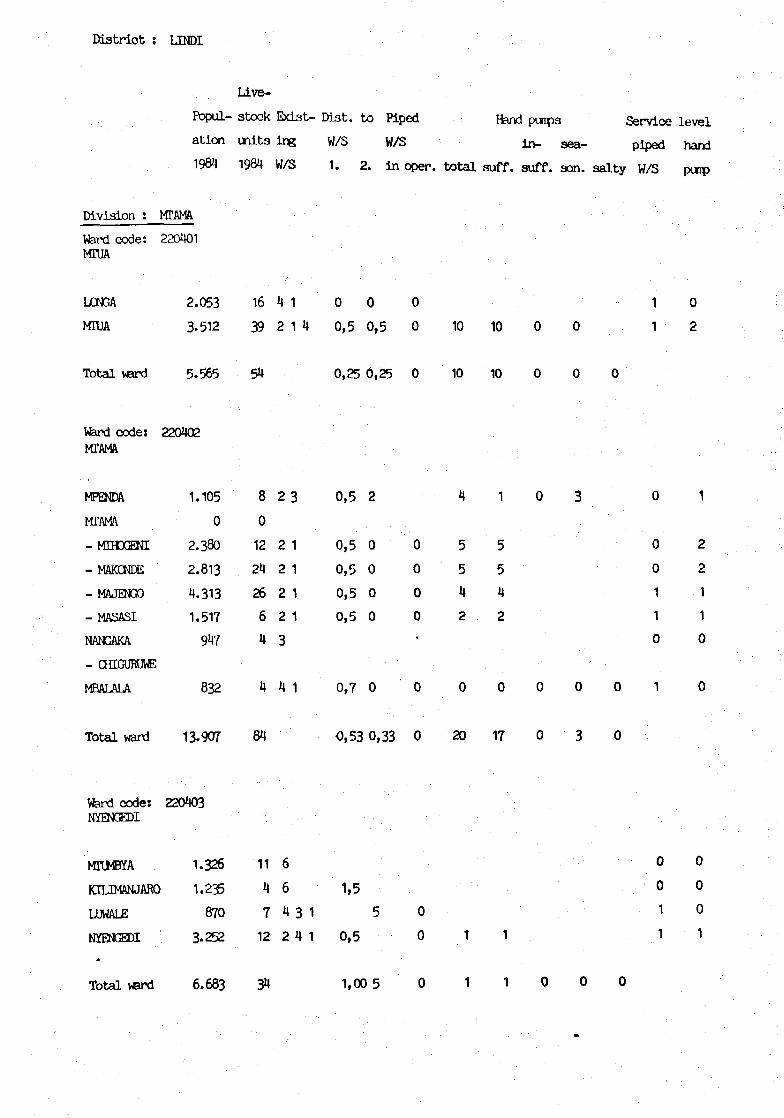
Dis t r ic t : UNDI
Live-
Popul- stock Bdflt- Mat . to Piped fend purps Service level
ation u i i t s ing W/S W/S in- sea- piped hand
1984 1984 W/S 1. 2. in oper. total suff. suff. son. salty W/S punp
Division : MTAMA
Ward code: 220401MIUA
LQNGA 2.053 16 4 1 0 0 0 1 0
MIUA 3.512 39 2 1 4 0,5 0,5 0 10 10 0 0 1 2
Total ward 5-565 54 0,25 0,25 0 10 10 0 0 0
Ward code:MTAMA
MPENDA
MTAMA
- M D C ΠN I
- MAKCNDE
- MAJENGO
- MASASI
NANGAKA
- CHIGURUWE
MBALALA
Total ward
220402
1.105
0
2.38O
2.813
4.313
1.517
947
832
13.907
8
0
12
24
26
6
4
4
84
2
2
2
2
2
3
4
3
1
1
1
1
1
0,5
0,5
0,5
0,5
0,5
0,7
0,53
2
0
0
0
0
0
! 0,33
0
0
0
0
•
0
0
4
5
5
4
2
0
20
1
5
5
4
2
0
17
Ward code:NYENŒDI
MIWBYA
KILIMANJARO
LUWALE
NYENŒDI
Total ward
220403
1.326
1.235
870
3-252
6.683
11
4
7
12
34
6
6
4
2
3
4
1
1
1,5
0,5
1,00
5
5
0
0
0
0
0
1
1
0
2
2
1
1
0
0 0
0 0
1 0
1 1

District : LTNDI
Llve-
Popul- stock Bds t - Wat. to Piped Hand puipa Service level
ation i n i t s i n g W/S W/S m_ sea- piped ^
1984 1984 W/S 1. 2. in oper. total suff. suff. son. sal ty W/S pujp
Ward code: 220404NYANGAO
NAMAN3ALE 2.414 82 2 6 1,5 1,5 6 6 0 0 0 0 2
NYANGAO 3.201 187 4 2 1 0,5 0 18 16 2 0 0 0 3
MUMBA 379 24 4 4,5 0 0 0 0 0 0 0
CHIWERERE 674 52 4 2 1,7 1,2 3 1 2 0 0 0 2
MAHIWA 1.270 18 4 6 1 0,7 0 0 0 0 0 0 1 0
MAWILO 365 52 2 2,2 2 2 0 0 2 0 2
Total ward 8.303 415 1,93 1,07 0 29 25 4 0 2
Ward code: 220405NAMJPA
NDAWA 412 2 4 0,7 0 0 0 0 0 0 0
MTH3MA 1 . 0 1 2 6 4 1 , 2 0 0 0 0 0 0 0
NAMJPA 1.451 68 4 2 7 0,7 0,7 8 8 0 0 5 0 3
Total ward 2.875 76 0,87 0,70 0 8 8 0 0 5
Total
division 37.333 663 68 61 4 3 5
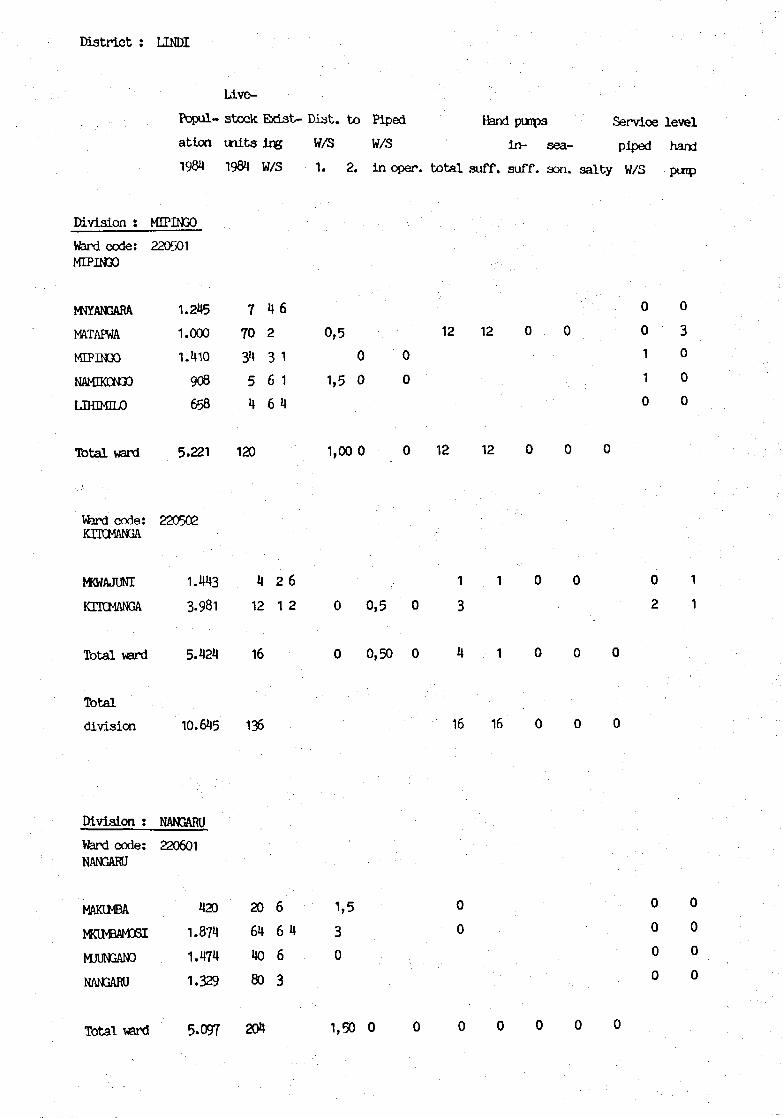
District : LTNDI
Uve-
Popul- stock Ebdst- Dis t . t o Piped Hand puips Service leve l
a t ion i n i t 3 lflg W/S W/S i n - sea- piped hand
1984 1984 W/S • 1. 2. in open, t o t a l suff, suff. son. s a l t y W/S ptnp
Division : MIPINGO
Ward code;MTPINOO
MJYANGARA
MATAPWA
MIPINGO
NAMIKDNGO
LlfflMILO
220501
1.
1.
1.
245
000
410
908
658
7
70
34
5
4
4
2
3
6
6
6
1
1
4
0,5
1,5
0
0
0
0
0 0
12 12 0 0 0 3
1 0
1 0
0 0
Total warxi 5.221 120 1,00 0 0 12 12
Ward c o d e : 220502KTTCMANGA
MWAJUNI 1 .443 4 2 6 1 1 0 0 0 1
KTKMANGA 3-981 12 1 2 0 0,5 0 3 2 1
Total ward 5.424 16 0 0,50 0 4 1 0 0 0
Total
division 10.645 136 16 16 0 0 0
Division ; NANGARU
Ward o o d e :NANGARU
MAKCMBA
MKIWBAMDSI
MJUNGANO
NANGARU
Total ward
220601
1.
1.
1.
5.
420
874
474
329
,097
20
64
40
80
204
6
64
6
3
1
3
0
1,
,5
50 0 0
0
0
0
0 0
0 0
0 0
0 0
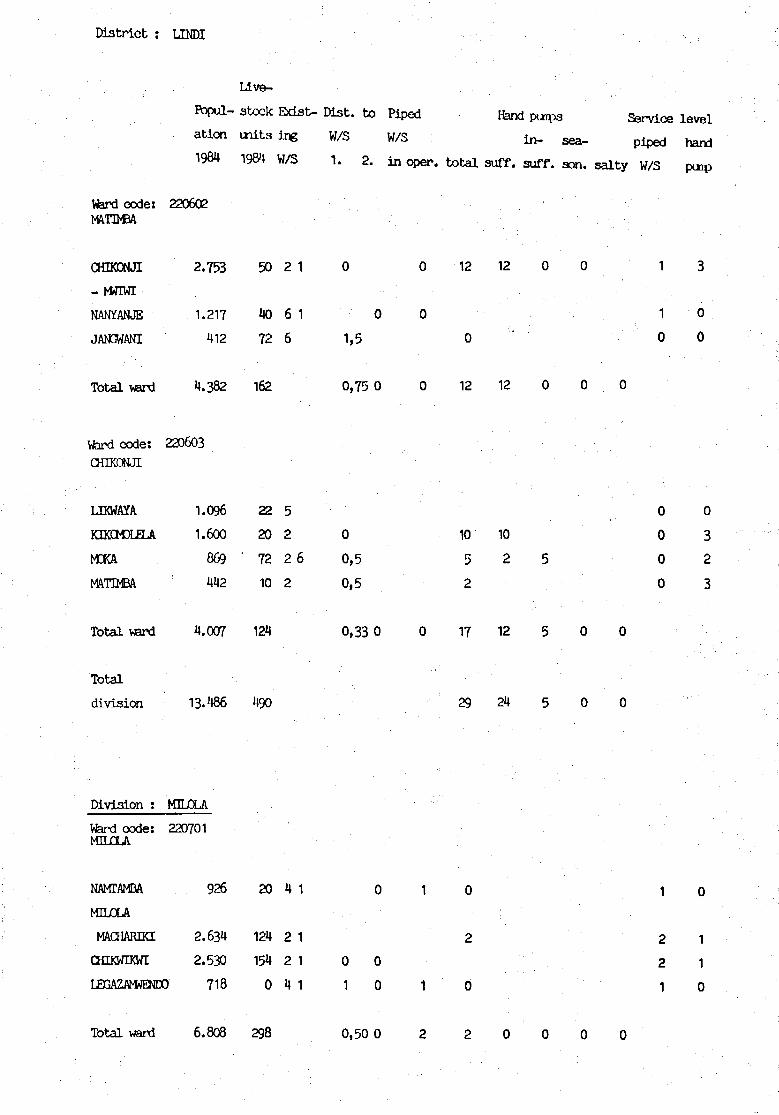
District : LTNDI
Live-
Popul- stock Exist- Dist. to Piped Hand puipa Service level
ation m l t s l n g W/S W/S in- sea- piped hand
1984 1984 W/S 1. 2. i n oper. total suff. suff. son. s a l t y W/S puip
Ward code:MATOEA
CHIKDNJI
- NWIWT
NANYANJE
JAN3WANI
220602
2.753
1.217
412
50
40
72
2
6
6
1
1
0
0
1,5
0
0
12
0
12 12
Total ward 4.382 162 0,75 0 0 12 12 0 0 0
Ward c o d e :CHIKONJI
LIKWAYA
KIXEMXELA
M3CA
MATIMBA
Total ward
Total
division
220603
1.096
1.600
869
442
4.007
13.486
22
20
' 72
10
124
490
5
2
2 6
2
0
0,5
0,5
0,33 0 0
10
52
17
29
10
2
12
24
Divis ion : MHJOLA
Ward code : 220701MKCLA
NAMTAMBA
M H J O L A
MACHARna:
CHIKWIKWI
LEGAZAWEM»
926
2.634
2.530
718
20
124
154
0
4
2
2
4
1
1
1
1
0
1
0
0
0
1 0
0 0
0 0
0 3
0 2
0 3
2 1
2 1
1 0
Total ward 6.808 298 0,50 0

Dist r ic t : UNDI
Live-
Itopul- stock Ebds^ Wat . to Piped Hand puipa Sendee level
ation m i t s ing w/5 W/S i n - sea- piped hand
1984 1984 W/S 1. 2. in oper. t o t a l suff. 3uff. son. s a l t y W/3 puip
ward code:KIWAWA
KTWAWA
MPUIWA
Total ward
Ward oode:ROTAMBA
RUTAMBA
220702
1.354
983
2.337
220703
2.122
RUTAf^A YASASA 3.600
KIN¥0PE(MILOLA) 1.581
MAKANGARA
RUHOMft
RUCHEMI
CHTTQNJI
1.185
758
721
1.003
6
65
71
28
24
10
17
0
0
0
6
4
2 1
2 1
2 4 1
6
6
4
2
1
2
1,50 0
0
0
0,6
0,5
1
0,5
0
0
0
1
0
0
14
20
4
0
0
12
0
14
40
4
12
Total ward 10.971 79 0,65 0 1 50 50
Total
division 20.116 448 52 52
Division : RCNDO
Ward code: cCHIPCNDA.
CHIODYA
MIHANGA.
NTAUNA.
Î20801
1.
RONIXD-CHIPCNDA 1.
Total ward 4.
217
898
974
067
156
2
0
0
2
4
6
6
4
4.
1
1
1
1
8
6
8
8
7.
0
0
0
0
50 0
0
0
0
0
0
0 0
0 0
2
2
30
0
0
0
332
0
0
0
3
1 0
1 0
1 0
1 0
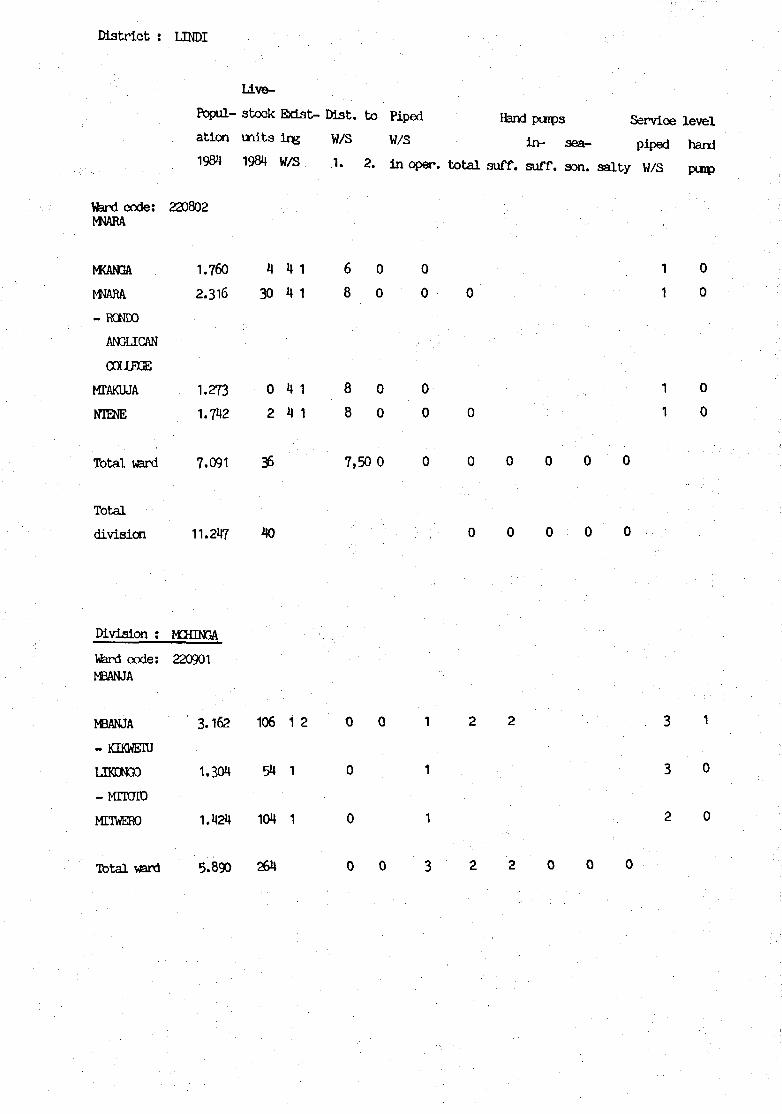
District : LINDI
lAve-
Papul- stock Bdat- Wat. to Piped Hand puipa Service level
ation units ing W/S w/S ^ sea- piped hand
1984 1984 W/S 1. 2. in open, total suff. suff. son. salty W/S pinp
Ward code:MNARA
MCAN3A
MNARA
- RONDO
ANGLICAN
OOLLEQ3
MTAKUJA
WIENE
2 2 0 8 0 2
1.760
2.316
1.273
1.742
30
0
2
4
4
4
4
1
1
1
1
68
8
8
0
0
0
0
0
0
0
0
Total ward 7.091 36 7,50 0
Total
division 11.247 W
Division : MHENGA
Ward code:MBANJA
NBANJA
- KIKWEIU
LJKDNGO
-MTTOTO
MTIWERO
220901
3.162
1.304
1.424
106
54
104
1 2
1
1
0
0
0
0 1
1
1
1 0
1 0
1 0
1 0
3 1
3 0
Total ward 5.890 264 0 0 3 2 2 0 0 0

District : UNDI
Uve-
Popul- stock Exist- Dist. to Piped Hand puipa Service level
ation w i t s ing W/S W/S in- sea- piped hand
1984 1984 W/S 1. 2. in oper. total suff. suff. aon. salty W/S puip
Ward cxxJe:MCHINGA
MCHINGA I
MCHINGA II
MN3MBILA
- LJKAHAKU
RUVU
HTCMANGA
(fOLANGALA)
MHMBIKI1£
220903
1.622
2.190
600
1.007
2.700
783
213
32
104
17
310
104
2
2
2
2
2
3
36
6
6
6
0 0
0,5 1
0,5
0,5
9 5 4
14 14
1 1 0 0
2 2 0 0
3 1 2
0 0
0 3
0 3
0 2
0 1
0 0
Total vard 8.902 781 0,38 0,50 0 29 23 0 6 0
Ward code: 220903KUJOLAMEWANI
MNAN30LE
KILCLAMBWANI
MVULENI
DIMBA
KUIWENI
2.
1.
1.
589
9̂ 0
058
186
769
126
20
56
26
141
5
2
2
6
2
6
6
60,5
0,5
0,5
2 2 0 0
9 8
0 0
0 2
0 3
0 0
0 1
Total warxl 6.542 370 0,50 0 0 17 11
Total
division 21.334 1.415 48 36 12
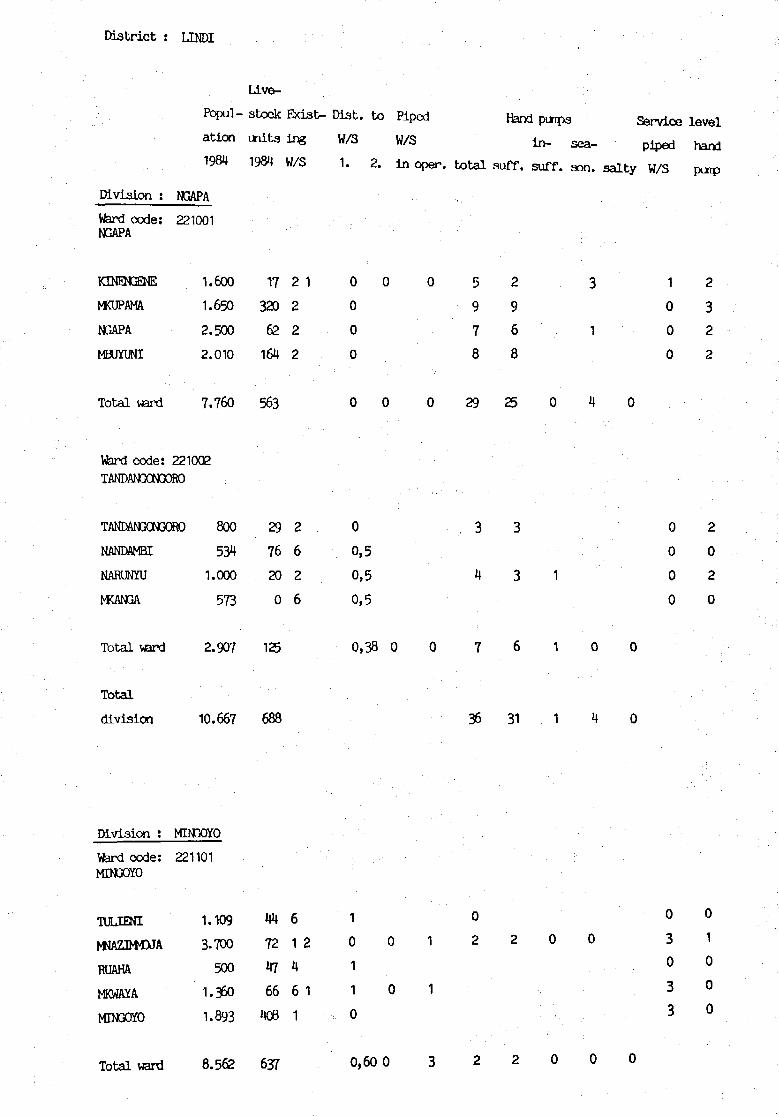
Dis t r i c t : LINDI
Live-
Popul- stock Exis t - Wat . to Piped Hand puips Service level
at ion u i i t a ing W/S W/S m . ^ p l p e d ^
1984 1984 W/S 1. 2. in oper. total suff. suff. son. s a l t y W/S pmp
Division : NGAPA
Ward code: 221001NGAPA
KINENGQE
MCUPAMA
NGAPA
MBUYUNI
T o t a l ward
1.600
1.650
2.500
2.010
7.760
Vferd c o d e : 221002TANDANGON3ORO
TANDANGCNGŒ»
MANDAMHT
NARUNYU
MCANGA
Total vard
Total
division
800
534
1.000
573
2.907
10.667
17
320
62
164
563
29
76
20
0
125
688
2 1
2
2
2
2
6
2
6
0
0
0
0
0
0
0,5
0,5
0,5
0,3
D i v i s i o n : MDCOYO
Vferd c o d e :MTNGOYO
TULJENI
WAZIWDJA
RUAHA
MKWAYA
MTNGOYO
Total ward
221101
1.109
3.700
500
1.360
1.893
8.562
44
72
47
66
408
637
6
1
4
6
1
2
1
1
0
1
1
0
0
36 31
5 2 3 1 2
9 9 0 3
7 6 1 0 2
8 8 0 2
29 25 0 4 0
0 2
0 0
0 2
0 0
0 0 0
2 2 0 0 3 1
0 0
3 0
3 0
0,60 0

District ; LINDI
Live-
Popul- stock Exist- Dlst. to Piped Hand punps Servioe level
ation inits ire W/S W/S in- sea- piped hand
1984 1984 W/S 1. 2. in oper\ total suff. suff. son. salty W/3 puip
Vferd code :WXELA
WOLELA
RUHOKWE
SIMANA
NAMJNDA
ZINGATTA
T b t a l ward
Ward code:KIWALALA
K3WALALA
RUO
WANGAWANGA
NARUNYU
MAHLMBKA
MPEMBE
T o t a l ward
Total
division
221102
3.434
1.034
1.020
828
1.121
7.^37
221103
1.772
818
1.377
1.807
2.300
510
8.584
24.593
134
10
31
27
14
216
18
20
16
16
20
28
118
971
2
1
1
1
6
4
2
2
2
3
3
1
6
6
2 1
3
1
0
0
0
0
0
1,5
0
0
0,75
0
0
0
0,5
0
0,1
0
0
0
0
1 1
3 2 0
11 11
15 14 0
23 20 0
1 2
1 0
2 0
3 0
0 0
1
0
0
0
3
0
1
2
1
3
0
0
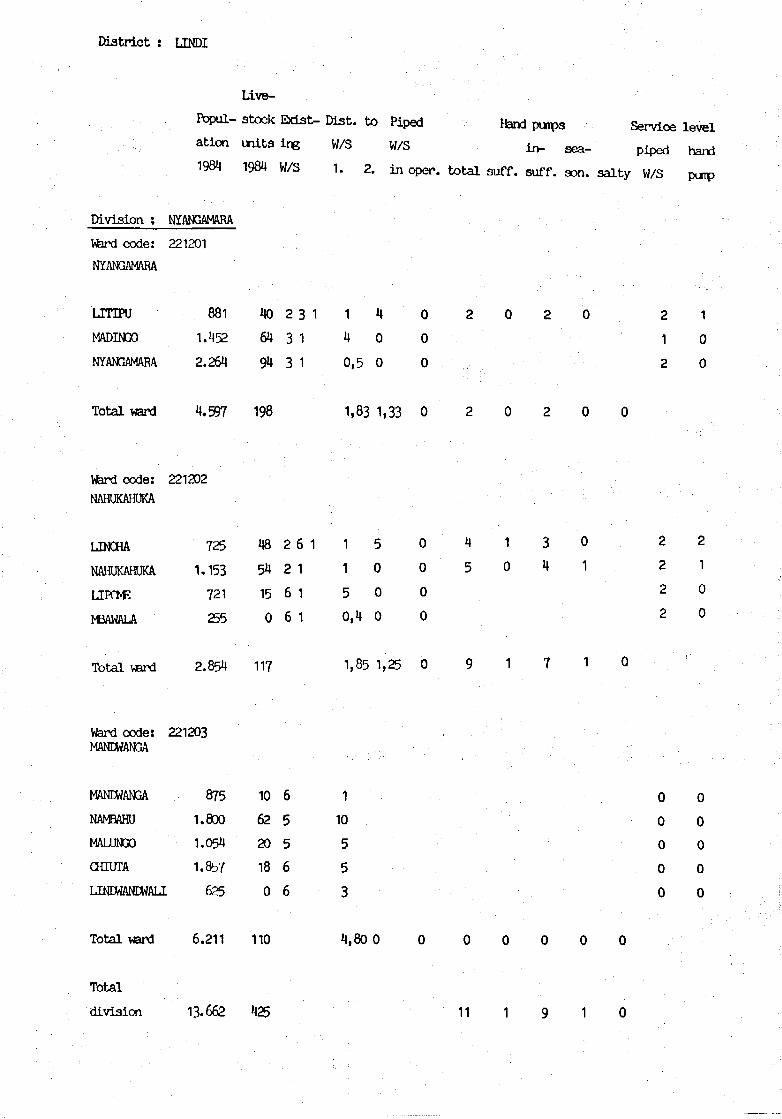
District : LTNDI
Live-
Fopul- stock Exist- Mat. to Piped fend purps Service level
ation mitsing W/S W/S m _ s ^ . plped
1984 1984 W/S 1. 2. in oper. total suff. suff. son. salty W/S
Division : NÏANGAMARA
Ward code:
NYANGAMARA
LITIPU
MADIN3O
NYANGAMARA
Total ward
221201
881
1.452
2.264
4.597
40
64
94
198
2
3
3
3 1
1
1
1
4
0,5
1,83
4
0
0
1,33
0
0
0
0
Ward code:MANDWANGA
MANDWANGA
NAMBAHU
MALUNGO
CfflOTA
LINDHANDHALI
Total ward
221203
875
1.800
1.054
1.&57
625
6.211
10
62
20
18
0
no
6
5
5
6
6
1
10
5
5
3
4.800 0
Total
division 13-662 425 11 1
2 1
1 0
2 0
Ward code:
NAHUKAHUKA
UNCHA
NAHUKAHUKA
IZPOE
MBAWALA
Total ward
221202
725
1.153
721
255
2.854
48
54
15
0
117
2
2
6
6
6 1
1
1
1
1
1
5
o,
1,
5
0
0
4 0
85 1,25
0
0
0
0
0
4
5
9
1
0
1
3
4
7
0
1
1 0
2
2
2
2
2
1
0
0
0 0
0 0
0 0
0 0
0 0

District : LTNDI
Live-
Popul- stock Ebdst- Dis t . t o Piped Hand puipa Servioe l eve l
a t ion i n i t s ing W/S W/S i n - sea - piped hard
1984 1994 W/S 1. 2. in oper. t o t a l suff. suff. son. s a l t y W/S puip
Division :
Ward code:SUDI
SUDI
MIBJU
HMÎAWALI
MADAN3WA
NJQNJO
PANGATHM
Total ward
SUDI
221301
1.658
769
1.806
2.000
740
1.500
8.473
23
154
17
22
no6
251
3
2
2
6
3
2
1
6
1
6
6
0,5
0,5
0,5
1,5
0,5
0,70
0
0
0
0
0
0
0
3
3
0
3
2
11
2
3
2
7
Ward c o d e :NACHUNYU
PAN3AB0I
M3ANGI
KTKMBIKWELA
NACHUNYU
NMJMBU
SHUKA
NNALI
NAVANGA
- M3NGOOC0
NAMPUNGA
Total ward
Total
division
Total
district
221302
900
480
1.251
1.852
712
468
1.260
837
4H1
8.201
16.674
259.982
51
14
40
65
30
16
26
16
16
274
535
7.604
3
2
32
6
5
6
6
3
1
6
1
1
1
0
1
0
1
0
0
0
0
0,5 0
0,50 0
16
494 418 22 53
0
1
0
1
0
0
0
2
2
0
2
1
0 2 0
1 0 0 1 1 0
0 0 0
4 0 1 3 1 1
0 0 0
0 0 0
0 0
0 0

23 LIWALE DISTRICT
Divisions
01 Kibutuka
02 Liwale
03 Makata
Wards
01
02
03
04
01
02
03
04
05
06
07
01
02
03
04
NanganoKibutuka
Kiangara
Mirui
Liwale
Mihumo
Ngongowele
Mbaya
Mpigarmiti
Kimambi
Liwale Mjini
Barikiwa
Makata
Mkutano
Mlembwe
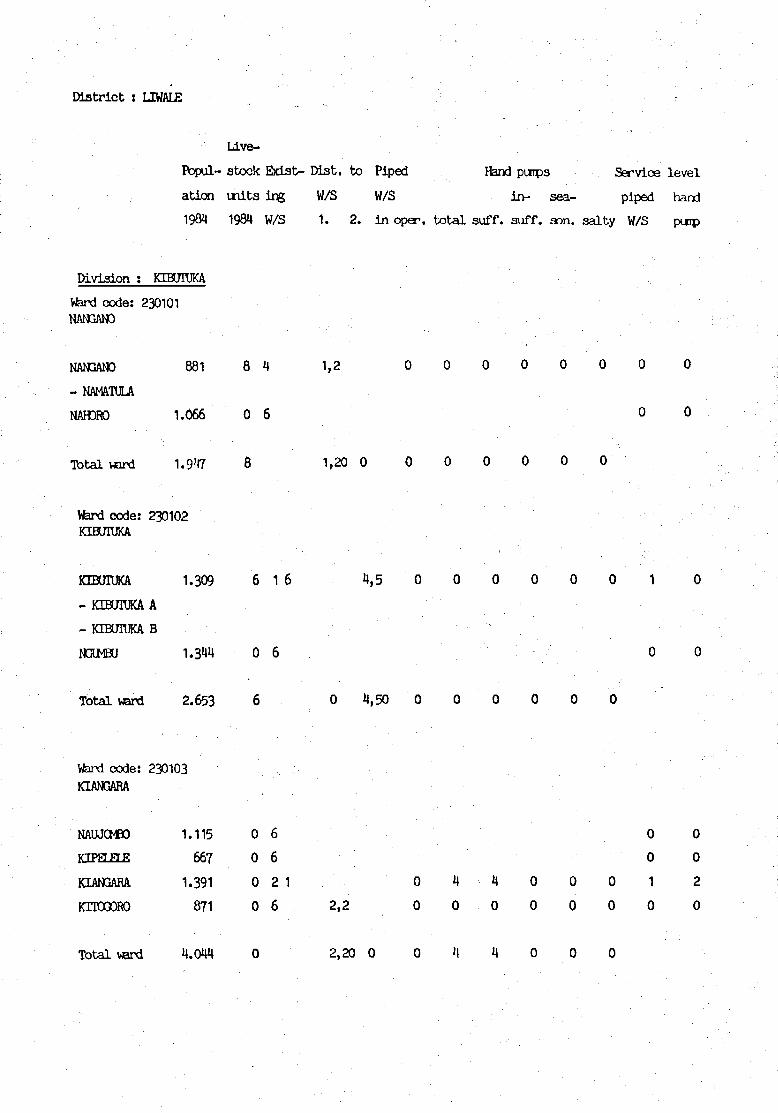
Dis t r ic t : LIWALE
U v e -
Fopul- stock Ebdst- Wa t . to Piped Hand purps Service level
at icn i n i t s ing W/S W/S in- sea- piped hard
1984 1984 W/S 1. 2. in open, total suff. suff. son. salty W/S puip
Division : K3HJIHKA
Ward code:NANGANO
NAN3AN0
- NAMATULA
NAHDRO
230101
1
881
.066
8 4
0 6
1,2 0 0 0 0 0 0 0 0
Total ward 1.947 8 1,20 0 0 0 0 0 0 0
Ward code: 230102FCTEUIUKA
1.309 6 1 6 4,5 0 0 0 0 0 0 1
- KŒUITKA A
NGIMBU 1.3«W 0 6 0
Total ward 2.653 6 0 4,50 0 0 0 0 0 0
Ward code:KIANGARA
NAUJCMBO
KIANGARA
KnOOORO
230103
1
1
.115
667
.391
871
0
0
0
0
6
62 1
6
0 0
0 0
0 4 4 0 0 0 1 2
2,2 0 0 0 0 0 0 0 0
Total ward 4.044 0 2,20 0
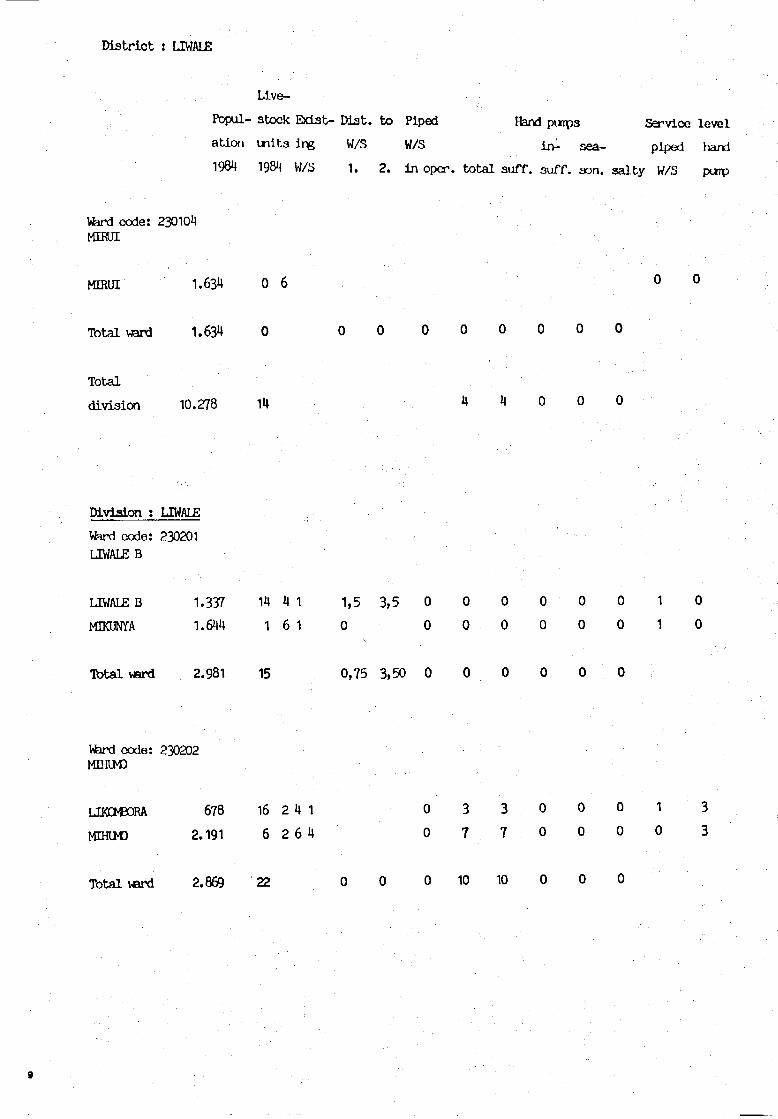
D i s t r i c t : LIWALE
Llve-
Popul- stock Exis t - M a t . to Piped Hand putpa Servioe level
at lon u i i t s ing W/S W/3 i n - sea - piped hand
1984 1984 W/3 1. 2. i n oper. t o t a l suff. suff. son. s a l t y W/S purp
Ward code: 230104MIBUI
MTRUI 1.634 0 6
Total ward 1.634
Total
division 10.278 0 0
Diviaion : LIWALE
Ward code: 230201UWALEB
LIWALE B 1.337 14 4 1 1,5 3,5 0 0 0 0 0 0 1 0
MTKUNYA 1.644 1 6 1 0 0 0 0 0 0 0 1 0
Tbtal ward 2.981 15 0,75 3,50 0 0
Ward code: 230202MIHIM)
MIHIM)
678 16 2 4 1
2.191 6 2 6 4
0
0
3
7
3
7
0
0
0
0
0
0
1
0
3
3
Total ward 2.869 22 10 10 0 0
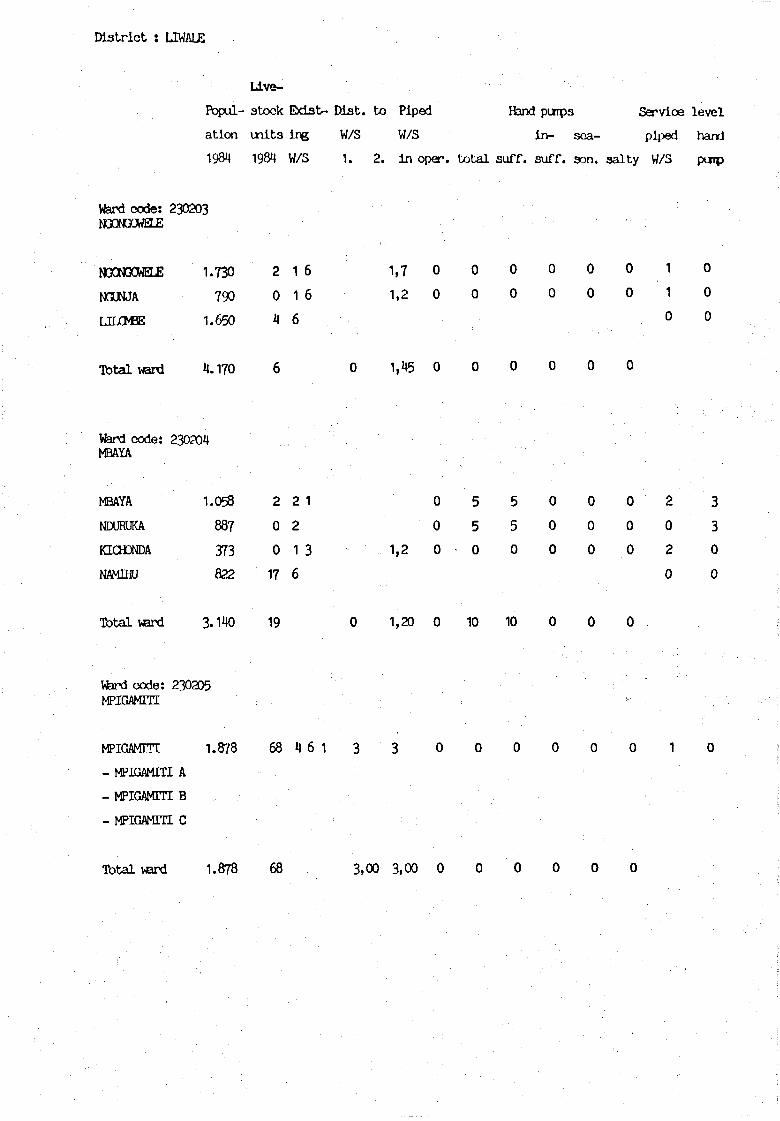
Dis t r i c t : LIWALE
Ltve-
Popul- stock EbdaU Dist. to Piped Hand puips Service level
ation mi ta Ing W/S W/S in- sea- piped hand
1984 1984 W/S 1. 2. lu oper. total suff. suff. aon. salty W/S puip
Ward c o d e :NGONGOWELE
N3CNOOWELE
NGUNJA
ULdfiE
Total ward
230203
1.730
790
1.650
4.170
2
0
4
6
1
1
6
6
6
0
1
1
1
,7,2
0
0
0
0
0
0
0
0
0
0
0
0
0
0
0
0
0
0
1
1
0
0
0
0
Ward code: 230204MBAYA
MBAYA
NDURUKA
KKH3NDA
NAMMJ
Total ward
1.058
887
373
822
3.140
Ward code: 230205MPIGAMITI
MPIGAMm
- MPIGAMITI A
-MPIGAMm B
- MPIGAMITI C
Tota l ward
1.878
1.878
2
0
0
17
19
68
68
2 1
2
1 3
6
4f
0
0
1,2 0
5
5
0
5
5
0
1,20 0 10 10
0
0
0
0
0
0
0
0
0
2 3
0 3
2 0
0 0
3,00 3,00 0

District : LIWALE
Llve-
Popul- stock Ebdst- Dist. to Piped Hand punp3 Service level
ation units ing W/S W/S in- sea- piped hand
1984 1984 W/S 1. 2. in oper. total suff. suff. son. salty W/3 puip
Ward code: 230206KIMAMBI
KIMAMBI 1.233 0 2 6 5 M 0 0 1
Tbtal ward 1.233 0 0 0 0 5 4 0 0 1
Ward code: 230207LJWALEMJINI
NALULEO
MJNOJfflM)
LJKDNGOWELE
MAKONJIANGA.
NANGANDO
MANGIKEKTEI
KJTULE
T o t a l ward
Total
division
723
3.043
2.111
1.539
2.284
973
1.644
12.317
28.588
7
9
13
20
4
15
9
76
206
4
1
1
1
1
1
1
2
4
4
2
4
4
M
1
2
2
4
2
1,2
2,2
1,7
1,7
2,2
1,7
1,2
1,20 1,78
0
1
0
0
1
0
0
2
2
5
0
0
7
32
0
0
0
5
0
0
0
5
29
0
0
0
0
0
0
0
0
0
0
0
0
0
0
0
0
0
0
0
0
0
0
0
0
0
0
1
2
2
2
2
2
1
2
1
1
1
1
1
0
0
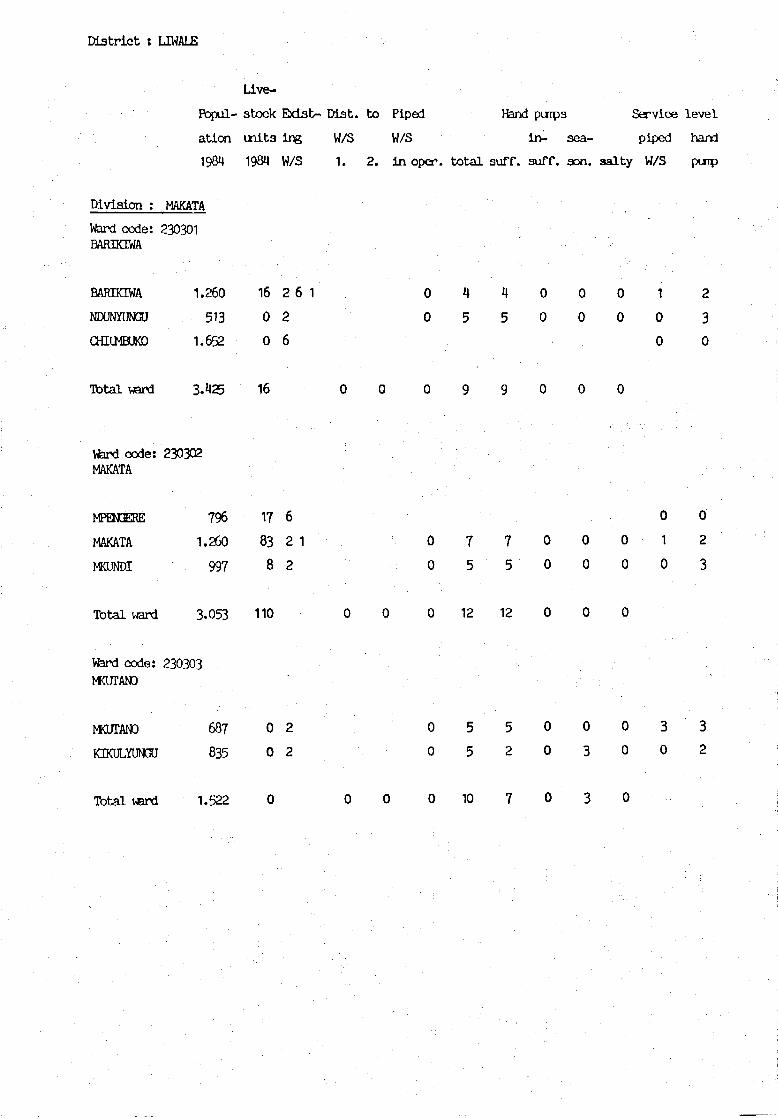
District : LIWALE
Uve-
Fopul- stock Exist- Dist. to Piped Hand purtpa Service level
ation wits ing W/S W/S in- sea- piped hard
1984 1984 W/S 1. 2. in ops', total auff. suff. son. salty W/S purp
Division : MAKATA
Ward c o d e :BAREaWA
BAKEKIWA
NDUNYUNGU
CHItMBUKD
î b t a l ward
Ward code:MAKATA
MPENŒRE
MAKATA
MKUNDI
T o t a l ward
Ward code :MKUTANO
MOTANO
KMJLYUNGU
T o t a l ward
230301
1.260
513
1.652
3.425
230302
796
1.260
997
3.053
230303
687
835
1.522
16
0
0
16
17
83
8
110
0
0
0
26 1
2
6
6
2 1
2
2
2
0
0
4
5
4
5
0
0
0
0
0
0
1
0
0
2
3
0
0
0
75
75
0
0
0
0
0
0
0
1
0
0
2
3
0 12 12
0
0
5
5
10
5
2
0
0
0
30
0
30
32
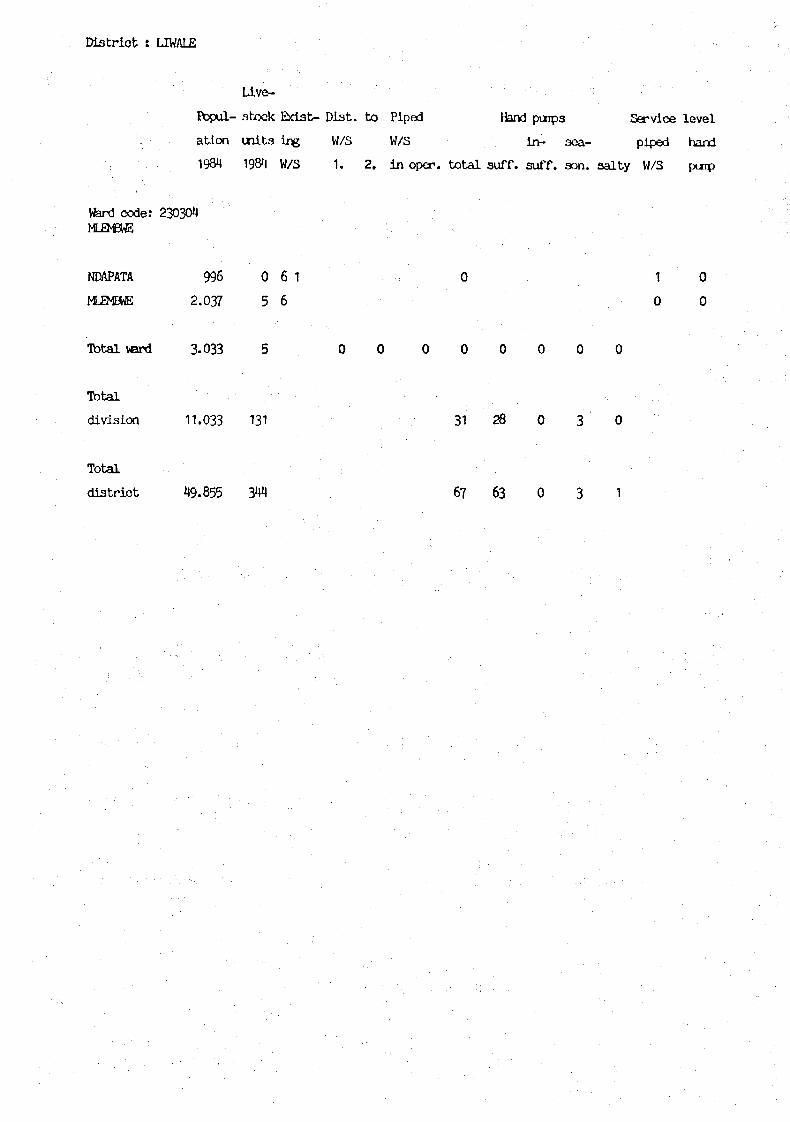
Dis t r i c t : LIWALE
• L i v e - " ; ' " • ' ' ; ' ' . • " : ' • ' • ' • • • • ; • ' • • ' ' ' ' '' '
Popul- stock Exist- Wat. to Piped Hand pinpa Service level
ation units ing W/3 W/S in- sea- piped hand
1984 1984 W/3 1. 2. In oper. total suff. suff. son. salty W/3 puip
Ward code:MLEMBWE
NDAPATA
MLEMBWE
Total ward
Total
division
Total
district
230304
996
2.037
3-033
11.033
49.855
0
5
5
131
344
6 1
6
31 28
67 63 0 3 1
1 0
0 0

24 NACWNGWEA DISTRICT
Divisions
01 Kilimarondo
02 Lionja
03 Mnero
04 Ruponda
05 Nambambo
06 Nambambo Mjini
Wards
01
02
03
04
01
02
03
01
02
03
04
01
02
03
04
01
02
03
04
05
06
01
02
03
04
05
Kilimarondo
Matekwe
Mbondo
Kiegei
Lionja
Nditi
Namikango
Mnero Miembeni
Mnero Ngongo
Kipara
Namapwia
Ruponda
Marambo
Chiola
Mkoka
NaipangaNdomoni
Mkotokwyana
Mpiruka
Naipingo
Mtua
Nambambo
Kilimani Hewa
Nangowe
Stesheni
Namatula

District : NACHINMEA
Uves-
Popul- stock Exist- Diat. to Piped Hand punrps Service level
ation inita ing W/S W/S in- sea- piped hand
1904 19S1» W/S 1. 2. in oper. t o t a l suff. suff. son. s a l t y W/S
Pi vision : tCTLIMftRCMDO
Vfard code: 240101KUJMARCNDO
KILIMARCNDO 1.100 0 1 2 0 0,5 0 ..10 10 0 0 0 2 3
- SEBULENI
- NJAPEJE
- NAMAKONO
- ANURU
NAMATUNU 1.320 2 2 6 2,2 1,2 3 3 0 0 0 0 2
NANJIHI 1.320 0 2 3 6 1,2 2 2 0 0 0 0 2
Total ward 3.740 2 1,13 0,85 0 15 15 0 0 0
Vfard code: 2U0102MATEKWE
MATEKWE 3.085 45 1 2 6 0 1,7 0 3 3 0 0 0 1 1
- MAJONANGA
T o t a l ward 3.035 45 0 1,70 0 3 3 0 0 0
Ward code: 240103MBCNDO
MBONDO 1.299 2 1 2 6 0 1 ,2 0 6 6 0 0 0 1 3
CHBEQIDENGA 1.062 1 1 2 0 0,7 0 6 6 0 0 0 1 3
NAKALONJI 992 0 6 1 1,2 0 0 0 0 0 0 0 2 0
NAH3MBA 749 0 1 2 0 2,7 0 4 4 0 0 0 2 3
Total ward 4.102 3 0,30 1,15 0 16 16 0 0 0
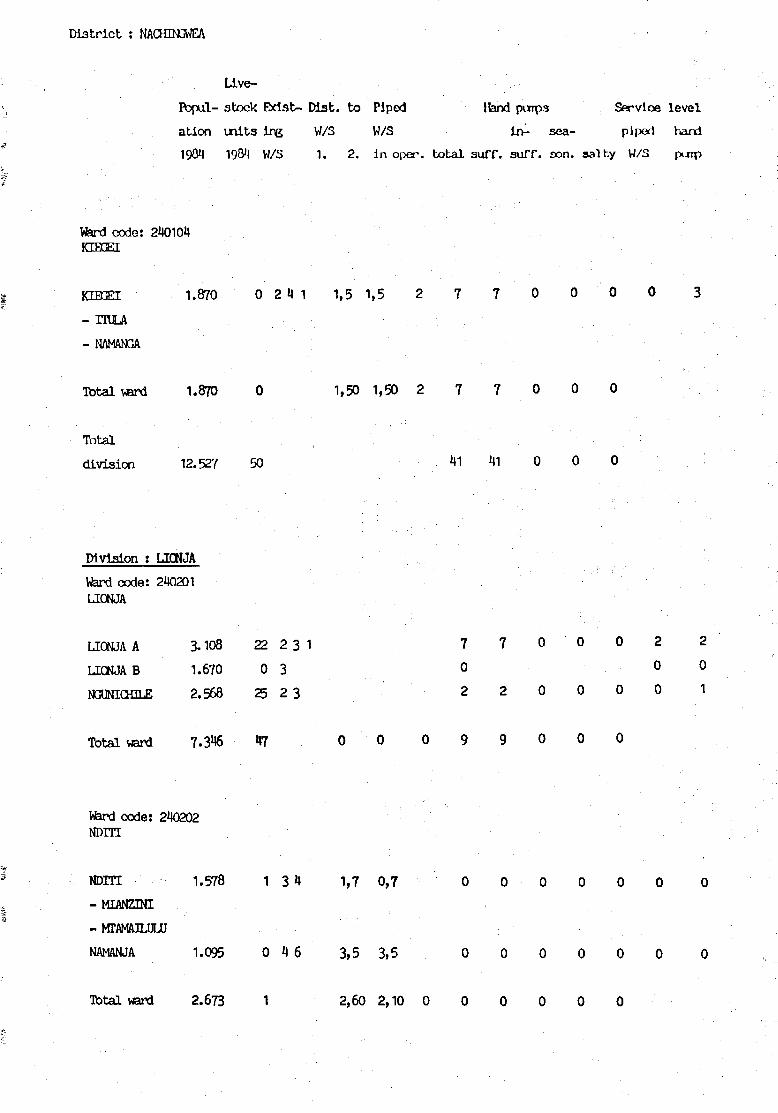
Distr ict : NACHOCWEA
Llve-
îbpul- stock Exist- Wat. to Piped Hand punpa Service level
ation in i t a i r e W/5 W/5 in- sea- piped hand
19G4 19fVl W/S 1. 2. in oper. total suff. 3uff. son. sa l ty W/5
Vfard code: 2110104KMEI
KM£L 1.870 0 2 1» 1 1,5 1,5 2 7 7 0 0 0 0 3
- ITULA
- NAMANGA
T o t a l ward 1.870 0 1,50 1,50 2 7 7 0 0 0
Total
division 12.527 50 41 11 0 0 0
D i v i s i o n î UONJA
Vfard c o d e : 240201LIONJA
LIONJA A
LICNJA B
NGUNICHILE
3.108 22 2 3 1
1.670 0 3
2.568 25 2 3
7 7 0 0 0 2 2
0 0 0
2 2 0 0 0 0 1
Total ward 7.346 47 0 0 0 9 9 0 0 0
Vfard code: 240202NDITI
N o m 1.578 1 3 4 1,7 0 ,7
- M I A N Z I N I
-MTAMAJLUUJ
NAMANJA 1.095 0 4 6 3,5 3,5
0 0 0 0 0 0
0 0 0 0 0 0
Total ward 2.673 1 2,60 2,10 0 0 0 0 0 0
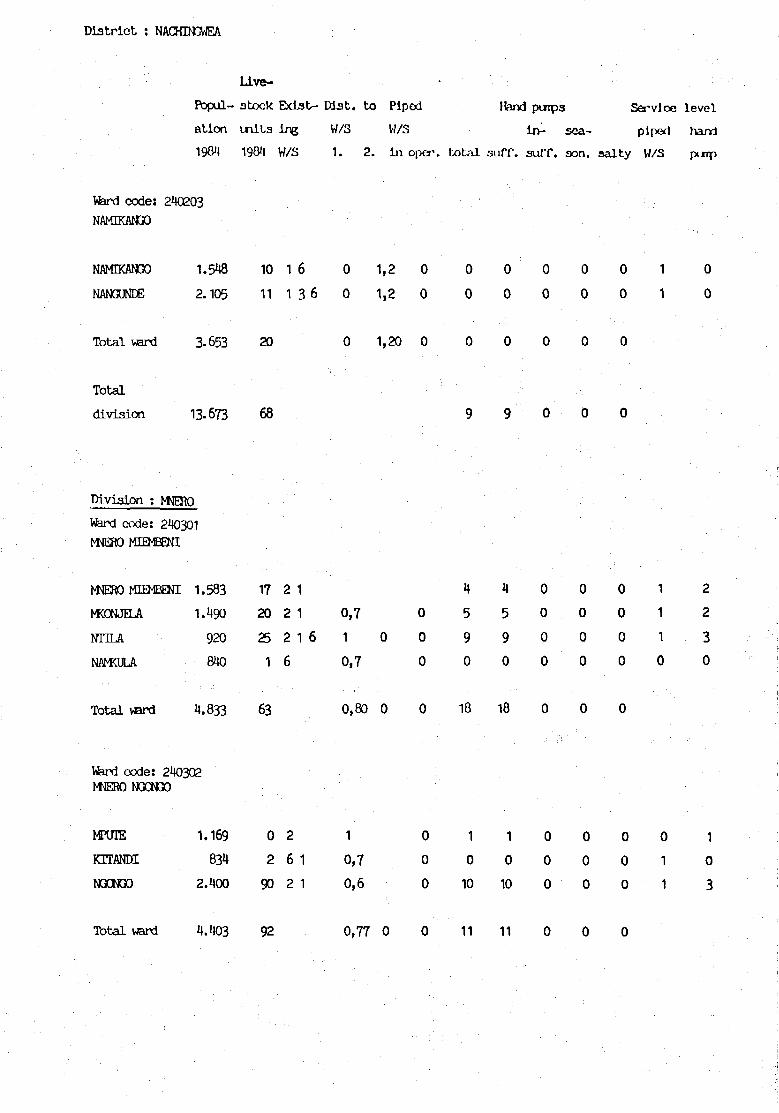
D i s t r i c t : NACTHNGWEA
Llve-
Fbpul- stock E>&3t> Wat. to Piped Hand puips Servloe level
ation units Ing W/S W/S In- sea- piped harri
1904 1904 W/S 1. 2. in oper. total suTC. suTf. son. salty W/S [x»tp
Ward code: 240203NAMIKAN3O
NAMDCAN3O 1.548 10 1 6 0 1,2 0 0 0 0 0 0 1 0
NANGUNDE 2.105 11 1 3 6 0 1,2 0 0 0 0 0 0 1 0
Total ward 3.653 20 0 1,20 0 0 0 0 0 0
Total
division 13.673 68 9 9 0 0 0
Division :
Ward code: 240301
MtëKO MŒMBENI
WER0 MIEMBENI 1.583
MCONJELA 1.490
NTILA 920
NANKULA 840
Total ward 4.833 63 0,80 0 0 18 18 0 0 0
Ward code: 240302WERONQONGO
17
20
25
1
2
2
2
6
11
1 60,7
1 0
0,7
0
0
0
4
5
9
0
i\
5
9
0
0
0
0
0
0
0
0
0
0
0
0
0
1
1
1
0
2
2
30
1.169 0 2 1
KTTANDI 834 2 6 1 0,7
NGONGO 2.400 90 2 1 0,6
Total ward 4.403 92 0,77 0 0 11 11
0
0
0
1
0
10
1
0
10
0
0
0
0
0
0
0
0
0
0
1
1
1
0
3
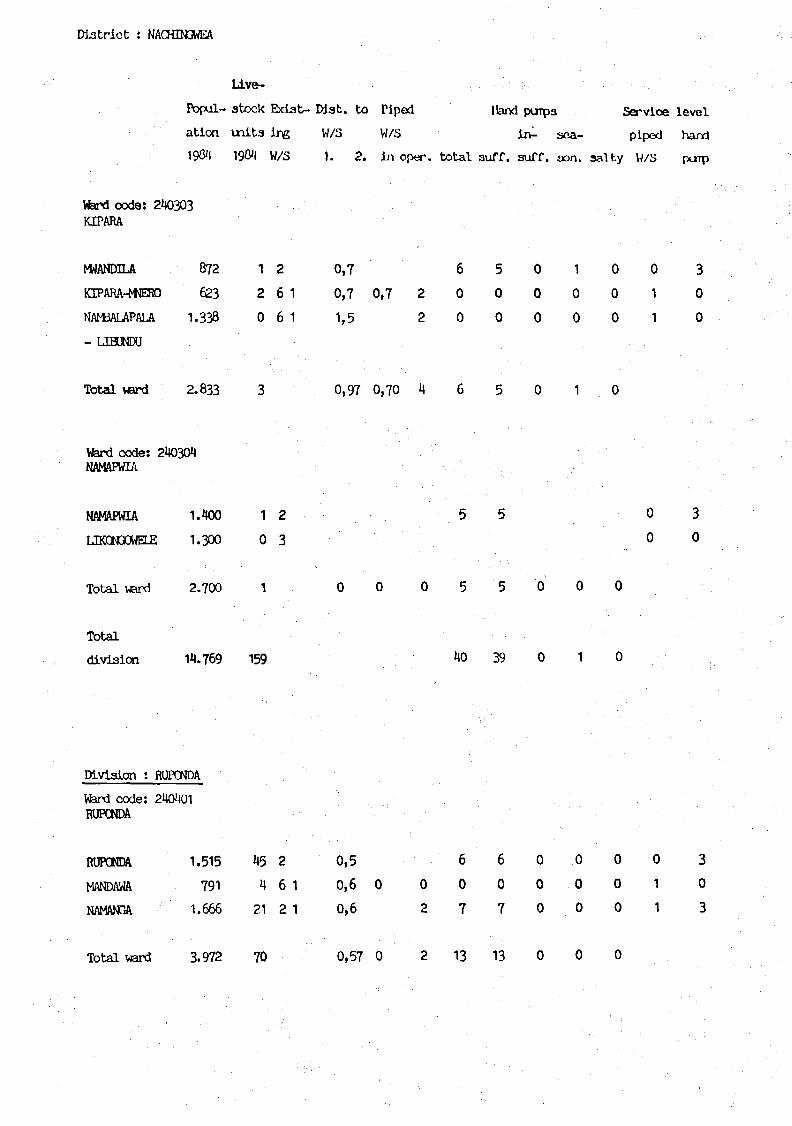
D i s t r i c t : NACHINCMEA
Llve-
Popul- stock Exist- Dlst . bo Piped Hand punpa Servloe level
ation i n i t a i r e W/S W/3 In- sea- piped harrf
^9&^ WS 1. 2. In oper. total auff. suff. oon. salty W/S
Division : RUPONDA
Vfard code: 240303HPARA
WANDEJV 872 1 2 0,7 6 5 0 1 0 0 3
HPARA-MŒB0 623 2 6 1 0,7 0,7 2 0 0 0 0 0 1 0
NAMBALAPALA 1 .338 0 6 1 1,5 2 0 0 0 0 0 1 0
- LIBUNDU
Total ward 2.833 3 0,97 0,70 4 6 5 0 1 0
Ward code: 240304NAMAPWIA
NAMAPWIA 1 .400 1 2 5 5
IJKONXWELE 1.300 0 3
Total ward 2.700 1 0 0 0 5 5
Total
division 14.769 159 **0 39
Vferd code:RUPONDA
RUPONDA
MANDAWA
NAMANGA
Total ward
240401
1.515
791
1.666
3.972
45
4
21
70
2
62
1
1
0,5
0,6
0,6
0,57
0
0
0
2
2
60
7
13
60
7
13
0
0
0
0
0
0
0
0
0
0
0
0
0
1
1
30
3
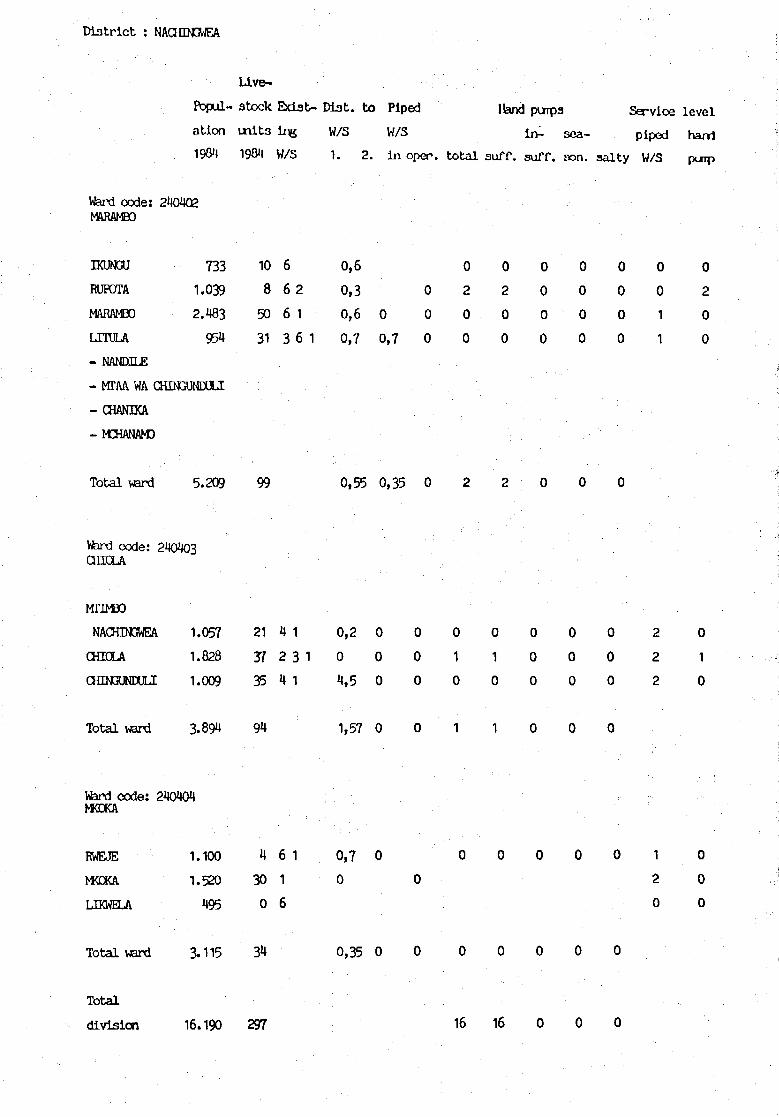
District : NACHINCWEA
Llve-
Fbpul- stock Exist- Dist. to Piped Hand purpa Service level
atlon uni ts ins, W/S W/S i^ sea- piped hard
19GM W/S 1. 2. in oper. to ta l auff. suff. aon. sa l ty W/5
Ward code: 240402MARAMBO
KUNGU 733 10 6 0,6 0 0 0 0 0 0 0
R U P O T A 1 . 0 3 9 8 6 2 0 , 3 0 2 2 0 0 0 0 2
MARAMBO 2.^83 50 6 1 0,6 0 0 0 0 0 0 0 1 0
umJLA 954 31 3 6 1 0,7 0,7 0 0 0 0 0 0 1 0
- NANDILE
- MTAA WA CffiNGUNDOI
- CHANIKA
-MCHANAM)
Total ward 5.209 99 0,55 0,35 0 2 2 0 0 0
Vfard code: 240403CHICLA
MTIMB0
NACHINGÎWEA 1.057 21 4 1 0,2 0 0 0 0 0 0 0 2 0
CHICLA 1.828 3 7 2 3 1 0 0 0 1 1 0 0 0 2 1
CHINGUNDULI 1.009 35 4 1 4,5 0 0 0 0 0 0 0 2 0
Total ward 3.894 94 1,57 0 0 1 1 0 0 0
Ward code: 240404IWQKA
RWEJE 1.100 H 6 1 0 ,7 0 0 0 0 0 0 1 0
MKDKA 1.520 30 1 0 0 2 0
LJKWELA 495 0 6 0 0
Total ward 3.115 34 0,35 0 0 0 0 0 0 0
Total
division 16.190 297 16 16 0 0 0
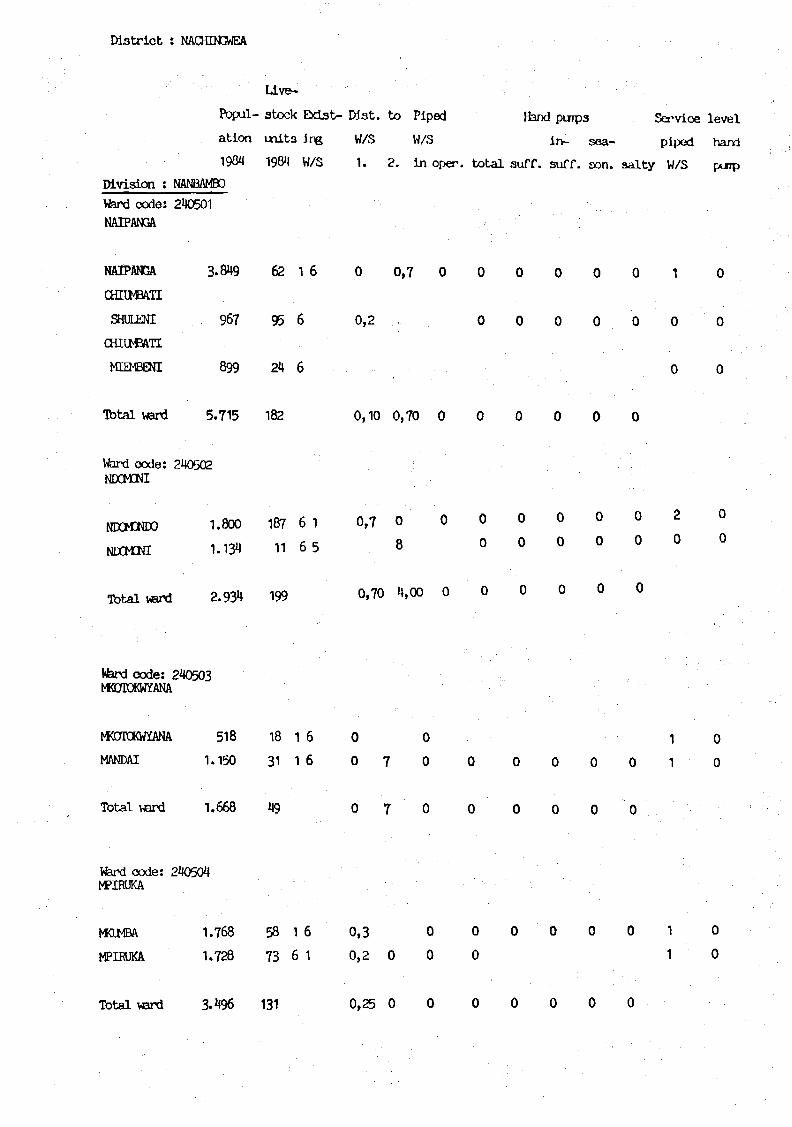
District : NACHINGWEA
• ; ; : • " ' L i v e - " ' •' ' "•• ' ' \ • • •:' ; • ' • ' •.-.••• ; •'
Fopul- stock Ebdst- Dist. to Piped Hand purpa Servloe level
ation tnita ing W/S W/3 In- sea- piped hard
19ÛU 198»! W/S 1. 2. in oper. total suff. suTf. oon. salty W/S puipDivision ; NANBAMBOWard code: 240501NAIPANGA
NAIPM3A 3-849 6 2 1 6 0 0 , 7 0 0 0 0 0 0 1 0
ŒHIMBATI
SHULENI 967 95 6 0,2 0 0 0 0 0 0 0
CHIUBATI
MTEMBENI 899 24 6 0 0
T b t a l ward 5 .715 182 0,10 0,70 0 0 0 0 0 0
Ward oode: 240502NDCMCNI
NDCKWDO 1.800 1&7 6 1 0,7 0 0 0 0 0 0 0 2 0
wmm 1-134 11 6 5 . 8 o o o o o o o
Total «ard 2.934 199 0,70 4,00 0 0 0 0 0 0
Ward oode: 240503MKOTOKWÏANA
MOTOKWYANA 518 18 1 6 0 0 1 0
MANDAI 1.150 31 1 6 0 7 0 0 0 0 0 0 1 0
Total ward 1.668 49 0 7 0 0 0 0 0 0
Ward code: 240504MPIHUKA
MQMBA 1.768 5 8 1 6 0 , 3 0 0 0 0 0 0 1 0
MPIRUKA 1.728 73 6 1 0 ,2 0 0 0 1 0
Tota l ward 3.496 131 0,25 0 0 0 0 0 0 0
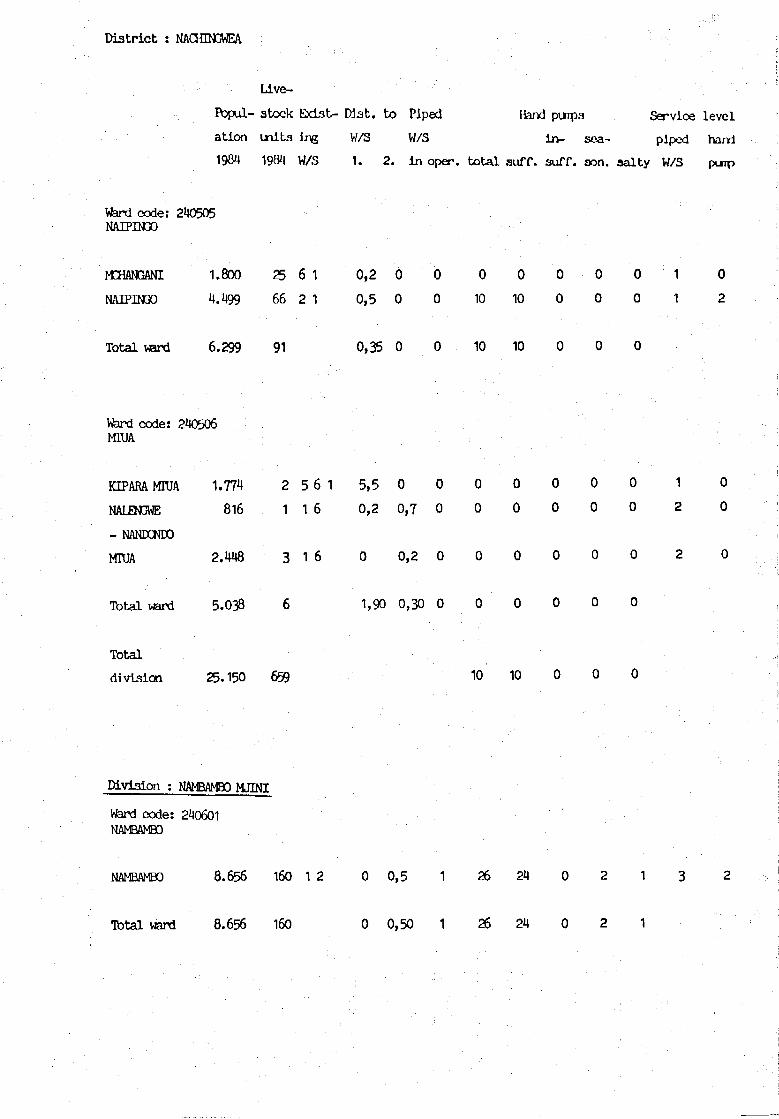
District : NACHINGWEA
Live-
Popul- stock Exist- DIat. to Piped Hand punpa Service level
ation tn i ts ing W/3 W/S lx>- sea- piped hard
198*1 W/S 1. 2 . In oper. total suff. suff. aon. salty W/S purp
Ward code: 240505NAIPDGO
MCHANGANI 1.800 25 6 1 0,2 0 0 0 0 0 0 0 1 0
NAIPEGO 4.499 66 2 1 0,5 0 0 10 10 0 0 0 1 2
Total ward 6.299 91 0,35 0 0 10 10 0 0 0
Ward code: 240506MTUA
KIPARA MTUA 1.774 2 5 6 1 5 , 5 0 0 0 0 0 0 0 1 0
NALEN3WE 8i6 1 1 6 0,2 0,7 0 0 0 0 0 0 2 0
- NANDCNDO
MTOA 2.448 3 1 6 0 0,2 0 0 0 0 0 0 2 0
Tbtal ward 5.038 6 1,90 0,30 0 0 0 0 0 0
Total
division 25.150 659 10 10 0 0 0
Division : NAMBAMBO MJINI
Ward code: 240601NAMBAMBO
NAMBAMBO 8.656 160 1 2 0 0,5 1 26 24 0 2 1 3
Total ward 8.656 160 0 0,50 1 26 24 0 2 1
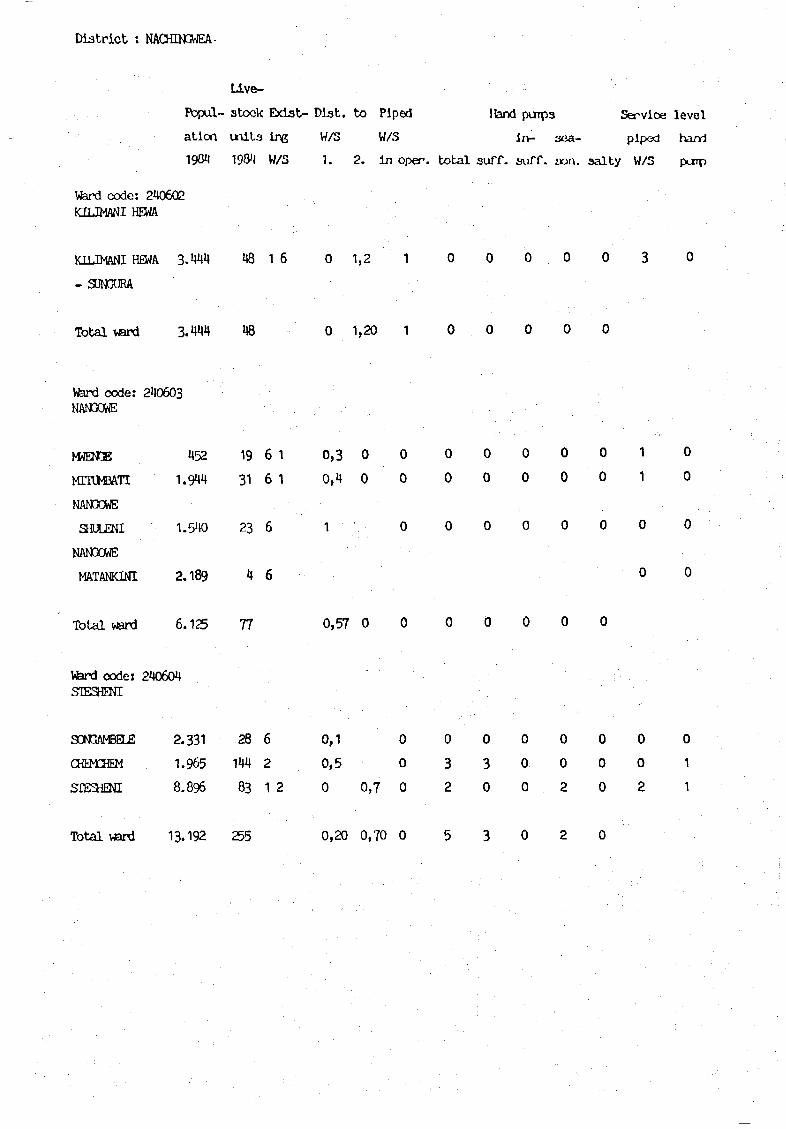
Dis t r i c t : NACHIN3WEA
L4.V&-
Rjpul- stock Esdat- Dist . to Piped Hand puipa Service level
ation uni t s ing W/S W/S i iv sea- piped hand
1984 1901* W/S 1. 2. in oper. t o t a l suff. suff. Don. sa l ty W/3
Ward code: 240602KUJMANI HEWA
KUJMANI HEWA 3. U4U 48 1 6 0 1,2 1 0 0 0 0 0 3 0
- SUNGURA
Total VJard 3 . ^ 4 *J8 0 1,20 1 0 0 0 0 0
Ward code: 240603NAN30WE , : '
452 19 6 1 0,3 0 0 0 0 0 0 0 1 0
1.944 31 6 1 0,4 0 0 0 0 0 0 0 1 0
NANGOWE
SHULENI 1.540 23 6 1 0 0 0 0 0 0 0 0
NAN3OWE
MATANKINI 2 .189 4 6 0 0
Total waril 6.125 77 0,57 0 0 0 0 0 0 0
Ward code: 240604STESHENI
30M3AMBELE 2.331 28 6 0,1 0 0 0 0 0 0 0 0
CHETOŒM 1.965 144 2 0,5 0 3 3 0 0 0 0 1
SIESHENI 8.896 83 1 2 0 0,7 0 2 0 0 2 0 2 1
Total ward 13-192 255 0,20 0,70 0 5 3 0 2 0
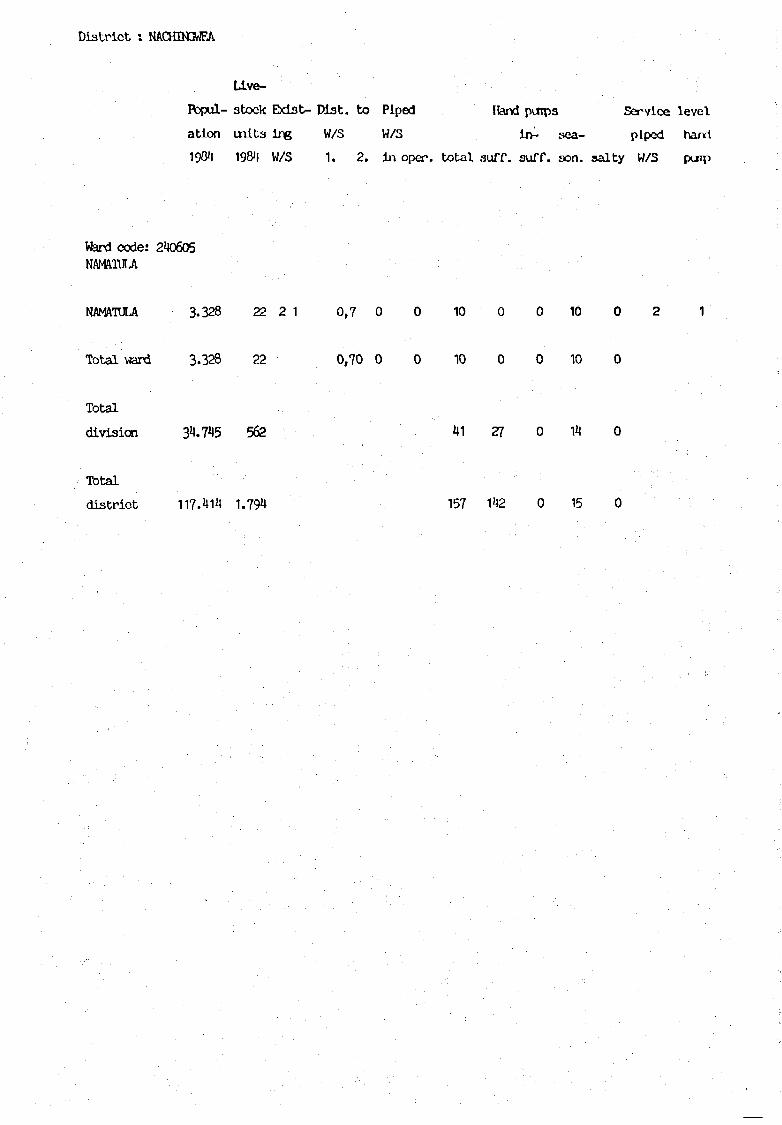
Dis t r i c t : NACHHCWEA
Ltve-
l - stock Ebdst- Wat , to Piped Hand ptfrpa Service level
atlon uni ts in& W/5 W/3 lr>- sea- piped hani
19Û4 1984 W/S 1. 2. i n oper. t o t a l auff. suff. son. s a l t y W/S
Vferd (Xde: 240605NAMATULA
NAMATOLA 3.328 22 2 1 0,7 0 0 10 0 0 10 0 2 1
Total ward 3.328 22 0,70 0 0 10 0 0 10 0
Total
division 31.745 562 41 27 0 14 0
Total
district 117.414 1.794 157 142 0 15 0

25 LINDI TOWN
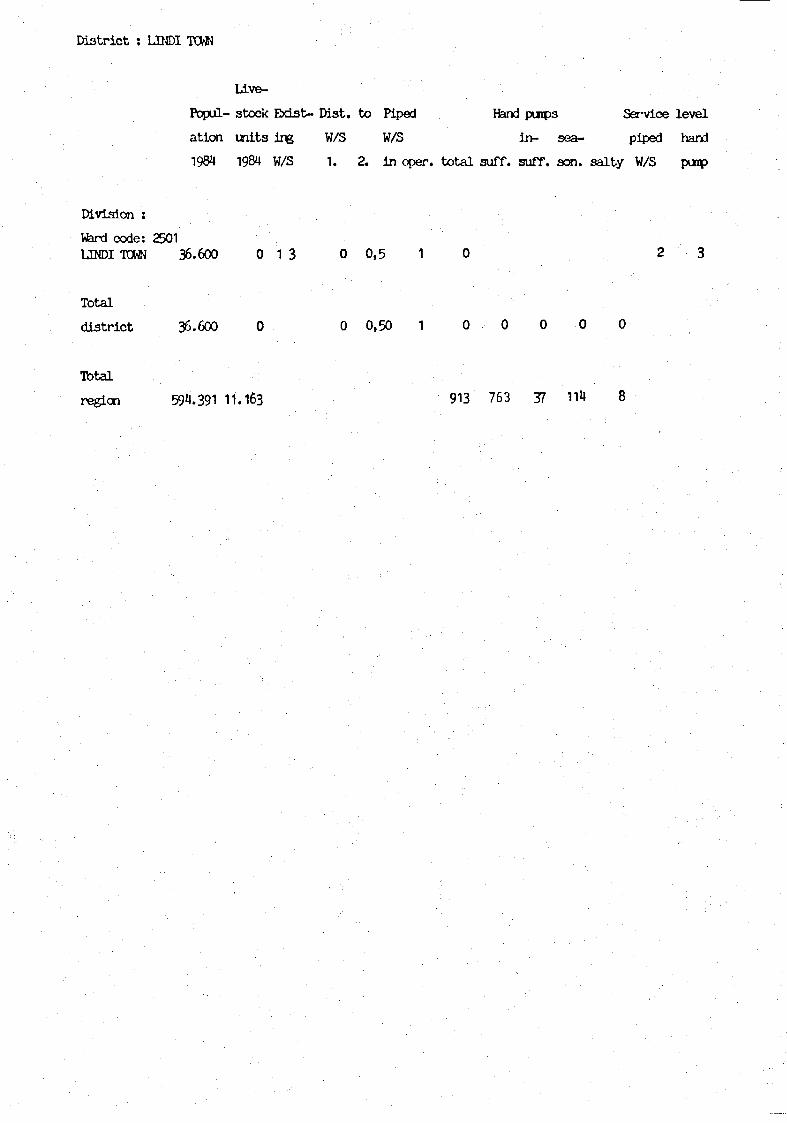
Distr ic t ; UNDI TOWN
Live-
Popul- stock Exist- Dist. to Piped Hand puips Service level
ation tnits ing W/S W/S in- sea- piped hand
1984 1984 W/S 1. 2. in oper. total suff. suff. aon. salty W/S punp
Division :
Ward code: 2501UNDI TOWN 36.600 0 1 3 0 0,5 1 0 2 3
Total
distr ict 36.600 0 0 0,50 1 0 0 0 0 0
Total
region 594.391 11.163 913 763 37 111» 8
APPENDIX 4
SELECTED VILLAGE DATA
1. Use of different types of water supplies
Main water supply
Secondary water supply
2. Distance to main water supply
3. Service level of water supplies
4. Existence of pit latrines in households

MASASI DISTRICT
Use of Different Types of Water Supplies
1. priority:
2. priority:
Total:
the main water supply
the secondary water supply
coverage of a certain type of water supply regardless of its
priority
Piped W/SHand pumpOpen wellRiverDamOpen pitSpringRainwater
1 .
no of
priority
villages people
54
58
1
17
1
74
0
0
105.828
81 .249
1.244
17.149
1.674
99 .213
0
0
34
26
0
5
0
32
0
0
*
,54
,52
, 4 1
,60
,55
,38
2 .
no of
priority
villages people
16
20
16
29
2
53
4
0
25
54,
25,
34.
1 .
73.
5.
. 1 82
. 274
. 153
, 144
.948
,471
993
0
8,
17,
8 ,
1 1 ,
0 ,
2 3 ,
1 ,
0
22
72
21
15
64
98
96
Total
no of
villages
79
82
18
54
4
127
5
0
people
147.581
141.477
2 8 . 1 13
61 .408
7 .402
172.684
7 .512
0
*
4 8 , 17
4 6 , 18
9, 18
20 ,04
2 , 42
56 ,37
2 , 4 5
0
Distance to Main Water Supply
(tap in a piped W/S, hand pump, open well, dam, etc.)
D i s
0
0 , 6
1 ,1
2 , 1
no
tance
- 0,5
- 1,0
- 2 , 0
- 5 , 0
> 5 , 0
info
Nc
km
km
km
km
km
). of villages fopuiati
46
2
31
11
6
109
82 .809
3.345
39 .765
1 3 - 9 4 7
5 . 7 7 4
1 6 0 . 7 1 7
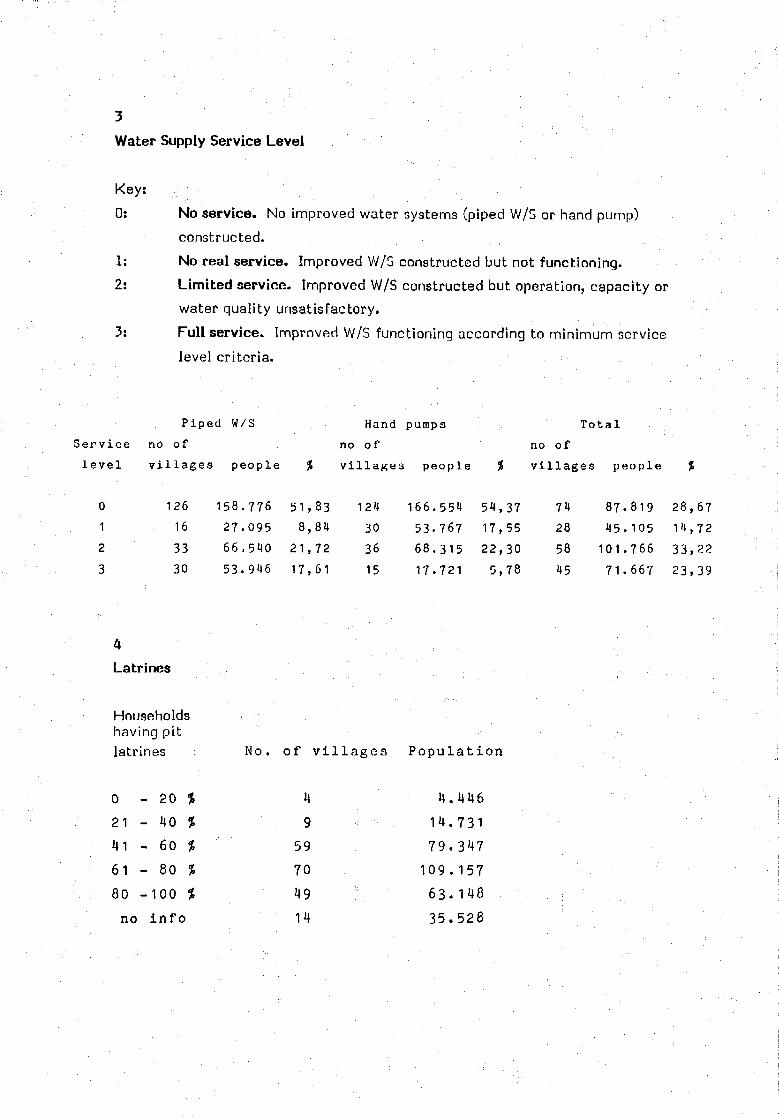
Water Supply Service Level
Key:
0:
1:
2:
3:
No service. No improved water systems (piped W/S or hand pump)
constructed.
No real service. Improved W/S constructed but not functioning.
Limited service. Improved W/S constructed but operation, capacity or
water quality unsatisfactory.
Full service. Improved W/S functioning according to minimum service
level criteria.
Service
level
0
1
2
3
Pipedno of
villages
126 1
16
3330
W/S
people
58,
27.
66
53 .
.776
.095
,540
.946
%
5 1 , 8 3
8 ,84
2 1 , 7 2
17 ,61
Hand
no of
villages
124
3036
15
pumps
people
166-554
5 3 . 7 6 7
6 8 . 3 1 5
17 .721
%
5 4 , 3 7
17 ,55
2 2 , 3 0
5 ,78
Total
no of
villages people
74
28
58
45
8 7 . 8 1 9
4 5 . 1 0 5
101 .766
7 1 . 6 6 7
%
2 8 , 6 7
14 ,72
3 3 , 2 2
2 3 , 3 9
4Latrines
Householdshaving pitlatrines
0 - 20 %
21 - 40 %
41 - 60 %
6 1 - 80 %
80 - 1 0 0 %
no info
No. of
4
9
59
70
49
14
4.446
14.731
79.347
109. 157
63. 148
35.528

MTWARA DISTRICT
Use of Different Types of Water Supplies
1. priority:
2. priority:
Total:
the main water supply
the secondary water supply
coverage of a certain type of water supply regardless of its
priority
• • • • ' • • • • • ; . .
Piped W/SHand pumpOpen wellRiverDarnOpen pitSpringRainwater
1. pp-iority
no of
vil lages
35
45
41
4
6
20
2
0
p e o p l e
40 .246
49 .016
25 .427
5.422
6.673
15.397
4 .454
0
%
27 ,45
33,43
17,34
3,70
4 ,55
10,50
3,04
0
2. pr ior i ty
no of
villages people
10
16
38
5
11
5
31
15.007
17.293
38 .591
7.037
14.727
7.885
2 .091
1 . 0 5 0
*
10,23
11,79
2 6 , 3 2
4 ,80
10,04
5,38
1,43
0 ,72
Total
no of
vi l lage
59
63
80
12
24
25
5
1
s people
79 .540
68 .627
66 .018
17-617
31 .465
2 3 . 2 8 2
6 .545
1.050
%
54 ,24
46 ,80
4 5 , 0 2
12,01
21 ,46
15,88
4 ,46
0 ,72
Distance to Main Water Supply
(tap in a piped W/S, hand pump, open well, dam, etc.)
Distance
0
0 ,
1 ,
2 ,
,6
, 1
. 1
no
- o ,- 1,
- 2 ,
- 5,
> 5,
info
5
0
0
0
0
NC
km
km
km
km
km
>. OI
78
1 1
15
25
7
17
No. of villages Population
88.108
1 3 . 1 0 3
8 . 4 0 0
1 3 - 7 2 1
8 . 0 5 2
1 5 . 2 5 1
10

Water Supply Service Level
Key:
0:
l!
2:
3:
No service. No improved water systems (piped W/5 or hand pump)
constructed.
No real service. Improved W/S constructed but not functioning.
Limited service. Improved W/S constructed but operation, capacity or
water quality unsatisfactory.
Full service. Improved W/5 functioning according to minimum service
level criteria.
Piped W/5
Service no of
level villages people
Hand pumps
no of
villages people
Total
no of
villages people
93 66.120 1)5,30
19 27.391 18,68
20 32.486 22,15
21 20.338 13,87
91 80.026 54,57
10 11.792 10,09
23 28.126 19,18
29 23.691 16,16
49 29.316 19,99
17 22.231 15,16
37 51.059 34,82
50 44.029 30,03
4
Latrines
Householdshaving pitlatrines
0 - 20 %
21 - 40 %
41 - 60 %
61 - 80 %
80 -100 %
no i n f o
No. of
18
30
52
19
5
29
18.379
25.424
41.538
23.602
1 1 .344
26.348
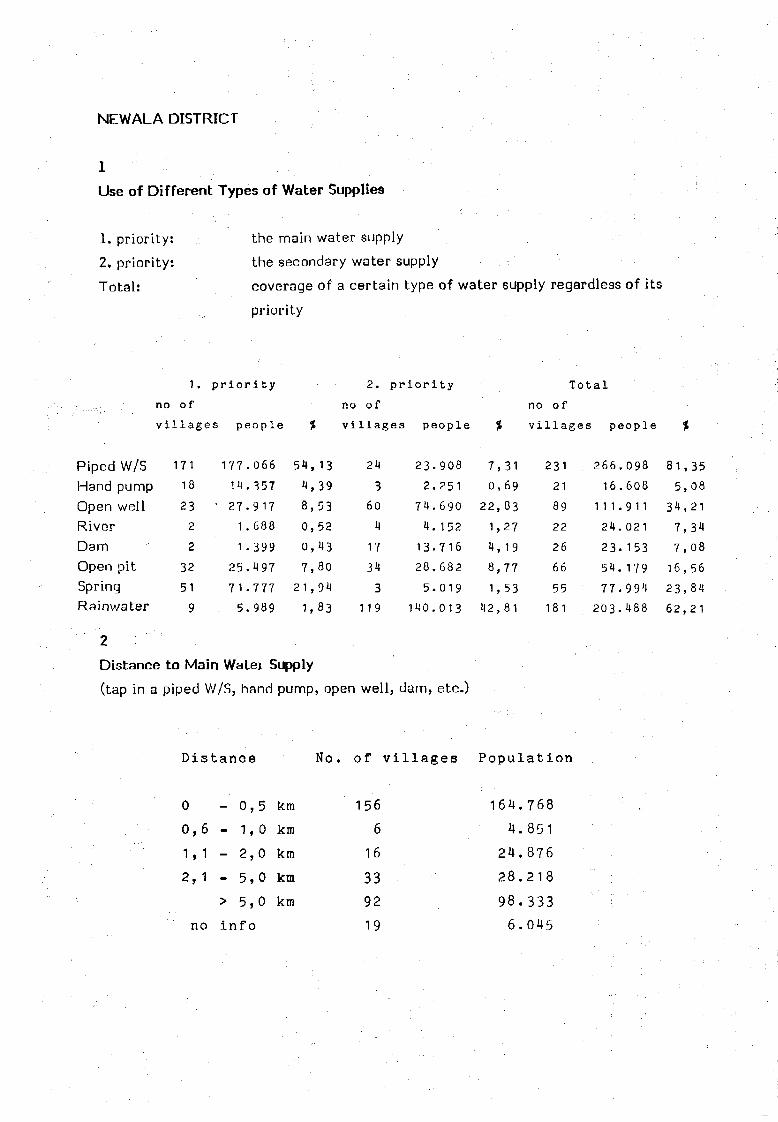
NEW ALA DISTRICT
Use of Different Types of Water Supplies
1. priority:
2, priority:
Total:
the main water supply
the secondary water supply
coverage of a certain type of water supply regardless of its
priority
1. priority
no of
villages people
Piped W/SHand pumpOpen wellRiverDamOpen pitSpringRainwater
171
18
23
2
2
32
51
9
177.066
14.357
27 .917
1.688
1 . 3 9 9
2 5 . 1 9 7
7 1 - 7 7 7
5 . 9 8 9
2. priority
no of
villages people
54 , 13
4 ,39
8 ,53
0 ,52
0 ,43
7,80
21 ,94
1,83
24
3
60
4
17
34
3
119
2 3 . 9 0 8
2 . 2 5 1
7 4 . 6 9 0
4 . 152
13.716
2 8 . 6 8 2
5 . 0 1 9
140.013
Total
no of
villages people
7 ,31
0,69
22 ,83
1,27
4 , 19
8,77
1,53
4 2 , 8 1
231
21
89
22
26
66
55
181
2 6 6 . 0 9 8 8 1 , 3 5
1 6 . 6 0 8 5 , 0 8
1 1 1 . 9 1 1
2 4 . 0 2 1
2 3 . 1 5 3
5 4 . 179
77-994
203.488
3 4 , 2 1
7,34
7 ,08
16,56
23 ,84
6 2 , 2 1
Distance to Main Watei Supply
(tap in a piped W/S, hand pump, open well, dam, etc.)
Dis
0
o,1.
2,
6
1
1
no
tance
- 0,5
- 1,0
- 2,0
- 5,0
> 5,0
info
No. of
km
km
km
km
km
156
6
16
3392
19
No. of villages Population
164.768
4. 851
24.876
28.218
98.333
6.045
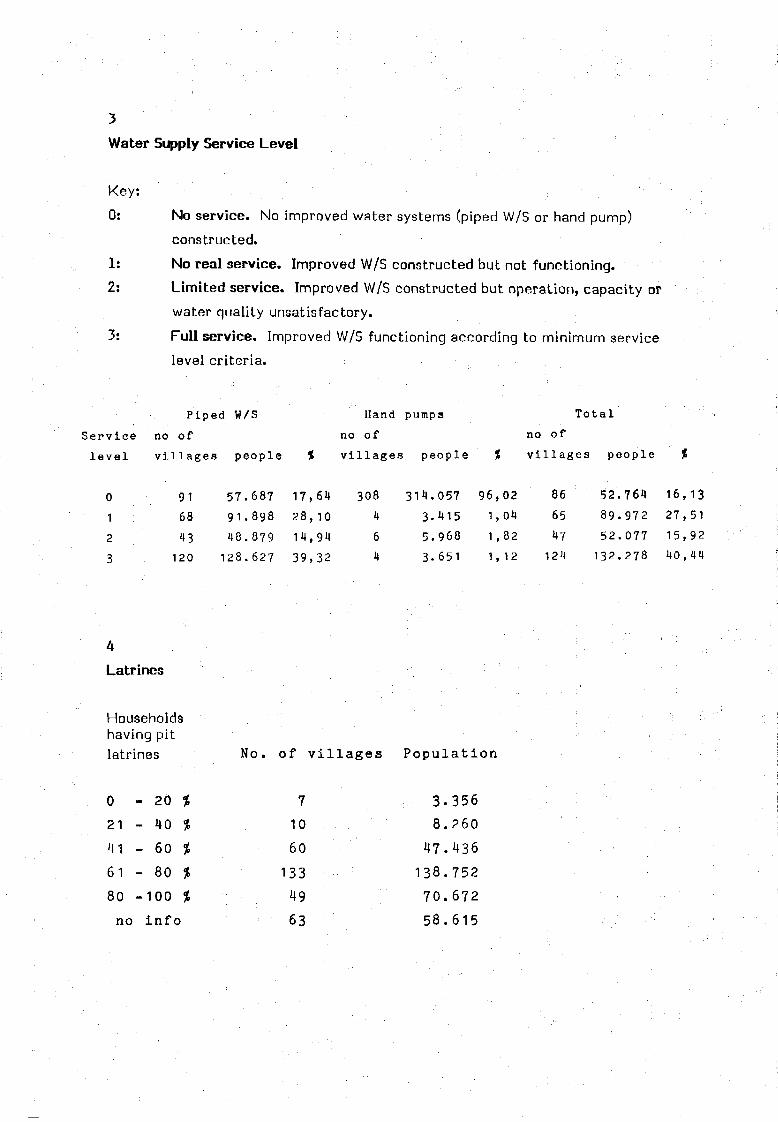
Water Supply Service Level
Key:
0:
1:
2:
No service. No improved water systems (piped W/S or hand pump)
constructed.
No real service. Improved W/S constructed but not functioning.
Limited service. Improved W/S constructed but operation, capacity or
water quality unsatisfactory.
Full service. Improved W/S functioning according to minimum service
level criteria.
Service
level
0
1
2
3
Piped W/S
no of
villages people
Hand pumps
no of
villages people
Total
no of
villages people
91 57.687 17,61»
68 91.898 28,10
43 48.879 14,94
120 128.627 39,32
308 314.057 96,02
4 3.415 1,04
6 5.968 1,82
4 3-651 1, 12
86 5 2.764 16,13
65 89-972 27,51
47 52.077 15,92
124 132.278 40,44
4Latrines
Householdshaving pitlatrines
0 - 20 %
21 - 40 *
41 - 60 %
61 - 80 %
80 -100 %
no info
No. of v i l l a g e s
710
60
133
49
63
Popu la t l
3-356
8.260
47.436
138.752
70 .672
58 .615

KILWA DISTRICT
Use of Different Types of Water Supplies
1. priority:
2. priority:
Total:
the main water supply
the secondary water supply
coverage of a certain type of water supply regardless of its
priority
Piped W/SHand pumpOpen wellRiverDamOpen pitSpringRainwater
1 .
no of
priority
villages people
14
28
30
9
0
12
0
1
30 .78?
50 .549
31 .552
1 1 . 2 2 0
0
6 . 8 9 9
0
0
23 ,
38 ,
24 ,
8 ,
0
5 ,
0
0
50
58
08
56
27
2. priority-
no of
villages people
6
5
31
4
0
14
1
0
12.000
13. 100
60 .131
7 .057
0
17.158
800
0
%
9, 16
10,00
45 ,90
5,39
0
13, 10
0,61
0
Tota l
no of
vi l lage
24
33
63
13
0
26
2
1
s people
53-589
63 .649
95 .224
18.277
0
24 .057
2 .516
0
%
4 0 , 9 1
48 ,58
72 ,69
13,95
0
18,36
1,92
0
Distance to Main Water Supply
(tap in a piped W/S, hand pump, open well, dam, etc.)
Distance
0
o,1,
2 ,
,6
, 1
, 1
no
- 0 , 5
- 1,0
- 2 , 0
- 5 , 0
> 5 , 0
info
N
km
km
km
km
km
o. or
49
912
8
0
16
No. of villages Population
84.842
17.215
9.274
6.559
0
13- 1 17

Water Supply Service Level
Key:
0:
1:
2:
3:
No service. No improved water systems (piped W/S or hand pump)
constructed.
No real service. Improved W/S constructed but not functioning.Limited service. Improved W/S constructed but operation, capacity orwater quality unsatisfactory.Full service. Improved W/S functioning according to minimum service
level criteria.
Service
level
0
1
2
3
Piped W/S
no of
villages people
Hand pumps
no of
villages people
Total
no of
villages people
72 82.920 63,29
7 11.400 8,70
11 19.513 14,89
4 17. 174 13,11
62 68.758 52,48
8 19.694 15,03
13 22.692 17,32
11 19.863 15,16
46 39.971 30,51
10 13.394 10,22
23 40.605 30,99
15 37.037 28,27
4Latrines
Householdshaving pitlatrines
0 - 20 %
21 - 40 %
41 - 60 %
61 - 80 %
80 -100 %
no i n f o
No. o f
5
28
18
0
0
43
8. 1 15
51.760
41.439
0
0
29.693
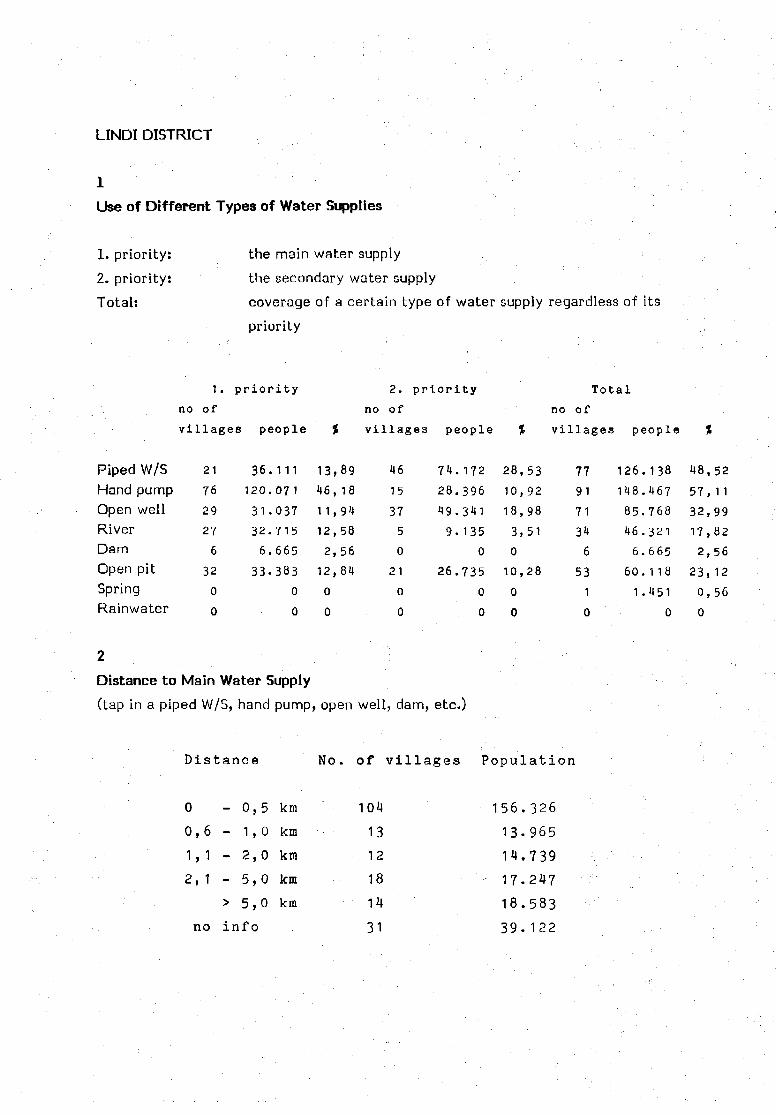
LINDI DISTRICT
Use of Different Types of Water Supplies
1. priority!2. priority:Total:
the main water supply
the secondary water supply
coverage of a certain type of water supply regardless of its
priority
Piped W/SHand pumpOpen wellRiverDamOpen pitSpringRainwater
1. priority
no of
villages
21
76
29
27
6
32
0
0
people
36. I l l
120.07 1
31.037
32 .715
6.665
33 .383
0
0
13,89
46 , 18
11,94
12,58
2 ,56
12, 84
0
0
2. priority
no of
v i l lages people
46
15
37
5
0
21
0
0
74. 17228.39649.3419.135
0
26.7350
0
28,5310,9218,983,510
10,280
0
Totalno ofv i l lages
77
91
71
34
6
53
1
0
people
126.138
148.467
85 .768
46 .321
6 .665
6 0 . 1 18
1 .451
0
%
4 8 , 5 2
5 7 , 11
32 ,99
17,82
2 ,56
2 3 , 1 2
0 ,56
0
Distance to Main Water Supply
(tap in a piped W/S, hand pump, open well, dam, etc.)
Distance No. of villages Population
0
0
1
2
, 6
, 1
, 1
n o
- 0,5
- 1,0
- 2 ,0
- 5 ,0
> 5 , 0
info
km
km
km
km
km
104
13
12
18
14
31
156.326
13-965
14.739
17.247
18.583
39.122
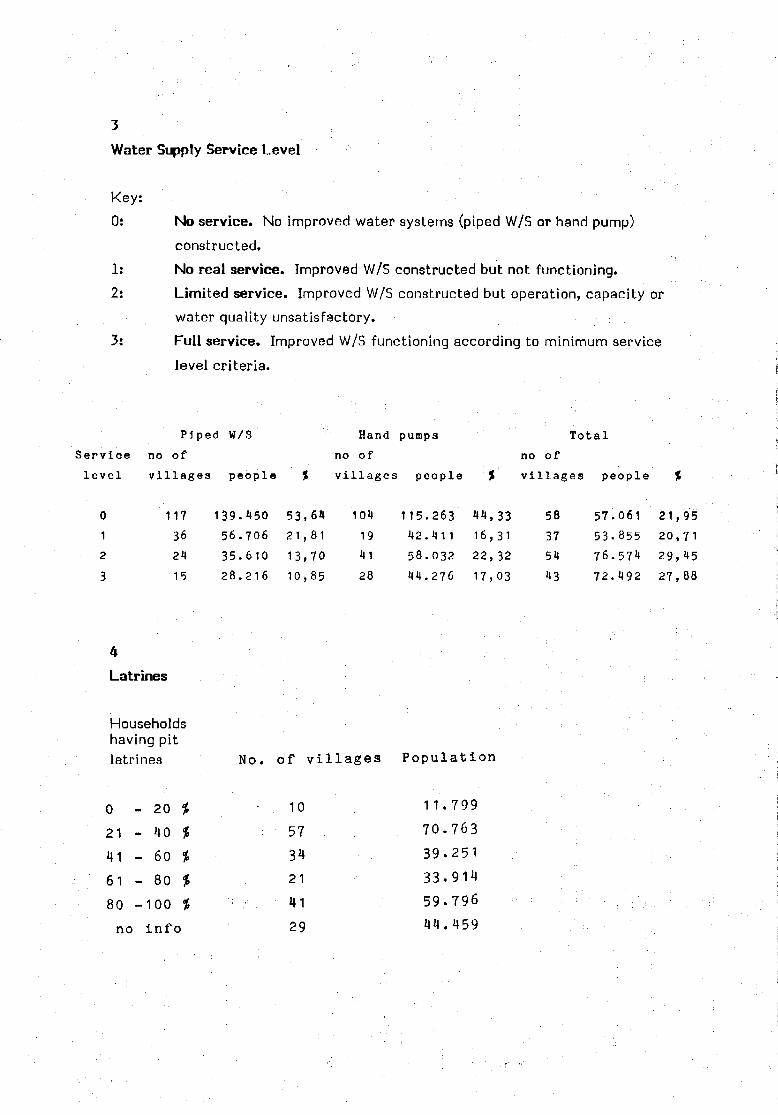
Water Supply Service Level
Key:
0:
1:
2:
3:
No service. No improved water systems (piped W/S or hand pump)
constructed.No real service. Improved W/S constructed but not functioning.
Limited service. Improved W/S constructed but operation, capacity or
water quality unsatisfactory.
Full service. Improved W/S functioning according to minimum service
level criteria.
Service
level
0
1
2
3
Pipedno of
v i l lages
117 1
36
24
15
W/S
people
39.450
56.706
35.610
28.216
%
53 ,6«
2 1 , 8 1
13,70
10,85
Handno of
villages
1 Oil
19
lt1
28
pumps
people
115.263H2.m 1
58 .032
41 .276
%
4 4 , 3 3
16,31
22,32
17,03
Tota lno of
v i l l a g e s
58
37
54
43
people
57.061
53.855
76.574
72.492
Y
21,95
20,71
29,45
27,88
4
Latrines
Householdshaving pitlatrines
0 - 20 %
21 - 40 %
41 - 60 %
61 - 80 %
80 -100 %
no i n f o
No. of
10
57
34
21
41
29
11.799
70.763
39.251
33.914
59.796
44.459

LIWALE DISTRICT
Use of Different Types of Water Supplies
1. priority:2. priority:Total:
the main water supply
the secondary water supply
coverage of a certain type of water supply regardless of its
priority
Piped W/SHand pumpOpen wellRiverDamOpen pitSpringRainwater
1 .
no of
priority
villages people
11
12
0
3
0
13
0
0
17.133
12.990
0
3 .482
0
16.294
0
0
*
34 ,34
26 ,03
0
6,98
0
32 ,65
0
0
2. priority
no of
villages people
5
2
1
7
0
7
0
0
6 .349
2 .262
373
12.070
0
10 .391
0
0
*
12 ,72
4 ,53
0,75
24 ,19
0
20,82
0
0
Total
no of
villages
20
17
1
12
0
20
0
0
people
28.021
22.690
373
19.282
0
26 .685
0
0
*
5 6 ,
45 ,
0 ,
38 ,
0
5 3 ,
0
0
16
47
75
64
48
Distance to Main Water Supply
(tap in a piped W/S, hand pump, open well, dam, etc.)
Distance
0
0,
1,
2 ,
,6
, 1
1
no
- 0 ,5
- 1,0
- 2 ,0
- 5 ,0
> 5,0
i n f o
km
km
km
km
km
No. of
1
0
3
2
0
33
1 . 6 4 4
0
2.941
2.7490
42.565
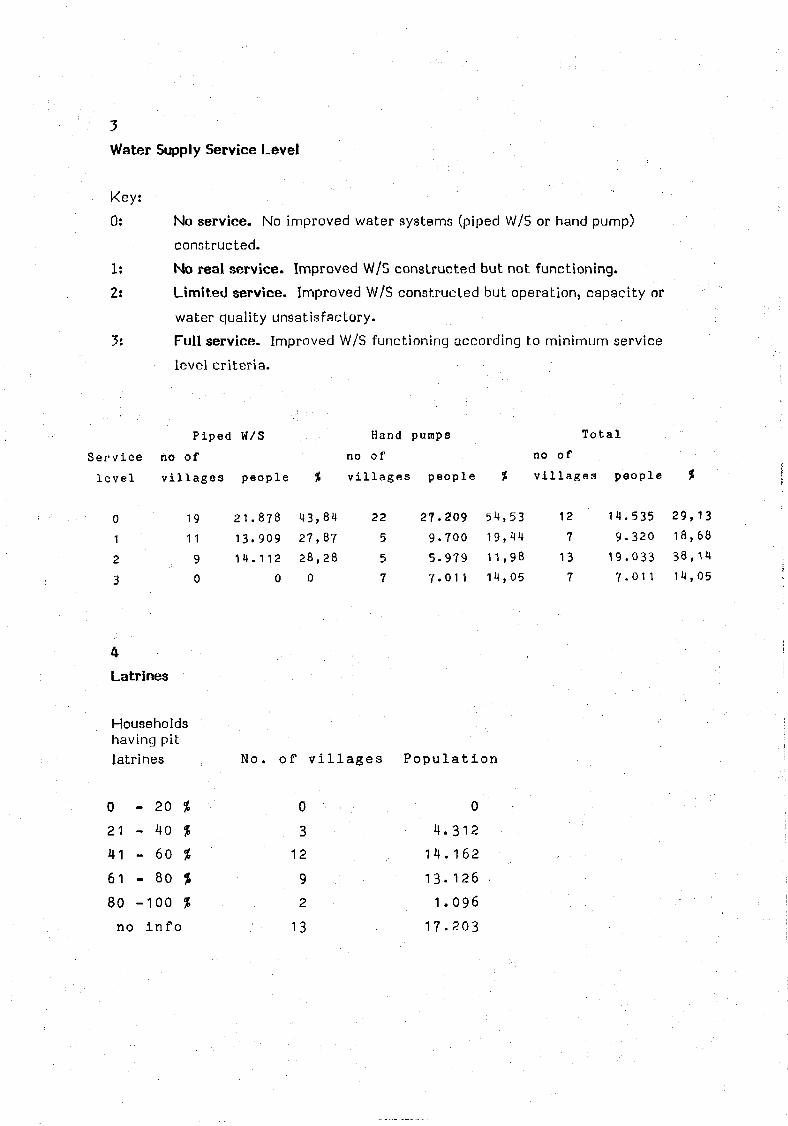
Water Supply Service Level
key:
0:
1:
2:
3:
No service. No improved water systems (piped W/S or hand pump)
constructed.No real service. Improved W/S constructed but not functioning.Limited service. Improved W/S constructed but operation, capacity or
water quality unsatisfactory.Full service. Improved W/S functioning according to minimum servicelevel criteria.
Service
level
0
1
2
3
Piped
no of
villages
19
11
9
0
2
1
1
W/S
people
1.878
3.909
4 .112
0
4 3 ,
2 7 ,
2 8 ,
0
84
87
28
Hand
no of
villages
22
5
5
7
pumps
people
27.2099-700
5.9797.011
%
54,5319,4411,98
14,05
Tota lno ofvi l lages
12
7
13
7
people
14.5359.320
19.0337.011
Î
2 9 ,
1 8 ,
3 8 ,
1 4 ,
13
68
14
05
Latrines
Householdshaving pitlatrines
0 - 20 %
21 - 40 %
41 - 60 %
61 - 80 %
80 -100 %
no i n f o
No. o f
o3
12
9
2
13
0
4.312
1 4 . 1 6 2
13.126
1.096
17.203

NACHINGWEA DISTRICT
Use of Different Types of Water Supplies
1. priority:
2. priority:
Total:
the main water supply
the secondary water supply
coverage of a certain type of water supply regardless of its
priority
Piped W/SHand pumpOpen wellRiverDamOpen pitSpringRainwater
1. priority
no ofv i l lages
17
18
il
3
1
22
0
0
people
44.01334.8215.5023.1611.774
28.0520
0
37,5129,68
4,692,691,51
23,910
0
2. p r i o r i t yno ofv i l lages people
18
8
5
2
1
12
0
0
28.36425.88610.9293.4481. 134
20.6840
0
24, 1822,06
9,322,94
0,9717,63
0
0
Totalno ofv i l lages
37
26
9
5
2
34
0
0
people
75 .979
60 .707
16.431
6.609
2 .908
48.736
0
0
%
64 ,76
51 ,74
14,00
5,63
2 ,48
41 ,54
0
0
Distance to Main Water Supply
(tap in a piped W/S, hand pump, open well, dam, etc.)
D i s
0
0 ,
1,
2 ,
,6
, 1
1
no
tance
- 0,5
- 1,0
- 2 , 0
- 5 , 0
> 5 , 0
info
No. of
km
km
km
km
km
43
3
5
31
10
No. of villages Population
85.052
3-629
7.098
3.424
1.774
16.346

Water Supply Service Level
Key:
0:
1:
2:
3:
No service. No improved water systems (piped W/S or hand pump)
constructed.
No real service. Improved W/S constructed but not functioning.
Limited service. Improved W/S constructed but operation, capacity or
water quality unsatisfactory.
Full service. Improved W/S functioning according to minimum service
level criteria.
Piped W/S
Service no of
level villages people
0
1
2
3
Hand pumps
no of
villages people
Total
no of
villages people
28 1M.3M 35,21
23 38 .336 32 ,68
12 25.543 21,77
2 12.100 10,31
39 56 .616 48 ,26
6 21-670 18,17
10 25 .699 2 1 , 9 0
10 13-338 11,37
H 17-725 15 ,11
20 33-123 2 8 , 4 9
19 40 .737 3 4 , 7 2
12 25 .438 21 ,68
4
Latrines
Householdshaving pit
latrines
0 - 2 0 %
21 - 40 %
41 - 60 %
61 - 80 %
80 -100 %
no i n f o
No. o f
1
5
12
32
5
10
1 . 150
7.864
23-057
56 .271
13-314
15.667
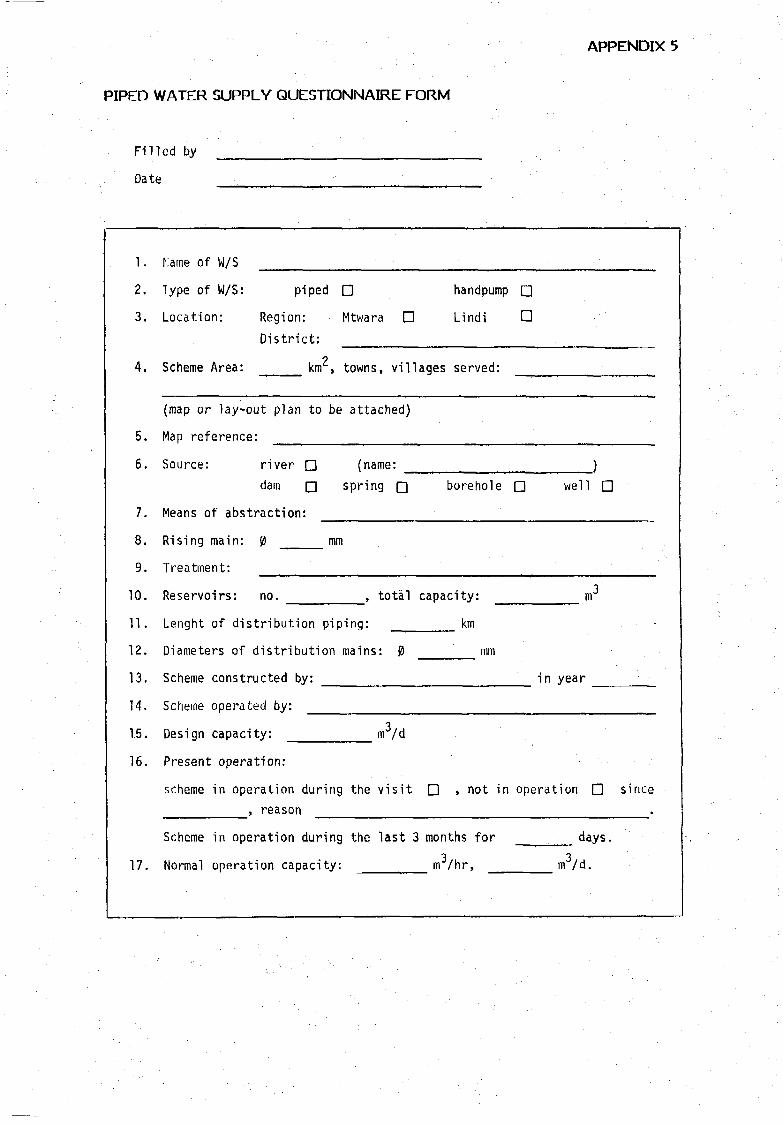
APPENDIX 5
PIPED WATER SUPPLY QUESTIONNAIRE FORM
Filled by
Date
1.
2.
3.
4 .
5.
6.
7.
8.
9.
10.
11.
12.
13.
14.
15.
16.
17.
Marne of W/S
Type of W/S: piped
Location: Region:
Dist r ic t :
Scheme Area: ^ km,
(map or lay-out plan to be
Map reference:
Source: river •
dam 0
Means of abstract ion:
Rising main: 0 mm
Treatment:
Reservoirs: no.
Q
Yltwara D
towns, v i l l
attached)
(name:
spring g
, total
Lenght of d is t r ibu t ion piping:
Diameters of d is t r ibu t ion
Scheme constructed by:
Scheme operated by:
Design capacity:
Present operation:
scheme in operation during
, reason
Scheme in operation during
Normal operation capacity:
mains: 0
m3/d
the v i s i t
the last 3
handpump Q
Lindi D
ages served:
}
borehole D well Q
capacity: m
km
mm
in year
D » not in operation • since
months for days.
m3/hr, m3/d.
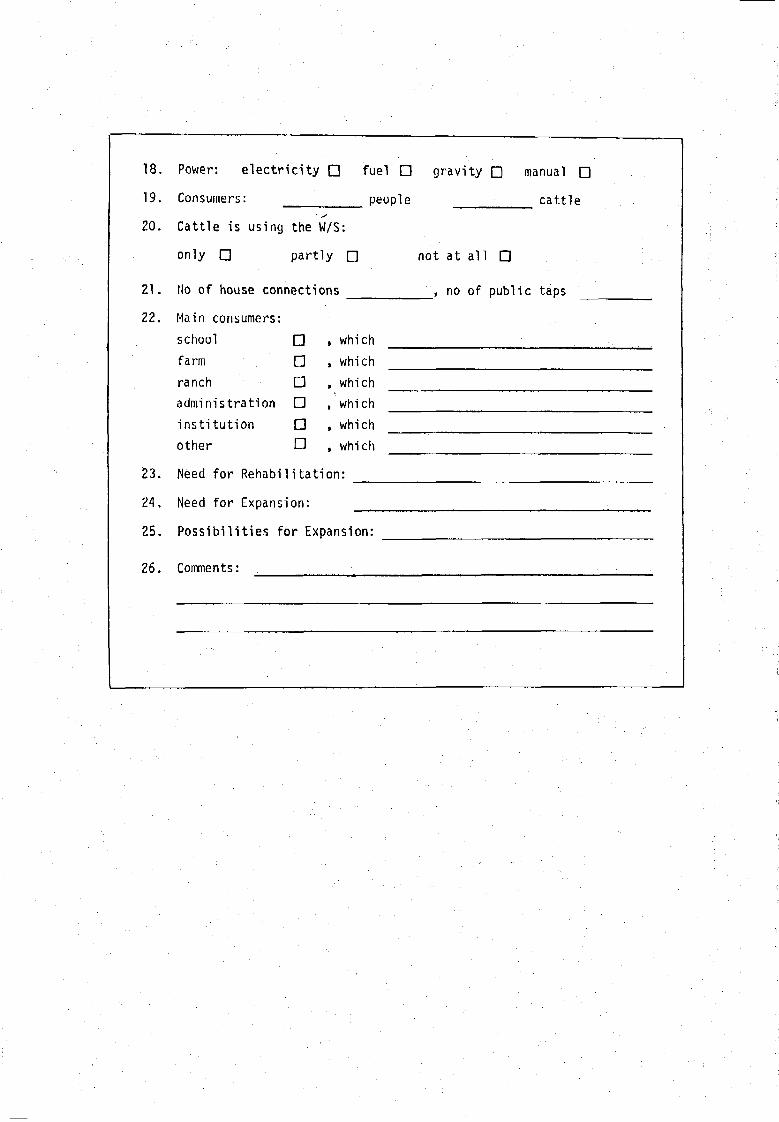
18. Power: electricity Q fuel • gravity Q manual
19. Consumers: people • • ' cattle
20. Cattle is using the W/S:
only Q partly Q not at all Q
21. No of house connections _, no of public taps '
22. Main consumers:
school D , which *________
farm • » which
ranch • , which
administration • «which
institution D > which
other • , which
23. Need for Rehabilitation:
24, Need for Expansion:
25. Possibilities for Expansion:
26. Comments:

APPPENDIX 6
PIPED WATER SUPPLY SCHEMES
Masasi District
Mtwara District
Newala District
Kilwa District
Lindi District
Liwale District
Nachingwea District
Key to abréviations and symbols:
Column 8,
1
2
34
5 =
source
borehole
well
spring
stream
dam
Column 9, quality
1 - good
2 = polluted
3 - badly polluted
4 = salty
5 = very salty
Column 15, power
0 = gravity
1 = diesel2 = electricity
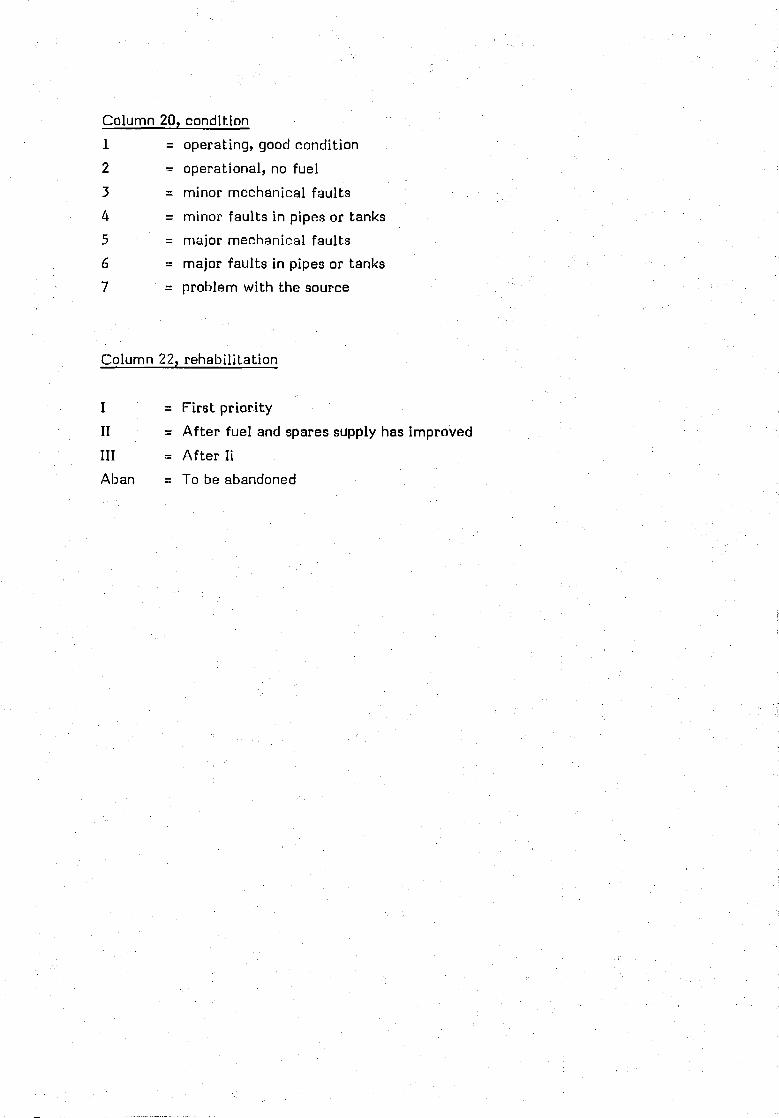
Column 20, condition
1 = operating, good condition
2 = operational, no fuel
3 = minor mechanical faults
4 = minor faults in pipes or tanks
5 = major mechanical faults
6 = major faults in pipes or tanks
7 = problem with the source
Column 22, rehabilitation
I ' • = First priority
II = After fuel and spares supply has improved
III = After Ii
Aban = To be abandoned
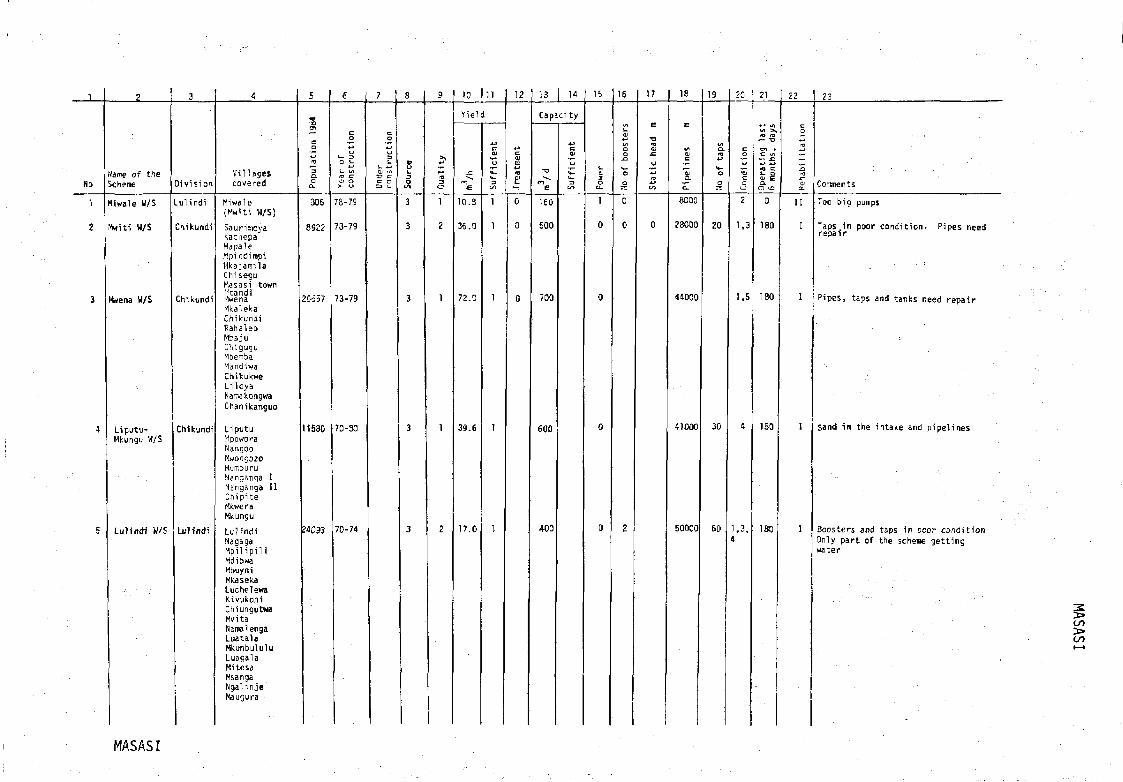
1
No
1
2
3
4
5
o
name o f theScheme
Hi wale W/S
••Knti W/S
Mwena W/S
Liputu-Hkungu W/S
Lul indi W/S
3
Division
.ulindi
Chikundi
Chikundi
Chikundi
Lulindi
4
Villagescovered
Hi wale(Mw-iti W/S)
SaurisioyaKaciiepaHa pa leMpi ndimpiMkajamilaChiseguMa s asi town[•'•tandiHwenaMkalekaChikundiRahaleoMbajuC'n: guguMbembaMandiwaChikukweLiloyaNaoakongwaChanikanguo
LiputuMpoworaNangooMwongozoMurcburuNangsnrça 1Nanganga 11Chi pi teHkwe raMkungu
LulindiMagagaHpilipiliMdibwaMbuyniMkasekaLuchelewaKivukoniChiungutwaMvitaNamalengaLuatalaHkunbululuLuagalaHitesaHsangaNgalinjertaugura
5
„
cD
pula
ti
oCL.
306
892?
5Ô57
11580
24093
6
ion
O i-
>• S
73-79
70-79
73-79
70-33
70-74
7
co
rj
QJ 1/1
C D
3
s8,
3
3
3
3
3
9
alit
y
c-
1
2
1
1
2
to 11
Yield
E
10.8
36.0
72.0
39.6
17.0
cOJ
u(»-
%
1
1
1
1
1
12
4-9
cQJ
BClU
0
0
c
13 14
Capacity
-o
E
ieo
500
700
600
*00
c
ffic
ie
15
Ol
o
1
0
0
0
0
16
o
of bo
o
0
0
z
\
17
s
S
itic h
«
0
18
E
4 ^Oic
a!
eooo
?8000
44000
41000
50000
19
a.
of ta
s
20
30
60
20 21
v\ >
c ^ en *
ndi ti
o
o
2
1.3
5,6
4
1,3,4
c wi
t_ Q
< ^ ^
0
180
180
150
180
22
tion
4 J
i1
i i
i
i
i
i
23
• . . . . •
Comments
Too big pumps
Taps in poor condi t ion. Pipes needrepair
Pipes, taps and tanks need repair
Sand i n the intake and pipel ines
Boosters and taps in poor condi t ionOnly part of the scheme get t ingwater
to
MASASI

HASASI
1
No
e !
i
8
3
10
11
12
13
14
15
16
17
18
19
20
21
Same of theScheme
ChiwamboChini W/S
Mpeta
Handete
Makanyana
Hkululu
Sindano W/S
Kakongonda
Mlingula
Namajani
Chikoweti
Nanyindwa
Nandembo
Mangaka
Ndwika
Nangomba
Nanyumbu
3
Jivision
.u] indi
Chiunjjtwa
Lisekese
Tiungutwa
Lui ind i
fchauru
Hchauru
Lisekese
Lisekese
Lisekese
Lukuledi
Nakopi
Nanyumbu
Nanyumbu
Nanyumbu
Nanyumbu
4
Vil lagescovered
Chiwambo ch in i
Mpeta
NandeteNakole
Makanyama
MkululuMiba
SindanoLicheche
RivangoMakongondaNakararaKilonberoHnaviraManyuliMkachimaChikoropoîaNamombwe
MlingulaNarnkungwi
NamajaniPrisonKamatutwe
Chikoweti
Nanyindwa
NandemboMichiga
MangakaKilima Hewa
Nctwika
Nangomba
NanyumbuMkuuUChungu
S
Popu
lati
on 1984
1000
1913
2780
789
2527
2417
11106
3565
2754
1488
1188
3012
5246
564
2190
£944
e
Year of
construction
80
so ;
81
80
77
76
73-75
79
83-84
78
60
78
so
82
73-76
76
7
Unde
rco
nstr
ucti
on
X
X
X
X
3 1
Sour
ce
3
1
1
1
(3)
2
3
1
1
1
1
5
1
1
1
2
9
>i
ia
c-
2
4
4
4
2
M
3
1(4)
4
4
1(1)
1(4)
1(4)
1(4)
4,2
10 | 11
Yield
jtr^ *
17.0
8.1
5.9
1.4
8.3
19.0
4.5
5.9
4.5
4.5
6.8
10.8
3.8
5.3
1.4
Suff
icie
nt
1
1
0
1
1
0
0
1
1
0
1
1
1
1
1
0
,2j
Trea
tmen
t 1
C-
0
0
0
0
0
c
0
0
0
0
0
0
0
U I 14
Capacity
•—
E
192
130
90
20
200
250
60
90
60
60
100
110
50
90
20
Suff
icie
nt
15
Powe
r
1
1
1
1
1
1
0
1
1
1
1
1
1
1
1
1
16
No of boo
ster
s
j
17
Stat
ic h
ead m
. , ,
12
38
54
165
13
Pipe
line
s m
1000
1000
1000
500
5500
2000
30DOO
3400
11500
700
4500
4000
1000
4000
8000
19
Mo of tap
s
8
6
8
4
2
8
7
7
8
10
7
20
Cond
itio
n
1,2
7,5
•
2,5,7
2
5,2,7
1
2
1
5,7
5
5
5
5
5
5
21
Operating
last
6 mo
nths
, da
ys
180
0
0
0
0
0
100
30
180
0
0
0
0
0
0
0
t ••
[i
22
Reha
bili
tati
on
I
Aband.
II
Aband.
II
I I I
Aband.
11
I I I
I I
Aband
I I
Aband.
23
Comments
Same source as Lul indi W/S
Engine bed broken, water too sal ine
Hater s l i gh t l y salty
Salty water, broken engine
Source is a dam. Treatment shouldbe added
Insuf f ic ient source, no spares
Not enough water for the las t v i l lages
In good condition
Salty water
Salty water, no d is t r ibu t ion .Not in usePurap broken
Engines, pumps, pipes broken
Engine broken
No engines, no pumps, never operated
No engine since -82
No engine, water too sal ty
00
CO
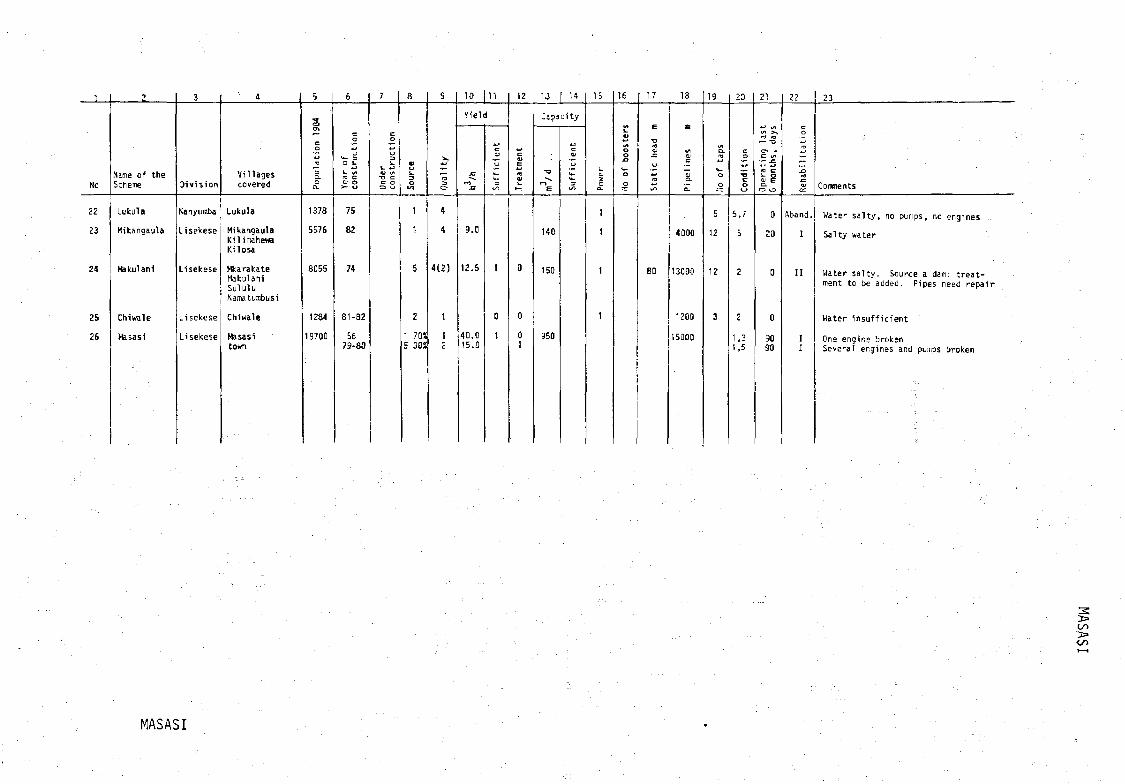
1
No
22
23
24
25
26
2
Marne of theScheme
Lukula
Mikangaula
Hakulani
Chiwale
Masasi
3
Division
Nanyumba
Lisekese
Lisekese
Lisekese
Lisekese
'• 4 J
Vil lagescovered
Lukula
MikangaulaK i 1 inahewaKilosa
HkarakateftokulaniSululuNarratumbusi
Chiwale
Masasitown
5
Popu
lati
on 1984
1378
5576
8D55
1284
19700
6
Year of
cons
truc
tion
75
82
74
81-82
5679-80
7
Unde
rco
nstr
ucti
on
8
Sour
ce
1
1
5
2
1 70Ï5 301
9
Qual
ity
4
4
4(2)
1
12
10 11
Yield
JZ
9.0
12.5
40.015.0
Suff
icie
nt
1
0
1
12
Trea
tmen
t
0
0
0i
U 14
Capacity
140
150
950
Suff
icie
nt
15
Powe
r
1
1
1
1
16
No of bo
oste
rs
17
Stat
ic he
ad m
eo
18
Pipe
line
s m
4Û00
13000
1200
15ÛO0
19
No of ta
ps
5
12
12
3
23
Cond
itio
n
5,7
5
2
2
1 ,3I.S
21
Oper
atin
g la
st5
mont
hs,
days
0
0
0
3090
22
Reha
bili
tati
on
Aband.
I
II
II
23
Comments
Water s a l t y , no pumps, no engines
Salty water
Water sa l t y . Source a dam: t rea t -ment to be added. Pipes need repair
Hater insuf f ic ient
One engine brokenSeveral engines and pumps broken
CO
MASASI

1
No
1
2
3
4
5
6
7
8
9
10
11
12
13
14
2
name of theScheme
Naumbu
W/S
Msangamkuu
Ki tereW/S
NamuhiW/S
Mpapura
MdambiW/S
DihimbaW/S
Mbuo
NanyambaW/S
MtinikoW/SNanguruwe
Arusha Chi niW/S
ZiwaniW/S
HamindondiW/S
3
Division
fiaumbu
Ziwani
Hpapura
Mpapura
Mpapura
Dihimba
Mpapura
Nanyamba
Nanyamba
Ziwani
Ki taya
Ziwani
Ziwani
4
Vil lagescovered
KitopeNaumbu Ku.siniNaumbu ShuletnMkunguPemba
Sinde
MsangamkuuKitunguruChemchemLilidnNakadaChekeleni
NamuhiLibobeU tende
Hpapura
Ndambi<J dumb tie
Dihimba
Mpondomo
MbuoNamkogoliMgaoImekuwaKisiwaL i EchoLikonde NanguniLikonde GodauniMkunwa
NanyambaNamkuku
Mtiniko
Nanguruwe
Arusha ChiniArusha Juu
Ziwani
'tsakalaMkwajuni
liamindondiMtendactiirtadimbaUngoji
a
ati
Po,
2300
3294
1979
4G69
2018
2525
3227
7859
3000
2130
2090
1460
£470
3678
6
£
o
o t-
rO COJ O
73
72
72-78
31
82
30
30
79
73
77
72
78
77
77
7
c
x;
true
It iA
-o cC O
8
<u%.
3
2
1
1
Î
1
1
1,2
2,5
1
2
1
1
Î
9
Cr
2
2
1
1
1
1
2
1
2
1
1
1
10
Yield
3.6
10.0
1-14.0
13.5
7.9
13.5
16.2
29.7
0.8
3.3
3.5
12.0
c
icie
1/1
0
0
1
0
0
1
1
1
0
0
1
0
J
12
E
S13
t
0
0
13 | 14
Capacity
• o
60
60
240
200
100
200
250
250
2080
20
200
icie
4 4 -
15
1oG_
1
1
1
1
1
1
î
1
1
I
1
1
1
1
16un.
hO
2O
O
17
m.rz
30
23
18E
u>
C
C L
12000
8400
16500
10000
1700
2000
2100
23000
3000
4500
1500
5000
3000
10500
19
a.to
o
o71
16
21
13
10
7
10
8
20
7
5
6
7
10
16
20
c
itio
-o
5o
5,7
1,3
2,3
7
5
2
2,5
5,7
5,7
5,7
7,5
2
2,5
2
21• ^ >v
m -S
- , .c i/i
-F- x:
£ 1
0
40
30
0
0
30
10
0
0
0
0
20
5
30
22C
o
2'S<D
. ECJ
OC
I I I
I I
m
m
n
Aban.
Aban.
I I I
Aban.
I
23
Comments
^Insuff icient source.
Broken p ipel ine (under repa i r )
2 pump unit under i n s t a l l . , tapsSroken, source insuf f .
No spares, good source
Borehole collapsed 1984
iio machines.
No machines, never operated,avai t ing e le t r i ced i n s t a l l a t i o n .Good condit ion
Broken engine
No machines since - 3 1 , :
poor source.
Polluted source, dam collapsedno machines since - 3 1 .
B/H col lapsed, no machinessince - 8 1 .So x opcr "f ir many yc3 rs .Fair condit ion
Engine too small
Good condition5
MTWARA

MTWARA
1
No
1G
17
13
Z
Maine of the
Scheme
Ki taya
W/S
Mahurunga
W/S
Mbawala
Chini
Nanyamba
3
Division
Ki taya
Ki taya
MayangaZiwani
Nanyamba
4
Villages
covered
Ki tayaMayembeKi romba JuuKiromba Chini
MahurungaPolice stat ion& hospital only
MduwiMaili KumiNalindeleMbawala ChiniNyengediNanyatiKawawafia chen j e i e
NanyambaChikwayaMnyahiMilangominneMnyawi SokoniNarntumbukaMnyawiMnongodiNamakukuDinyecha
5
Population 1904
7286
200
5186
17S93
6
Year of
construction
72-79
70
81-82
78-80
7
Under
construction
e
Source
2
2
1
1
9
Qua
1 i ty
2
2
1
1
10 11
Yield
JZm
E
1,3
Suffici ent
1
0
1
1
1?
Treatment
13 H
Capacity
E
200
30
360
560
Sufficient
1
1
15
Power
1
1
!
IK
No of boosters
1
1
1
17
Static
head
m
140
160
IS
Pipelines
m
4000
1500
10600
43000
19
cm
ooX.
20
10
34
20
Condition
7
7
1,3
1
21
Operating last
6 months, days
0
30
120
120
Rehabilitation
II
III
Comments
Source L. Chidya. Water level
too low during dry season.
Needs redesign.
New source needed, pump broken
Maintaned by F.W. Power problems
Maintaned by F.W. Boreholesunder repair.
3»TO
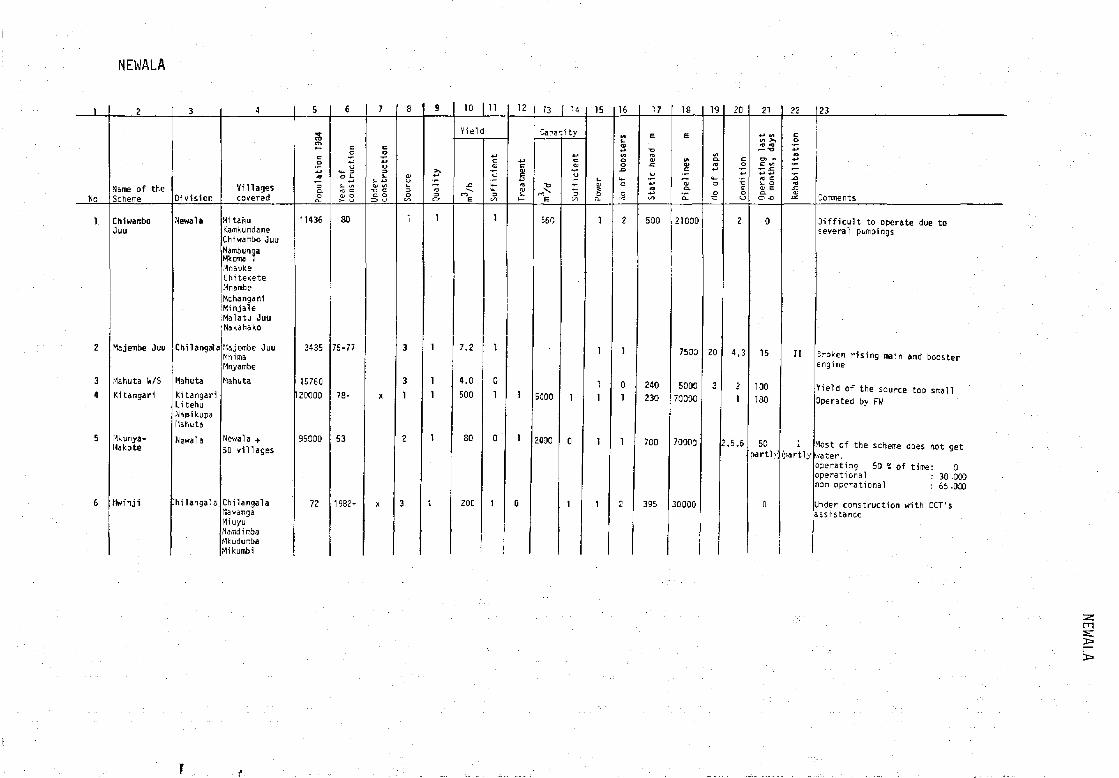
NEWALA
1
No
1
2
3
4
5
6
2
Name of theScheme
ChiwaraboJuu
Majembe Juu
Mahuta W/S
Kitangari
Mkunya-Makote
ttwinji
3
Division
flewala
Chilangala
Mahuta
KitangariLitehu.'Jaraikupailahuta
Newala
hilangala
4
Villagescovered
Mi tariuKamkundaneChiwambo JuuNamoungaMkoma 1InaukeChitekete.'InambeHehanga niMinjaleMalatu JuuNakahako
Majembe OuuKn i maMnyambe
Mahuta
Newala +50 v i l l ages
ChilangalafiavangaH i uyuftamdinbaMkudumbaMi kumbi
5
Popu
lati
on 1934
11436
3435
15760
120000
95000
72
6
Year of
cons
truc
tion
30
75-77
78-
53
1962-
7
Unde
rco
nstr
ucti
onX
X
8
Sour
ce
3
3
1
2
3
9
Qual
ity
1
1
1
1
1
I
10 11
Yield
JZ
E
7.2
4.0
500
80
200Su
ffic
ient
1
1
0
1
0
1
12
Trea
tmen
t
I
1
0
13 14
Capacity
E
560
5000
2000
Suff
icie
nt
1
0
1
15
Powe
r
1
1
11
1
1
16
Ao of b
oost
ers
2
1
01
1
2
17
Stat
ic he
ad m
500
240230
700
395
18
Pipe
line
s m
21000
7503
500070000
70000
30000
19
No of t
aps
20
3
20
co
c
2
4,3
1
• 5,6
21
Oper
atin
g la
st6 mo
nths
, da
ys
0
15
100130
50partly)
0
22
II
ïpartly
23
Comments
d i f f i c u l t to operate due toseveral pumpings
Broken r is ing main and boosterengine
Yield of the source too smallOperated by FW
Vost of the scheme does not get>ater.operating 50 ï of time: 0operational : 30 .000non operational : 65.000
nder construction with CCT'sssistance
m
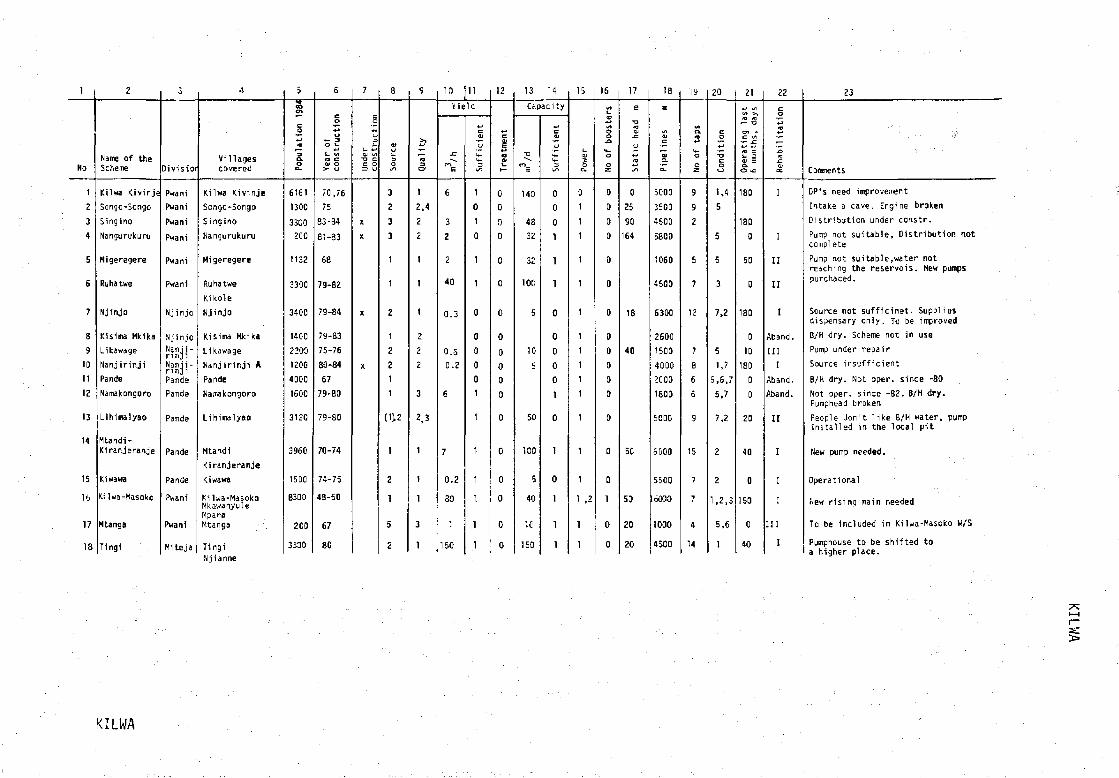
1
No
1
2
3
4
5
6
7
8
9
10
11
12
13
14
15
IS
17
18
2
Name of theScheme
Kilwa Kivinje
Songo-Songo
Singino
Nangurukuru
Migeregere
Ruhatwe
Njinjo
Kisima Mkika
Likawage
Nanjirinji
Pande
Namakongoro
Lihimalyao
Mtandi-Kiranjeranje
Kiwawa
Ki 1wa-Masoko
Mtanga
Tingi
3
Divisior
PwaniPwani
Pwani
Pwani
Pwani
Pwani
Njinjo
NjinjoNanji-rinjiNanji-rinj 1Pande
Pande
Pande
Pande
Panc!e
Pwani
Pwani
Miteja
4
Vi l lagescovered
Ki lwa Ki v in je
Songo-Songo
Singino
Nangurukuru
Migeregere
Ruhatwe
Kikole
Njinjo
Kisima Mkika
Likawage
Nanjirinji A
Pande
Namakongoro
Lihimalyao
Mtandi
Kiranjeranje
Kiwawa
Kilwa-MasokoMkawanyuleMparaM t a n g a •••:.
TingiNjianne
5
ico
rq
a.•_
6161
1300
3300200
1132
3300
3400
1400
2203
1200
4000
1600
3120
3960
1600
8300
200
3300
6
o
Of
tru
ct!
ta c
>- o
70,76
75
83-34
81-83
68
79-82
79-84
79-83
75-76
80-84
67
79-80
79-80
70-74
74-75
48-50
67
80
7
§
r tru
cti
1 §
X
X
X
X
3
|
3
2
3
3
1
1
2
1
2
Z1
1
(U2
1
2
1
5
2
9
•acr
1
2.4
2
2
1
1
\
2
2
2
3
2,3
1
1
1
3
1
10 11
Yield
JZ
6
3
2
2
40
0.3
0.50.2
6
7
0.2
SO
1
150
icie
nt
1
0
1
0
1
1
0
0
0
0
01
1
1
1
1
1
1
12
tmen
t
«a&L.
0
0I)
0
0
0
0
0
0
0
0
0
0
0
0
0
0
0
13 14
Capacity
-a
140
48
32
3Î
IOC)
5
10
5
60
100
5
40
K
150ic
ien
t
_̂
0
a0
i
i
l
0
0
0
0
0
1
0
1
0
1
1
1
15
ï
01
1
1
1
1
1
1
1
1
1
1
1
1
1
1 ,2
1
1
16
<L?
F boo
s
o
ozr
0
0
0
0
0
0
0
0
0
0
0
0
0
0
0
1
0
0
17
e
ic h
ea
%i / î
0
25
90
164
18
40
50
50
20
20
18
s
line
s
|a.
5000
3500
4500
5800
1060
4500
6300
2600
1500
4000
2000
1800
5000
6000
5500
16000
1000
4500
la
7 ta
ps
o
o
9
9
2
5
7
12
7
8
6
6
9
15
7
7
4
14
20
i tio
n
• o
o
1,45
5
5
3
7,2
5
1.75,6,7
5,7
7,2
2
2
1,2.3
5,6
1
21
rU (fl
itin
git
hs
, (
JOU
I
O \a
130
180
0
5D
0
180
0
10
180
0
0
20
40
0
150
0
40
22
c•
Sitcc
I
I
I I
I I
I
Aband.
I l l
I
Aband.
Aband.
I t
I
I
I
I I I
I
23
. • • •
Comments
DP's need improvement
Intake a cave. Engine broken
Dis t r ibu t ion under constr .
Pump not su i tab le , D is t r i bu t i on notcomplete
Pump not sui table,water notreaching the reservo is . New pumpspurchaced.
Source not s u f f i c i n e t . Suppliesdispensary on ly . To be improvedB/H dry. Scheme not in use
Pump under repair
Source i n s u f f i c i e n t
B/H dry. Not oper. since -80
Not oper. since -82. B/H d ry .Purnphead broken
People don' t l i k e B/H water, pumpins ta l led in the local p i t
New pump needed.
Operational
Hew r i s ing main needed
To be included in Kilwa-Masoko W/S
Pumphouse to be sh i f ted toa higher place.
IK
KILWA

LINDI1
No
1
2
3
4
5
e7
8
9
10
11
12
13
14
15
16
2
Name of theScheme
Ki tere-Nyangamara
Madingo
Namichiga
Ma ndawa
Lichwachwa
Chilangal i le
Nkowe
Hnacho
Likongo
Hitwero
Kikwetu
Kitomanga
Namikongo
Kinengene
Nanyanje
Milola
3
Division
Nyangamara
Nyangamara
Ruangwa
Handawa
Ruangwa
Hnacho
n
Mchinga
»
Mipingo
Ngapa
Nangaru
Hilola
4
Villagescovered
KitereLitipuNyangamara
Mbawala
Linoha
Nahukahuka
Lipome
Madingo
Namichiga
Handawa
Chikundi
Hchichi l i
Mtondo
Nahanga
Lichwachwa
Chibula
Muhuru
Chilangallie
H kowe
Mi tope
Nandagala
Ngau
Chint i la
Likongo
Mitoto
Hitwero
Kikwetu
Mbanja
Kitomanga
Namikongo
Kinengene
ChikonjiNanyanje
Jangwani
Milola
Legezamwendo
Kinyope
Chikwikwi
5
984
tion
1
JO
IO
6000
1450
2447
6522
1910
1560
3754
6982
1300
1424
3162
3981
908
4350
1630
7463
6
f uctio
n
O i-4-1L. Vi
rO CV O
>- (J
79
74
82
75-79
77
77
77
71
54
54.77
54
73
82
79
82-83
82
7
ictio
n
i .
at i/>
c: oID U
X
X
X
X
X
X
8
<L>
i-—I
Soi
3
2
1
3
3
1
2
3
5
5
5
1
1
1
2
3
9 10 [
rry
1
2.4
1
1
2
1
2
2
2
2
2
1
1
1
3
1
11Yield
—E
150
9
35
10
5
2,5
4
10
10
15
ency
|
KJ
>*-
( ^
1
1
1
1
1
0
0
1
1
1
1
1
0
Î
1?
c
ji
Trea
'
0
0
0
0
0
0
0
0
0
0
0
0
0
0
0
0
3 4 14opacity
-a
" E
150
150
60
400
3 50
80
50
100
200
200
120
250
ienc
y
*«-
1
1
1
1
1
1
0
0
1
1
1
1
1
0
0
1
5
%o
Q_
1
1
1
0
1
1
1
0
1
1
2
1
1
1
1
Z
JLi__L
boos
te
_̂ao
1
0
0
0
0
0
0
0
0
0
0
0
0
0
0
0
17E
-aIQ(Li
.ct>
<a1S>
71
0
65
50
0
43
18E
a .a_
18000
4500
1100
12000
8700
1000
3500
10000
5000
4000
1700
1000
10000
5000
I '
taps
_̂o
o
13
5
1
9
1
12
10
5
2
10
1
7
7
20
ion
+ J
-a
o
2
5.4
1,4
5
62
1,4
1,3
5
1,4
2,4
2,5
5,6
2.3
.1
21
to ta*— ~a
en -
<a C!- Oeu E
O kO
0
.0
0
180
0
0
30
130
180
0
180
10
0
0
0
180
o
lita
ti
<OJZ.mce
n
î
in
n
n
i
nm
Comments
Not operated since Mar. 84Poor maintenance
Not oper. since 82. Pump broken
No engine; no d is t r ibu t ion
Source pol luted. Engines to bereplaced
Temporary tank, no d is t r ibu t ion
Source polluted
Pipeline to Chimbila brokensince -71 . Spring dries up during dryseason
Private W/S (Sisal estate)
Formerly pr ivât W/S. Engine broken.
Private W/S (Sisal estate) , Hbanja v i l lageserved by gravity l ine
OP's in poor condition
Temp. tank. No d i s t r i b . engine broken
Two separate r i s ing mains. Temporarytanks. No d is t r ibu t ion
Never operated. Line to Jangwani notcompleted. Source badly polluted
Distr ibut ion system underconstruction

1
No
17
18
19
20
21
22
23
24
25
26
27
28
29
30
31
Name of theScheme
Rutamba
'angaboi
Ikanga
Rondo
Kiwalala
Mtua
lyengedi
Mtama
Mahiwa
Nanganga
Chienjele
Ma dangwa
Ruan:jwa
Simana
Mnazimmoja
3
Wis ion
Mi lo la
Sudi
Rondo•
Mingoyo
Mtama
Mnàcho
n
Sudi
Ruangwa
Mi ngoyo
Mi ngoyo
4
Vi l lagescovered
Rutamba
Chitonj i
'angaboi
Mkanga
Mnara
Jtene•lihanga
itauna
Mtakuja
;hiponda;hiodyaKiwalalaMtua
.onga
Pîyengedi
.uwale
Mbalala
Mtama
Mahiwa
Nanganga
Chienjele
Namakuku
Madangwa
Mtegu
RuangwaLiuguru
SimanaNampunga
Mnaii mmoj a
HingoyoMahumbikaMkwayaNamunda
Ruhokwe
Mnolela
Zingat ia
5COen
c
lati
o
âOa
725
900
760
487
770
565
954
1020
1270
959
2716
2770
6965
1269
15670
5
Co
Of
tru
ct
u tr.at o>- u
64
82
82
81
71
65,78
71-76
57
70
83
77
80-31
78-79
SI-84
7
c4-
t.tu tA-o a
ë g
X
X
X
X
X
3
°
3
1
2
4
2
2
4
4
2
3
2
2
1,2
2
1
9
ity
fa
,
1
2
2
2
3
3,4
2
5
4
1
1
1
10
YieU
E
20
00
5
200
10
1
40
00
40
i
Tl
icyj
1
1
Î
1
0
0
1
1
0
0
1
1
1
1ns
' -
0
0
0
0
0
0
0
0
0
0
0
0
3 la
apacicy
-o
"Ï
00
20
640
280
2500
>,
^-
0
1
1
1
1
0
1
1
0
1
1
1
15
i .
Powe
1
1
1
1
1
1
1
1
2
1
1
1
1
2,1
16
t
f boo
oo
0
0
2
0
0
0
0
0
a
0
0
0
1
17E
-omV
JZ
u
IO
t o
30
470
40
13
£
lin
es
VQ.
a.
3500
1000
3000
17000
1600
4500
5500
2600
4000
12500
2000
11000
8500
19000
59
VI
a.
ao
11
4
13
10
43
20
itio
n
•o
co
2
2
2,5
5,6
2,6
5,6
5,6,7
5,6
(1)
2,4
1,2
1,2
1,5
21
i— -a
C un
L. Q
a.
0
10
0
0
0
0
0
0
0
40
40
180
2
5
D
I I
jan.
I l l
I I I
Aban
I I I
Aban
•
I
23
Comments
New engine insta l led -76
Dist ibut ion under construction
Under construction
Great pumping head; uneconomic scheme.
No other sources
Not operated since -79
Not operated since Keb. 84
Not operated since -82. Pumps, engines,
d is t r ibu t ion broken
Not operated since -80*
Not oper. since -82. Machines broken
Partly operating. Scheme extensionfrorc Mumburu (Masasi d i s t r i c t )
Nat oper. since -S3. Water sal ine,new source to be foundNot operating
Booster pumping not functioning
proberly (14.000;erved)
LINDI

LIWALE
1
No
1
2
3
4
5
6
7
8
9
1011
12
13
14
15
2
Name of theScheme
Liwale
Barikiwa
Mbaya
Likombora
Kipule
Kangirikit i
Ngunja
Mikunya
Ngongovale
Kibutuka
Kiangara
Makata
Ndapata
Hpigamiti
Kipelele
3
)i vision
Liwale
Makata
Liwale
I t
H
-
»
Kibutuka
Makata
L i wa1e
Kibutuk
Villagescovered
Liwale townLiwale B
Barikiwa
Mbaya
Kichonda
Likombora
KipuleMangirikit i
Njunja
Mi kunya
Ngongovele
Kibutuka
Kiangara
Dodoma
Makata
Ndapata
Mpigair.iti
Kipelele
5
tio
n 1
984
Pop
i
11037
1260
1431
678
1640
970
790
1640
173D
1310
1391
1260
996
1880
667
6
ctt
on
O t~
Yea
rco
ns
66
78
80
79
82
77
81
83-84
70
80-84
30
84
77
78
78
7
cti
on
S
Und
eco
ns
X
X
X
X
8
a)
Sour
4
2
4
2
2
2
2
1
2
1
1
2
2
2
1
9
3
2
2
2
3
22
21
2
51
2
1
10Tie i
" E
40
Liw.river
0,5
4
2
11
cnt
u
Su
ff
1
0
1
0
1
01
1
0
11
1
1
12
c
1
Tre
a
0
0
0
0
0
0
0
0
0
0
0
0
0
0
Lapa
• • Î
2 CO
80
1000
6060
60
80
14ciiy
E01
ici
Su
ff
0
0
10
0
1
1
1
1
I
15
,_
Pow
e
1
1
1
1
1
11
1
1
1
1
1
1
1
16
oo
ste
rs
oo
0
0
0
0
D
0
0
0
0
0
0
0
0
0
17
he
ad
mS
tat
70
54
13
77
70
42
60
68
83
18
c
Pip
e
8000
500
7000
1800
2700
2300
1200
1500
2000
1500
3000
2000
20C
19
CL
oo
24
1
7
7
3
6
5
6
6
6
7
0
?n
co
Con
d
3
5
2
5,7
3
3
5
5
6,7
2,6
2
21
ng
las
ts,
da
ys
• > - j z
C L
90
0
10
0
10
10
0
0
0
10
10
0
0
10
22
ita
tio
nbil
4O
4)
I
?
I l l
I I I
11
I I
I
I I
(III)I I
Aband.
Aband.
23
Comments
Water source, pumping to beimproved, AC-risirsg main to be replaced
Never operated, no d is t r i bu t ion
Second pumping un i t broken
Polluted source. Machines to be changed.New source needed.
Few spares missing
Pump worn out , source poorEngine foundation broken
Under constr. no engine
Pumps broken. D i f f i c u l t tomaintain, source to be improved
Water sal ine. Broken pipes, new source
Partly working, water not reaching
Kiangara. Rising main broken.
Under const r , , no pump, no d i s t r . no sourc
Never operated. Impossible to maintaindue to the distanceD i f f i c u l t access. Vi l lage locat ionchanged.Temparary tank. Rising main not completed.No tank, d i s t r i bu t i on .
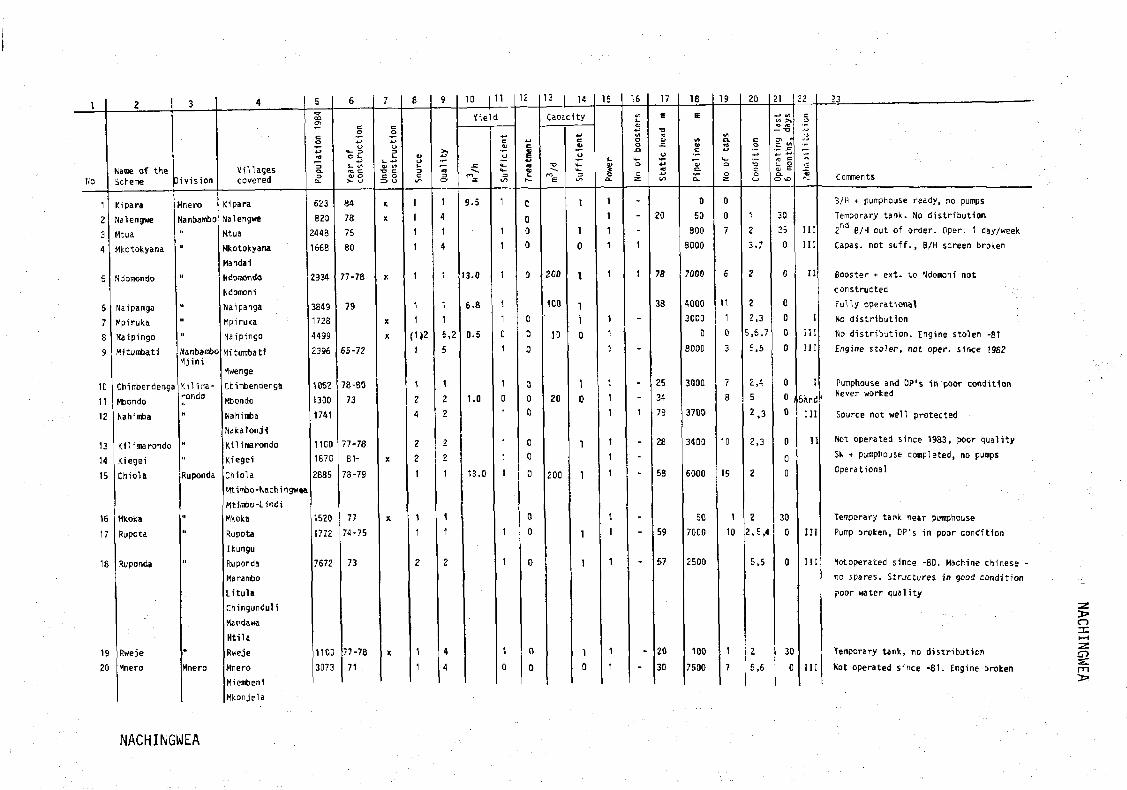
1I
No
1
2
3
4
5
6
7
8
9
10
11
12
13
14
15
16
17
18
19
20
Name o f theScheme
Kipara
Nalengwe
Mtua
Mkotokyana
Njomondo
Naipanga
Hpiruka
Naipingo
Mitumbati
Chimbendenga
Mbondo
Nahimba
Kil i ma rondo
Kiegei
Chiola
Hkoka
Rupota
Ruponda
Rweje
Hnero
3
ivision
IneroNanbambon
N
»
I I
I I
I I
NanbamboMjini
Ki l i r a -rondo
»
H
I I
Ruponda
H
»
»
•
Mnero
4
Villagescovered
Kipara
Nalengwe
Mtua
Mkotokyana
Mandai
Ndomondo
Ndomoni
Naipanga
Mpiruka
Naipingo
Mitumbati
Mwenge
Chirnbendenga
Mbondo
Nahimba
Nafealonj-f
Kilimarondo
Kiegei
Chiola
Mtimbo-Nachingw»a
Mtimbo-Lifidi
Hkoka
Rupota
Ikungu
Ruponda
Marambo
Li tulaChingunduliMandawa
Nti la
Rweje
Hnero
Hiembeni
Hkonjela
5
S
ion 1
4 J
Popu
l
623
820
2448
1668
2934
3849
1728
4499
2396
1062
1300
1741
11C01870
2885
1520
1712
7672
11 CO
3073
6
|
O i~
Year
cons
t
t!4
78
75
80
77-78
79
65-7?
78-80
73
77-78
81-
78-79
77
74-75
73
77-78
71
7
ctio
nUn
der
cons
t
X
X
X
X
X
X
X
X
8
Sour
c
1
1
1
1
1
1
1
(1)2
J
1
24
221
1
1
2
1
1
9
>,
Quai
i
1
4
1
4
1
1
1
5,2
5
1
2
2
2
2
1
1
1
2
4
4
10 1
Yiel
ë
9.5
13.0
6.8
0.5
1.0
13.0
11
d
ent
U
Suff
i
1
1
1
1
1
1
0
1
1
0
1
1
1
1
1
1
1
0
12
c
£
Trea
t
C
00
0
0
0
0
0
0
00
0
0
0
0
0
0
0
0
13 1 14
Capacity
£
200
100
10
20
200
ent
Suff
i
1
1
0
I
1
10
10
1
1
1
1
1
0
15
Powe
i
1
1
1
1
1
1
1
)
1
1
i
t
1
1
!
1
1
1
1
16
Vi1_
*JVIOO
. O
o
o
-
-
-
1
]
-
-
-
-
1
-
-
-
-
-
-
-
-
17
e
•o
V
_u
Stat
20
78
38
25
34
79
28
58
59
57
20
30
18
e
vtOi
c
Pipe
l
0
50
800
8000
7000
4000
3000
0
8000
3000
3700
3400
6000
50
7000
2500
100
7500
19
VIa.«a
o
oz :
0
0
7
6
11
1
0
3
7
8
10
19
1
10
1
7
20
cO'Z>
Cond
-
1
2
3,7
2
2
2,3
5,6,7
5,6
2,4
52 . 3
2,3
2
2
2,5,4
5,6
t
5,6
21
+J vtv» > ,
.— "Ocn *£ -£
o> sO W3
30
25
0
0
0
0
0
0
0
0 i
0
0
0
0
30
0
0
30
0
22
c
'3
I I I
I I I
i ;
i
mi n
i
bane
I I I
I I
I I I
I I I
I I I
23
Comments
B/H + pumphouse ready, no pumps
Temporary tank. No d is t r ibu t ionnd2 B/H out of order. Oper. 1 day/week
Capas. not su f f . , B/H screen broken
Booster + ext . to Ndomoni not
constructed '• :
Fully operational
No d is t r ibu t ion
No d i s t r i bu t i on . Engine stolen -81
Engine stolen, not oper. since Î982
Punphouse and DP's in poor condition, Never worked
Source not well protected
Not operated since 1983, poor qual i ty
SH + pumphouse completed, no pumps
Operational
Temporary tank near pumphouse
Pump broken, DP's in poor condition
Hot operated since -80. Machine Chinese -
no spares. Structures in good condition
poor water qual i ty
Temporary tank, no d is t r ibu t ion
Not operated since - 8 1 . Engine broken
o
NACHINGWEA
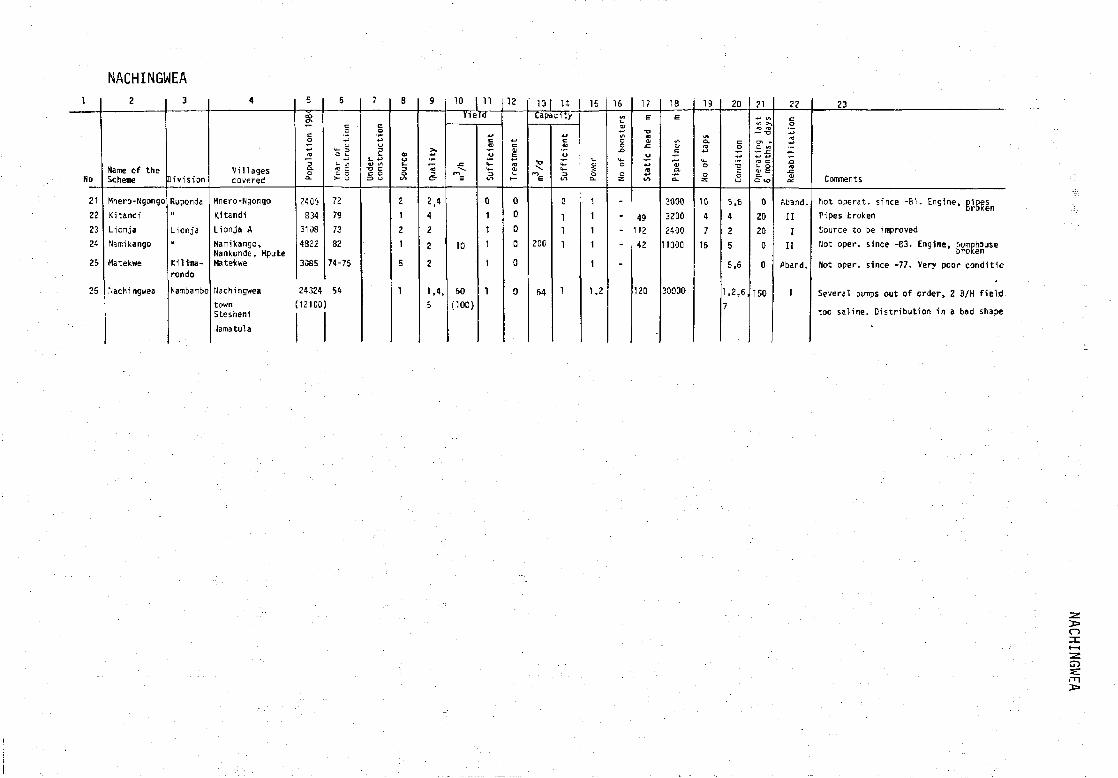
NACHINGWEA1
No
21
22
23
24
25
25
2
Name of theScheme
Mnero-Ngongo
Kitandi
Lionja
Nimi tango
Matekwe
riacM ngwea
3
Division
Ruponda
Lionja
Kilima-rondo
Nambambo
4
Vi l lagescovered
Mnero-Ngongo
Kitandi
Lionja A
Namikango,Nankunde, MputeMatekwe
NachingweatownStesheni
Jama tu la
5
S
ilat
ion 1
£
2400
S34
3108
4822
3085
24324
1210G
6
• of
truc
tion
h- 1/1
S i>- o
72
79
73
82
74-75
7
;r truc
tion
Is
B
01
Sour
21
2
1
5
1
9
Quai
2,4
4
2
2
1.1.5
10 11
TieTa—
10
60
(100}
Suff
icie
nt
0
1
1
1
1
1
12
tmen
t
Ï1—
00
0
0
0
0
13 UCapacity
206
64
icie
nt
0
11
1
1
15
Powe
1
1
1
1
1
1,2
16
£
•f bo
os te
-
-
-
-
-
17e
1c he
ad
49112
42
120
18£
line
sPi
pe
3000
3200
2400
11000
30000
19
f ta
ps
o
10
4
7
16
20
itio
n
O
5.6
4
2
5
5,6
1.2,6,
7
214^ in
r— "O
CT -
C m
Oper
,6 moi
0
20
20
0
0
150
22
S
bili
tati
i
ftband.
I I
I
I I
flband.
I
23
Comments
Hot operat. since - 8 1 . Engine, P ig f s
Pipes broken
Source to be improved
Not oper. since -83. Engine, puoiphousebroken
Hot oper. since -77. Very poor cond i t io
Several pumps out of order, 2 B/H f i e l d
too sa l ine. D is t r i bu t ion in a bad shape
*
3»
CD
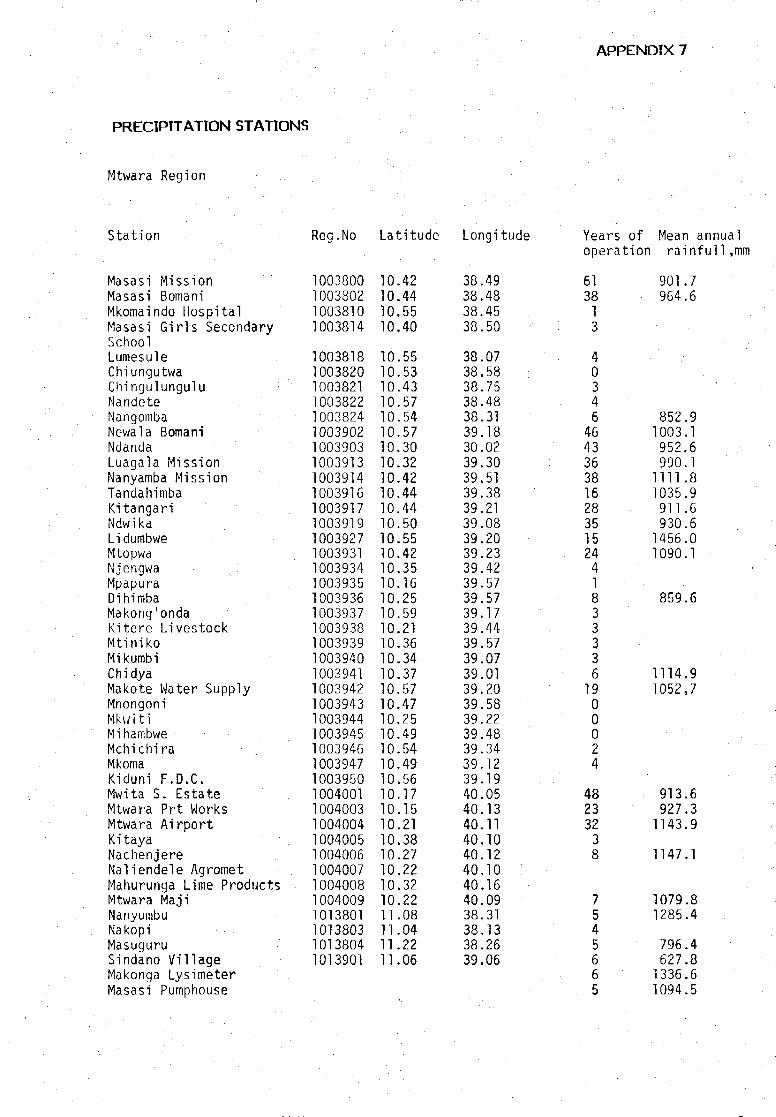
PRECIPITATION STATIONS
Mtwara Region
APPENDIX 7
Station
Masasi MissionMasasi BomaniMkomaindo HospitalMasasi Girls SecondarySchoolLumesuleChiungutwaChingulunguluNandete :NangombaNewala BomaniNdandaLuagala MissionNanyamba MissionTandahimbaKitangariNdwikaLidumbweMtopwaNjengwa , :MpapuraDihimbaMakong'ondaKitere LivestockMtinikoMikumbiChidyaMakote Water SupplyMnongoniMkwitiMihambweMchichiraMkomaKiduni F.D.C.Mwita S. EstateMtwara Prt WorksMtwara AirportKitayaNachenjereNaliendele AgrometMahurunga Lime ProductsMtwara MajiNanyumbuNakopiMasuguruSindano VillageMakonga LysimeterMasasi Pumphouse
Reg.No
1003800100380210038101003814
10038181003820100382110038221003824100390210039031003913100391410039161003917100391910039271003931100393410039351003936100393710039381003939100394010039411003942100394310039441003945100394610039471003950100400110040031004004100400510040061004007100400810040091013801101380310138041013901
Latitude
10.4210.4410.5510.40
10.5510.5310.4310.5710.5410.5710.3010.3210.4210.4410.4410.5010.5510.4210.3510.1610.2510.5910.2110.3610.3410.3710.5710.4710.2510.4910.5410.4910.5610.1710.1510.2110.3810.2710.2210.3210.2211.0811.0411.2211.06
Longitude
38.4938.4838.4538.50
38.0738.5838.7538.4838.3139.1830.0239.3039.5139.3839.2139.0839.2039.2339.4239.5739.5739.1739.4439.5739.0739.0139.2039.5839.2239.4839.3439.1239.1940.0540.1340.1140.1040.1240.1040.1640.0938.3138.1338.2639.06
Years ofoperation
613813
40346464336381628351524418333361900024
48233238
7545665
Mean annualrainfull,mm
901.7964.6
852.91003.1952.6990.11111.81035.9911.6930.61456.01090.1
859.6
1114.91052,7
913.6927.31143.9
1147.1
1079.81285.4
796.4627.81336.61094.5

Precipitation Stations
Lindi Region
Sation
Kipatimu MissionNjinjoKandawaleKilwa KivinjeKilwa MasokoMiteja :
KinjumbiKikoleLiwale MissionLi wale HydrometMlembweMitononoKimambiKikwetu S. EstateMnyangalaNanjirinjiPandeNaikokweMandawa AKiwawaLihimalyaoMipingoMandawa BNangaruMchingaLikawageLindi MajiNgongoweleMnero MissionNachingwea Part TimeKilimarondoLionja BarazaNachingwea J.K.T.NdomoniRuangwaNAFCO NachingweaChimbendengaLindi BomaniNarunyu MissionMahiwa COM CollegeNtene RondoMnachoSt. Cyprian Coll. RondoChilala F.D.C.NyengediMadangwaSingi raNahoro
Reg.No Latitude Longitude
9838049838059838079839009839049839079839089839099937009937019937029938029938039939019939089939099939109939119939129939139939149939159939169939179939189939199939201003708100380310038071003816100381710038191003819100382510038261003827100390610039121003920100392310039291003932100393310039481003949993828
8.318.498.388.458.518.368.248.46.47.46.36.75
9.269.51.35.39.08.07.22.10.20.37,55.50.44.14,59
10.0510.1110.2110.3310.1010.2610.3310.0410.2610.2310.0010.1010.2110.0810.1610.1010.0210.1510.12
9.9.9.9.
9.9.9.9.9.9.9.9.9.9.9.9.9.
38.5538.5238.4739.2539.3139.1539.1039.1937.5537.5737.3938.5538.2639.4439.2039.0439.3539.0339.2739.2039.3839.2839.0839.2939.4239. 039.4237.4838.3838.4538.0038.3038.3538.4838.5638.4538.1939.4239.3339.1639.1539.0139.1639.3039.2039.48
Years ofoperation
31855428111416
9
49951450241200763332967422040301629
1763
56
Mean annualrainfull, mm
1080.31191.7805.11045.21020.4
880.0897.9
959.4
864.31070.7933.6
891.1
1103.0914.4889.7944.41219.1959.9640.0778.8
930.6944.6875.41173.8
989.51102.5
956.41542.8

APPENDIX 8
PRECIPITATION DURING THE RAINY SEASON 1976 - 1983
Staffer*
1.
2.
3.4.
5.
6.
7.8.9.
10.
11.
12.
13.
14.15.
16.
17.
18.
Kipatimu Mission
KUwa Kivinje
Liwale Hydromet
Mitonono
Kikwetu Sisal Estate
Mnyangala
Nachingwea
Kilimarondo
Newala Boma
Ndanda Mission
Lindi Boma
Luagala Mission
Nanyamba Mission
Mtene Rondo
Mtopwa
Mtwara Port
Mtwara Airport
Tunduru
98.3804
98.3900
99.3701
99.3802
99.3901
99.3908
100.3807
100.3816
100.3902
100.3903
100.3906
100.3913
100.3914
100.3923
100.3931
100.4003
100.4004
101.3700

STATION:
REG.NO:
KIPATIMU
98.3804
MONTHLY RAINFALL DATAAPPENDIX 8
1 (4)
YEAR
1976-771977-781978-791979-801980-811981-82
MEAN
JUL
19.11.30.013.60.90.0
5.8
AUG
1.712.211.712.86.38.2
3.8
SEP
1.2
13.07.57.76.0
OCT
42.4
9.313.620.211.9
NOV
5.9
122.730.5115.76.0
DEC
69.7
244.3204.7160,9204.0
JAN
120.1113.7106.7118.288.337.3
97.4
FEB
49,035.1143.3
32.214.4
MAR
180.2168.3347.472,9151.0181.8
183,6
APR
140,0131.7223.477.882.489.4
124.1
MAY
36.1115.7106.297.2120.0
JUN
0.08.427.00.00.03.7
6.5
TOTAL
1337
762682
927
Ej
R7
7
STATION:
REG.NO:
KILWA KIVINJE
98.3900
Long time mean: 1080.3 (31 yrs)
YEAR
1976-771977-781978-791979-801980-811981-821982-83
MEAN
JUL
1.00.014.28.30.610.5
5.8
AUG
9.233.43.84.619.63.1
12.3
SEP
48.63.9
45.93.910.30.0
18.8
OCT
37.039.79.53.710.673.1
28.9
NOV
121.0215.549.777.634.139.6
89.6
DEC
168.6252.8159.5164.1326.3231.7
217.2
JAN
170.4121.9174.3232.590.617.193.6
128.6
FEB
24.144.9166.827.6125.943.0158.5
84.4
MAR
205.1196.9222.041.6202.1171.767.8
158.2
APR
206.8107.2299.572.489.9164.0231.4
167.3
MAY
75,432.2140.749.572.0149.1272.3
113,0
JUN
3.136.750.20.0
27.522.48.0
21.1
TOTAL
925.21598.8706.2870.1
• 968.8
1189.6
1045.2
STATION: LIWALE METEOROLOGICAL STATION
REG.NO: 99.3701
YEAR
1976-771977-781978-791979-801980-811981-821982-83 .
MEAN
JUL
0.00.01.90.00.00.1
0.3
AUG
0.00.00.00.00.00.0
0.0
SEP
1.40.00.00.30.00.0
0.3
OCT
13.30.00.013.40.344.7
12.0
NOV
70.347.018.532.229.7170.0
61.3
DEC
96.0168.8191.253.2168.2116.4
132.3
JAN
162.0127.3167.2324.8130.182.4214.6
172.6
FEB
46.8104.5401.857.7162.0131.9236.3
163.0
MAR
134.1158.6216.1241.7100.3292.6181.8
189.3
APR
105.786.9210.1179.756.569.594.8
114.7
MAY
37.46.22.7
28.287.4128.369.1
51.3
JUN
0.00.00.00.00.00.44.7
0.8
TOTAL
664.51213.71043.7635.4903.31132.5
897.9
STATION: MBWEMKURU MITONONO
REG.NO: 99.3802
YEAR
1976-771977-781978-791979-801980-811981-821982-83
MEAN
JUL
0.00.07.6O.O0.02.4
1.7
AUG
0.38.20.00.40.00.0
1.5
SEP
0.42.01.64.40.00.0
1.4
OCT
1.60.00.04.40.01.4
1.2
NOV
123.150.530.94.02.858.2
44.9
DEC
101.4232.4170.081.068.5106.9
126.7
JAN
126.1132.8158.8237.4120.443.680.5
128.5
FEB
72.145.4203.710.881.6301.646.4
108.8
MAR
145.6115.8165.3172.9102.698.3232.5
147.6
APR
181.8117.8165.954.681.6133.298.4
119.0
MAY
21.05.6
26.457.450.820.252.0
33.3
JUN
0.00.012.40,07.80.0
42.0
8.9
TOTAL
644.21025.6743.2539.0668.2720.7
723.5
STATION:
REG.NO:
KIKWETU S.E
99.3901
YEAR
1976-771977-781978-791979-801980-811981-821982-83
MEAN
49 YEARS
JUL
18.50.00.011.60.00.06.7
3.1
4.2
AUG
0.02.015.00.00.00.01.3
3.1
4.3
SEP
21.57.35.54.020.95.8
56.0
16.6
11.7
OCT
0.05.58.66.28.913.031.7
12.3
20.3
NOV
33.589.326.455.932.941.151.9
49.6
50.9
DEC
124.2172.9314.987.3236.8191.3174.5
196.3
145.3
JAN
149.790.0199.3319.9127.643.4150.7
154.4
167.0
FEB
28.630.5165.361.0105.2129.1117.8
91.1
116.2
MAR
93.4221.9173.0162.9149.1126.779.8
143.8
164.3
APR
105.343.8135.5108.040.0111.499.5
91.9
137.8
MAY
19.663.421.581.511.530.2182.4
58.6
34.0
JUN
0.00.00.00.00.04.929.9
5.0
8.3
TOTAL
594.3726.61065.0898.3732.9696.9982.2
825.8
864.3
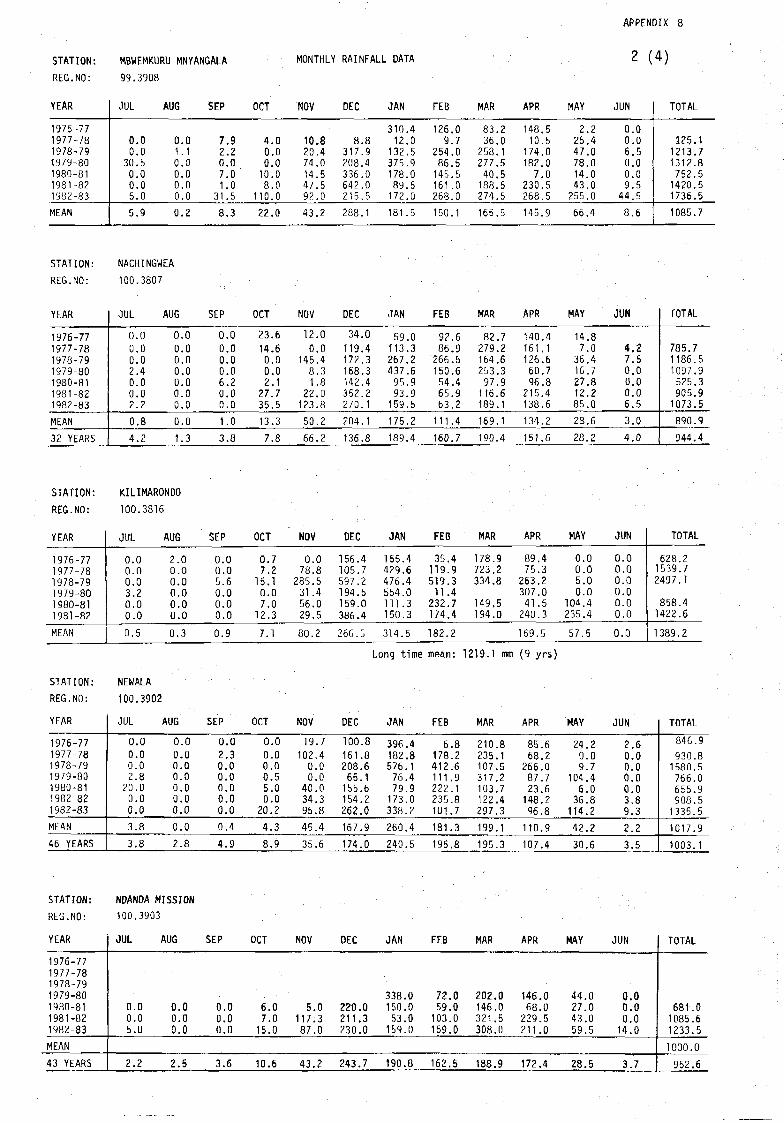
STATION: MBWEMKURU MNYANGALA
REG.NO: 99.3908
MONTHLY RAINFALL DATA
APPENDIX
2 (4)
YEAR
1976-771977-781978-791979-801980-811981-821902-83
MEAN
JUL
0.00.0
30.50.00.05.0
5.9
AUG
0.01.10.00.00.00.0
0.2
SEP
7.92.20.07.01.0
31.5
8.3
OCT
4.00.00.010.08.0
110.0
22.0
NOV
10.820.474.014.547.592.0
43.2
DEC
8.8317.9208.4336.0642.0215.5
288.1
JAN
310.412.0132.5375.9178.089.5172.0
181.5
FEB
126.09.7
254.086.5145.5161 .0268.0
150.1
MAR
83.236.0258.1277.540,5188.5274.5
165.5
APR
148.510.5
174.0182.07.0
230.5268.5
145.9
MAY
2.225.447.078.014.043.0255.0
66.4
JUN
0,00.06.50.00.09.5
44.5
8.6
TOTAL
125.11213.71312.8752.51420.51736.5
1085.7
STATION:
REG.NO:
NACHINGWEA
100.3807
YEAR
1976-771977-781978-791979-801980-811981-82198Z-83
MEAN
32 YEARS
JUL0.0
U.O0.02.40.00.02.2
0.8
4.2
AUG
0.00.00.00.00.00.00.0
0.0
1.3
SEP
0.00.00.00.06.20.00.0
1.0
3.8
OCT
23.6
14.60.00.02.1
27.735.5
13.3
7.8
NOV12.0
0.0145.48.31.8
22.0123.8
50.2
66.2
DEC
34.0
119.4172.3168.3142.4352.2270.1
204.1
136.8
JAN
59.0113.3267.2437.695.993.9159.5
175.2
189,4
FEB
92.686.9266.5150.654.465.963.2
111.4
160.7
MAR
82.7279.2164.6253.397.9116.6189.1
169.1
190.4
APR
140.4161.1126.660.796.8
215.4138.6
134.2
151.6
MAY
14.8
7.036.416.727.812.285.0
28.6
28.2
JUN
4.27.50.00.00.06.5
3.0
4.0
TOTAL
785.71186.51097.9525.3905.91073.5
890.9
944.4
STATION:
REG.NO:
STATION:
REG.NO:
KILIMARONDO
100.3816
YEAR
1976-771977-781978-791979-801980-811981-82
MEAN
JUL
0.00.00.03.20.00.0
0.5
AUG
2.00.00.00.00.00.0
0.3
SEP
0.00.05.60.00.00.0
0.9
OCT
0.77.215.10.07.012.3
7.1
NOV
0.078.8
285.531.456.029.5
80.2
DEC
156.4105.7597.2194.5159.0386.4
266.5
JAN
165.4429.6476.4554.0111.3150.3
314.5
FEB
35.4119.9519.3
11.4232.7174.4
182.2
MAR
178.9723.2334.8
149.5194.0
APR
89.475.3
263.2307.041.5240.3
169.5
MAY
0.00.05.00.0
104.4235.4
57.5
JUN
0.00.00.00.00.00.0
0.0
TOTAL
628.21539.72497.1
858.41422.6
1389.2
Long time mean: 1219.1 mm (9 yrs)
NEWALA
100.3902
YEAR
1976-771977-781978-7919/9-801980-811982-821982-83
MEAN
46 YEARS
JUL
0.00.00.02.820.00.00.0
3.8
3.8
AUG
0.00.00.00.00.00.00.00.0
2.8
SEP
0.02.30.00.00.00.00.0
0.4
4.9
OCT
0.00.00.00.55.00.0
20.2
4.3
8.9
NOV
19.7
102.40.00.0
40.034.395.8
45.4
35.6
DEC
100.8
161.8208.665.1155.6154.2262.0
167.9
174.0
JAN
396.4182.8576.176.479.9173.0338.2
260.4
240.5
FEB
6.8178.2412.6111.9222.1235.8101.7
181.3
195.8
MAR
210.8235.1107.5317.2103.7122.4297.3
199.1
195.3
APR
85.668.2
266.087.723.6148.296.8
110.9
107.4
MAY
24.20.09.7
104.46.036.8114.2
42.2
30.6
JUN
2.60.00.00.00.03.89.3
2.2
3.5
TOTAL
846.9
930.81580.5766.0655.9908.51335.5
1017.9
1003.1
STATION:
REG.NO:
NDANDA MISSION100.3903
YEAR
1976-771977-781978-791979-801980-811981-821982-83
MEAN
43 YEARS
JUL
0.00.05.0
2.2
AUG
0.00.00.0
2.5
SEP
0.00.00.0
3.6
OCT
6.07.015.0
10.6
NOV
5.0117:387.0
43.2
DEC
220.0211.3230.0
243.7
JAN
33815053159
190
.0
.0
.0
.0
.8
FEB
72.059.0103.0159.0
162.5
MAR
202.0146.0321.5308.0
188.9
APR
146.068.0229.5211.0
172.4
MAY
44.027.043.059.5
28.5
JUN
0.00.00.014.0
3.7
TOTAL
681.01085.61233.5
1000.0
952.6

STATION:
REG.NO:
MONTHLY RAINFALL DATA
APPENDIX 8
3 (4)
LINDI AGRICULTURE
100.3906
YEAR
1976-771977-781978-791979-801980-811981-821982-83MEAN
40 YEARS
JUL
42.36.530.58.00.00.016.3
10.2
9.7
AUG
2.714.510.70.00.00.50.8
4.4
7.2
SEP
14.611.123.911.038.83.414.3
17.1
12.9
OCT
10.44.014.310.0
134.227.739.8
38.3
19.8
NOV
9.2131.50.060.979.826.644.1
57.2
52.6
DEC
126.8202.5219.2223.7152.6313.1133.3
207.4
143.8
JAN
234.5240.9334.3261.6168.070.6107.9
201.1
149.9
FEB
55.658.0
222.640.1136.3140.945.8
99.9
120.4
MAR
99.6718.0378.1242.2132.6163.0187.1
274.4
185.4
APR
138.6225.6276.5179.771.9128.9186.2
172.5
174.7
MAY
37.263.966.8173.16.075.3149.0
81.6
43.2
JUN
3.21.0
35.00.00.024.524.8
12.6
11.0
TOTAL
774.71677.51611.91210.3910.2974.5949.4
1176.7
930.6
STATION:
REG.NO:
LUAGALA MISSION
100.3913
YEAR
1976-771977-781978-791979-801980-811981-821982-83
MEAN
36 YEARS
JUL
4.00.00.07.50.00.00.0
1.3
2.6
AUG
0.00.00.00.00.09.03.0
2.0
4.7
SEP
1.544.01.50.76.00.04.0
9.4
9.3
OCT
18.010.210.512.720.01.3
26.6
13.6
23.6
NOV
91.8180.048.048.36.972.2170.2
87.6
63.3
DEC
160.791.6129.4118.436.1326.0235.6
156.2
133.3
JAN
152.775.8166.3287.7121.1145.482.6
147.4
185.4
FEB
347.078.7
220.932.8184.188.8100.6
150.4
179.0
MAR
155.2257.2186.6234.594.8263.0374.1
233.6
226.3
APR
102.981.1181.7
25.7157.152.2
100.1
130.9
MAY
9.70.018.5
279.98.213.7
162.5
34.4
26.8
JUN
1.50.00.80.00.03.012.2
2.5
4.9
TOTAL
1045.0818.6964.2
502.91079.51223.6
938.5
990.1
STATION:
REG.NO:
NANYAMBA MISSION
100.3914
YEAR
1976-771977-781978-791979-801980-811981-821982-83
MEAN
38 YEARS
JUL
18.50.00.03.50.00.02.9
1.1
8.5
AUG
2.30.10.00.015.90.010.6
4.4
8.2
SEP
1.334.610.32.00.00.08.1
9.2
12.9
OCT
9.625.912.00.012.232.232.2
19.1
20.3
NOV
56.0117.9127.017.847.375.3154.5
90.0
72.5
DEC
153.3116.4332.1248.176.0105.2344.8
203.8
175.7
JAN
184.764.8176.1438.3124.8107.2130.9
175.3
200.8
FEB
133.229.3141.496.5156.958.4148.5
109.2
196.6
MAR
175.8259.3157.8341.6125.6182.9242.9
212.3
213.2
APR
135.6155.9188.1123.867.3143.9185.0
142.8
165.6
MAY
20.61.1
42.769.90.013.1198.3
49.4
32.6
JUN
1.34.72.90.04.926.312.6
7.5
4.9
TOTAL
892.2810.01190.41341.5630.9744.51571,3
1024.1
1111.8
STATION:REG. NO:
MTENE RONDO100.3923
YEAR
1976-771977-781978-791979-801980-811981-82
MEAN
JUL
7.59.00.011.42.80.0
5.1
AUG
3.011.11.50.83.51.7
3.6
SEP
0.010.313.02.20.00.0
4.3
OCT
4.43.89.71.131.247.2
16.2
NOV
20.152.9127.53.615.029.1
41.4
DEC
139.2168.1308.1207.9143.1179.3
191.0
JAN
74.3136.6391.9210.7145.3115.1
179.0
FEB
81.648.9198.5158,9127.199.3
119.1
MAR
226.0234.8290.0452.2102.8358.8
277.4
APR
143.2138.2
264.256.9165.4
MAY
31.56.830.969.061.352.5
42.0
JUN
0.016.32.90.01.5
18.8
6.6
TOTAL
730.8820.5
1382.0690.51067.2
93S.2
Long time mean: 1173.8 nm (29 yrs)
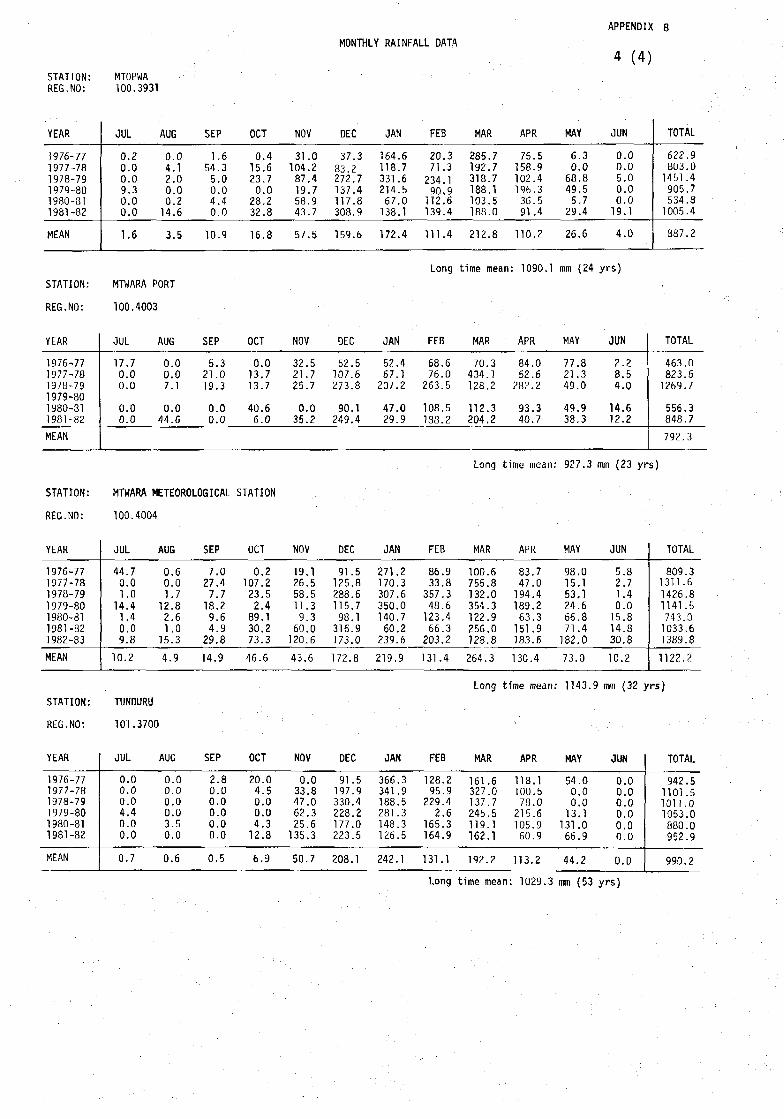
STATION:REG.NO:
STATION:
REG.NO:
STATION:
REG.NO:
MONTHLY RAINFALL DATA
APPENDIX 8
4 (4)MTOPWA100.3931
YEAR
1976-771977-781978-791979-801980-811981-82
MEAN
JUL
0.20.00.09.30.00.0
1.6
AUG
0.04.12.00.00.214.6
3.5
SEP
1.654.35.00.04.40.0
10.9
OCT
0.415.623.70.028.232.8
16.8
NOV
31.0104.287.419.758.943.7
57.5
DEC
37.333.2272.7137.4117.8308.9
159.6
JAN
164.6118.7331.6214.567.0138.1
172.4
FEB
20.371.3234.190.9112.6139.4
111.4
MAR
285.7192.7318.7188.1103.5188.0
212.8
APR
75.5158.9102.4196.336.591.4
110.2
MAY
6.30.068.849.55.729.4
26.6
JUN
0.00.05.00.00.019.1
4.0
TOTAL
622.9803.01451.4905.7534.81005.4
S87.2
Long time mean: 1090.1 mm (24 yrs)
MTWARA PORT
100.4003
YEAR
1976-771977-781978-791979-801980-311981-82
MEAN
JUL
17.70.00.0
0.00.0
AUG
0.00.07.1
0.044.6
SEP
5.321.019.3
0.00.0
OCT
0.013.713.7
40.66.0
NOV
32.521.725.7
0.035.2
DEC
52.5107.6273.8
90.1249.4
JAN
52.467.1207.2
47.029.9
FEB
68.676.0263.5
108.5133.2
MAR
70.3434.1128.2
112.3204.2
APR
84.052.6282.2
93.340.7
MAY
77.821.349.0
49.938.3
JUN
2.28.54.0
14.612.2
TOTAL
463.0823.61269.7
556.3848.7
792.3
Long time mean: 927.3 mm (23 yrs)
STATION: MTWARA METEOROLOGICAL STATION
REG. NO: 100.4004
YEAR
1976-771977-781978-791979-801980-811981-821982-83
MEAN
JUL
44.70.01.014.41.40.09.8
10.2
AUG
0.60.01.712.82.61.0
15.3
4.9
SEP
7.027.47.718.29.64.929.8
14.9
OCT
0.2107.223.52.489.130.273.3
46.6
NOV
19.126.558.611.39.360.0120.6
43.6
DEC
91.5125.8288.6115,798.1316.9173.0
172.8
JAN
271.2170.3307.6350.0140.760.2239.6
219.9
FEB
86.933.8357.348.6123.466.3203.2
131.4
MAR
100.6755.8132.0354.3122.9256,0128.8
264.3
APR
83.747.0194.4189.263.3151.9183.6
130.4
MAY
98.015.153.124.666.871.4182.0
73.0
JUN
5.82.71.40.015.814.830.8
10.2
TOTAL
809.31311.61426.81141.5743.01033.61389.8
1122.2
Long time mean: 1143.9 mm (32 yrs)
TUNDURU
101.3700
YEAR
1976-771977-781978-791979-801980-811981-82
MEAN
JUL
0.00.00.04.40.00.0
0.7
AUG
0.00.00.00.03.50.0
0.6
SEP
2.80.00.00.00.00.0
0.5
OCT
20.04.50.00.04.312.8
6.9
NOV
0.033.847.062.325.6135.3
50.7
DEC
91.5197.9330.4228.2177.0223.5
208.1
JAN
366.3341.9188.5281.3148.3126.5
242.1
FEB
128.295.9229.42.6
165.3164.9
131.1
MAR
161.6327.0137.7245.5119.1162.1
192.2
APR
118.1100.578.0215.6105.960.9
113.2
MAY
54.00,00,013.1131.066.9
44.2
JUN
0.00.00.00.00.00.0
0.0
TOTAL
942.51101.51011.01053.0880.0952.9
990.2
Long t ime mean: 1029.3 mm (53 y r s )
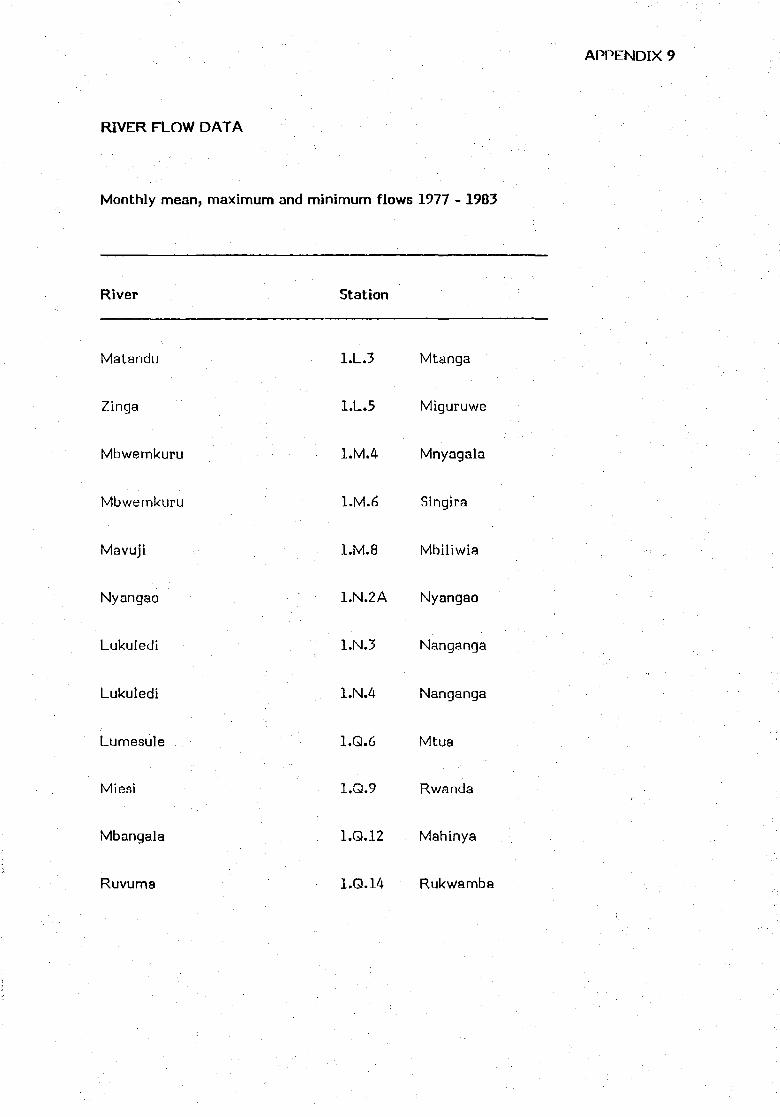
APPENDIX 9
RIVER FLOW DATA
Monthly mean, maximum and minimum flows 1977 - 1983
River Station
Matandu
Zinga
Mbwemkuru
Mbwemkuru
Mavuji
Nyangao
Lukuledi
Lukuledi
Lumesule
Miesi
Mbangala
Ruvuma
1.L.3 Mtanga
1.L.5 Miguruwe
l.M.A Mnyagala
1.M.6 Singira
1.M.8 Mbiliwia
1.N.2A Nyangao
1.N.3 Nanganga
l.N.A Nanganga
1.Q.6 Mtua
1.Q.9 Rwanda
1.Q.12 . Mahinya
1.Q.14 Rukwamba
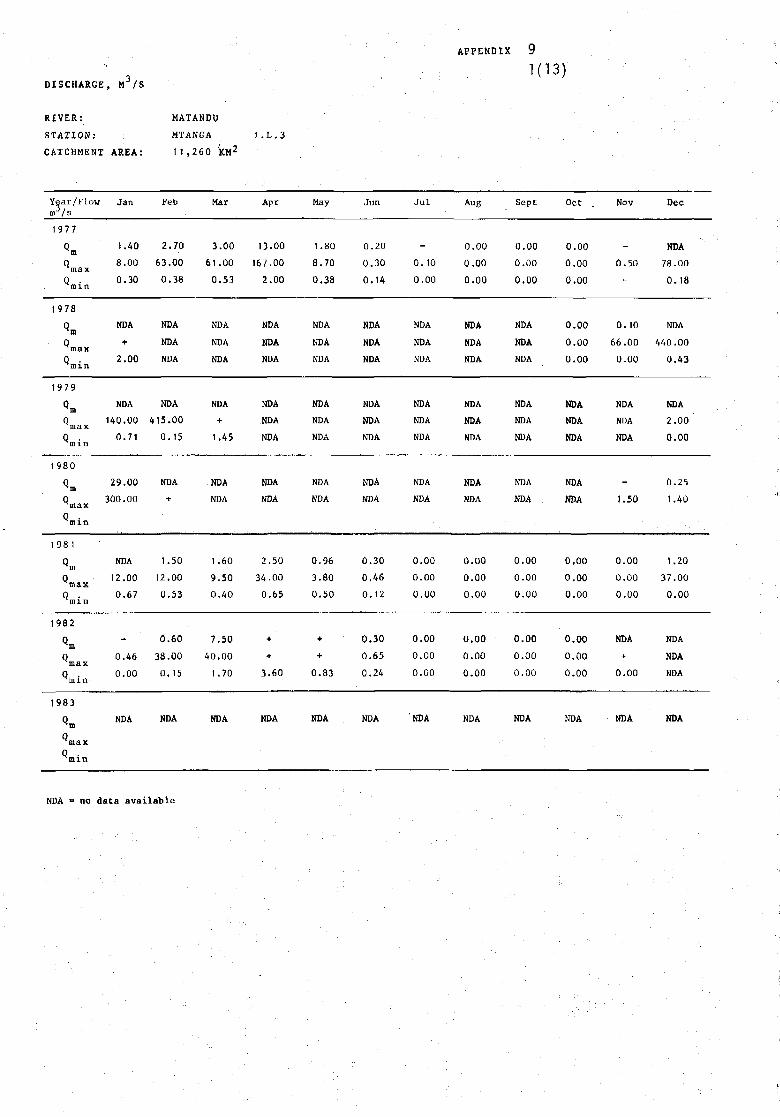
DISCHARGE, M /S
APPENDIX
1(13)
RIVER:
STATION:
CATCHMENT
Year/Flowffl3/s
1977
"m
max
"min
1978
Qra
m i n
1979
"m
max
m i n
1980
Qm
max
m i n
1981
Qm
1982
Qm
max
min
AREA:
Jan
1.40
8.00
0.30
NDA
+
2.00
NDA
140.00
0.71
29.00
300.00
NDA
12.00
0.67
-
0.46
0.00
MATANDU
MTANGA
i l , :
Feb
2.7063.00
0.38
NDA
NDA
NDA
NDA
415.00
0.15
NDA
+
1.50
12.00
0.53
0.60
38.00
0.15
2 60 KM2
Mar
3.00
61.00
0.53
NDA
NDA
NDA
NDA
+
1.45
NDA
NDA
1.60
9.500.40
7.50
40.001.70
1 .L.3
Apr
13.00
167.002.00
NDA
NDA
NDA
NDA
NDA
NDA
NDA
NDA
2.5034.00
0.65
+
3.60
May
1.80
8.70
0.38
NDA
NDA
NDA
NDA
NDA
NDA
NDA
NDA
0.96
3.800.50
+
0.83
Jun
0.20
0.30
0.14
NDA
NDA
NDA
NDA
NDA
NDA
NDA
NDA
0.300.46
0.12
0.30
0.65
0.24
J u l
-
0.100.00
NDA
NDA
NDA
NDA
NDA
NDA
NDA
NDA
0.000.00
0.00
0.00
0.00
0.00
Aug
0.000.00
0.00
NDA
NDA
NDA
NDA
NDA
NDA
NDA
NDA
0.00
0.000.00
0.000.00
0.00
Sept
0.000.00
0.00
NDA
NDA
NDA
NDA
NDA
NDA
NDA
NDA
0.00
0.000.00
0.000.00
0.00
Oct
0.000.00
0.00
0.00
0.00
0.00
NDA
NDA
NDA
NDA
NDA
0.00
0.000.00
0.00
0.000.00
Nov
-
0.50
0.10
66.00
0.00
NDA
NDA
NDA
-
1.50
0.00
0.000.00
NDA
0.00
Dec
NDA
78.00
0.18
NDA
440.00
0.43
NDA
2.000.00
0.25
1.40
1.20
37.000.00
NDA
NDA
NDA
1983
NDA NDA NDA NDA NDA NDA NDA NDA NDA NDA NDA NDA
m i n
NDA « no data ava i l ab l e
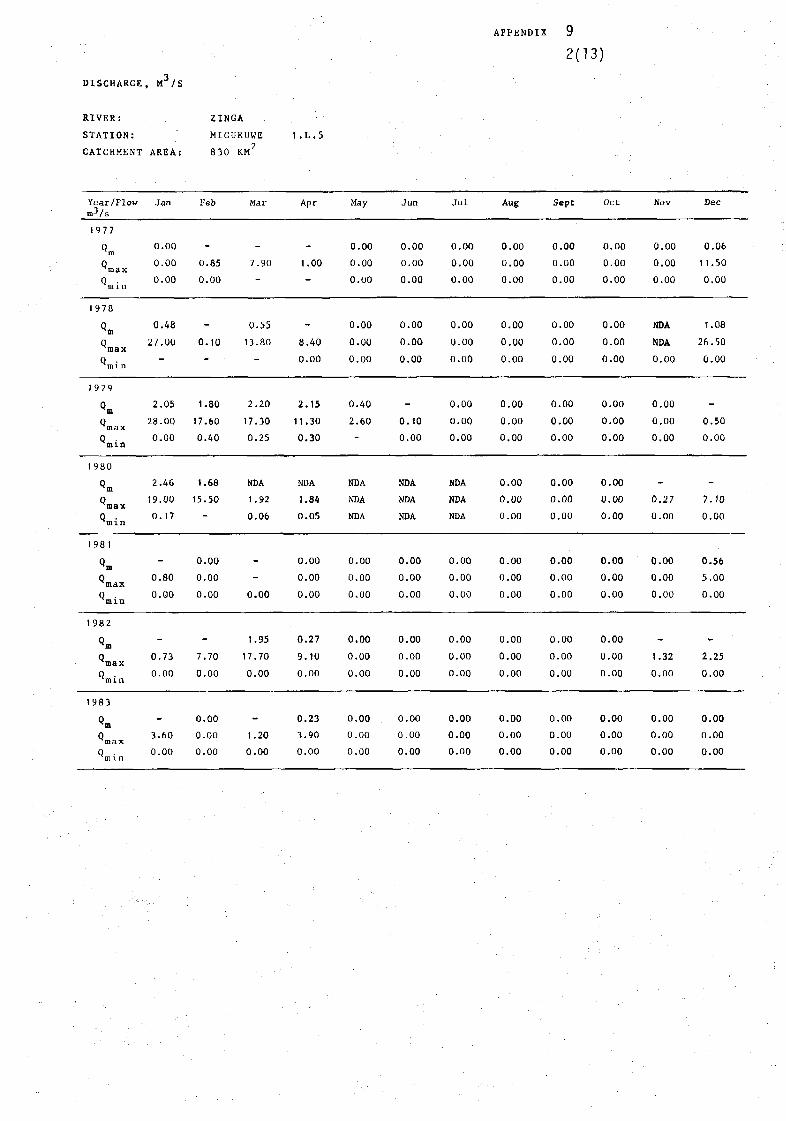
APPENDIX 9
2(13)
DISCHARGE, M /S
RIVER:
STATION:
CATCHMENT
Year/Flowm3 /s
1977
%
m i n
1978
Qm
max
min
1979
Qm
m i n
1980
«»-
Qmax
m i n
1981
<>m
m i n
1982
%
max
rain
1983
m i n
AREA:
J a n
0.00
0.00
0.00
0.48
27.00
2.05
28.00
0.00
2.46
19.00
0.17
-
0.80
0.00
-
0.73
0,00
_
3.60
0.00
ZINGAMIGURUWE
8 3 0
Feb
-
0.85
0.00
-
0.10
1.80
17.60
0.40
1.68
15.50
-
0.00
0.00
0.00
-
7.70
0.00
0.00
0.00
0.00
KM2
Mar
-
7.90
-
0.55
13.80
2.20
17.30
0.25
NDA
1 .92
0.06
-
-
0.00
1.95
17.70
0.00
-
1.20
0.00
1 .L .5
Apr
-
1.00
-
-
8.40
0.00
2.15
11.30
0.30
NDA
1.84
0.05
0.00
0.00
0.00
0.27
9.10
0.00
0.23
3.90
0.00
May
0.00
0.00
0.00
0.00
0.00
0.00
0.40
2.60
-
NDA
NDA
NDA
0.00
0,00
0.00
0.00
0.00
0.00
0.00
0.00
0.00
Jun
0.00
0.00
0.00
0.00
0.00
0.00
-
0.10
0.00
NDA
NDA
NDA
0.00
0.00
0.00
0.00
0.00
0.00
0.00
0.00
0.00
J u l
0.00
0.00
0.00
0.00
0.00
0.00
0.00
0.00
0.00
NDA
NDA
NDA
0.00
0.00
0.00
0.00
0.00
0.00
0.00
0.00
0.00
Aug
0.00
0.00
0.00
0.00
0.00
0.00
0.00
0.00
0.00
0.00
0.00
0.00
0.00
0.00
0.00
0.00
0.00
0.00
0.00
0.00
0.00
Sept
0.00
0.00
0.00
0.00
0.00
0.00
0.00
0.00
0.00
0.00
0.00
0.00
0.00
0.00
0.00
0.00
0.00
0.00
0.00
0.00
0.00
Oct
0.00
0.00
0.00
0.00
0.00
0.00
0.00
0.00
0.00
0.00
0.00
0.00
0.00
0.00
0.00
0.00
0.00
0,00
0.00
0.00
0.00
Nov
0.00
0.00
0.00
NDA
NDA
0.00
0.00
0.00
0.00
-
0.27
0.00
0.00
0.00
0.00
-
1.32
0.00
0.00
0.00
0.00
Dec
0.06
11.50
0.00
1.08
26.50
0.00
-
0.50
0.00
-
7.10
0.00
0.56
5.00
0.00
-
2.25
0.00
0.00
0.00
0.00

APPENDIX
3(13)
DISCHARGE, M /S
RIVER:
STATION:
CATCHMENT AREA:
MBWEMKURU
MNYANGALA
15,220
1 .
KM
M2.4
Year/Flow Jan Feb Maf Apr May Jun J u l Aug Sept Oct Nov Dec
1977
maxmin
4.00 34.00
1978
' «ax
min
1 9 7 9
m i n
170.00
9.80
85.00
4.80
520.00
20.00
300.00
4.80
42.00
160.00
1980
198 1
"min
1982
Qm
1 9 8 3
Q™

DISCHARGE, M /S
APPENDIX
4(14)
RIVER:
STATION:
CATCHMENT AREA:
MBWEMKURU
MITONONO 1.M.5
1 1 , 7 0 0 KM2
Year/Flowm3/s
J a n Feb Mar Apr May Jun J u l Aug Sept Oct Nov Dec
1977
4.804
35
.10
.50
1
6
.30
.90_
22
79
6
.50
.00
.70
2
6
.60
.50
0
1
.65
.60
_
0.00
0.00
0.00
1.60
0.00
1978
NDA
109.00891
1
.00
,00
.30
21
350
1
.50
.00
.00
26
758
.50
.00
.30
2
6
1
.90
.90
.40
0
1
.60
.30_
3.50
52.00
1979
27 .00 NDA NDA
68.00 430.00 44.00
5.00 62.00 22.00
NDANDA
NDA
NDANDA
NDA
NDANDA
NDA
NDA
NDA
NDA
NDA
NDA
NDA
NDA
1.90
1980
Qm
20.00 NDA
200,00 350.00
0.70 70.00
NDA NDA
117.00 134.00
71.00 67.00
NDA
NDA
NDA
NDA
NDA
NDA
NDA
NDA
NDA
NDA
NDA
NDA
NDA
NDA
NDA
NDA
NDA
NDA
198 1
Qm
m i n
5.2029.60
.00
2
11
.50
.00
1
12
.60
.50
1
40.70
.00 1.40
0.00
0.00 0.70
0.00 24.50
0.00 0.00
1982
5.20
03
.55
.40_
11
60
.70
.00
9.
63._
20
00
313
1
.10
.00
.40
1.40
0.00
0.00
0.00
0.00
0.00
0.00
0.00
0.00 1.50
0.00 75.00
0.00 3.10
1983
10
39
2
.10
.00
.50
4
48
0
.70
.00
.80
46
185
8
.00
.00
.30
NDA
NDA
NDA
6
24
2
.70
.00
.40
1
3
1
.90
.70
.10
1.00
0.00
0.000.00 1.100.00 0.00
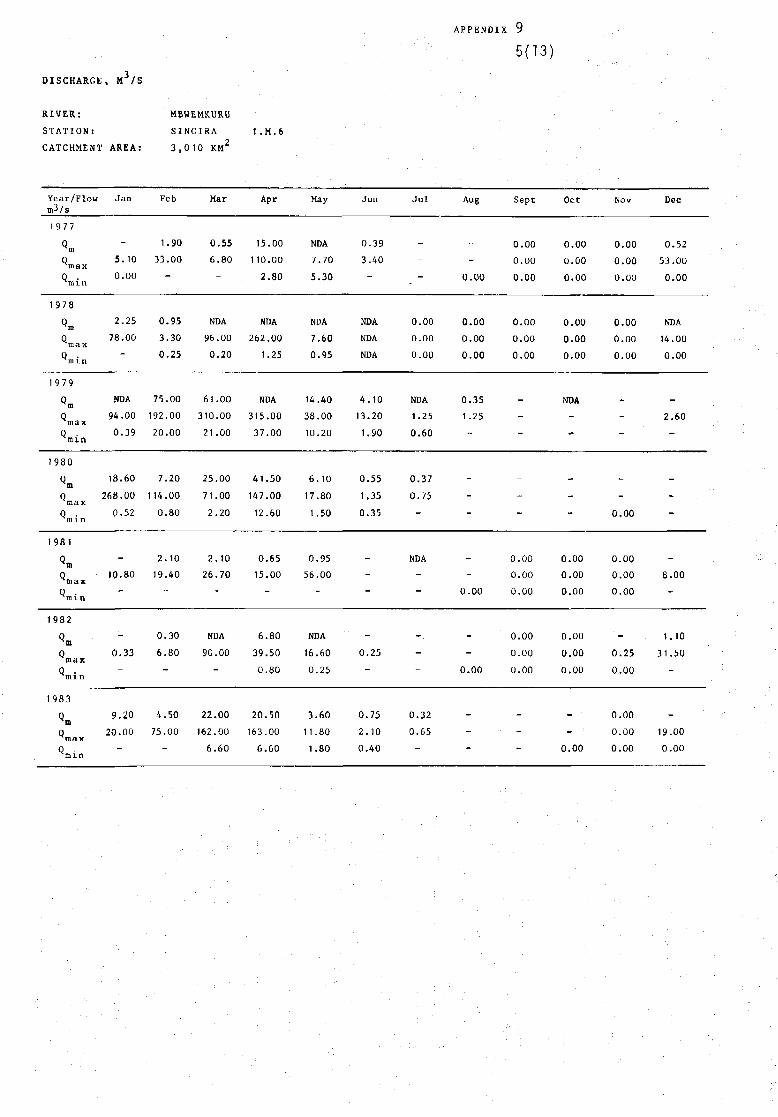
DISCHARGE, M /S
APPENDIX 9
5(13)
RIVER:STATION!
CATCHMENT AREA:
Year/Flowm3/s
1 9 7 7
max
m i n
1978
<*m
maxQmin
1979
Kmax
m i n
1980
max
m i n
1981
Qm
max
m i n
1982
Qm
ma x
m i n
1983
Qm
max
ni i n
J a n
-
5.10
0.00
2.25
78.00
NDA
94.00
0.39
18.60
268.00
0.52
-
10.80
-
-
0.33
-
9.20
20.00
-
MBWEMKURU
SINGIRA
3 , 0
Feb
1.90
33.00
~
0.95
3.30
0.25
75.00
192.00
20.00
7.20
114.00
0.80
2.10
19.40-
0.30
6.80
-
4.50
75.00
-
10 KM
Mar
0.55
6.80
-
NDA
96.00
0.20
61.00
310.00
21.00
25.00
71.00
2.20
2.10
26.70
-
NDA
90.00
-
22.00
162.00
6.60
1 .M.6
Apr
15.00
110.00
2.80
NDA
262.00
1.25
NDA
315.00
37.00
41.50
147.00
12.60
0.65
15.00
-
6.80
39.50
0.80
20.50
163.00
6.60
May
NDA
7.70
5.30
NDA
7.60
0.95
14.40
38.00
10.20
6.10
17.80
1.50
0.95
56.00
-
NDA
16.60
0.25
3.60
11.80
1.80
Jun
0.39
3.40
-
NDA
NDA
NDA
4.10
13.20
1.90
0.55
1.35
0.35
-
-
-
-
0.25
-
0.75
2, 10
0.40
J u l
-
-
-
0.00
0.00
0.00
NDA
1.25
0.60
0.37
0.75
-
NDA
-
-
-
-
-
0.32
0.65
-
Aug
-
-
0.00
0.00
0.00
0.00
0.35
1.25
-
-
-
-
-
-
0.00
-
-
0.00
-
-
-
Sept
0.00
0.00
0.00
0.00
0.00
0.00
-
-
-
-
-
-
0.00
0.00
0.00
0.00
0.00
0.00
-
-
-
Oct
0.00
0.00
0.00
0.00
0.00
0.00
NDA
-
-
-
-
-
0.00
0.00
0.00
0.00
0.00
0.00
-
-
0.00
Nov
0.00
0.00
0.00
0.00
0.00
0.00
-
-
-
-
-
0.00
0.00
0.00
0.00
-
0.25
0.00
0.00
0.00
0.00
Dec
0.52
53.00
0.00
NDA
14.00
0.00
-
2.60
-
-
-
-
-
8.00
1.10
31.50
-
-
19.00
0.00

APPENDIX 9
6(13)
DISCHARGE, M /S
RIVER:STATION:
CATCHMENT
Year/Flowra3/s
1977
max
m i n
1978
Qm
ma xQmin
1979
Qm
max
m i n
1980
«m
max
m i n
1981
%
max
"min
1982
Qm
max
m i n
1983
%
maxQmin
AREA:
J a n
0.52
+
0.30
+
+
0.30
NDA
NDA
NDA
NDA
+
0.37
NDA
NDA
NDA
+
+
0.31
0.45
0.31
MAVUJIMBILIWIA
2 ,930
Feb
+
+
0.30
0.43+
0.29
+
+
+
+
+
NDA+
+
0.32
0.47
0.27
0.320.37
0.31
Mar
+
+
0.35
+
+
0.28
+
+
0.38
+
+
0.49
NDA
NDA
NDA
0.50+
0.28
0.42
0.32
1 .M.8KM2
Apr
+
+
0.37
+
+
0.30
+
0.33
+
+
0.33
NDA
NDA
NDA
+
+
0.33
0.48
0.35
May
0.350.37
0.33
0.31
0.34
0.30
0.44+
0.33
NDA
+
0.33
NDA
NDA
NDA
0.42+
0.37
0.41
0.53
0.34
Jurt
0.33
0.33
0.32
0.32
0.32
0.30
0.38
0.40
0.32
NDA
NDA
NDA
NDA
NDA
NDA
0.32
0.37
0.29
0.33
0.34
0.33
•
J u l
0.32
0.33
0.32
0.31
0.31
0.30
0.33
0.35
0.33
NDA
NDA
NDA
NDA
NDA
NDA
0.27
0.29
0.26
0.33
0.33
0.32
Aug
0.32
0.33
0.31
0.31
0.31
0.31
0.33
0.33
0.33
NDA
NDA
NDA
NDA
0.26
0.26
0.30
0.30
0.30
0.33
0.33
0.32
Sept
0.31
0.31
0.31
0.31
0.31
0.31
0.33
0.33
0.33
NDA
NDA
NDA
0.25
0.26
0.25
0.30
0.30
0.30
0.330.33
0.33
Oct
0.31
0.31
0.30
0.31
0.31
0.30
0.330.33
0.33
NDA
NDA
NDA
0.24
0.24
0.23
0.30
0.30
0.30
0.34
0.52
0.33
Nov
0.37
+
0.30
0.37
+
0.30
0.330.330.33
NDA
NDA
NDA
0.240.24
0.24
0.30
0.30
0.30
0.330.330.33
Dec
+
+
0.32
+
+
0.34
NDA
0.42
0.33
NDA
NDA
NDA
+
+
0.24
+
+
0.30
0.47+
0.33
flow > 0.6 m / s
12
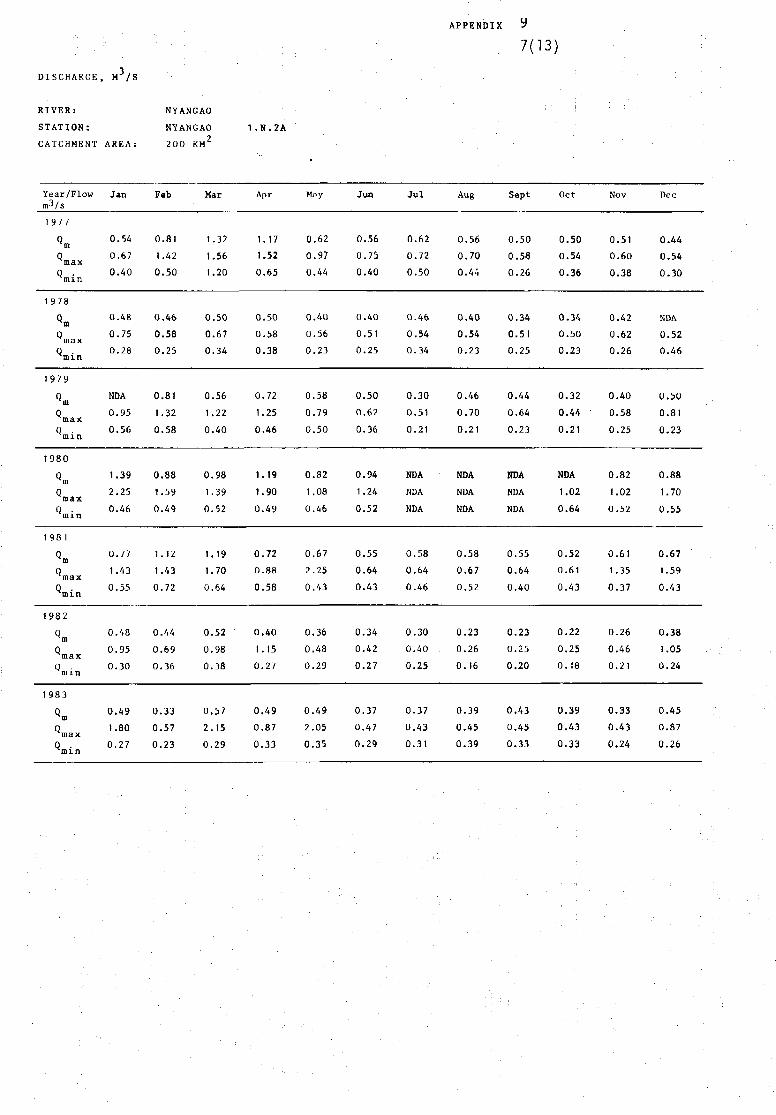
DISCHARGE, M /S
APPENDIX
7(13)
RIVER:STATION:
CATCHMENT
Year/Flowrn-^/s
1977
Qm
m i n
1978
Qm
m i n
1979
Qm
m i n
1980
Qm
m i n
1 98 1
Qm
m i n
1982
Qm
max
min
1983
Qm
max
min
AREA:
J a n
0.54
0.67
0.40
0.48
0.75
0.28
NDA
0.95
0.56
1.392.25
0.46
0.77
1.430.55
0.48
0.950.30
0.491.800.27
NYANCAO
NYANGAO
2 0 0
Feb
0 .81
1.42
0.50
0.460.580.25
0.811.32
0.58
0.88
1.590.49
1.12
1.430.72
0.44
0.690.36
0.330.570.23
KM2
Mar
1.32
1.561.20
0.500.670.34
0.561.22
0.40
0.98
1.390.52
1.191.70
0.64
0.52
0.980.38
0.57
2,150.29
1 . N . 2 A
Apr
1.17
1.52
0.65
0.50
0.580.38
0.72
1.250.46
1.191.900.49
0.72
0.880.58
0.401.150.27
0.490.870.33
•
May
0.620.970.44
0.400.560.23
0.58
0.790.50
0.82
1.080.46
0.672.250.43
0.360.48
0.29
0.492,050.35
Jun
0.560.750.40
0.40
0.510.25
0.50
0,620.36
0.94
1.240.52
0.550.64
0.43
0.340.420.27
0.370.470.29
J u l
0.620.720.50
0.460.540.34
0.30
0.510.21
NDA
NDA
NDA
0.580.64
0.46
0.300.40
0.25
0.370.430.31
Aug
0.560.700.44
0.400.540.23
0.460.700.21
NDA
NDA
NDA
0.580.670.52
0.230.260.16
0.390.450.39
Sept
0.500.580.26
0.340.510.25
0.440.64
0.23
NDA
NDA
NDA
0.550.64
0.40
0.230.250.20
0.430.450.33
Oct
0.500.54
0.36
0.340.50
0.23
0.32
0.44 •0.21
NDA
1.02
0.64
0.520.61
0.43
0.22
0.250.18
0.390.43
0.33
Nov
0.510.60
0.38
0.420.620.26
0.40
0.58
0.25
0.82
1.020.52
0.611.350.37
0.260.460.21
0.33
0.430.24
Dec
0.440.540.30
NDA
0.520.46
0.500.81
0.23
0.88
1.70
0.55
0.671.59
0.43
0.381.050.24
0.450.87
0.26
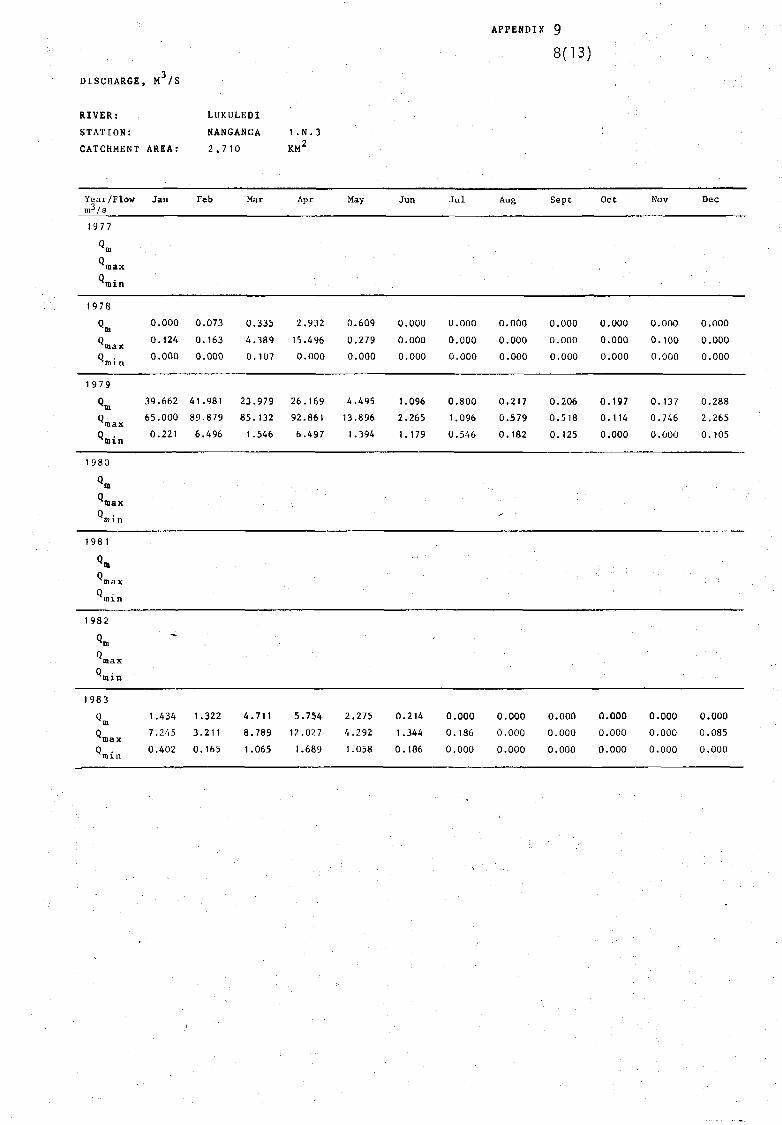
DISCHARGE, M /S
APPENDIX 9
8(13)
RIVER:
STATION:
CATCHMENT AREA:
LUKULEDI
NANGANGA 1 . N . 3, 2
2 , 7 1 0 KM
Year/Flow Jan Feb Mar Apr May Jun J u l Aug Sept Oct Nov Dec
1 9 7 7
1 9 7 8
0.000 0.073
0.124 0.163
0.000 0.000
0.335
4.389
0.107
2.932
15.496
0.000
0.609 0.000
0.279 0.000
0.000 0.000
0.000 0.000 0.000 0.000
0.000 0.000 0.000 0.000
0.000 0.000 0.000 0.000
0.000 0.000
0.100 0.000
0.000 0.000
1979
max
««in
39.662 41.981
65.000 89.879
0.221 6.496
23.979
85.132
1.546
26.169
92.861
6.497
4.495 1.096
13.896 2.265
1.394 1.179
0.800 0.217 0.206 0.197 0.137 0.288
1.096 0.579 0.518 0.114 0.746 2,265
0.546 0.182 0.125 0.000 0.000 0.105
1 9 8 0
Qm
min
1981
Q .
min
1 9 8 2
1983
1
7
0
.434
.245
.402
1
3
0
.322
.21 1
.165
4
8
1
.711
.789
.065
5
12
1
.754
.027
.689
2
41
.275
.292
.058
0
1
0
.214
.344
.186
0.000 0.000 0.000 0.000 0.000 0.000
0.186 0.000 0.000 0.000 0.000 0.085
0.000 0.000 0.000 0.000 0.000 0.000
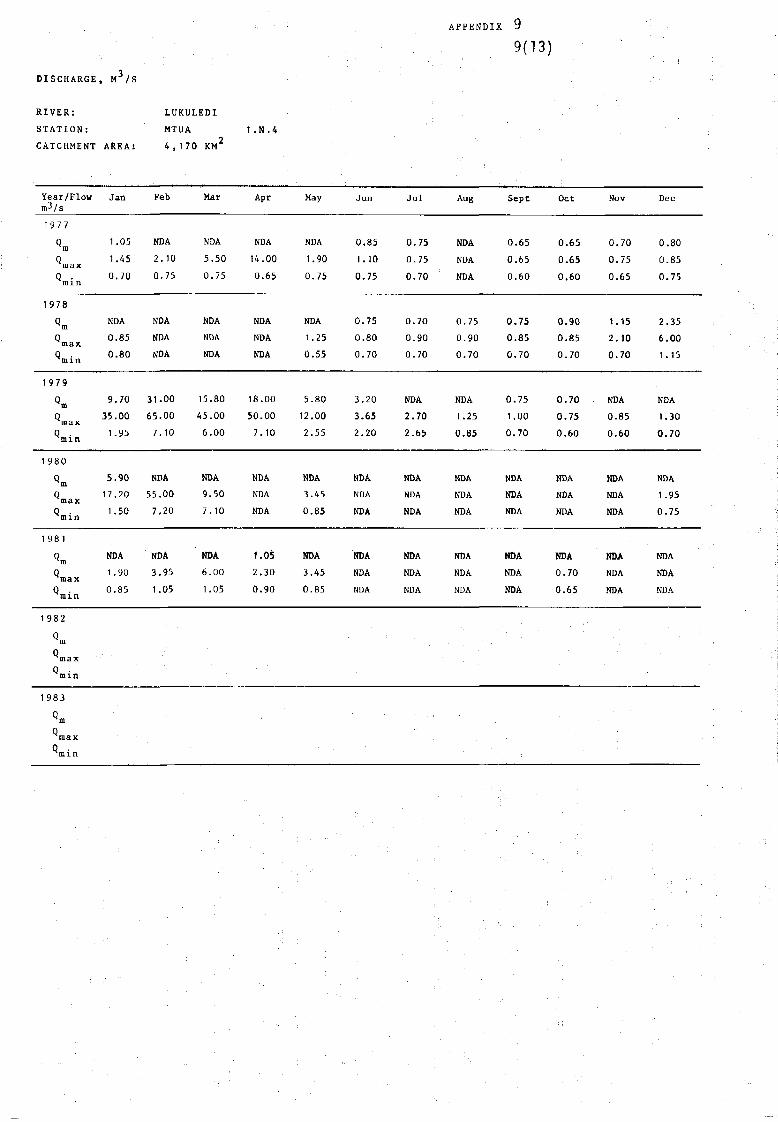
DISCHARGE, M /S
APPENDIX
9(13)
RIVER:STATION:
CATCHMENT
Year/Plowm3/s
1977
Qm
rain
1 978
Qm
min
1979
Qm
mi n
1 980
Qm
max
m i n
1 98 1
^m
m i n
1 982
«m
max
min
1983
«m
max
min
AREA:
J a n
1.05
1.45
0.70
NDA
0.85
0.80
9.70
35.00
1.95
5.90
17.20
1.50
NDA
1 .90
0.85
LUKULEDIMTUA
4 , 17C
Feb
NDA
2 . 1 0
0 .75
NDA
NDA
NDA
31 .00
65.00
7.10
NPA
55.007.20
NDA
3.95
1.05
) KM 2
Mar
NDA
5.50
0.75
NDA
NDA
NDA
15.8045.00
6.00
NDA
9.507. 10
NDA
6.00
1.05
1 .N .4
Apr
NDA
14.00
0.65
NDA
NDA
NDA
18.00
50.00
7.10
NDA
NDA
NDA
1.05
2.30
0.90
May
NDA
1.90
0.75
NDA
1.250.55
5.8012.002.55
NDA
3.45
0.85
NDA
3.45
0.85
Jun
0.85
1.10
0.75
0.750.800.70
3.203.652.20
NDA
NDA
NDA
NDA
NDA
NDA
J u l
0.75
0.750.70
0.70
0.90
0.70
NDA
2.70
2.65
NDA
NDA
NDA
NDA
NDA
NDA
Aug
NDA
NDA
NDA
0.75
0.90
0.70
NDA
1.25
0.85
NDA
NDA
NDA
NDA
NDA
NDA
Sept
0.650.65
0.60
0.750.850.70
0.751.000.70
NDA
NDA
NDA
NDA
NDA
NDA
Oct
0.650.650.60
0.90
0.850.70
0.700.75
0.60
NDA
NDA
NDA
NDA
0.70
0.65
Nov
0.70
0.75
0.65
1.152.100.70
NDA
0.850.60
NDA
NDA
NDA
NDA
NDA
NDA
Dec
0.80
0.85
0.75
2.356.001.15
NDA
1.300.70
NDA
1.95
0.75
NDA
NDA
NDA
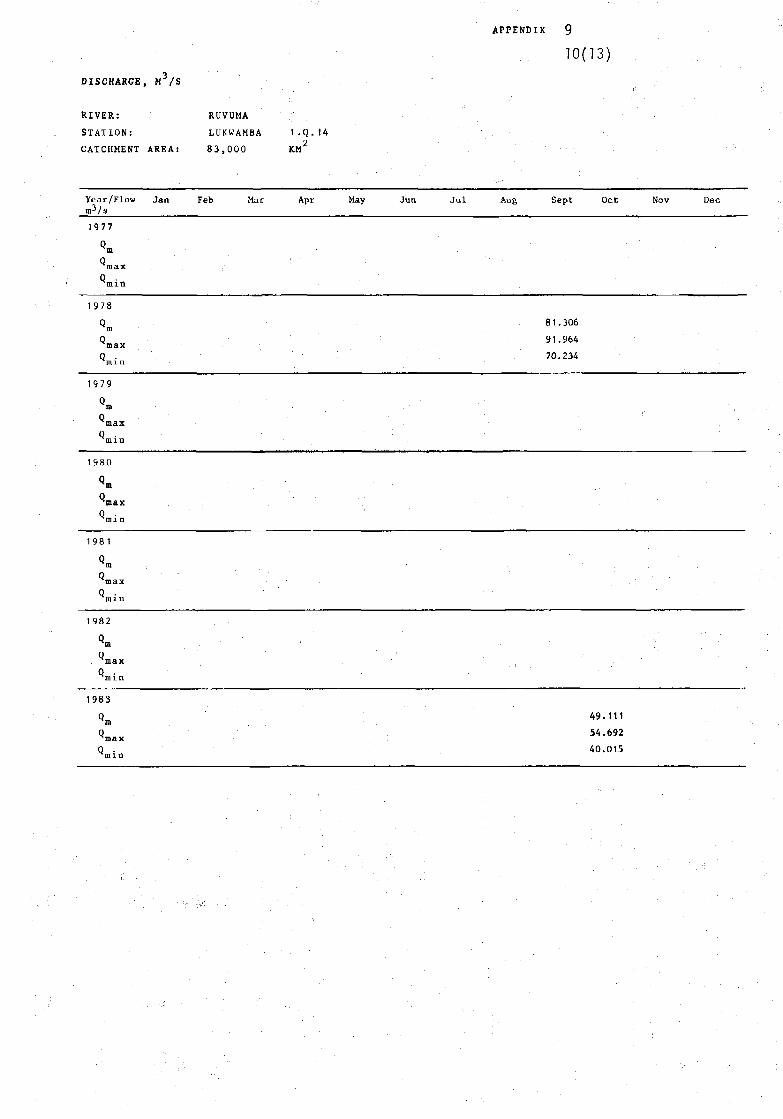
APPENDIX 9
10(13)
DISCHARGE, M3/S
RIVER: RUVUMA
STATION: LUKWAMBA 1.Q.14
CATCHMENT AREA: 83,000 KM2
Year/Flow Jan Feb Mar Apr May Jun Jul Aug Sept Oct Nov
m3/s
1977
Q -max
min
1 9 7 8
Q m 81.306
q . 70.234rain
1 9 7 9
Q * • ' ' ' : ; : . - , • • ; . - . . : ; • • • . ;
max
"min
1980
Q "max
"min
1981
Qm .,
max
min
1982
Q - •. : • ' . • ' ' . . • • . r
"max
min
1983
Q 49.111ID :
Q 54.692ymaxQ . 40.015
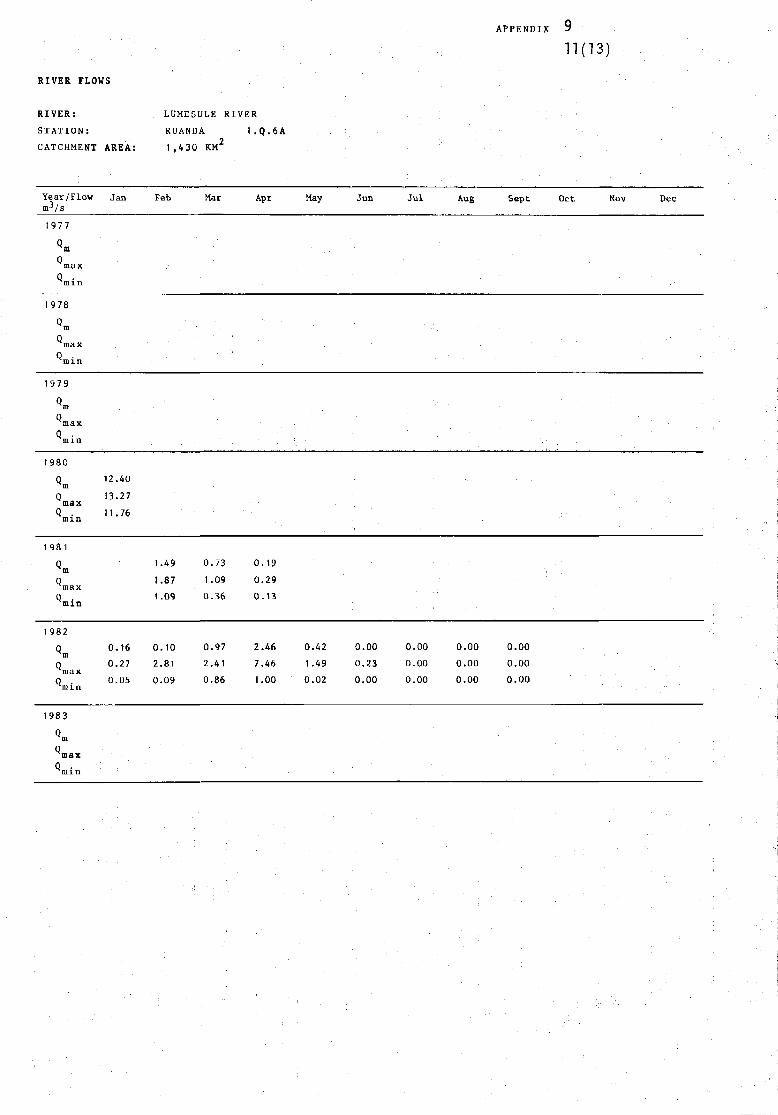
APPENDIX "
11(13)
RIVER FLOWS
RIVER: LUMESULE RIVER
STATION: RUANDA 1.Q.6A
CATCHMENT AREA: 1 ,430 KM2
Year/Flow Jan Feb Mar Apr May Jun J u l Aug Sept Oct Nov Dec
1977
Q " > ' ' ' • ' . ' . . • - : - ' •
max :
min
1978
Q - • • • . ' ' • . : • . ' • • ' • . • . • ' • • • ' • : • • • • •
max
min
1979
Q - ' • • • • : ' • . . • • • ' , ' ' • • ' ' ' ' ' ' '
max
min
1980
Q 12.40m
Q 13.27max
Q . 11.76min
1 98 1
Q 1.49 0.73 0.19m i
0 1.87 1.09 0.29maxQ . 1.09 0.36 0.13
1 9 8 2
Q 0.16 0.10 0.97
Q"1 0.27 2.81 2.41max
q . 0.05 0.09 0.86
1983
«mQ.
2
7
1
.46
.46
.00
0
1
0
.42
.49
.02
0
0
0
.00
.23
.00
0
0
0
.00
.00
.00
0
0
0
.00
.00
.00
0
0
0
.00
.00
.00
maxmin

APPENDIX
12(13)
DISCHARGE, M /S
RIVER:
STATION:
CATCHMENT
Year/Flowti.3/3
1977
Qm
m i n
1978
Qm
m i n
1979
Qm
m i n
AREA:
J a n
0.051
1.830
0.039
0.078
2.080
0.047
0
3
0
0
25
0
MIESIMIKELE
8 0 0
Feb
.291
.850
.052
.898
.80
.06
Mar
2.140
7.400
0.171
0.419
17.70
0.13
NDA
NDA
NDA
1 . Q . 9
KM2
Apr
5.198
27.40
0.82
2.798
15.20
1.96
NDA
NDA
NDA
May
0.898
1.430
0.301
0.113
0.415
0.000
NDA
NDA
NDA
Jun
0.150
0.300
0.101
0.091
0.091
0.091
NDA
NDA
NDA
J u l
0.101
0.101
0.101
0.091
0.091
0.090
NDA
NDA
NDA
Aug
0.054
0.101
0.052
0.000
0.091
0.090
NDA
NDA
NDA
Sept
0.046
0.052
0.039
0.000
0.000
0.000
NDA
NDA
NDA
Oct
0.038
0.039
0.025
0.000
0.000
0.000
NDA
NDA
NDA
0
0
0
0
0
0
0
0
0
Nov
.025
.025
.025
.000
.000
.000
.000
.000
.000
0
0
0
0
4
0
0
0
0
Dec
.035
.101
.025
.192
.538
.000
.000
.000
.000
1 980
min
1981
Qm
m i n
1982
m i n
1983
•»»
min
0.281
0.776
0.249
0.162
0.324
0.082
0.069
0.443
0.01
0.162
0.324
0.082
0.085
0.101
0.01
0.578
2.108
0.105
0.042
0.058
0.000
4.517
7.812
3.490
0
0
0
.028
.035
.021
0.035
0.035
0.027
0
0
0
.035
.035
.035
0.035
0.035
0.035
0.000
0.035
0.000
0
0
0
.000
.000
.000
0.000
0.000
0.000
0.000
0.790
0.000
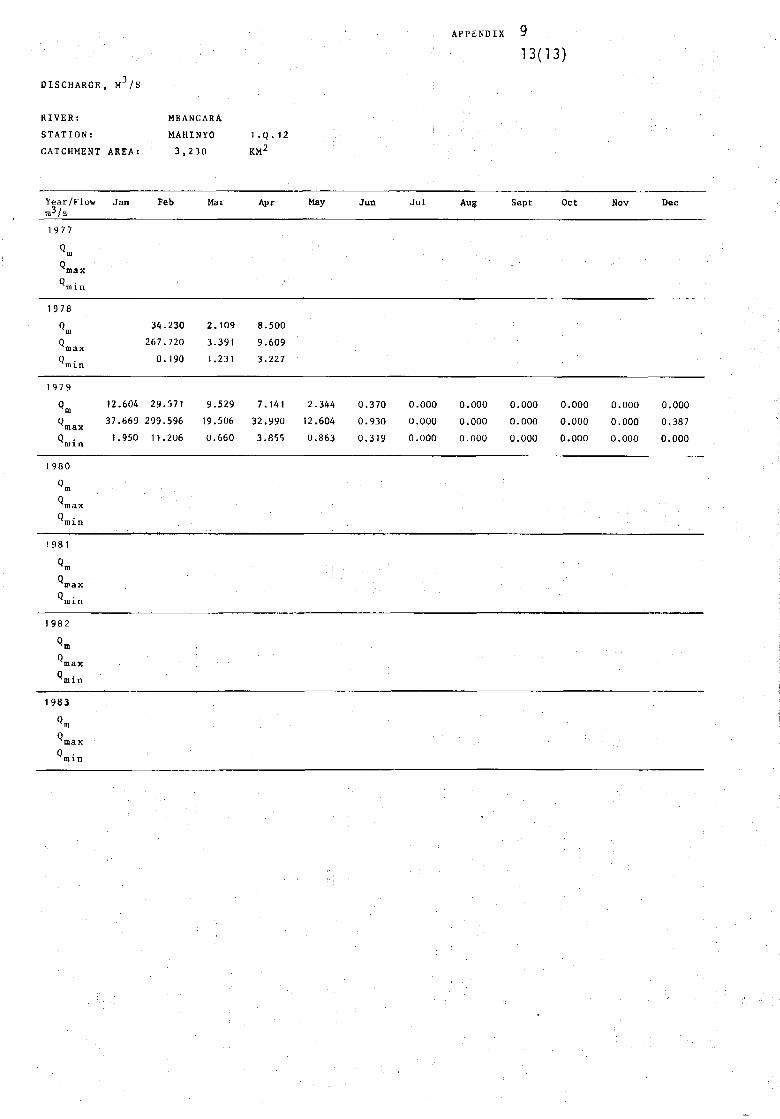
APPENDIX y
13(13)
DISCHARGE, M 3 /S
RIVER: MBANGARA
STATION: MAHINYO 1 .Q.12
CATCHMENT AREA: 3 , 2 3 0 KM2
Year/Flow Jan Peb Mar Apr May Jun J u l Aug Sept Oct Nov Dec
1 9 7 7
max
min
1978
Qm
max
m i n
1979
Qm
max
m i n
12
37
1
.604
.669
.950
34.230
267.720
0.190
29.571
299.596
11.206
2.109
3.391
1.231
9.529
19.506
0.660
8.500
9.609
3.227
7.141
32.990
3.855
2
12
0
.344
.604
.863
0
0
0
.370
.930
.319
0
0
0
.000
.000
.000
0
0
0
.000
.000
.000
0
0
0
.000
.000
.000
0
0
0
.000
.000
.000
0
0
0
.000
.000
.000
0
0
0
.000
.387
.000
1980
max
min
1981
wax
min
1982
max
min
1983
max
min
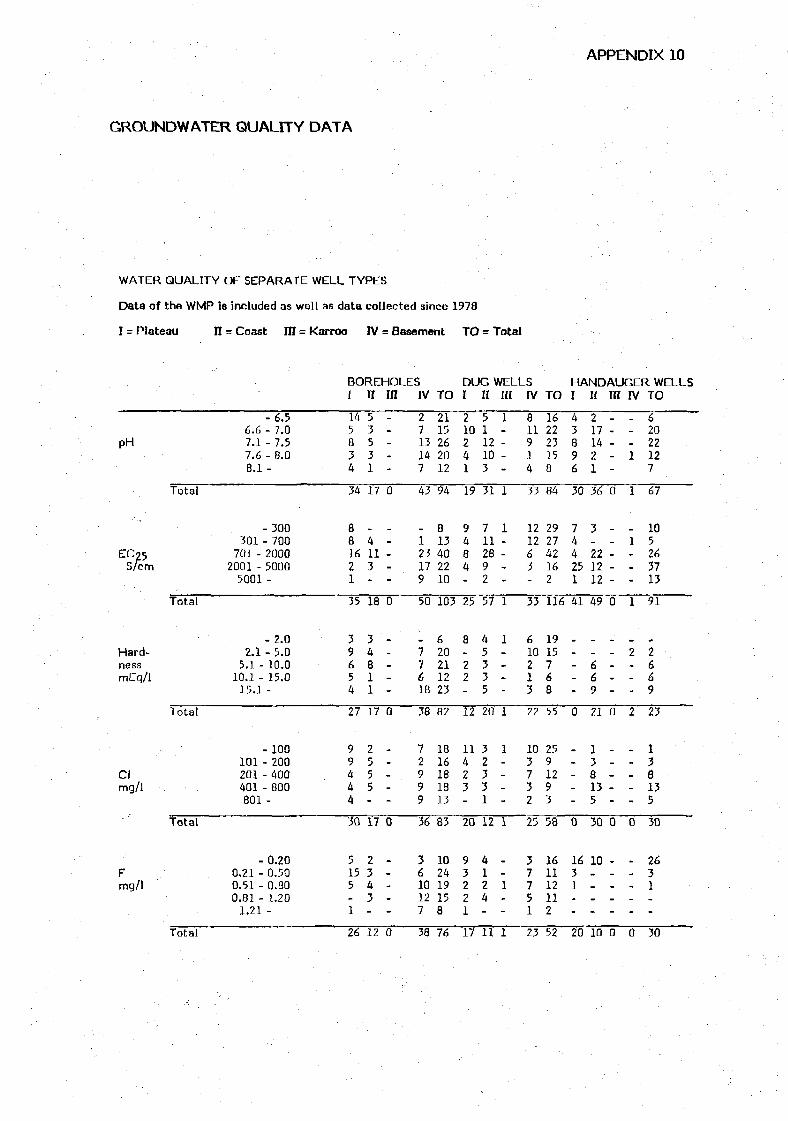
APPENDIX 10
GROUNDWATER QUALITY DATA
WATER QUALITY OF SEPARATE WELL TYPES
Data of the WMP is included as well as data collected since 1978
I = Plateau n = Coast III = Karroo IV = Basement TO = Total
BOREHOLES DUG WELLS HANDAUCER WELLSI II III IV TO I II III IV TO I n III IV TO
PH
EC95S/cm
Hard-nessmEq/1
CImg/1
Fmg/1
Total
Total
Total
Total
Total
-6.56.6 - 7.07.1 - 7.57.6 - 8.08.1 -
-300301 - 700
701 - 20002001 - 50005001 -
- ? 02.1 - 5.D5.1 - 10.0
10.1 - 15.015.1 -
- 100101 - 200201 - 400401 - 800801 -
- 0.200.21 - 0.500.51 - 0.000,81 - 1.201.21 -
145834
34
a81621
35
•5
9654
27
99444
30
5155
1
26
53531
17
4113-
ia
XJ
4811
17
2555-
17
2343
12
-
-
0
-
-
0
--
0
--
0
--
-
0
2713147
43
123179
50
77618
38
72999
36
3610127
38
2115262012
94
813402210
103
&D
20211223
82
1816181813
83
102419158
76
210241
19
9484-
25
a0
22-
12
11423-
20
93221
17
5112103
31
7112892
57
A
5335
20
32331
12
4124
11
1
_--
1
1
-
-
1
1X
_
-
-
1
1--_-
1
-1
-
1
811914
33
121263-
33
D
10213
22
103732
25
37751
23
162223158
84
292742162
116
1915768
55
2591293
58
161112112
52
43896
30
744251
41
--
0
-
_-
0
la31
20
2171421
36
3_221212
49
_669
21
138135
30
10
_
10
_
_--
0
-
--
0
_
-
0
--
-
0
_
0
__
1
1
1-
-
1
2
_-
2
-_
-
0
_
0
62022127
Ê7
105263713
91
2669
23
138135
30
2631
30
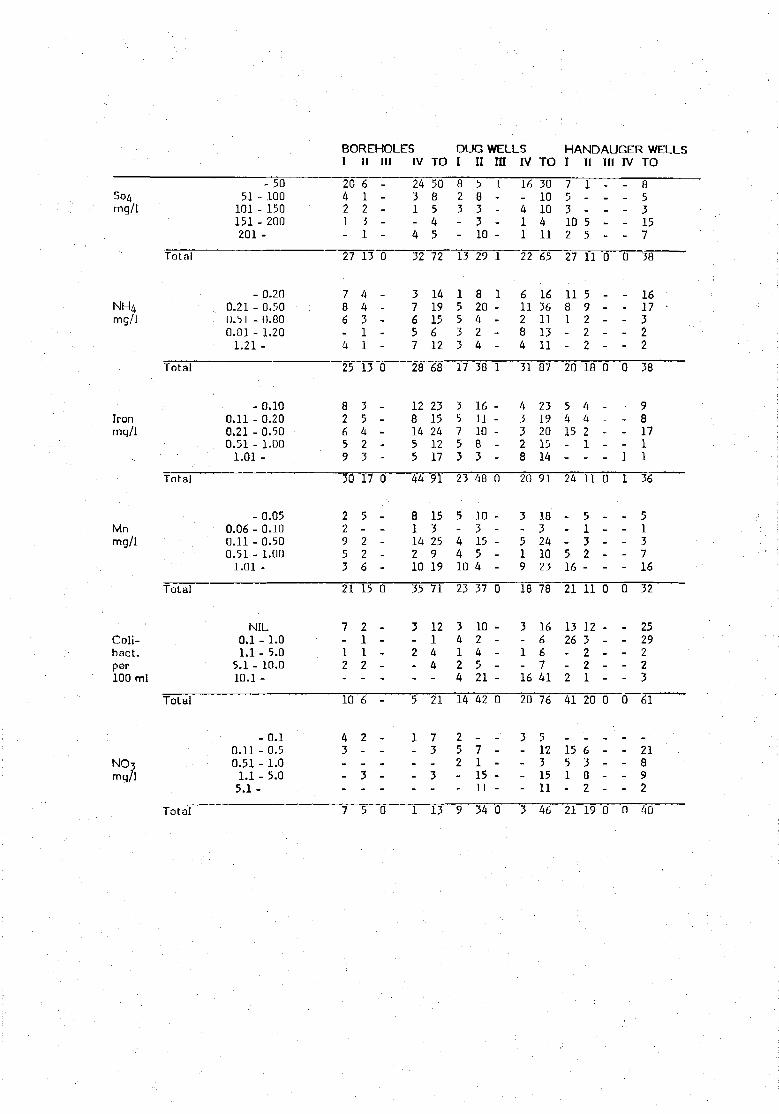
BOREHOLES DUG WELLS HANDAUGER WELLSi n in iv TO i ii in iv TO I II m iv TO
S04mg/1
NH4mg/1
Ironmg/1
Mnmg/1
Coli-bact.per100 ml
NO3mg/1
Total
Total
Total
Total
Total
Tnfal
- 5051 - 100
101 - 150151 - 200201 -
- 0.200.21 - 0.500.51 - 0.Q00.81 - 1.201.21 -
- 0.100.11 - 0.200.21 - 0.500.51 - 1.001.01 -
-0.050.06 - 0.100.11 -0.500.51 - 1.001.01 -
NIL0.1 - 1.01.1 - 5.0
5.1 - 10.010.1 -
(1 1
0.11 - 0.50.51 - 1.01.1 - 5.05.1 -
20421-
27
786
4
25
82659
30
22953
21
7-12-
10
A
3---
7
61231
13
44311
13
35423
17
5_226
15
2112-
6
2
-3-
5
_
--
0
--
-
0
----
0
_-_-
0
-.--
-
_
--
0
2431-4
32
37657
28
1281455
44
8114210
35
3-2--
5
1J-
-
-
1
508545
72
141915612
68
2315241217
91
15325919
71
12144-
21
7f
3-3-
13
a23--
13
15533
17
35753
23
5-4410
23
34124
14
52--
y
583310
29
820424
38
16111083
48
1031554
37
1024521
42
711511
34
1
-
-
1
1-
-
1
--_-
0
___-
0
----
_---
u
16_411
22
611284
31
43328
20
3.519
18
3-1-16
20
"5j
-
-
-
3
301010411
65
1636111311
87
2319201514
91
183241023
78
1666741
76
1231511
46
753102
27
1181--
20
5415_-
24
516
21
1326--2
41
1551-
21
1_-55
11
59222
18
4421-
11
5132-
11
123221
20
6382
19
_--
0
--_-
0
---
0
_
-
0
_
--
0
_---
0
__---
0
----
0
--1
1
----
0
----
0
---
0
853157
38
1617 •322
38
981711
36
513716
32
2529223
61
21892
40
APPENDIX 11
BOREHOLE DATA
Abbreviations:
TH = TEST HOLE G.W.L. = GROUNDWATER LEVEL

BOREHOLES DRILLED BY CYCLON OR SCHRAMM SINCE 1978
LocationBH Depthno. m
STW Q pH Fe E.C. 25m m'/h mq/l 5/cm
Hardness Chloride Sulphate Fluoride GeoloqicalQdH mg/1 mg/1 fng/1 formation
Remarks
1 Naliendeie
Mbawala Chini Mt 65/81 96
2 Mbawala Chini Mt 212/81 B9
3 Mtwara Mlawanya Mt 42/80 54
4 Mtwara Mtawanya Mt 51/81 52
5 Mtwara Mtawanya Mt 63/81 52
6 Mnazimoja LD 34/80 65
7 Mnazimoja LD 35/90 65
8 Mnazimoja LD 23/B3 60
9 Ki lwa Masoko LD 108/BQ 52
10 Ki lwa Masoko
11 Ki lwa Masoko
12 Ki lwa Masoko
13 Ki lwa Masoko
14 Ki lwa Mpara
15 Kilwa Mpara
16 Kilwa Mpara
17 Rwelu
18 Mtiniko
LD 110/80 30
LD 111/80 39
LD 12Î/80 42
LD 124/80 42
LD 69/83 50
LD 70/83 20
LD 78/83 31
Mt 36/81 36
Mt 88/83 120
53.7 36
51.3 42
24
6.1 168
7.1
2.7
6.9 168 6.7 0.2
33 7.5 0.3
Artesian 33 7.7 0.7
Artesian 31.8
6.5 12 6.5 1.0
15
24 6.Ô 0.4
7.7 24 5.4 0.45
1.4 42 6.5 0.08
IB
9
2.7 16.5
11.3 6 7.5
500
X 4/U
2 000
900
950
20
17.36
22.4
29.6
260
135
170
150
12
14
2 300
275
22.4
8.4
675
25
100
350
525
320
2.8
3.92
2.8
75
150
40
23
17
39
0.9
0.3
56 7.2
Plateau
Plateau
Coast
Coast
Coast
Plateau
Plateau
Plateau
Coast
Coast
Coast
Coast
Coast
Coast
Coast
Coast
Plateau
Plateau
Production
Production
Production
Production
Production
Production
Production
Production
Handpump
Hand pump
Production
Production
Production
Production
Production
Production
Handpump
TH
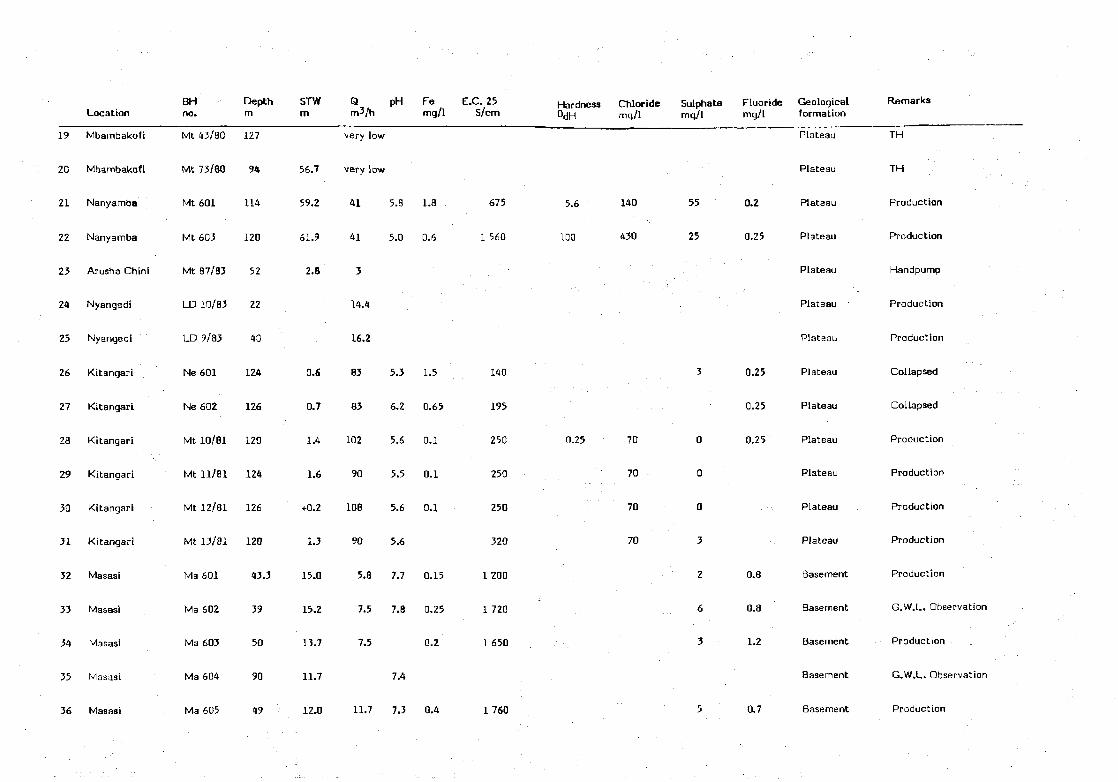
19
20
21
22
23
24
25
26
27
28
29
30
31
32
33
34
35
36
Location
Mbambakofi
Mbambakofi
Nanyamba
Nanyamba
Arusha Chini
Nyangedi
Nyangedi
Kitangari
Kitangari
Kitangari
Kitangari
Kitangari
Kitangari
Masasi
Masasi
Masasi
Masasi
Masasi
BHno.
Mt 43/80
Mt 73/80
Mt601
Mt 603
Mt 87/83
LD 10/83
LD 9/83
Ne 601
Ne 602
Mt 10/81
Mt 11/81
Mt 12/81
Mt 13/81
Ma 601
Ma 602
Ma 603
Ma 604
Ma 605
Depthm
127
94
114
120
52
22
40
124
126
120
124
126
120
43.3
39
50
90
49
STW Q pH Fe E.C. 25m m'/h mg/1 S/cm
Hardness Chloride Sulphate Fluoride Geologicalmg/1 mg/1 mg/l formation
Remarks
very low
56.7 very low
59.2 41 5.8 1.8
61.9 41 5.0 0.6
2.8 3
14.4
16.2
0.6 83 5.3 1.5
0.7 83 6.2 0.65
1.4 102 5.6 0.1
1.6 90 5.5 0.1
+0.2 108 5.6 0.1
1.3 90 5.6
Plateau
15.2 7.5 7.8 0.25
13.7 7.5
11.7
0.2
7.4
675
1 560
12.0 11.7 7.3 0.4
140
195
250
250
250
320
1 200
1 720
1 É50
1 760
TH
5.6 140
100 430
0.25 70
70
70
70
55
25
3
0
0
0
3
2
6
3
5
0.2
0.25
0.25
0.25
0.25
0.8
0.8
1.2
0.7
Plateau
Plateau
Plateau
Plateau
Plateau
Plateau
Plateau
Plateau
Plateau
Plateau
Plateau
Plateau
Basement
Basement
Basement
Basement
Basement
TH
Production
Production
Handpump
Production
Production
Collapsed
Collapsed
Production
Production
Production
Production
Production
G.W.L. Observation
Production
G.W.L. Observation
Production
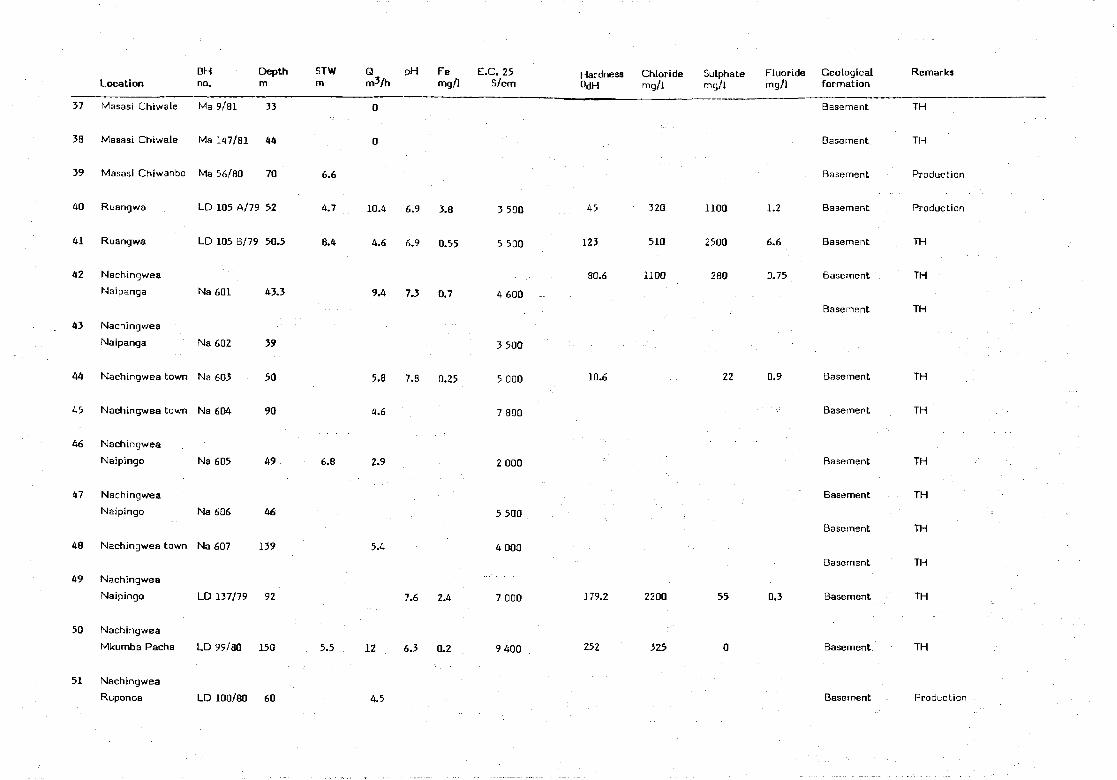
LocationBHno.
Depth STWm m
Q pH Fe E.C. 25mg/1 S/cm
Hardness Chloride Sulphate Fluoride GeologicalOdH mg/1 mg/1 mg/1 formation
Remarks
37 Masasi Chiwale Ma 9/81 33
38 Masasi Chiwale Ma 147/81 44
39 Masasi Chiwanbo Ma 56/30 70
48 Nachingwea town Na 607 139
49 Nachingwea
Naipingo LD 137/79 92
50 Nachingwea
Mkumba Pacha LD 99/80 150
51 Nachingwea
Ruponda
6.6
40
41
42
43
44
45
46
47
Ruangwa
Ruangwa
Nachingwea
Naipanga
Nachingwea
Naipanga
Nachingwea town
Nachingwea town
Nachingwea
Naipingo
Nachingwea
Naipingo
LD
LD
Na
Na
Na
Na
Na
Na
105 A/79
105 B/79
601
602
603
604
605
606
52
50.5
43.3
39
50
90
49
46
4.7
8.4
6.8
5.5
10.4 6.9 3.8 3 500
4.6 6.9 0.55 5 500
9.4 7.3 0.7 4 600
5.8
4.6
7.8 0.25
3 500
5 000
7 800
6.8 2.9
5.4
LD 100/80 60
7.6 2.4
12 6.3 0.2
4.5
2 000
5 500
4 000
7 000
9 400
45
123
80.6
320
510
1100
1100
2500
280
10.6
179.2 2200
252 325
55
1.2
6.6
22 0.9
0.3
Basement
Basement
Basement
Basement
Basement
Basement
TH
TH
Basement
Basement
Basement
Basement
Basement
Production
Production
TH
TH
TH
TH
TH
Basement
Basement
Basement
Basement
Basement
TH
TH
TH
TH
TH
TH
Production

BH Depth STW Q pH Fe E.C. 25Location no. m m m^/h mg/1 S/cm
Hardness Chloride Sulphate Fluoride GeologicalndH mg/1 mgA mg/1 formation
Remarks
52 Nachingwea
Mkumba Shamba LD 136/79 77.5
53 Nacingwea
Mkumba Shamba LD 136 B/79 92
54 Nachingwea
Mkumba Shamba LD 50/81 90
55 Nachingwea
Mkumba Shamba LD 52/81 70
59 Nachingwea
Mkumba Shamba LD 136 A/79 96
60 Mbawala Chini Mt 182/81 93
61 Mbawala Chini Mt 193/81 90
62 Nachingwea Mnero LD 109/80 38
63 Nachingwea Mnero LD 129/80 60
M Kilwa Mpara LD 77/83 30
65 KiLwa Mpara LD 71/83 45
15
14.5
1.3
17.5
30
10
10
56
57
58
Kitangari
Kitangari
Nanyamba
Mt 25/83
Mt 24/83
Mt 602
115
85
114
0.0
61.6
114
90
20
12
6.3 0.55
6.6 0.75
6.6
12.0 15 7.8 0.2
1 960
1 720
2 500
800
310
36.96 250
67.2
23.2
55
34 0.0
Basement
Basement
Basement
Production
Production
Production
Basement
Plateau
Plateau
Plateau
Production
Production
Production
TH
Basement
Plateau
Plateau
Basement
Basement
Coast
Coast
TH
TH
TH
TH
T H
TH
TH

LocationBHno.
Depth STWm m
Q pH Fe E.C. 25m^/h mg/J S/cm
Hardness Chloride Sulphate Fluoride Geological"&-\ mg/1 mg/l mg/1 formation
Remarks
66 Kilwa Masoka 103/79 43
67 Kilwa Masoko 80/79 37
6B Lindi Pangaboi 81/80 85
69 Kilwa Ruhatwe 165/78 106
70 Lindi Mipingo 68/82 95
71 Lindi Namkongo 77/79 100
72 Lindi Mtama 103/80 61
73 Lindi Mtama 5/80 50
74 Nachingwea
Kitandi 80/77 61
75 Nachingwea Mkoka71/78 57
76 Nachingwea
Mkumba Shamba 132/78 134
77 Nachingwea
Mkumba Shamba 112/78 113
3.55 10.2 7.8 0.3 550
5.9 3.6 7.5 D.48 1 090
53.95 6.8 B.8
15.15 40.9 7.9
f0.82
16.77 11.3 7.0 0.9
0.3 10.9 7.4 1.0
0.82 18.2 7.4 0.1
9.14 7.3 7.7 1.9 2 650
32.0 9.1 8.1 0.1 810
22.6 16.5 a.4 0.3 720
42.46 4.6 8.3 0.2 650
(,.9
9.0
78 Nachingwea
Mkumba Pacha 101/77 152.4 10.2 29.2 8.2 0.2 1540
48.6
11.1
13.1
10.1
25.4
102
265
1 100
1 250
1 550
4 200
240
250
6.4
7.0
97.1
4.0
184
252
950
28
51
712
47.5
79
84
304
20
130
10
0.12
0.0
0.3
0.76
1.1
0.2
0.3
0.4
0.25
Coast
Coast
Coast
Plateau
Plateau
Plateau
Plateau
Plateau
Basement
Basement
Basement
Basement
Basement

APPENDIX 12
BASEMENT STUDY
CONTENTS Page
SUMMARY
1. BACKGROUND 1
2. GENERAL HYDROGEOLOGY . 1
3. GROUNDWATER QUALITY 2
4. FLUCTUATION OF GROUNDWATER LEVEL 3
5. POTENTIAL ABSTRACTIONS 4
5.1 General 4
5.2 Dug Wells 4
5.3 Handauger Wells 5
5.4 DTH-rig Boreholes 5
5.5 Production Boreholes for Piped Schemes 7
6. GROUNDWATER RESOURCES OF NACHINGWEA URBAN AREA 8
6.1 Present Water Supply 8
6.2 Mkumba Shamba Wellfield 10
6.2.1 Detailed Description of Testpumpings 10
6.2.2 Maji Wells 13
6.2.3 Cata Wells 13
6.2.4 Conclusions 13
7. GROUNDWATER RESOURCES OF MASASI URBAN AREA 22
7.1 General 22
7.2 Testpumping of Magumchila Wellfield 23
8. RECOMMENDATION FOR DEVELOPMENT OF GROUNDWATER
RESOURCES IN NACHINGWEA AND MASASI 24
SUMMARY
The Basement area, which covers mainly Masasi and Nachingwea Districts has
proved to be rather diff icult from the water supply point of view.
Shallow groundwater occurs mainly as perched water. This means that well siting
is diff icult and risks for unsufficient or seasonal wells are big. Deepening of the
dug wells seldom improves the situation. Water quality in dug wells is normally
acceptable.
Deep groundwater occurs in the coarse weatherd layers above the solid baserock
and especially in fault zones. Water quality, especially salinity causes problems.
Most saline water has been found in higher yielding boreholes drilled in deep fault
zones in valleys.
To explore further the occurance of deep groundwater, a down-the-hole (DTH)
hammer drill was recently purchased. The aim has also been to drill boreholes for
handpump wells in the areas, where dug wells are not feasible. The rig has proved
to be suitable for the task. Drilling has been carried out on the higher elevations
of terrain and the water quality has been better there than in the boreholes drilled
in the valleys and fault zones. Yields of the boreholes have been generally small
and only about in 38 % of the cases more than 5 1/min. However, by improving
the borehole siting DTH-hammer drilling wi l l be a suitable method in providing
water in the rural areas in Basement.
To assess the groundwater resourses in Masasi and Nachingwea towns, investiga-
tions and testpumpings were carried out in the Mkumba Shamba wellfield in
Nachingwea and in the Magumchila wellfield in Masasi. No remarkable changes
were found in static water levels as a result of long continued pumping in Mkumba
Shamba and Magumchila. It seems to be possible to develop the Mkumba Shamba
wellfield further up to 1,500 m^/d. Together with Mkumba Pacha wellfield (600
m-Vd) and the local handpump wells (150 m^/d) the total groundwater abstraction
in Nachingwea could be raised up to about 2,250 m-Yd, which is more than three
times the present production. In Masasi the Magumchila wellfield seems to be
fully utilized with the capacity of 1,000 m-Vd and possibilities to find other local
groundwater resourses are small. Long term test pumpings are recommended to
verify the above estimates.
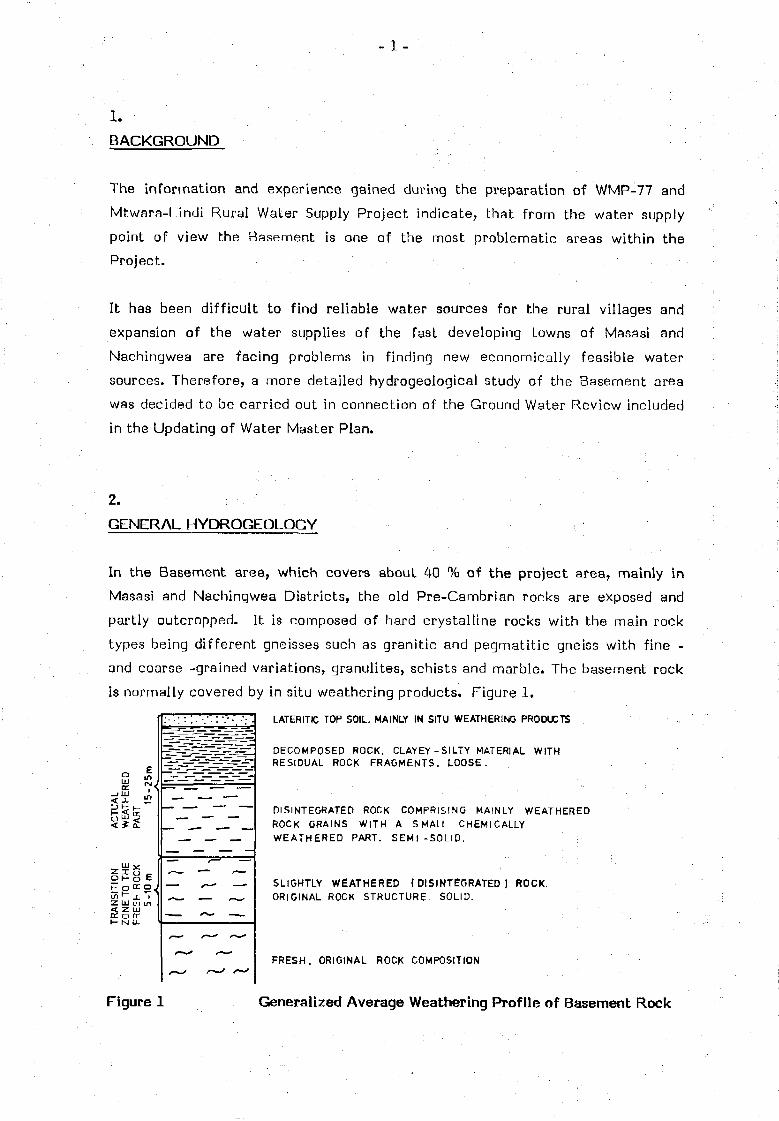
-1-
1.BACKGROUND
The information and experience gained during the preparation of WMP-77 and
Mtwara-Lindi Rural Water Supply Project indicate, that from the water supply
point of view the Basement is one of the most problematic areas within the
Project.
It has been difficult to find reliable water sources for the rural villages and
expansion of the water supplies of the fast developing towns of Masasi and
Nachingwea are facing problems in finding new economically feasible water
sources. Therefore, a more detailed hydrogeological study of the Basement area
was decided to be carried out in connection of the Ground Water Review included
in the Updating of Water Master Plan.
2.
GENERAL HYDROGEOLOGY
In the Basement area, which covers about 40 % of the project area, mainly in
Masasi and Nachingwea Districts, the old Pre-Cambrian rocks are exposed and
partly outcropped. It is composed of hard crystalline rocks with the main rock
types being different gneisses such as granitic and pegmatitic gneiss with fine -
and coarse -grained variations, granulites, schists and marble. The basement rock
is normally covered by in situ weathering products. Figure 1.
LATERITIC TOP SOIL. MAINLY IN SITU WEATHERING PRODUCTS
< * £
LU vZX o ,,oh o E
l/lh l I '2: LU w m<ZUJD: • ceh- M U.
. -1 - ! • j j
Figure 1
DECOMPOSED ROCK, CLAYEY-SILTY MATERIAL WITHRESIDUAL ROCK FRAGMENTS. LOOSE.
DISINTEGRATED ROCK COMPRISING MAINLY WEATHEREDROCK GRAINS WITH A SMALL CHEMICALLYWEATHERED PART. SEMI -SOLID.
SLIGHTLY WEATHERED (DISINTEGRATED) ROCK.ORIGINAL ROCK STRUCTURE. SOLID.
FRESH. ORIGINAL ROCK COMPOSITION
Generalized Average Weathering Profile of Basement Rock

- 2 -
The groundwater normally occurs in the upper layers of the weathered zone as a
form of perched water and in the lower part of the weathering profile. The best
aquifers are found in fault zones, where the coarse weathered layers are thicker.
GROUNDWATER QUALTTY
Data of the water quality of the different types of wells in Basement are
presented in Appendix 1. .
The deep groundwater met in the boreholes is almost neutral and hard. Iron
concentration is rather small but manganese almost always exceeds 0.1 ppm. The
main problem with the deep groundwater is salinity which in most cases limits its
domestic use. ;
The quality of shallow groundwater differs somewhat from that of deep
groundwater. Shallow groundwater is generally slightly acid and rather soft.
Fluoride and iron concentrations are small, but manganese concentration is
commonly rather high. Salinity is much lower than in the deep groundwater and
only in few cases exceeds the l imit set for the domestic water.
The drillings made by recently acquired down-the-hole (DTH) hammer dril l have
brought new light to the distribution of salinity in the basement area. Table 1
shows the conductivity (EC) in different types of wells.
Table 1. Electrical conductivity of groundwater in different well types inbasement
Well type Aquifer depth EC
Dug well 0 - 5 m Characteristically lessthan 700 S/cm
Boreholes for hand- 12 - 42 m 650 - 2130 S/cm anpump wells by an average 24 m average 1460 S/cmDTM-rig
Boreholes for motor- 12 - 84 m 800 - 9500 S/cmpump wells (average 28 m) (average 4500 S/cm)
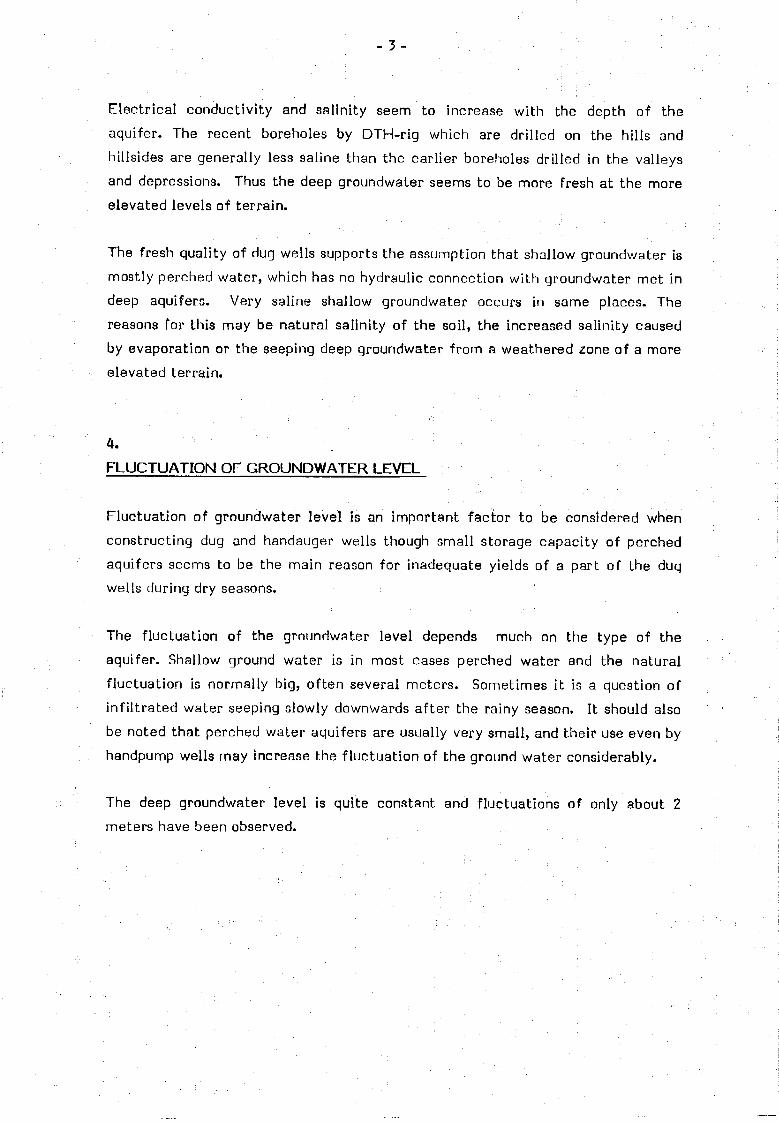
- 3 -
Electrical conductivity and salinity seem to increase with the depth of the
aquifer. The recent boreholes by DTH-rig which are drilled on the hills and
hillsides are generally less saline than the earlier boreholes drilled in the valleys
and depressions. Thus the deep groundwater seems to be more fresh at the more
elevated levels of terrain.
The fresh quality of dug wells supports the assumption that shallow groundwater is
mostly perched water, which has no hydraulic connection with groundwater met in
deep aquifers. Very saline shallow groundwater occurs in same places. The
reasons for this may be natural salinity of the soil, the increased salinity caused
by evaporation or the seeping deep groundwater from a weathered zone of a more
elevated terrain.
4.
FLUCTUATION OF GROUNDWATER LEVEL
Fluctuation of groundwater level is an important factor to be considered when
constructing dug and handauger wells though small storage capacity of perched
aquifers seems to be the main reason for inadequate yields of a part of the dug
wells during dry seasons.
The fluctuation of the groundwater level depends much on the type of the
aquifer. Shallow ground water is in most cases perched water and the natural
fluctuation is normally big, often several meters. Sometimes it is a question of
infiltrated water seeping slowly downwards after the rainy season. It should also
be noted that perched water aquifers are usually very small, and their use even by
handpump wells may increase the fluctuation of the ground water considerably.
The deep groundwater level is quite constant and fluctuations of only about 2
meters have been observed.
- 4 -
POTENTIAL ABSTRACTIONS
5.1 General
Hard crystalline and virtually impermeable basement rocks do not allow inf i l tra-
ted groundwater to flow to a greater depth as is the case in the sedimentary
formations. Thus groundwater level is commonly found at a shallow depth. The
static water level in the boreholes is 9 m on an average, whilst perched water
levels are close (1-3 m) to the surface at least during the rainy seasons.
Groundwater potential highly depends on the depth of the porous weathering
profile. The depth of the weathering profile is commonly 20 -30 m but can be over
100 m in deep fault zones, which are porous and form aquifers with rather large
groundwater storages as is the case in Magumchila in Masasi town.
5.2 Dug Wells
As mentioned earlier, water utilized by dug wells can be perched water or seeping
groundwater from a weathered zone of a more elevated terrain. According to the
WMP-77 most of the occurences located outside rivers and brooks are small and
their average yield has been estimated to be 10 m-Vday, the variation limits being
mostly 5...25 m^/day.
The yields of the dug wells are normally good during the rainy season and some
months after that, but less during the dry period. When the limited storage of the
aquifer decreases the groundwater level sinks resulting a smaller yield. The
whole aquifer can even dry up.
There are also high yielding dug wells in the Basement area with good water
quality. Information of these wells should be collected to develop the use of these
aquifers by constructing more wells at the same place. The wells with small yield
or poor quality can be left for secondary use such as for washing or for livestock.
13
- 5 -
The reliability of dug wells can be improved by better well-siting but due to the
nature of the perched water aquifers the possibilities are limited. The way of
improving the present unsufficient dug wells must be solved well by well and
exact instructions can be given only after detailed survey. Deepening an existing
well into impermeable soil is naturally ineffective.
The fact that dug wells in Nachingwea District do not dry up so easily as in Masasi
District, must be related to the structure of the surface layer of the weathered
profile. The apparently more porous structure of weathering products can be
caused by different mineralogical composition and grain size of the original rock.
An important factor for better wells has also been the improved siting and the
construction practices.
5.3 Handauger Wells
Due to • the soil conditions there are only about 25 handauger wells in the
Basement area. These wells are mostly sited in sandy river beds and therefore as
many as 70 to 90 % of them were perennial at the end of exceptionally dry period
in 1982.
5.4 DTH-rig Boreholes
Shallow boreholes (below 50 m) were proposed already in the WMP-77 and a cable
tool rig or some type of compressed air rig to drill them.
A compressed air rig was purchased in 1984 for the Project to be used in the
Basement area. The rig (Atlas Copco Aquadrill) is equipped with down-the-hole
(DTH) hammer.
Altogether 37 boreholes have been drilled up to 31.12.1984. Boreholes are in
Basement area nearby Masasi Town and along roads from Masasi to Newala and
Tunduru. Boreholes were sited without any geophysical survey and this has caused
a great number of unsuccessful boreholes. To find fault zones with good aquifer
properties is commonly impossible without geophysical survey as the weathering
profile hides the features created by faulted zones. Small amount of water was
found almost in every borehole, but 8 were virtually dry. The distribution of yields
of the boreholes is in Table 2. Detailed information of the boreholes is in
Appendix 2.
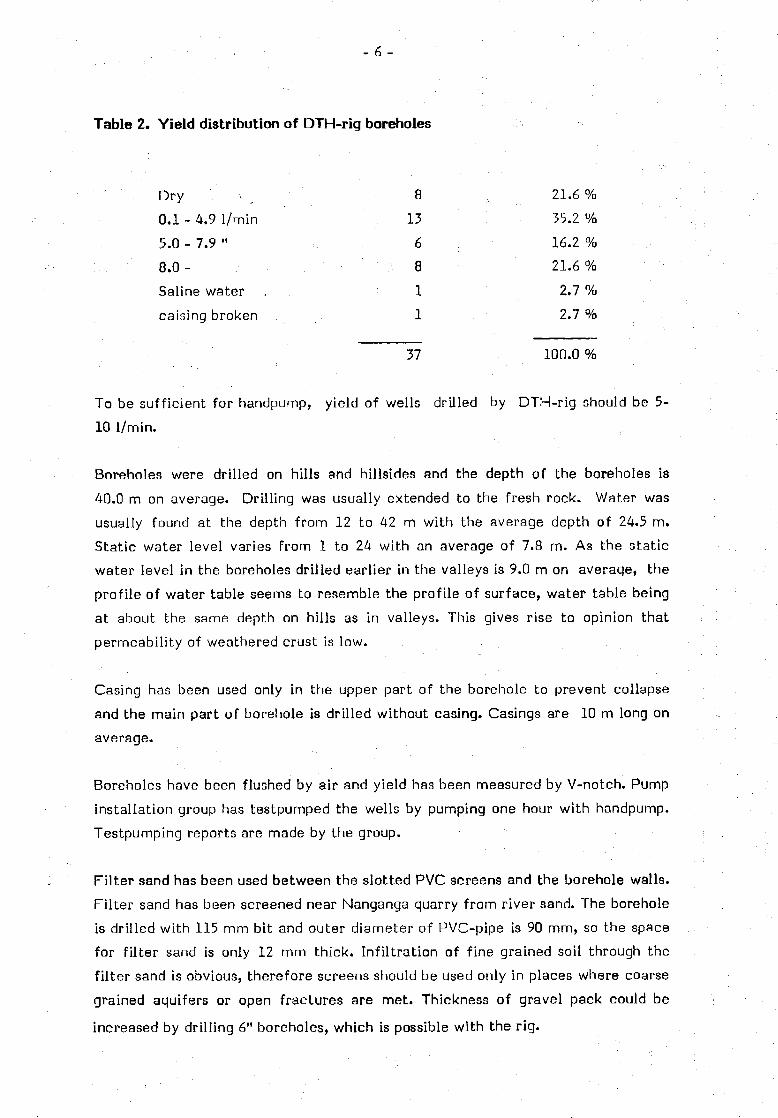
- 6 -
Table 2. Yield distribution of DTH-rig boreholes
Dry v
0.1 - 4.9 1/min
5 . 0 - 7 . 9 "
8.0 -
Saline water
caising broken
8
13
6
8
11
21.6 %35.2 %
16.2 %
21.6 %
2.7 %
2.7 %
37 100.0 %
To be sufficient for handpump, yield of wells drilled by DTH-rig should be 5-
10 1/min.
Boreholes were drilled on hills and hillsides and the depth of the boreholes is
40.0 rn on average. Drilling was usually extended to the fresh rock. Water was
usually found at the depth from 12 to 42 m with the average depth of 24.5 m.
Static water level varies from 1 to 24 with an average of 7.8 m. As the static
water level in the boreholes drilled earlier in the valleys is 9.0 m on average, the
profile of water table seems to resemble the profile of surface, water table being
at about the same depth on hills as in valleys. This gives rise to opinion that
permeability of weathered crust is low.
Casing has been used only in the upper part of the borehole to prevent collapse
and the main part of borehole is drilled without casing. Casings are 10 m long on
average.
Boreholes have been flushed by air and yield has been measured by V-notch. Pump
installation group has testpumped the wells by pumping one hour with handpump.
Testpumping reports are made by the group.
Filter sand has been used between the slotted PVC screens and the borehole walls.
Filter sand has been screened near Nanganga quarry from river sand. The borehole
is drilled with 115 mm bit and outer diameter of PVC-pipe is 90 mm, so the space
for f i l ter sand is only 12 mm thick. Infiltration of fine grained soil through the
fi l ter sand is obvious, therefore screens should be used only in places where coarse
grained aquifers or open fractures are met. Thickness of gravel pack could be
increased by drilling 6" boreholes, which is possible with the rig.
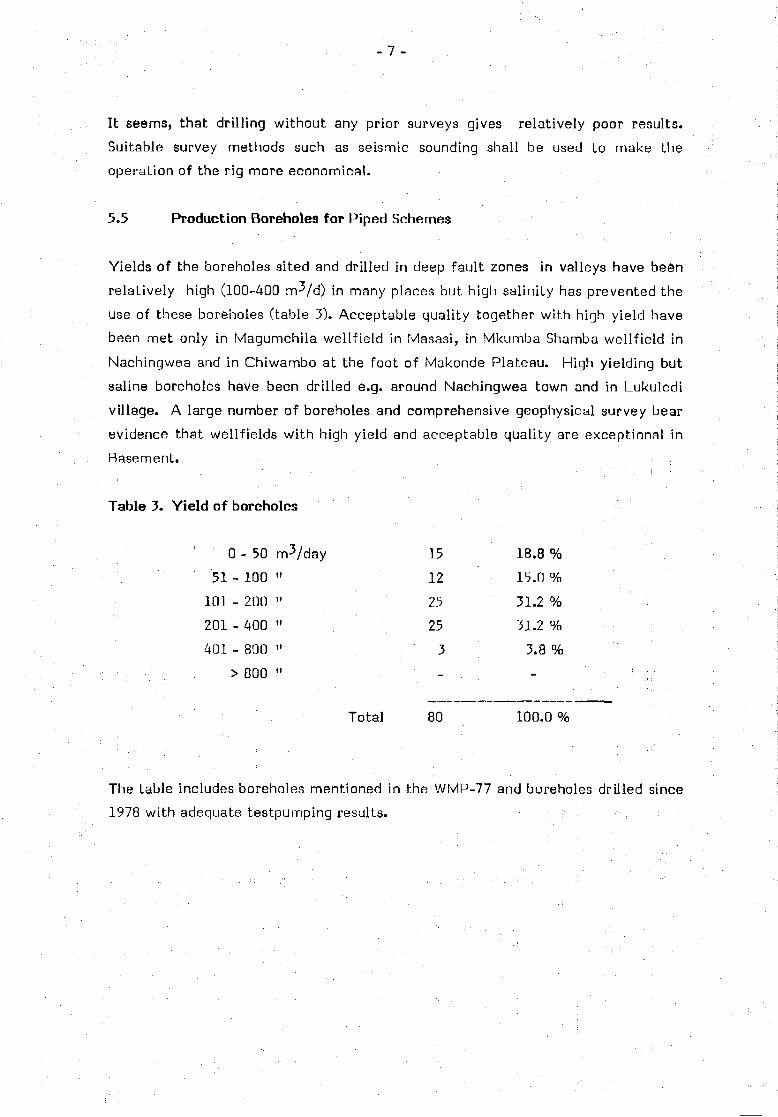
- 7 -
It seems, that drilling without any prior surveys gives relatively poor results.
Suitable survey methods such as seismic sounding shall be used to make the
operation of the rig more economical.
5.5 Production Boreholes for Piped Schemes
Yields of the boreholes sited and drilled in deep fault zones in valleys have been
relatively high (100-400 m-Vd) in many places but high salinity has prevented the
use of these boreholes (table 3). Acceptable quality together with high yield have
been met only in Magumchila wellfield in Masasi, in Mkumba Shamba wellfield in
Nachingwea and in Chiwambo at the foot of Makonde Plateau. High yielding but
saline boreholes have been drilled e.g. around Nachingwea town and in Lukuledi
village. A large number of boreholes and comprehensive geophysical survey bear
evidence that wellfields with high yield and acceptable quality are exceptional in
Basement.
Table 3. Yield of boreholes
0- 50
51 - 100
101 - 200
201 - 400
401 - 800
> 800
mii
M
H
H
H
3/day 15
12
25
25
3
-
18.8 %
15.0 %
31.2 %
31.2 %
3.8 %
-
Total 80 100.0 %
The table includes boreholes mentioned in the WMP-77 and boreholes drilled since
1978 with adequate testpumping results.
- 8 -
6.GROUNDWATER RESOURCES OF NACHINGWEA URBAN AREA
6.1 Present Water Supply
The present water supply of the Nachingwea town is based on groundwater. There
are four well fields each of them with several boreholes. When testpumpings were
done in November 1984 only Mkumba Shamba wellfield was in use, and there only
3 pumps were pumping water while others were broken. Other wellfields are
Mkumba Pacha, Kihue and Nambemba. Water is suitable for domestic use only in
Mkumba Shamba and in one borehole in Mkumba Pacha whereas water of Kihue
are Nambemba is too saline. There are 25 handpump wells in Nachingwea town
which are an important source of water for people because piped water supply is
unreliable owing to leakages and poor condition of pipeline network.
According to information given by local authorities the daily pumping during
Sept.-Dec. 1984 has been 20 hours yielding about 600-750 m^. Shortage of diesel
and electrical power supply from Tanesco have caused even smaller supplies than
600 m-Vd. The other wellfields, Mkumba Pacha, Nambemba and Kihue, had not
been pumped for several months.
The water supply system and the wellfields are shown in Figure 2.

- 9 -
NACHINGWEA WATER SUPPLY
| J 5 0 O 0 O
- 10 -
6.2 Mkumba Shamba Wellfield
The wellfield comprises 8 boreholes equipped with pumps, which have been used
during recent years, but now only three of them are operating. Testpumpings of 4
wells constructed by Finnwater were done in November 1984 in order to
investigate the yield of the wellfield.
Lay-out of the wellfield is presented in Figure 3, the list of boreholes in Appendix
3 and results of testpumping in Appendix 4.
Static water levels were about the same as informed in the original borehole
reports. So far the continued pumping has not had any effect on the groundwater
level.
The total yield of the pumps is 47.1 r r r /h , which is 72 % of the estimated total
yield of boreholes (65 rrr/h).
6.2.1 Detailed Description of Testpumpings
Well no. 1.
A 3-step pumping test was done 24.10.1984 to determine well equation. Yield was
increased step by step 1/3 Q max., 2/3 Q max., Q max. Each step lasted 2 hours
(Figure 4, p. 14).
Drawdown was 10.83 m in well 1 and 10.14 m in well 2. There seems to be a
straight connection between wells 1 and 2.
Plotting of the specific drawdown against the yield does not give a straight line
relation. This is probably due to turbulent flow in an open fracture in rock. The
fracture was identified during drilling work of wells 1 and 2. The opening gives
explanation to good connections between these wells.
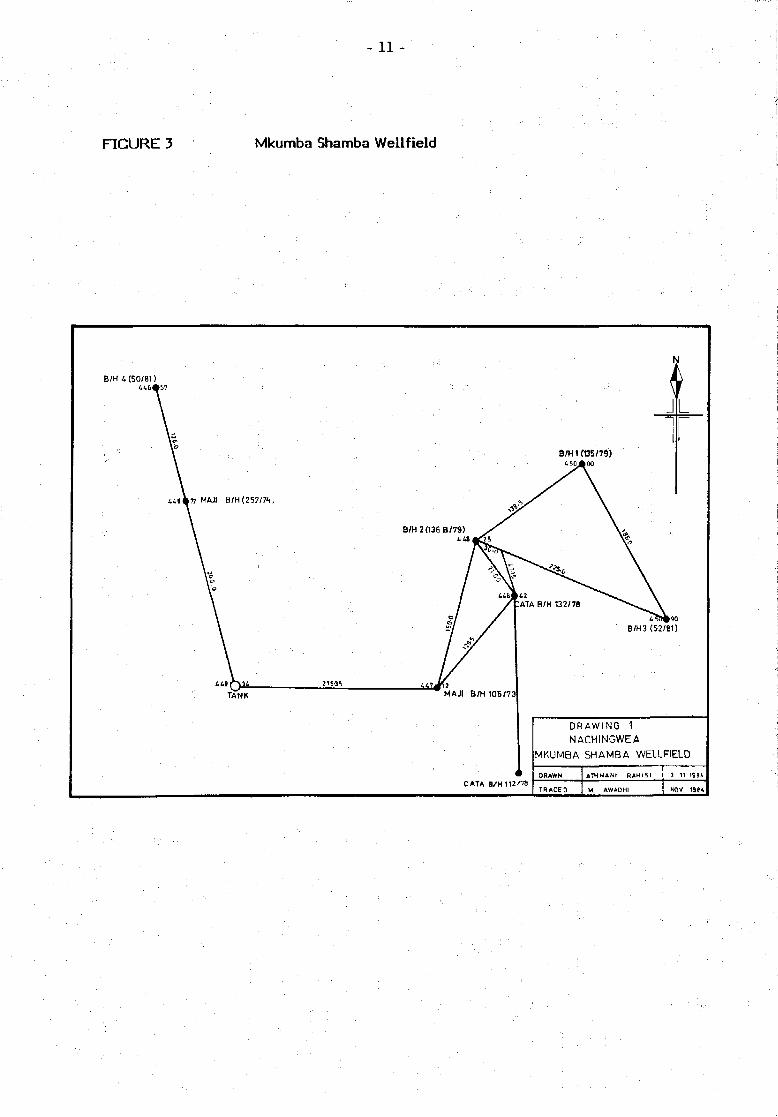
- 1 1 -
FIGURE 3 Mkumba Shamba Wellfield
B/H 4 {50/81 )
TANK
B/H 2(136 B/79)
DRAWING 1NACHINGWEA
MKUMBA SHAMBA WELLFIELD
ATHHANI RAHI5I
- 12 -
Single stage pumping tests were done after a 3-stage test. First pumping test was
performed 1.2.11.1984 by the pump of the well. Drawdown was 13.08 m as a result
of 24 hours pumping. Discharge during first 4 hours of pumping was 25.7 m-Vh and
decreased later being constant 21.2 m^/h. Total quantity of pumped water was
517 m-' in 24 hours. Recovering time was 6 hours (Figure 5). The value of
transmissivity is 24.2 m^/day according to the interpretation of pumping and
recovery test data (Figures 10 and 11).
Changes of water level in well 2 were similar to that in testpumped well. In well
2 the drawdown was 12.23 m. During the pumping the water level in well 2 was
about 1 m higher than in well 1. Static water levels are the same in both wells.
Another testpumping was done on 22.11.1984 by installing a high capacity pump in
the well. At the beginning the discharge was 42.3 m^/h thereafter stabilizing at
36 m-Vh. Pumping time was 14 h 50 min. Drawdown was 22.5 m. Water level
reached the pump level after 14 h 50 min pumping when the pumping was stopped.
Recovering time was 15 h (Figure 5).
Well no. 2
Single stage pumping test lasting 26 h 10 min was done in from 31.10.1984 to
1.11.1984. Discharge was 7.4 m^/h giving a drawdown of 9.95 m. Drawdown in
well 1 was 2.93 m, which is about the same, if well 1 were pumped with the
capacity of 7...8 m-Vh. Recovery was one hour (Figure 6),
Well no. 3
A 3-step pumping test was done 25.10.1984 to determine well equation (Figure 7).
Drawdown was 7.22 m. Determination of well losses gave unreliable results
possibly due to turbulent flow in the fractures of the bedrock.
Single stage pumping test was done during 22..23.11.1984 lasting 16 h 40 min.
Drawdown was 10.12 m with a discharge of 10 m^/h. Recovery time was about 4
h. Pumping had no effect on water levels in wells 1 and 2 (Figure 8). The value of
transmissivity is 18.1 m^/day according to the interpretation of pumping test data
(Figure 12) and 14.7 m2/day according to the recovery test data (Figure 13).
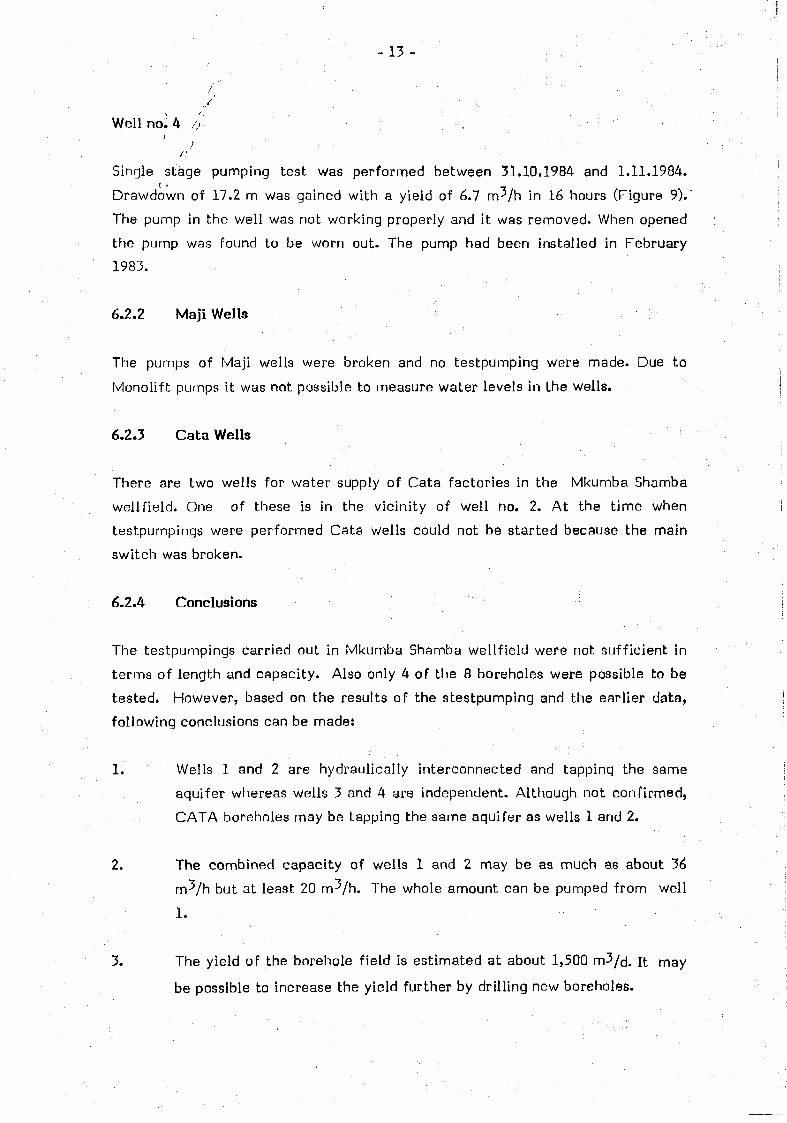
- 13 -
W e l l n o : 4 /,•• ,
/ •
Single stage pumping test was performed between 31.10.1984 and 1.11.1984.
Drawdown of 17.2 m was gained with a yield of 6.7 m^/h in 16 hours (Figure 9) /
The pump in the well was not working properly and it was removed. When opened
the pump was found to be worn out. The pump had been installed in February
1983.
6.2.2 Maji Wells
The pumps of Maji wells were broken and no testpumping were made. Due to
Monolift pumps it was not possible to measure water levels in the wells.
6.2.3 Cata Wells
There are two wells for water supply of Cata factories in the Mkumba Shamba
wellfield. One of these is in the vicinity of well no. 2. At the time when
testpurnpings were performed Cata wells could not be started because the main
switch was broken.
6.2.4 Conclusions
The testpumpings carried out in Mkumba Shamba wellfield were not sufficient in
terms of length and capacity. Also only 4 of the 8 boreholes were possible to be
tested. However, based on the results of the stestpumping and the earlier data,
following conclusions can be made:
1. Wells 1 and 2 are hydraulically interconnected and tapping the same
aquifer whereas wells 3 and 4 are independent. Although not confirmed,
CATA boreholes may be tapping the same aquifer as wells 1 and 2.
2. The combined capacity of wells 1 and 2 may be as much as about "36
m^/h but at least 20 m^/h. The whole amount can be pumped from well
1.
3. The yield of the borehole field is estimated at about 1,500 m3/d. i t may
be possible to increase the yield further by drilling new boreholes.

- 14-
4. With Mkumba Shamba wellfield (1,500 m^/d), Mkumba Pacha wellfield
(600 m3/d) and the 25 shallow wells (150 m^/d) the total present water
resources in Nachingwea can be estimated at about 2,250 m^/d. There
may be possibilities to increase this further.
5. Long term test pumpings are needed to verify the above estimates.
FIGURE 4 3-Stage Testpumping of Well 1, Mkumba Shamba
3-STEP PUMPING TESTDATE = 24. 10.1984STATIC WATER LEVEL = 15.21 mDRAWDOWN = 10.83 mPUMPING TIME = 6 h
oo
5
6
7
8
9
10
11
—
—
2.2
-» « » -
W
l/s
vL IN WE
3.4
WL IN
% ^
LLiJ^
WELL 2
\
V\
6J
\
c
10 11 12 13TIME IN h
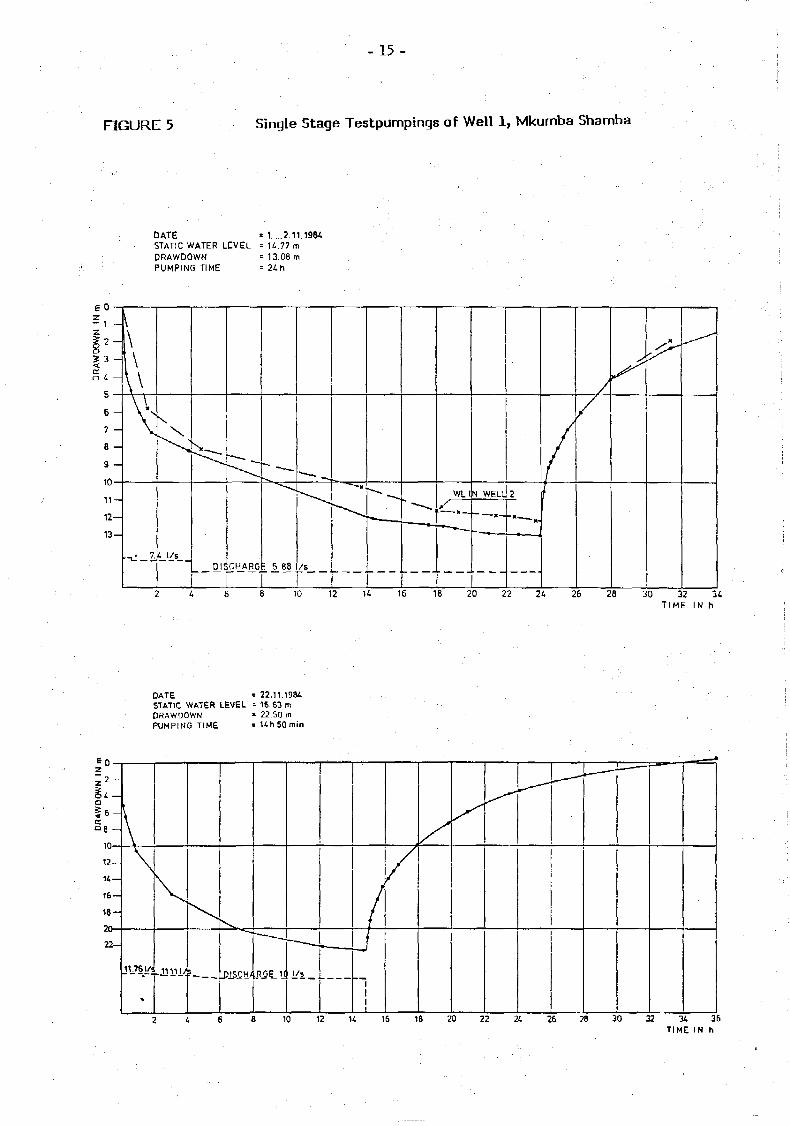
- 1 5 -
FIGURE 5 Single Stage Testpumpings of Well 1, Mkumba Shamba
DATE « 1....2.11.1984STATIC WATER LEVEL - 14.77 mDRAWDOWN = 13.08 mPUMPING TIME = 24h
" -
I 3 -§ 4 -
c
6 -
7 -
8 -
9 -
i r t
1 2 -
ÏV\
•-il 7- 4 l/s
N
DIS CHARG K 5.88
T
- — B
WL 1
-K —
N WELL
x—i
,
2
/
/
/
/
/
/
- -
10 12 14 16 18 20 22 24 26 28 30 32 34T I M E IN h
DATE = 22.11.1984STATIC WATER LEVEL = 16.63mDRAWDOWN - 22.SO mPUMPING TIME
z~l2 2 —
X8 ~~
1 2 -
14 —
1 6 -
1 8 -
2 2 -
V \
•
• — — — .
/
i
I[
/
. — — —• i ~
10 12 16 18 20 22 24 26 28 30 32 34 35TIME IN h

- 16 -
FIGURE 6 Single Stage Testpumpings of Well 2, Mkumba Shamba
DATE = 31.10. ...1.11.1984STATIC WATER LEVEL = 13.34 mDRAWDOWN = 9.95 mPUMPING TIME = 2 6 h l 0 m i n
FIGURE 7
6 8 10 12 H 16 18 20 22 24
3-Stage Testpumpings of Well 3, Mkumba Shamba
26 28 30TIME IN h
3-STEP PUMPING TESTDATE = 25.10.1984STATIC WATER LEVEL = 12.66 mDRAWDOWN = 7.22 mPUMPING TIME = 6h
9 10TIME IN h
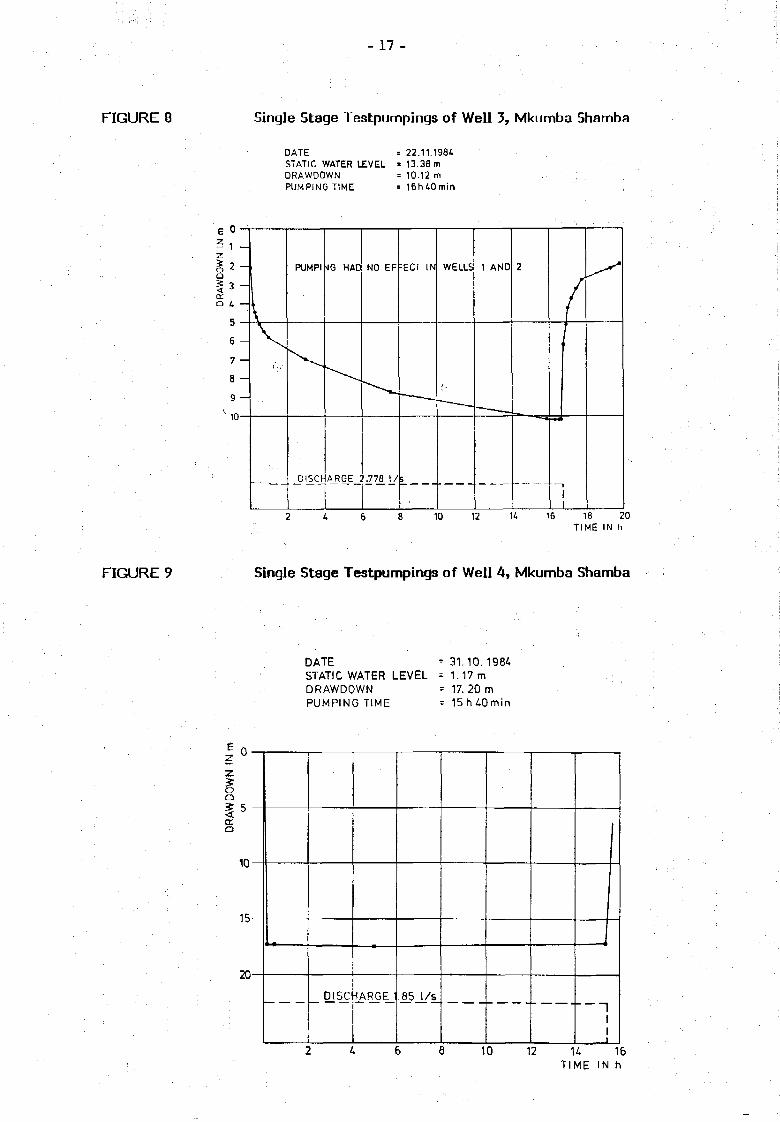
_ 17 -
FIGURE 8 Single Stage Testpumpings of Well 3, Mkumba Shamba
DATE = 22.11.19S4STATIC WATER LEVEL * 13.38 mDRAWDOWN = 10.12 mPUMPING TIME = i6h40min
(! 0 |
6 -
7 -
8 -
g _,
PUMPI
DISCI
M G H AC
ARGE :
NO EF
.778 1 /
-ECT IN
" •
WELLS
—
1 AND
~.
2
/
110 12 14 16 18 20
TIME IN h
FIGURE 9 Single Stage Testpumpings of Well 4, Mkumba Shamba
DATE =31.10.1984STATIC WATER LEVEL = 1.17 mDRAWDOWN = 17. 20 mPUMPING TIME = 1 5 h £ 0 m i n
I•1 5CEO
10
15
20
DISC ^ARGEi .85 l/s
10 12 U 16TIME IN h

- 1 8 -
FIGURE 10 Interpretation of Testpumping Data of Well 1,
Mkumba Shamba
12-
10 -
e -
E -
4 -
2 -
1
WELL 1
ASÛ
T
*
- 3 8 m= 5.90 1/s 5.90.1
2.3 «Q
0.183»
D"3 mVs
S
5.9 - 10"3
3.a= 0.28>10°m2/si 24 2 m J /day
•
\
1A 5=3.8 m
-^»
10 100 1000t in minutes

- 19 -
FIGURE 11 Interpretation of Recovery Test Data of Well 1,
Mkumba Shamba
12-
10 -
6 -
L -
2 -
WEL
AS'Û
T
1 IL 1
= 3. 9 m
= 5.90 1/s= 5.90.10 3mVs. 2-3 "Q• » n « AS'
^o.issxS.goxio"3
3.9*0.28 « 10"3m:/s= 24.2 m2/doy
***
m
1
V
• •*-**
•
AS' = 3.9 m
L
**•
10 100 1000t/t' in minutes
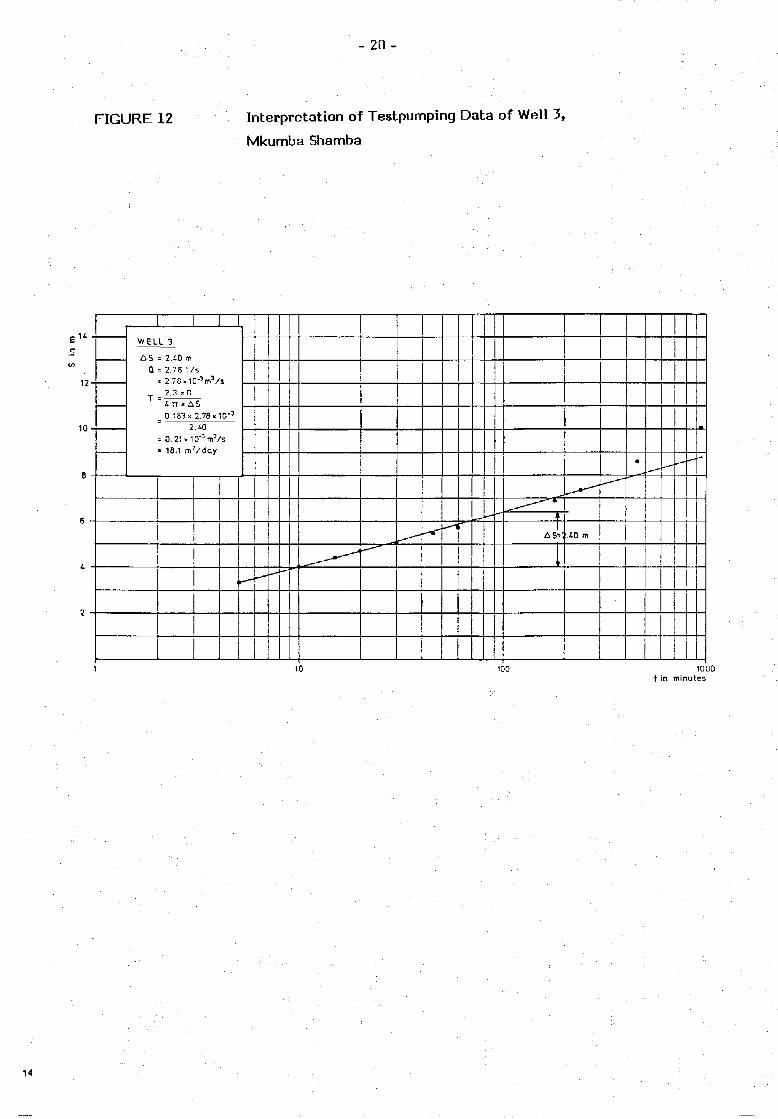
- 20 -
FIGURE 12 Interpretation of Testpumping Data of Well 3,
Mkumba Shamba
12-
1 0 -
8 -
6 -
4 -
2 -
WELL 3
ASÛ
T
= 2.40 m= 2.78 1/« 2.78 «1
2.3 "Q" 4 TT « AS
0.183- 2.78»
s
10°2.Ml
= 0.21»10"3mVs= 18.1 m 2 /day
P—-'
*•*
* * -
t1
AS= .40 m
«—
.—'
10 100 1000t in minutes
14
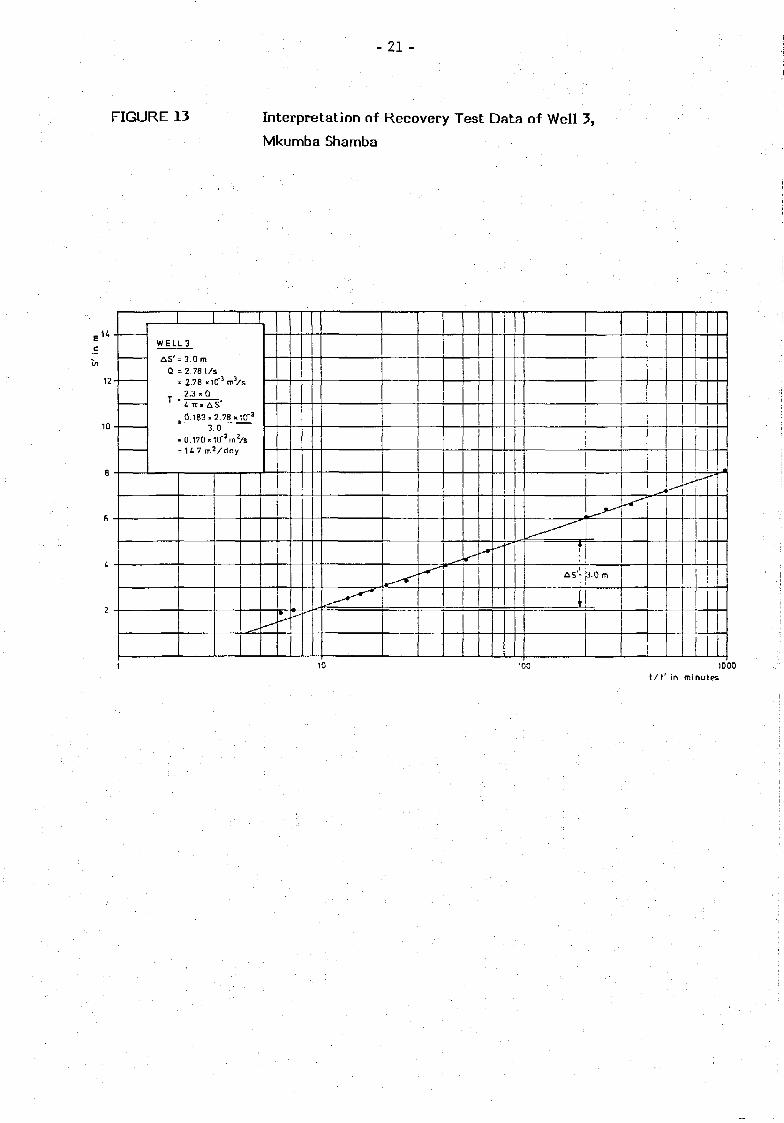
- 21 -
FIGURE 13 Interpretation of Recovery Test Data of Well 3,
Mkumba Shamba
u -
12-
10 -
8 -
S -
2 -
1
WEL
ÛS'Q
T
. 3
= 3.0 m
= 2.78 1 /
* 2.78 «1
2.3 «Q
£ ^J
iCT3 mVs
s'2.78 »10"3
' 0.170 .lO^mVs-14.7 mVdny
-* 1AS'- 3-0 m
- •r~
10 100 1000t / t ' in minutes
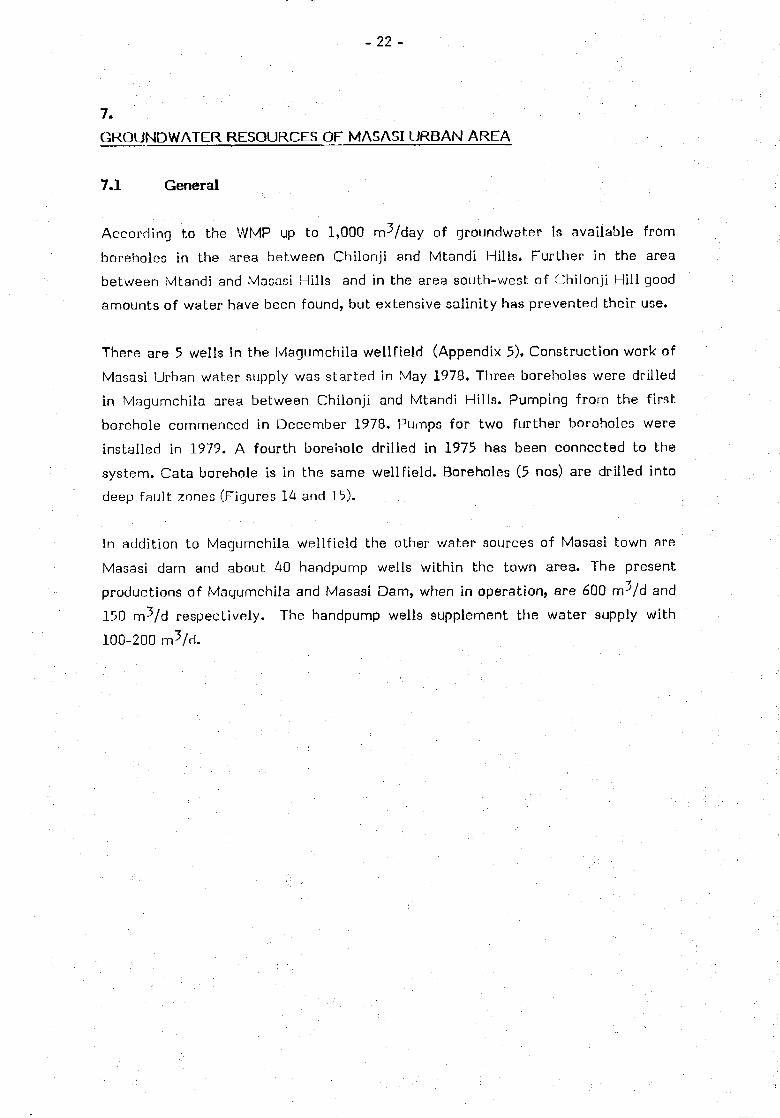
- 22 -
7 . ' : ' • ' • . ; . • • • . • . • • ' ••
GROUNDWATER RESOURCES OF MASASI URBAN AREA
7.1 General
According to the WMP up to 1,000 m^/day of groundwater is available from
boreholes in the area between Chilonji and Mtandi Hills. Further in the area
between Mtandi and Masasi Hills and in the area south-west of Chilonji Hil l good
amounts of water have been found, but extensive salinity has prevented their use.
There are 5 wells in the Magumchila wellfield (Appendix 5). Construction work of
Masasi Urban water supply was started in May 1978. Three boreholes were drilled
in Magumchila area between Chilonji and Mtandi Hills. Pumping from the first
borehole commenced in December 1978. Pumps for two further boroholes were
installed in 1979. A fourth borehole drilled in 1975 has been connected to the
system. Cata borehole is in the same wellfield. Boreholes (5 nos) are drilled into
deep fault zones (Figures 14 and 15).
In addition to Magumchila wellfield the other water sources of Masasi town are
Masasi dam and about 40 handpump wells within the town area. The present
productions of Magumchila and Masasi Dam, when in operation, are 600 nrr/d and
150 m-Vd respectively. The handpump wells supplement the water supply with
100-200 m3 /d.
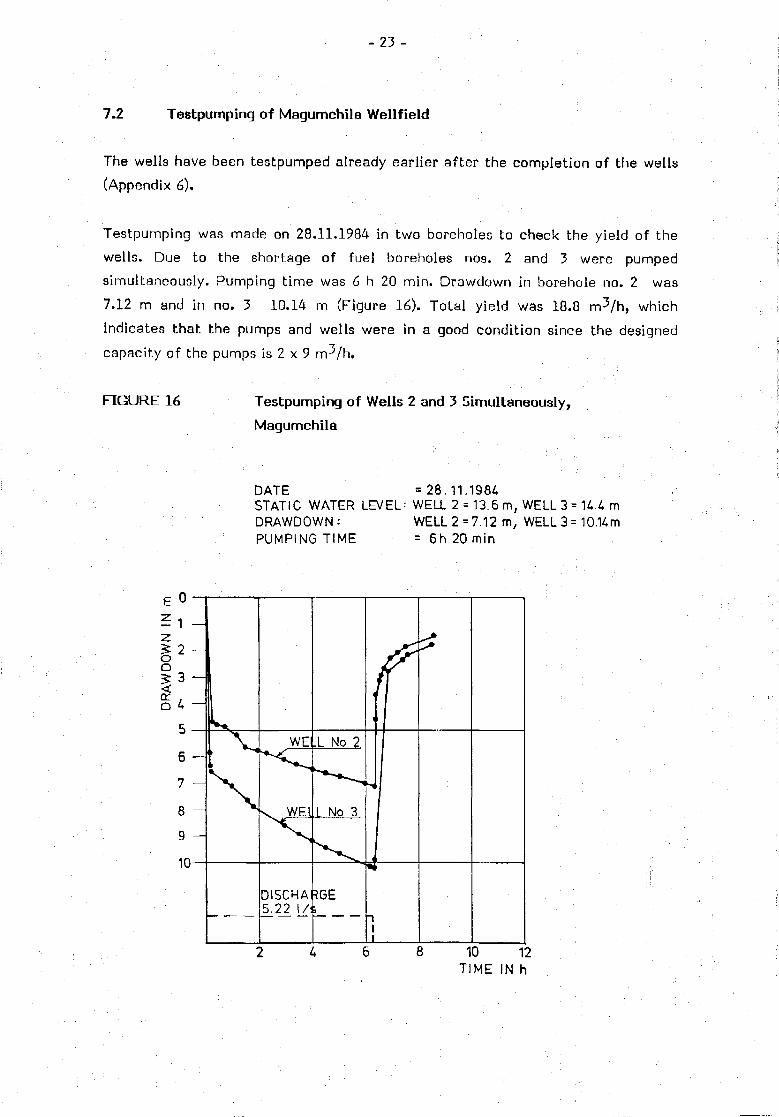
- 23 -
7.2 Testpumping of Magumchila Wellfield
The wells have been testpumped already earlier after the completion of the wells
(Appendix 6).
Testpumping was made on 28.11.1984 in two boreholes to check the yield of the
wells. Due to the shortage of fuel boreholes nos. 2 and 3 were pumped
simultaneously. Pumping time was 6 h 20 min. Drawdown in borehole no. 2 was
7.12 m and in no. 3 10.14 m (Figure 16). Total yield was 18.8 m3 /h, which
indicates that the pumps and wells were in a good condition since the designed
capacity of the pumps is 2 x 9 m^/h.
FIGURE 16 Testpumping of Wells 2 and 3 Simultaneously,
Magumchila
DATE «28.11.1984STATIC WATER LEVEL: WELL 2 = 13.6 m, WELL 3 = 14.4 mDRAWDOWN: WELL 2 = 7.12 m, WELL 3= 10.14mPUMPING TIME = 6h 20 min
10 12TIME IN h
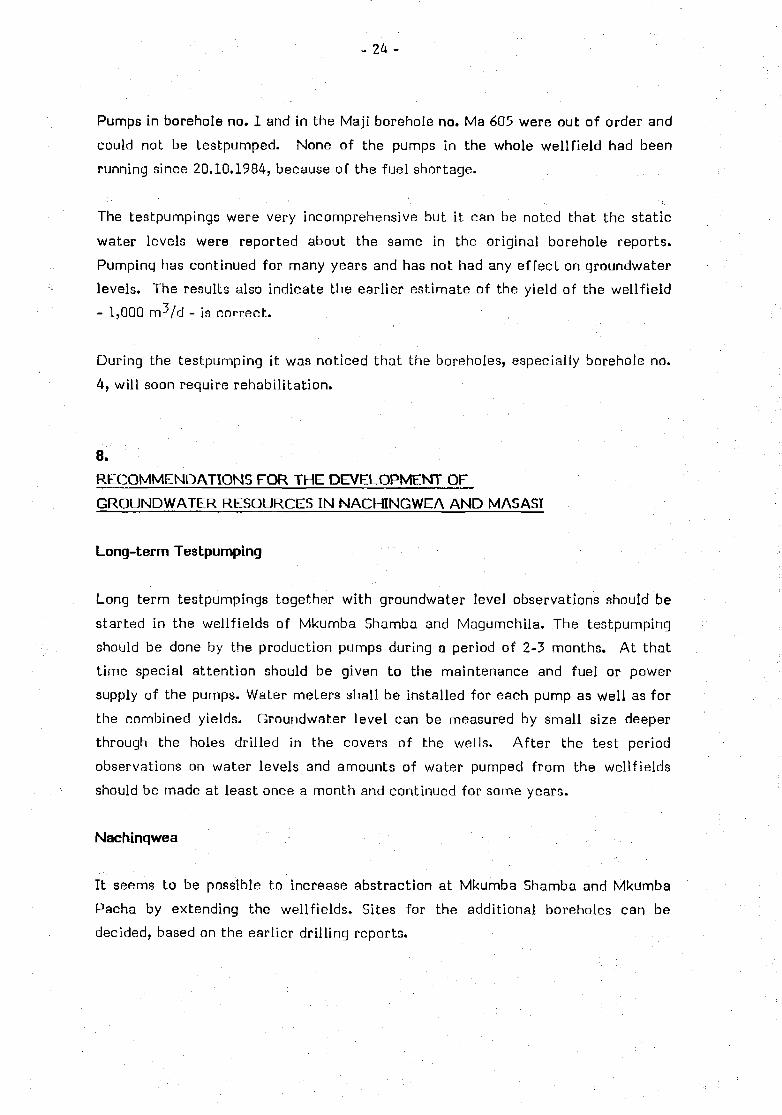
- 2 4 -
Pumps in borehole no. 1 and in the Maji borehole no. Ma 605 were out of order and
could not be testpumped. None of the pumps in the whole wellfield had been
running since 20.10.1984, because of the fuel shortage.
The testpumpings were very incomprehensive but it can be noted that the static
water levels were reported about the same in the original borehole reports.
Pumping has continued for many years and has not had any effect on groundwater
levels. The results also indicate the earlier estimate of the yield of the wellfield
- 1,000 rn^/d - is correct.
During the testpumping i t was noticed that the boreholes, especially borehole no.
4, will soon require rehabilitation.
8.
RECOMMENDATIONS FOR THE DEVELOPMENT OF
GROUNDWATER RESOURCES IN NACHINGWEA AND MASASI
Long-term Testpumping
Long term testpumpings together with groundwater level observations should be
started in the wellfields of Mkumba Shamba and Magumchila. The testpumping
should be done by the production pumps during a period of 2-3 months. At that
time special attention should be given to the maintenance and fuel or power
supply of the pumps. Water meters shall be installed for each pump as well as for
the combined yields. Groundwater level can be measured by small size deeper
through the holes drilled in the covers of the wells. After the test period
observations on water levels and amounts of water pumped from the wellfields
should be made at least once a month and continued for some years.
Nachinqwea
It seems to be possible to increase abstraction at Mkumba Shamba and Mkumba
Pacha by extending the wellfields. Sites for the additional boreholes can be
decided, based on the earlier drilling reports.
Masasi
Other potential sites in the area around Masasi Hills should be investigated in
spite of seismic soundings, which were not promising. This can be done in
connection of the ongoing DTH-rig programme so that drilling for the handpump
wells should be carried out in the geologically promissing areas near Masasi. High
yielding boreholes should be tested propely in order to estabilish the potential of
each aquifer. Seismic sounding should be used for siting the boreholes in areas,
where seismic survey has not been carried out earlier.
Hand Pump Wells
Handpump wells have proved to be a necessary and feasible stand-by system in
both Masasi and Nachingwea towns. Their number should be increased.
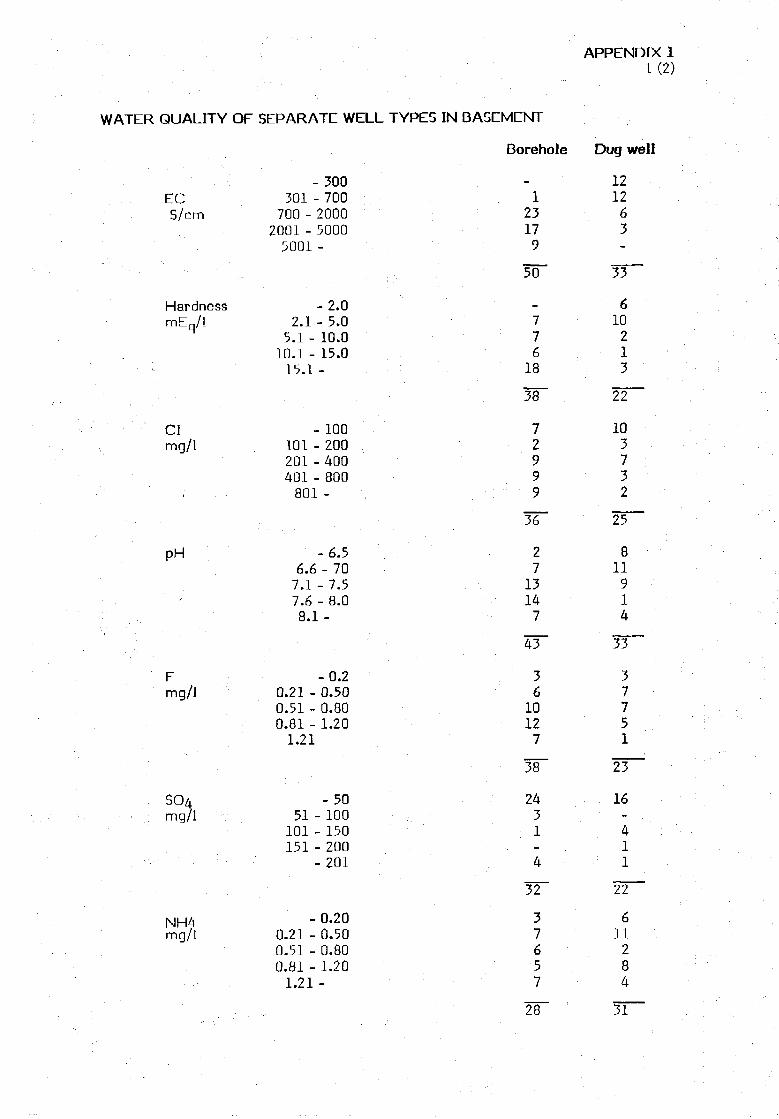
APPENDIX 11 ( 2 )
WATER QUALITY OF SEPARATE WELL TYPES IN BASEMENT
Borehole Dug well
121 12
23 617 3
9
ECS/cm
HardnessmEq/l
Clmg/l
pH
mg/l
SOAmg/l
NH4mg/l
- 300301 - 700
700 - 20002001 - 50005001 -
-2.02.1 - 5.0
5.1 - 10.010.1 - 15.015.1 -
- 100101 - 200201 - 400401 - 800801 -
- 6.56.6 - 707.1 - 7.57.6 - 8.08.1-
- 0.20.21 - 0.500.51 - 0.800.81 - 1.201.21
-5051 - 100
101 - 150151 - 200
- 201
- 0.200.21 - 0.500.51 - 0.800.81 - 1.201.21 -
50
^77618
38"
72999
3éT
2713147
43"
3610127
38"
2431_4
32
37657
33
é102
i—i
3
103732
25
8119
i—i
4
33
37751
23
16_411
22
611284
28 31
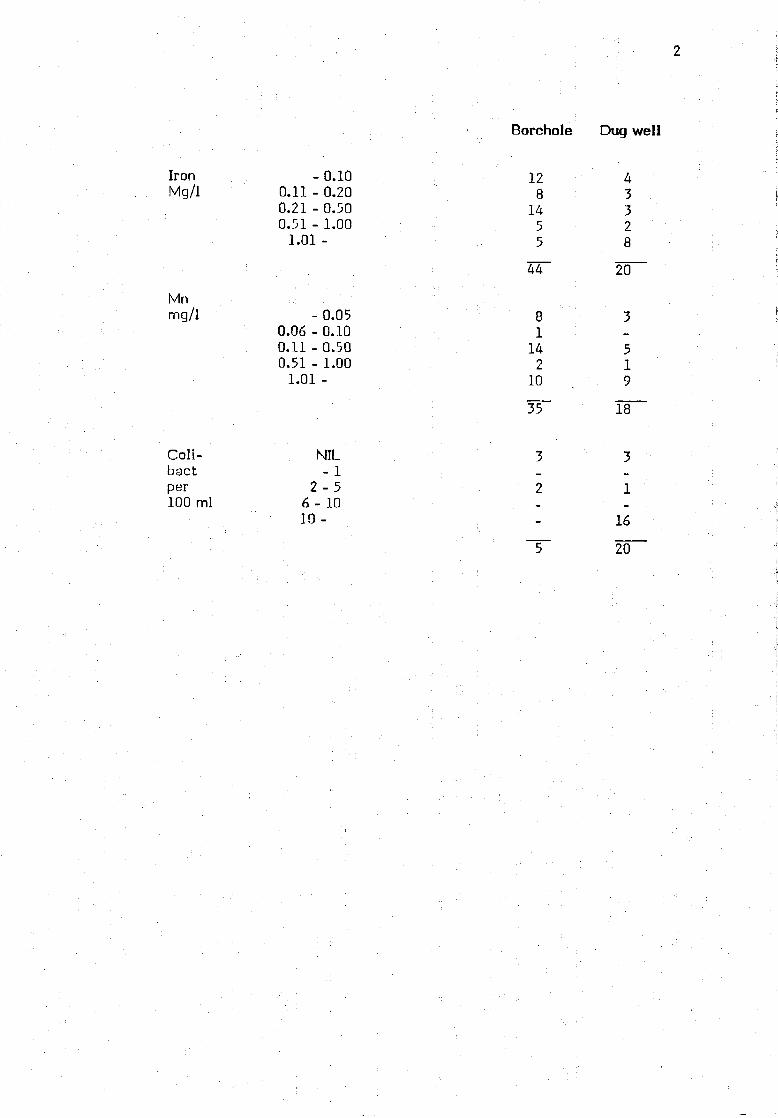
IronMg/1
Mnmg/1
- 0.100.11 - 0.200.21 - 0.500.51 - 1.00
1.01 -
-0.050.06-0.100.11 - 0.500.51 - 1.00
1.01 -
Coli-bactper100 ml
NIL- 1
2 - 56 - 1010 -
Borehole Dug well
128
1455
44
81
142
10
35
3
2
-
43328
20
3_519
Ï8~
3
1
16
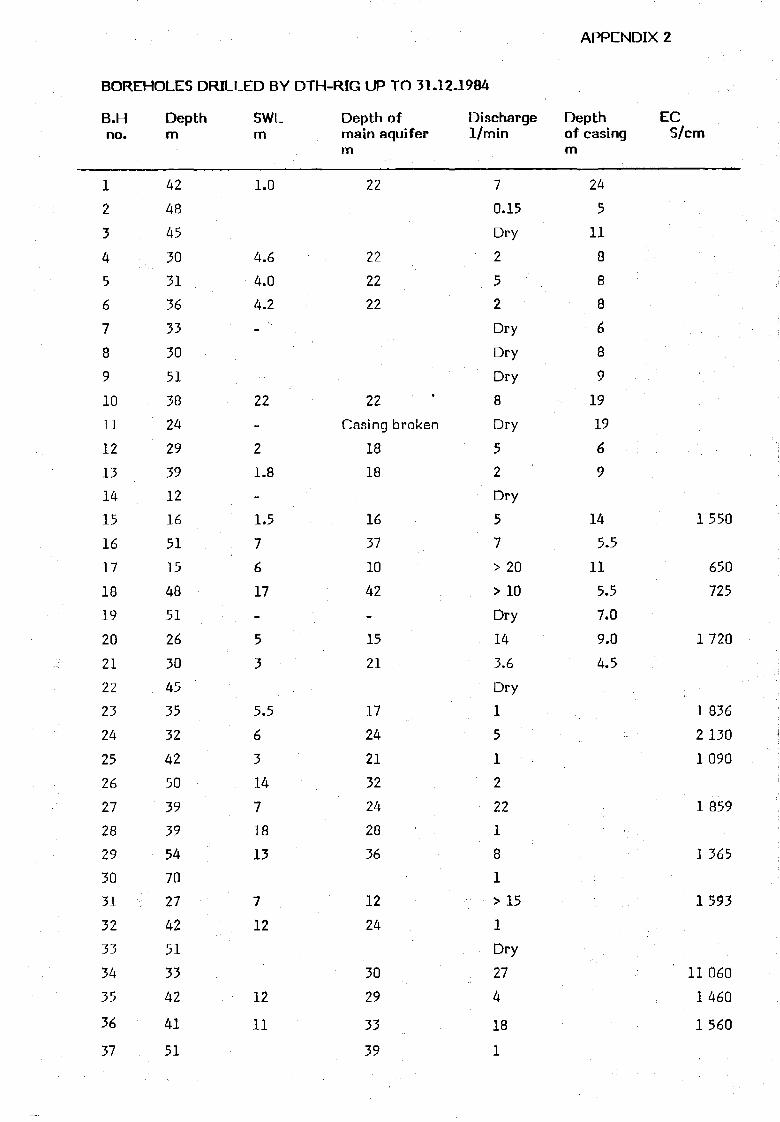
APPENDIX 2
BOREHOLES DRILLED BY DTH-RIG UP TO 31.12-1984
B.Hno.
1
2
3
4
5
6
7
8
9
10
11
12
13
14
15
16
17
18
19
20
21
22
23
24
25
26
27
28
29
30
31
32
33
34
35
36
37
Depthm
42
48
45
30
31
36
33
30
51
38
24
29
39
12
16
51
15
48
5126
30
45
35
32
42
50
39
39
54 \
70
27
42
51
33
42
41
51
SWLm
1.0
4.6
4.0
4.2
-
22
-
2
1.8
_
1.5
7
6
17
-
5
3
5.5
6
3
14
7
18
13
7
12
12
11
Depth ofmain aquiferm
22
22
22
22
22
Casing broken
18
18
16
37
10
42
-
15
21
17
24
21
32
24
28
36
12
24
30
29
33
39
Discharge1/min
7
0.15
Dry
2
5
2
Dry
Dry
Dry
8
Dry
52
Dry
5
7
> 20
>10
Dry14
3.6
Dry
1
51
2
22
1
8
1
>15
1
Dry
27
4
18
1
Depthof casingm
24
511
8
8
8
6
8
9
19
19
6
9
14
5.5
11
5.5
7.0
9.0
4.5
ECS/cm
1 550
650
725
1720
1 836
2 130
1090
1 859
1365
1 593
11 060
1460
1560
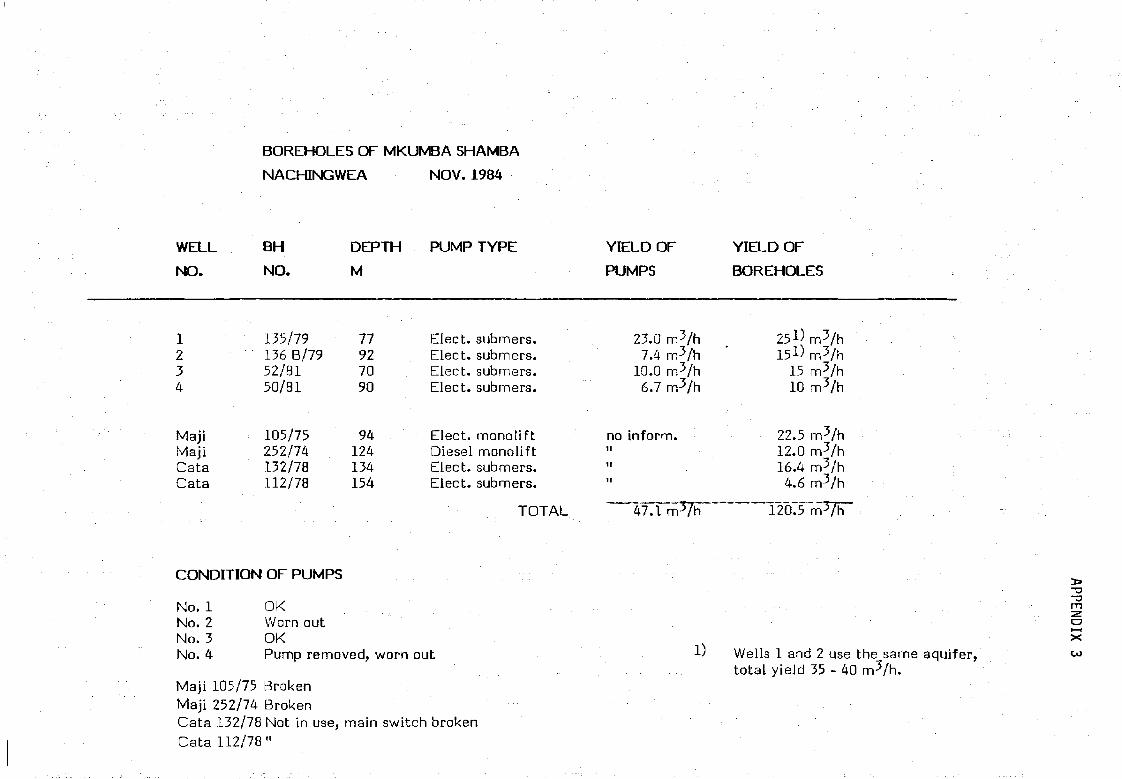
BOREHOLES OF MKUMBA SHAMBA
NACHINGWEA NOV. 1984
WELL
NO.
1234
MajiMajiCataCata
BH
NO.
135/79136 B/7952/8150/81
105/75252/74132/78112/78
DEPTH
M
77927090
94124134154
PUMP TYPE
Elect, submers.Elect, submers.Elect, submers.Elect, submers.
Elect, monoliftDiesel monoliftElect, submers.Elect, submers.
YIELD OF
PUMPS
23.0 m3/h7.4 m3/h
10.0 m3/n6.7 m3/h
no inform.i t
i t
t t
YIELD OFBOREHOLES
251>m3/h151) m3/h
15 m3/h10 m3/h
22.5 m3/h12.0 m3/h16.4 m3/h4.6 m3/h
TOTAL 47.1 rrvW 120.5
CONDITION OF PUMPS
No. 1No. 2No. 3No. 4
MajiMajiCataCata
105/75252/74132/78112/78
OK ;Worn outOKPump removed, worn out
BrokenBrokenNot in use, main switch brokenn
Wells 1 and 2 use the same aquifer,total yield 35 - 40 m3 /h.
3»-a-a
oi—(xCO
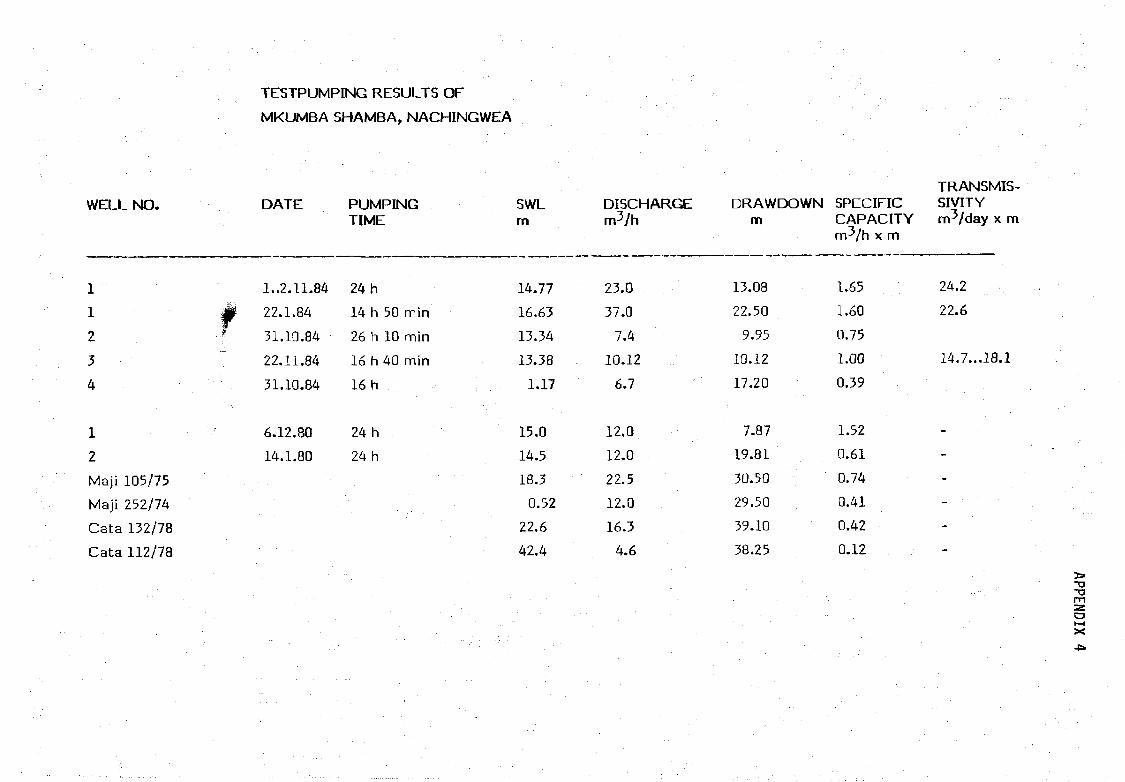
TESTPUMPING RESULTS OF
MKUMBA SHAMBA, NACHINGWEA
WELL NO. DATE
1
1
2
3
4
1
2
Maji 105/75
Maji 252/74
Cata 132/78
Cata 112/78
1..2.11.84
22.1.84
31.10.84
22.11.84
31.10.84
6.12.80
14.1.80
PUMPINGTIME
24 h
14 h 50 min
26 h 10 min
16 h 40 min
16 h
24 h
24 h
SWLm
14.77
16.63
13.34
13.38
1.17
15.0
14.5
18.3
0.52
22.6
42.4
DISCHARGEm3/h
23.0
37.0
7.4
10.12
6.7
12.0
12.0
22.5
12.0
16.3
4.6
DRAWDOWNm
13.08
22.50
9.95
10.12
17.20
7.87
19.81
30.50
29.50
39.10
38.25
SPECIFICCAPACITYm^/h x m
1.65
1.60
0.75
1.00
0.39
1.52
0.61
0.74
0.41
0.42
0.12
TRANSMIS-SIVITYm-Vday x m
24.2
22.6
14.7...18.1
-
-
-
- •
-
oX
-p.

WELLS OF MAGUMCHILA WELLFIELD, MASASI
WELL B.H.
NO. NO.
1 Ma 603
2 C309
3 Ma 601
Maji Ma 605
Cata Ma 608
DEPTH
M
PUMP TYPE
65
65
49.5
59.3
Elect, submers
Elect, submers.
Elect, submers.
Diesel monolift
YIELD OF PUMP
M3 /H
10.0
10.0
10.0
18.0
10.0
a»-o-amaxen
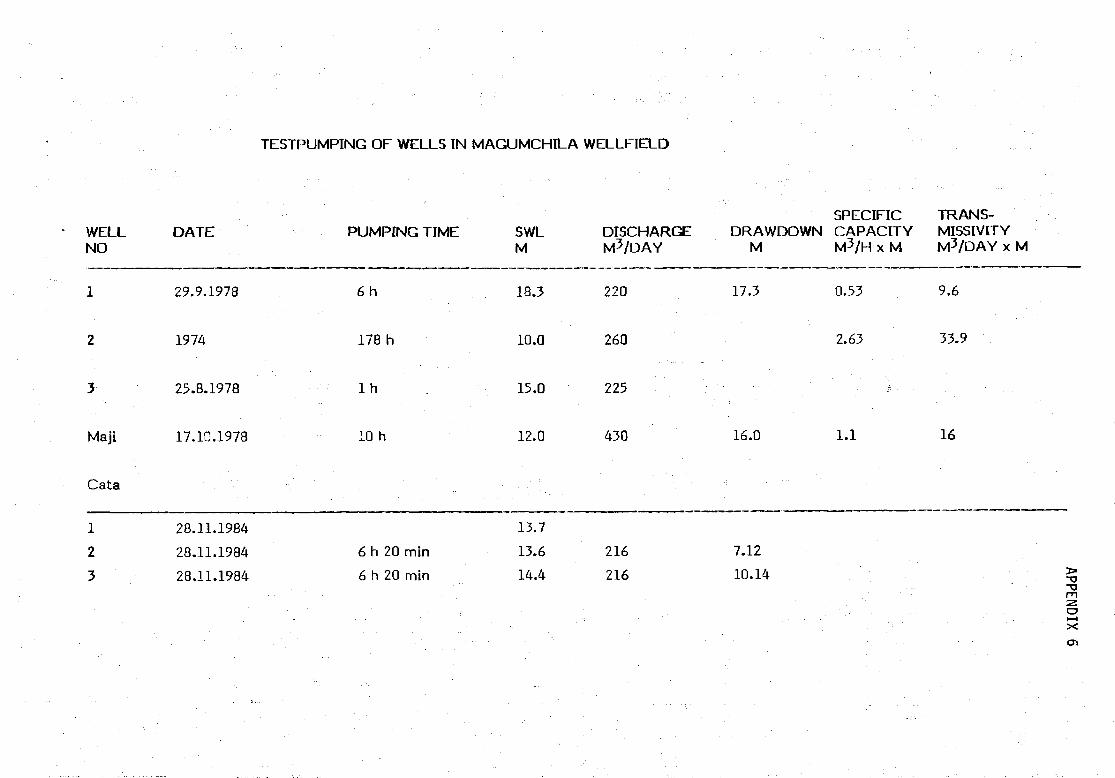
TESTPUMPING OF WELLS IN MAGUMCHILA WELLF1ELD
SPECIFIC TRANS-WELL DATE PUMPING TIME SWL DISCHARGE DRAWDOWN CAPACITY MISSIVITYNO M M3/DAY M M3/H x M M3 /DAY x M
1 29.9.1978 6 h 18.3 220 17.3 0.53 9.6
2 1974 178 h 1Q.0 260 2.63 33.9
3 25.8.1978 l h 15.0 225 ; ?
Maji 17.10.1978 10 h 12.0 430 16.0 1.1 16
C a t a - •-.' • " • . - • : • - • . . . " " ; - . : :
1
2
3
28.11.1984
28.11.1984
28.11.1984
6 h 20 min
6 h 20 min
13.7
13.6
14.4
216
216
7.12
10.14 -o-o
X