Mtp ppt soumya_sarkar
37
Introduction Objective I Objective II Conclusion Analyzing Dynamics of Interacting Multiplex Networks Soumya Sarkar M.Tech. CSE 2nd Yr Indian Institute of Technology Patna Guided By : Dr. Joydeep Chandra April 29, 2015 Soumya Sarkar M.Tech. CSE 2nd Yr MTP
-
Upload
samaraiapoc -
Category
Data & Analytics
-
view
47 -
download
0
Transcript of Mtp ppt soumya_sarkar

IntroductionObjective I
Objective IIConclusion
Analyzing Dynamics of Interacting MultiplexNetworks
Soumya Sarkar M.Tech. CSE 2nd Yr
Indian Institute of Technology Patna
Guided By : Dr. Joydeep Chandra
April 29, 2015
Soumya Sarkar M.Tech. CSE 2nd Yr MTP

IntroductionObjective I
Objective IIConclusion
Overview
IntroductionSNAMotivationProject Goals
Objective IData CollectionStructuringAnalysis
Objective IIPreprocessingPreliminary analysisFinal Analysis
Conclusion
Soumya Sarkar M.Tech. CSE 2nd Yr MTP

IntroductionObjective I
Objective IIConclusion
SNAMotivationProject Goals
Representing Entities and Relations
I Representing physical systems as networks yeilds many interesting insights
I Studying properties of the network helps us understand the system processes
I Understanding system processes has applications in building recomendersystems,in targeted advertisement,viral marketing even in drug design.
Soumya Sarkar M.Tech. CSE 2nd Yr MTP

IntroductionObjective I
Objective IIConclusion
SNAMotivationProject Goals
Drawbacks of Traditional Methods
I Traditional graph theory deals with node centric properties
I It is inadequate to give us an idea about system wide properties
I It is not sufficient to deal with graphs that represent real world networks
Soumya Sarkar M.Tech. CSE 2nd Yr MTP

IntroductionObjective I
Objective IIConclusion
SNAMotivationProject Goals
Example
Soumya Sarkar M.Tech. CSE 2nd Yr MTP

IntroductionObjective I
Objective IIConclusion
SNAMotivationProject Goals
Current Research
I In the Last decade large number of real life networks have been studied asComplex Networks
I Static properties such as Degree Distribution,Clustering Coefficient,Small WorldProperty, Assortativity etc has been studied widely.
I Dynamic properties such as Preferential Attachment,Percolation,Ressilience hasalso been topics of interest.
Soumya Sarkar M.Tech. CSE 2nd Yr MTP

IntroductionObjective I
Objective IIConclusion
SNAMotivationProject Goals
Multiplex Networks
1. Networks donot exist in isolation
2. Multiple networks function as single ecosystem
3. As an evidence when a video goes viral it happens due to collaboartion ofmultiple social network platforms.
Soumya Sarkar M.Tech. CSE 2nd Yr MTP

IntroductionObjective I
Objective IIConclusion
SNAMotivationProject Goals
Why Multiplex
I Research in multiplexnetwork is still in itsinfancy
I Many real life networkshave not been seen fromthe point of view ofmultiplex network.
I Visualizing networks asmultiplex network canhelp us analyze effect ofgrowth of one layer onanother.
Soumya Sarkar M.Tech. CSE 2nd Yr MTP

IntroductionObjective I
Objective IIConclusion
SNAMotivationProject Goals
Project objectives
1. Study Popular Social Networking Platforms like Facebook,Twitter and establishthat they behave as multiplex network via common agents.
2. Given a Mulitplex network with different topology establish that the interactionof one layer can influence dynamics in another layer.
Soumya Sarkar M.Tech. CSE 2nd Yr MTP

IntroductionObjective I
Objective IIConclusion
Data CollectionStructuringAnalysis
Seed Data Collection
I To look at social networking platforms from the point of view of multiplexnetwork we required specific real world data.
I Seed data must have valid profiles at both target platforms
I The initial challenge was collecting such a dataset using automated techniques.
Soumya Sarkar M.Tech. CSE 2nd Yr MTP

IntroductionObjective I
Objective IIConclusion
Data CollectionStructuringAnalysis
I We searched platforms which hadself indentification feature likeBlogger.com,Goolge+ .
I After collecting seed data Ivalidated them using automatedtechniques.
Soumya Sarkar M.Tech. CSE 2nd Yr MTP

IntroductionObjective I
Objective IIConclusion
Data CollectionStructuringAnalysis
Neighbourhood Exploration
I In Facebook due to the unavilability of any API browser automation toolselenium was used
I Selenium is used in junction with a headless webkit PhantomJS which simulatesa user session in Facebook.
I In case of twitter specific API’s i.e Restfull API version 1.1 are available toperform our desired task.However this API comes with rate limiting constrainthence it is necessary to stall the data collection process to synchronise it withrate liming constraint when required.
I Data obtained is simultaneously structured into a Directed Graph usingpython-igraph library and stored in disk in xml format
Soumya Sarkar M.Tech. CSE 2nd Yr MTP

IntroductionObjective I
Objective IIConclusion
Data CollectionStructuringAnalysis
Data Visualization
Figure : (a) Facebook Figure : (b) Twitter
Soumya Sarkar M.Tech. CSE 2nd Yr MTP

IntroductionObjective I
Objective IIConclusion
Data CollectionStructuringAnalysis
Matching
1. We required profile attributes to identify common entities in the neighborhoodof a user.
2. We used user name as profile attribute because it is publicly available
3. We found active nodes in the neighborhood of the seed node who were presentin both layers
4. It is established by the data collected that this different platform have logicalconnections through common nodes.
Soumya Sarkar M.Tech. CSE 2nd Yr MTP

IntroductionObjective I
Objective IIConclusion
PreprocessingPreliminary analysisFinal Analysis
1. According to our second objective we wanted to perform microscopic analysis ofa multiplex network in terms of its constituent layers
2. We want to look at a network with multiplex properties , enormous size andgrowing at a rapid rate.
3. Both coauthorship and citation network have been analysed individually but thisis the first time they are analysed together with author as dynamic entities ineither layers
Soumya Sarkar M.Tech. CSE 2nd Yr MTP

IntroductionObjective I
Objective IIConclusion
PreprocessingPreliminary analysisFinal Analysis
ArnetMiner Data Format
#*Automated Deduction for Many-Valued Logics.#@Matthias Baaz,Christian G. Fermller,Gernot Salzer#t2001#cHandbook of Automated Reasoning#index628#%71399#%71859#%71848#!
Soumya Sarkar M.Tech. CSE 2nd Yr MTP

IntroductionObjective I
Objective IIConclusion
PreprocessingPreliminary analysisFinal Analysis
Table
General Information about DataSet
Total No Of Papers 2146330Total No Of Unique Authors 1232541Average No of Authors per paper 2.726Average No of Papers per Author 4.74782Year 1930-2013
Table : 1
Soumya Sarkar M.Tech. CSE 2nd Yr MTP

IntroductionObjective I
Objective IIConclusion
PreprocessingPreliminary analysisFinal Analysis
20000
40000
60000
80000
100000
120000
140000
160000
180000
200000
220000
1990 1995 2000 2005 2010
No o
f U
niq
ue A
uth
ors
years
Unique Author
0
20000
40000
60000
80000
100000
120000
140000
160000
180000
200000
1990 1995 2000 2005 2010
Pa
pe
r C
ou
nt
Year
Soumya Sarkar M.Tech. CSE 2nd Yr MTP

IntroductionObjective I
Objective IIConclusion
PreprocessingPreliminary analysisFinal Analysis
Building Temporal Graph
1. Essential information like paper id, author name, year, citation information wereextracted from the data
2. Indexes were formed based on paper ids, author names, citing for fast retrieval.
3. Three types of Graphs were constructed from the data recording scientificproductivity and citation obtained from 1989 to 2010.
Soumya Sarkar M.Tech. CSE 2nd Yr MTP

IntroductionObjective I
Objective IIConclusion
PreprocessingPreliminary analysisFinal Analysis
1e-06
1e-05
0.0001
0.001
0.01
0.1
1
1 10 100 1000 10000
Pro
babili
ty k
Degree k
Citation NetworkCoauthorship Network
Soumya Sarkar M.Tech. CSE 2nd Yr MTP

IntroductionObjective I
Objective IIConclusion
PreprocessingPreliminary analysisFinal Analysis
I Nature of this plot show Power Law Distribution where
P(k) ∼ k−α
I Our intuition is patterns of interaction which led to this nature is notindependent
Soumya Sarkar M.Tech. CSE 2nd Yr MTP

IntroductionObjective I
Objective IIConclusion
PreprocessingPreliminary analysisFinal Analysis
0
20
40
60
80
100
1990 1995 2000 2005 2010
Avg R
ate
Year
top 3000top 100 I Nature of this plot shows the average
rate of collaboration of top 3000highly cited authors and top 100 overthe span of their career for 20 years
I We see nodes with higher productivityin one layer performs significantlybetter in the corressponding layer tooalthough eventually average rate ofproductivity becomes steady
Soumya Sarkar M.Tech. CSE 2nd Yr MTP

IntroductionObjective I
Objective IIConclusion
PreprocessingPreliminary analysisFinal Analysis
0
0.2
0.4
0.6
0.8
1
1.2
1-40 41-80 81-120 121-160 161-200 201-240
Fra
ction
Degree Range
RegularReciprocated
I It has been shown by variousresearchers that scientific network isdisassortative with respect to degree
I Using both networks we investigatedhow mixing with respect to degreecorresponds with citation network.
Soumya Sarkar M.Tech. CSE 2nd Yr MTP

IntroductionObjective I
Objective IIConclusion
PreprocessingPreliminary analysisFinal Analysis
2
4
6
8
10
12
14
16
18
1-1
0
11-2
0
21-3
0
31-4
0
41-5
0
51-6
0
61-7
0
71-8
0
81-9
0
91-1
00
101-1
10
111-1
20
121-1
30
Avera
ge C
itations
Degree Range
avg citations I Here average citations betweenresearchers of similar degree is shown
I Collaborators of higher degree refereach others work significantlycompared to collaborators of lowerdegree
Soumya Sarkar M.Tech. CSE 2nd Yr MTP

IntroductionObjective I
Objective IIConclusion
PreprocessingPreliminary analysisFinal Analysis
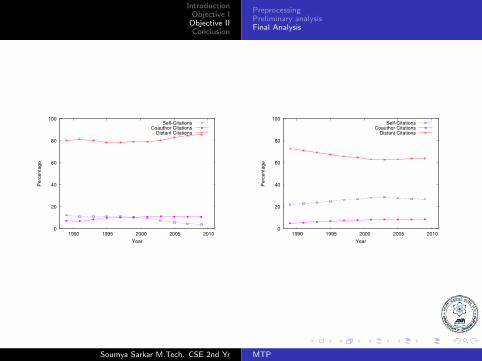
I We have divided the citation received by top cited papers into 3 categories
I Self citation, Co-author citation and Distant Citation
I In the next couple of graphs we have shown how these different citations coexistat each time instance and how top cited papers of a particular time periodrecieve these citations over a span of 10 years.
Soumya Sarkar M.Tech. CSE 2nd Yr MTP
IntroductionObjective I
Objective IIConclusion
PreprocessingPreliminary analysisFinal Analysis
0
20
40
60
80
100
1990 1995 2000 2005 2010
Perc
enta
ge
Year
Self-CitationsCoauthor Citations
Distant Citations
0
20
40
60
80
100
1990 1995 2000 2005 2010
Perc
enta
ge
Year
Self-CitationsCoauthor Citations
Distant Citations
Soumya Sarkar M.Tech. CSE 2nd Yr MTP

IntroductionObjective I
Objective IIConclusion
PreprocessingPreliminary analysisFinal Analysis
Citation Effect
I To quantify influence of citation on collaboration we have extracted top citedpapers in two different time instances and identified authors who have citedthese titles.
I We have calculated fraction of the citing authors within the 1st and 2nd hop ofthe cited authors.
I We have monitored the neighborhood of the cited authors for next 10 years andcalculated the fraction of citing authors for every 2yrs
I We notice a positive increase in the fraction of citing authors in theneighbourhood of cited authors.
Soumya Sarkar M.Tech. CSE 2nd Yr MTP

IntroductionObjective I
Objective IIConclusion
PreprocessingPreliminary analysisFinal Analysis
5
10
15
20
25
30
35
1990 1992 1994 1996 1998 2000 2002
Perc
enta
ge
Year
First HopSecond Hop
5
10
15
20
25
30
35
40
45
50
1998 2000 2002 2004 2006 2008 2010
Perc
enta
ge
Year
First HopSecond Hop
Soumya Sarkar M.Tech. CSE 2nd Yr MTP

IntroductionObjective I
Objective IIConclusion
PreprocessingPreliminary analysisFinal Analysis
Figure : t1 Figure : t2
Soumya Sarkar M.Tech. CSE 2nd Yr MTP

IntroductionObjective I
Objective IIConclusion
PreprocessingPreliminary analysisFinal Analysis
0
0.1
0.2
0.3
0.4
0.5
0.6
0.7
1 2 3 4 5 6 7 8
Fre
qu
en
cy o
f C
ite
Ba
ck
Year
citeback fraction 1. In terms of author author citationreciprocation of citation is aninteraction of considerableinterest to us.
2. Among all the reciprocation thatwe have encountered, in thisgraph I have plotted the fractionof reciprocation received withrespect to time
Soumya Sarkar M.Tech. CSE 2nd Yr MTP

IntroductionObjective I
Objective IIConclusion
PreprocessingPreliminary analysisFinal Analysis
Soumya Sarkar M.Tech. CSE 2nd Yr MTP

IntroductionObjective I
Objective IIConclusion
PreprocessingPreliminary analysisFinal Analysis
0
20000
40000
60000
80000
100000
120000
1989-2
007
1991-2
007
1993-2
007
1995-2
007
1997-2
007
1999-2
007
2001-2
007
2003-2
007
2005-2
007
Tota
l C
itebacks a
nd C
olla
bora
ted C
itebacks
Time Span
Cite BacksCollaborated Cite Backs
1. In this graph I have shown thevolume of citebacks recieved ineach time epoch and thecalculated cite backs received dueto collaboration and vice versa
Soumya Sarkar M.Tech. CSE 2nd Yr MTP

IntroductionObjective I
Objective IIConclusion
PreprocessingPreliminary analysisFinal Analysis
Community Distribution
1. One of the most interesting findings of random graph theory is the existence ofa critical probability at which a cluster forms.
2. It indicates the existence of a critical probability pc such that below pc thenetwork is composed of isolated clusters but above pc a giant cluster spans theentire network.
3. Using Fast Folding Community Finding Algorithm I have shown the communitydistribution of either layers in the following graphs
Soumya Sarkar M.Tech. CSE 2nd Yr MTP

IntroductionObjective I
Objective IIConclusion
PreprocessingPreliminary analysisFinal Analysis
0 10000 25000
0.0
00.1
00.2
0
Citation Network
Cluster Size k
p(k
)
0 10000 20000 30000
0.0
0.2
0.4
Coauthor Network
Cluster Size kp(k
)
Soumya Sarkar M.Tech. CSE 2nd Yr MTP

IntroductionObjective I
Objective IIConclusion
Conclusion and Future Work
I Results of our emperically analysis show that ensemble of networks can bevisualized as multiplex netowrk
I Given an interaction in one layer can induce link generation in another layer
I Based on this observation we plan to investigate further in the possibility ofgenerating giant component in one layer through interaction in another layer.
Soumya Sarkar M.Tech. CSE 2nd Yr MTP

IntroductionObjective I
Objective IIConclusion
References1. Predicting scientific success based on coauthorship networks Emre Sarigl, Ren Pfitzner * , Ingo Scholtes, Antonios Garas and
Frank Schweitzer
2. Jie Tang, Jing Zhang, Limin Yao, Juanzi Li, Li Zhang, and Zhong Su. ArnetMiner: Extraction and Mining of Academic Social
Networks. In Proceedings of the Fourteenth ACM SIGKDD International Conference on Knowledge Discovery and Data Mining
(SIGKDD’2008). pp.990-998
3. A.-L. Barab asi et al., Scale-free networks: a decade and beyond, science, vol. 325, no. 5939, p. 412, 2009.
4. M. E. Newman, The structure and function of complex networks, SIAM review, vol. 45, no. 2, pp. 167256, 2003.
5. J. Ugander, B. Karrer, L. Backstrom, and C. Marlow, The anatomy of the facebook social graph, arXiv preprint
arXiv:1111.4503, 2011.
6. The simultaneous evolution of author and paper networks Katy Borner, Jeegar T. Maru, and Robert L. Goldstone
7. J. Leskovec and A. Krevl, SNAP Datasets: Stanford large network dataset collection. http://snap.stanford.edu/data, June 2014.
8. M. Kivel a, A. Arenas, M. Barthelemy, J. P. Gleeson, Y. Moreno, and M. A. Porter, Multilayer networks, arXiv preprint
arXiv:1309.7233, 2013.
9. The structure of scientific collaboration networks M. E. J. Newman
10. Coauthorship and citation patterns in the Physical Review Travis Martin,* Brian Ball,Brian Karrer,and M. E. J. Newman WEB),
2010 12th International Asia-Pacific, pp. 236242, IEEE, 2010.
11. A. A. Hagberg, D. A. Schult, and P. J. Swart, Exploring network structure, dynamics, and function using NetworkX, in
Proceedings of the 7th Python in Science Conference (SciPy2008), (Pasadena, CA USA), pp. 1115, Aug. 2008.
12. M. Bastian, S. Heymann, and M. Jacomy, Gephi: An open source software for ex- ploring and manipulating networks, 2009.
13. Modes of Collaboration in Modern Science Beyond Power Laws and Preferential Attachment Stasa Milojevic
14. Persistence and uncertainty in the academic career Alexander M. Petersen a,1 , Massimo Riccaboni b,c,d , H. Eugene Stanley
e,1 , and Fabio Pammolli
15. Reputation and Impact in Academic Careers Alexander M. Petersen, Santo Fortunato,Raj K. Pan,Kimmo Kaski,Orion
Penner,Armando Rungi,Massimo Riccaboni,H. Eugene Stanley,and Fabio Pammolli
16. Citation interactions among computer science fields: a quantitative route to the rise and fall of scientific research Tanmoy
Chakraborty,Sandipan Sikdar,Niloy Ganguly,Animesh Mukherjee
Soumya Sarkar M.Tech. CSE 2nd Yr MTP

IntroductionObjective I
Objective IIConclusion
Thank You
Soumya Sarkar M.Tech. CSE 2nd Yr MTP