MTN Nigeria · future plans, events or performance and potential for future growth; liquidity,...
52
MTN Nigeria Q1 2019 Analyst Presentation May13, 2019
Transcript of MTN Nigeria · future plans, events or performance and potential for future growth; liquidity,...

MTN NigeriaQ1 2019 Analyst Presentation
May13, 2019
Disclaimer
2
MTN Company
Group tion, any question or answer session and any written or oral material
discussed or distributed during the presentation meeting or otherwise in connection with it.
made available to you in connection with the presentation may be passed
on, copied, reproduced, in whole or in part, or otherwise disseminated, directly or indirectly, to any other person. Neither this document nor the meeting at which it is presented constitute a
recommendation regarding any loans or securities of the Company or any of its subsidiaries or joint venture companies.
This presentation is not, and should not be construed as, a prospectus, is not intended for potential investors and does not constitute or form part of, and should not be construed as an offer or the
solicitation of an offer to subscribe for or purchase securities of the Company, and nothing contained therein shall form the basis of or be relied on in connection with any contract or commitment
whatsoever, in particular, it must not be used in making any investment decision. Any decision to purchase securities in any offering should be made solely on the basis of information contained in any
prospectus or offering circular that may be published by the Company in final form in relation to any proposed offering.
This document and its contents may not be viewed by persons within the United States (within the meaning of Regulation S under t
ted by law and persons into whose possession this Presentation comes
should inform themselves about, and observe, any such restrictions. Any securities referred to herein have not been, and will not be, registered under the United States Securities Act of 1933 (the
pe
defined in Rule 144A under the Securities Act or another exemption from, or in transactions not subject to, the registration requirements of the Securities Act.
This presentation speaks as of the date hereof and has not been independently verified and no representation, warranty, or undertaking, express or implied, is made by MTN, the Company, its
shareholders or any of their respective affiliates, directors, officers, employees or agents as to the fairness, accuracy, completeness or correctness of the information or the opinions contained in this
document or provided at the presentation. No reliance should be placed on the accuracy, completeness or fairness of such information or opinions for any purpose whatsoever, including but not
limited to any investment considerations. To the fullest extent permitted by law, none of MTN, the Company, its shareholders or any of their respective advisors, representatives, affiliates, directors,
officers, employees or agents shall have any responsibility or liability whatsoever (in negligence or otherwise) for any loss howsoever arising from any use of this document or its contents, or from any
use of any information provided at the presentation or otherwise arising in connection with this document or the presentation at which it was presented. No reliance should be placed on any
communication (written or oral) as investment advice or as a recommendation regarding any loans or securities of the Company or any of its subsidiaries or joint venture companies.
3
Disclaimer | continued
The presentation includes market share and industry data obtained by MTN and the Company from industry publications and surveys and internal surveys. MTN and the Company may not have access
to the facts and assumptions underlying the numerical data, market data and other information extracted from publicly available sources. As a result, none of MTN, the Company, its shareholders, or
any of its or their respective advisors, representatives, affiliates, directors, officers, employees or agents are able to verify such numerical data, market data and other information and assume no
responsibility for the correctness of any market share or industry data or other information included in this document or provided at the presentation. Accordingly, undue reliance should not be placed
on any of the industry, market or competitive position data contained in this presentation. All information in this document and provided at the presentation is subject to update, revision, verification,
correction, completion, amendment and may change materially. Neither MTN and the Company nor any of its advisers, representatives, affiliates, directors, officers, employees or agents undertake
any obligation to amend, correct or to provide the recipient with access to any additional information or to update this document or any information provided at the presentation or to correct any
inaccuracies in any such information.
Matters discussed in this document, at the presentation and any materials distributed in connection with the presentation may constitute or include forward-looking statements. Forward-looking
pat
expressions. These forward-
of operations, financial condition, liquidity, prospects, growth and strategies. Forward-looking statements include statements regarding: objectives, goals, strategies, outlook and growth prospects;
future plans, events or performance and potential for future growth; liquidity, capital resources and capital expenditures; economic outlook and industry trends; developments of MTN and the
-looking statements involve risks and uncertainties because they relate to
events and depend on circumstances that may or may not occur in the future. The forward-looking statements in this document and the presentation are based upon various assumptions, many of
ati
those of its affiliates) and other data available from third parties. Although MTN and the Company believes that these assumptions were reasonable when made, these assumptions are inherently
subject to significant known and unknown risks, uncertainties, contingencies and other important factors which are difficult or impossible to predict and are beyond its control. Forward-looking
statements are not guarantees of future performance and such risks, uncertainties, contingencies and other important factors could cause the actual results of operations, financial condition and
liquidity of MTN and the Company and its affiliates or the industry to differ materially from those results expressed or implied in this document or the presentation by such forward-looking statements.
No representation is made that any of these forward-looking statements or forecasts will come to pass or that any forecast result will be achieved. Forward-looking statements speak as of the date of
this presentation and no one undertakes to release any update or revision of any such forward-looking statement, whether as a result of new information, future events or otherwise. Undue reliance
should not be placed on any forward-looking statement. No statement in this presentation is intended to be nor may be construed as a profit forecast. Past performance is not indicative of future
results.
By attending the presentation and/or accepting a copy of this document, you agree to be bound by the foregoing limitations and conditions and, in particular, will be taken to have represented,
warranted and undertaken that (i) you are a person to whom this presentation and the information contained in it may lawfully be communicated; (ii) you have read and agree to comply with the
contents of this notice; and (iii) you will not at any time have any discussion, correspondence or contact concerning the information in this document with any of the directors or employees of MTN and
the Company or its subsidiaries nor with any of their suppliers in respect of MTN and the Company or its subsidiaries without the prior written consent of MTN and the Company.

4
Agenda
Time Minutes Agenda Presenter Page No.
08:30-09:00 30 Tea & Coffee All
09:00-09:15 15 Welcome and introduction of Speakers Ferdi Moolman 5
09:15-09:30 15 Strong position in the right market Ferdi Moolman 12
09:30-10:00 30 Exciting demographic opportunity Ferdi Moolman 16
10:00-10:15 15 Corporate Governance & Regulation Tobechukwu Okigbo 23
10:15-10:30 15 Technology & Network Excellence Mohammed Rufai 26
10:30-11:00 30 Attractive return profile Adekunle Awobodu 29
11:00-11:30 30 Well positioned for the long term Mazen Mroue 41
11:30-12:00 30 Q & A Speakers 51
12:00-12:05 5 Closing remarks Mazen Mroue
12.05-13.05 60 Lunch All

Welcome and Introduction of Speakers

6
| leading mobile operator in Nigeria
Largest mobile
operator in Nigeria
#1 player in Nigerian telecoms market since launch
60.3 millionsubscribers
50% market share by
revenue
Strong management with mix of local &
international expertise
Wide range of spectrum holding
Strong partner ecosystem
Largest distribution network
Source: Pyramid
Largest fibre network coverage
>25,800km
MTNN benefits from strong support and
unmatched expertise of MTN Group,
complemented by highly experiencedBoard of Directors
20.4 millionactive data users

2016
Visafone acquisition
Achieved highest NPS (MTNN)
MTNN obtained 2.6GHz spectrum
Launch of 4G service in Lagos, Abuja andPort Harcourt
NCC fine resolution
VAS optimisation
7
Milestones | #1 player in the Nigerian telecoms market since launch
2005
Launched fibre network
2006
Reached over 10m subs
2007
3G spectrum obtained
AwardedUnified Licence
2010
Commissioned one of thelargest network switching centres in Africa
2014
Sold 9k towersto IHS driving operational improvements
Launched MFS
Yellow &
2013
Reached over 50m subs
MTN declared dominant player in mobile voice and upstream segment markets
2015
Acquired 700MHz spectrum from National Broadcasting Commission (NBC)
Launch ofMTN Music+
5.2m subs disconnected due to improperly registered sims
2001
1st call onMTNN network
2003
Reached over 1m subs
2004
Established MTNN Foundation
2017
Modernisedsubs definition
Launch of customerVAS subscription self-management service
21
3
2018
Obtained Super Agent approval-in-principle
2019
Transfer of 800MHz acquired from Visafone
Became a public company

8
Enabling over 1 Billion
rapid & expedient transactions via
USSD in 2018
Supporting financial infrastructure
50,000+ATM & POS for
electronic payments
Over 4,000corporate branches and offices across
FSI, FMCG and O&G Services connected
Carrier of carriers to
100+ ISPs,
Carriers & ICT Resellers
25,800 km of fibre optics backbone.
Connecting 850+ Large Corporates,
100+ Public Sector &
800,000+Small businesses
with greater reach & efficiency
Over 12,000Vehicles (~3.5k
Corporate and ~8.5k SMEs) subscribed to
fleet & vehicle tracking services
Over 100Universities,
Polytechnic and Colleges (Private &
Public) accessing high capacity Internet
Source: Company information
20 Million Nigerians live in
places where MTN is the sole provider of
communication
Each month, over 16million people with no airtime connect with their friends and families using MTN Borrow Me Credit
Responsibility | enabling broader economic & social development
Invested over
N20 billion in
various Corporate Social Investments in
Nigeria
8

9
Management Team | balanced structure with versatile team
Chief Executive OfficerFerdi MoolmanJoined MTN: 2001Years of telco experience: 18
Company SecretaryUto UkpanahJoined MTN: 2005Years of telco experience: 14
Executive Corporate RelationsTobechukwu OkigboJoined MTN: 2017Years of telco experience: 13
Chief Risk & Compliance /Internal AuditCyril IIokJoined MTN: 2002Years of telco experience: 17
Chief Finance OfficerAdekunle AwoboduJoined MTN: 2002Years of telco experience: 15
Chief Operating OfficerMazen Mroue
Joined MTN: 1998Years of telco experience: 21
Executive: Human Resources Esther AkinnukaweJoined MTN: 2012Years of telco experience: 7
• Combined telco experience of over 200 years
• Broad geographical industry experience
• Played decision-making roles across broad geographies external to MTN Group
• Substantial breadth and depth of experience in various areas including stakeholder management, internal consulting, risk management, analytics and digital
• Direct crises management experience, while maintaining growth and improved profitability
• Good mix of local and international expertise
Randy Bikraj
Chief Information Officer
16 years at MTN
Adekunle Adebiyi
Exec, Sales and Distribution
7 years at MTNN
Mohammed Rufai
Chief Technical Officer
16 years at MTN
Kolawole Oyeyemi
General GM, Customer Experience
17 years at MTN
Lynda Saint-Nwafor
Chief Enterprise Business Officer
17 years at MTN
Rahul De
Chief Marketing Officer
8 years at MTN
Ugonwa Nwoye
Executive, Customer Services
16 years at MTN
Olubayo Adekanmbi
Executive, Transformation Office
8 years at MTN
Usoro Usoro
GM, Mobile Financial Services
7 years with MTN
TBA
Chief Digital Officer
Experienced team with focus onemerging and future business
Direct report to COODirect report to CEO
Introduced to focus on governance, effective stakeholder management and operational focus in times of crises
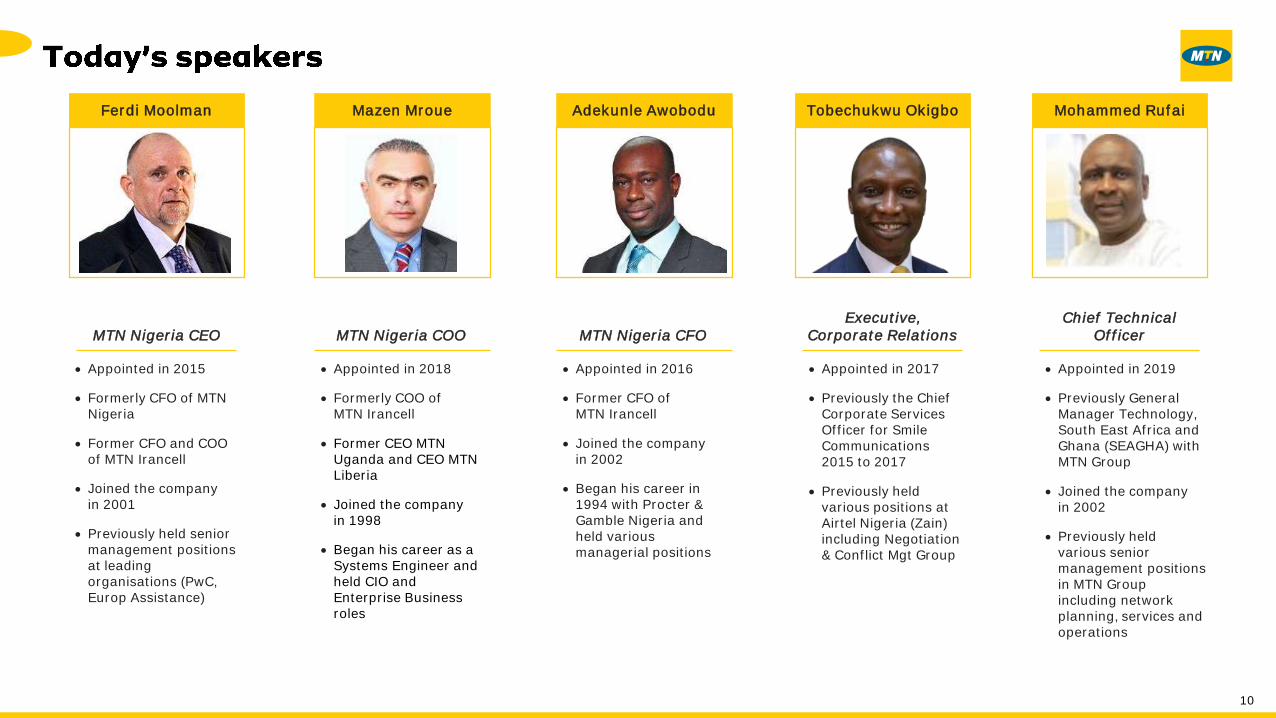
Appointed in 2015
Formerly CFO of MTN Nigeria
Former CFO and COO of MTN Irancell
Joined the company in 2001
Previously held senior management positions at leading organisations (PwC, Europ Assistance)
Ferdi Moolman
MTN Nigeria CEO
Appointed in 2017
Previously the Chief Corporate Services Officer for Smile Communications2015 to 2017
Previously held various positions at Airtel Nigeria (Zain) including Negotiation & Conflict Mgt Group
Tobechukwu Okigbo
Executive,Corporate Relations
Appointed in 2019
Previously General Manager Technology, South East Africa and Ghana (SEAGHA) with MTN Group
Joined the company in 2002
Previously held various senior management positions in MTN Group including network planning, services and operations
Mohammed Rufai
Chief Technical Officer
10
Appointed in 2016
Former CFO ofMTN Irancell
Joined the company in 2002
Began his career in 1994 with Procter & Gamble Nigeria and held various managerial positions
Adekunle Awobodu
MTN Nigeria CFO
Appointed in 2018
Formerly COO ofMTN Irancell
Former CEO MTN Uganda and CEO MTN Liberia
Joined the company in 1998
Began his career as a Systems Engineer and held CIO and Enterprise Business roles
Mazen Mroue
MTN Nigeria COO

11
MTN investment case
• Largest African economy
• Largest telecoms market in Africa
• Leading mobile network
• Most populous African country and 7th largest globally
• Fast growing youthful population
• Low data, fintech and digital penetration
• About 99.6 million bankable adults with 36.9 million unbanked1
• Demographics drive revenue
• Efficiencies improve margins
• Smart capex moderates investment
• Positive momentum with accelerating growth and performance improvement
• Wide range of spectrum holdings
• Largest fibre networks in Nigeria
• Sustainable leverage
• Strong and experienced management with track record of success
Strongposition in the right
market
Excitingdemographic opportunity
Attractive return profile
Well positionedfor the long term
Clear strategy
1Source: Enhancing Financial Inclusion & Access (EFInA) 2018 Report

Strongposition in the right market

13
Strong position in the right market | largest African economy & telecoms market
1,4191,366
329269
212 204 200
11058
China India USA Indonesia Brazil Pakistan Nigeria Ehiopia SA
Nigeria is the largest African economy with one of the youngest populations.
(Mobile Subscribers in millions, 2018A)(2)
Further c.2.8% p.a. real GDP growth expected until 2022(1)
Oil price recovery and FX flexibility expected to improve macro stability
Largest African market with c.163m subscribers
Great upside potential for penetration growth
Population growth of c.5.6m people p.a.(1) projected until 2022
Growing population density and urbanisation
Youth is a key growth driver of mobile and ICT technologies
A growing and increasingly sophisticated middleclass
(Median Age, Years)
(Population in Millions, 2018A) Source: Worldometers(GDP in US$bn, 2018A)(2) Source: World Bank
#1
423368
249175
118
Nigeria South Africa Egypt Algeria Morocco
163
92 100 69
50
Nigeria Egypt South Africa Ethiopia Algeria
South Africa
NigeriaUSAChina India Indonesia Brazil Pakistan Ethiopia
81% 93% 173% 63% 122%
Penetration
Largest African Economy Most Populous African Country and 7th Largest Globally
Largest Telecoms Market in Africa One of the Youngest Population in Africa and Globally
Nigeria EgyptSouth Africa Algeria Morocco
Nigeria Egypt South Africa Ethiopia Algeria
Source: World Bank, Worldometers, Pyramid, EIU, CIA Factbook.
Notes: (1) Based on EIU estimates. (2) Top 5 African countries ranked by total GDP.
18.327.4
19.4
43.630.6
Nigeria South Africa Africa Average Western
Europe
Average
Global Average
14
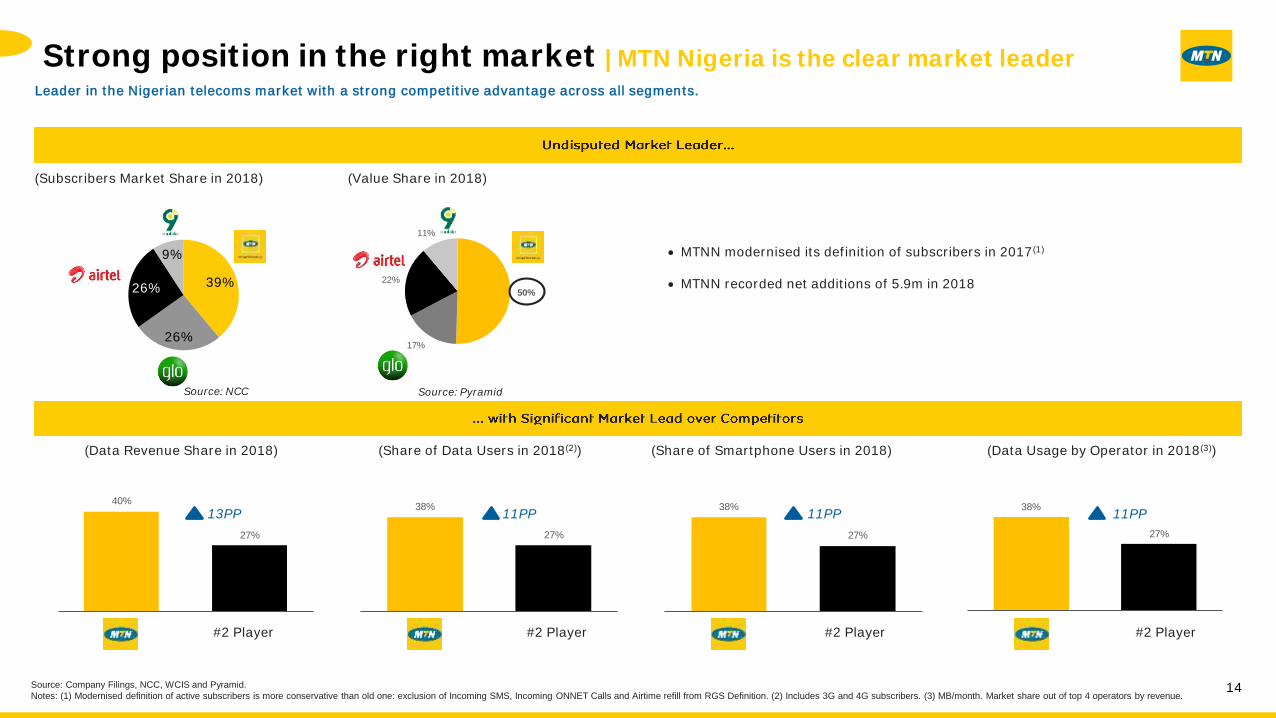
Strong position in the right market | MTN Nigeria is the clear market leader
38%
27%
38%
27%
40%
27%
Leader in the Nigerian telecoms market with a strong competitive advantage across all segments.
(Subscribers Market Share in 2018) (Value Share in 2018)
(Data Revenue Share in 2018) (Share of Data Users in 2018(2))
MTNN modernised its definition of subscribers in 2017(1)
MTNN recorded net additions of 5.9m in 2018
(Share of Smartphone Users in 2018) (Data Usage by Operator in 2018(3))
13PP 11PP 11PP 11PP38%
27%
#2 Player #2 Player #2 Player #2 Player
50%
17%
22%
11%
Source: Company Filings, NCC, WCIS and Pyramid.
Notes: (1) Modernised definition of active subscribers is more conservative than old one: exclusion of Incoming SMS, Incoming ONNET Calls and Airtime refill from RGS Definition. (2) Includes 3G and 4G subscribers. (3) MB/month. Market share out of top 4 operators by revenue.
39%
26%
26%
9%
Source: PyramidSource: NCC
15
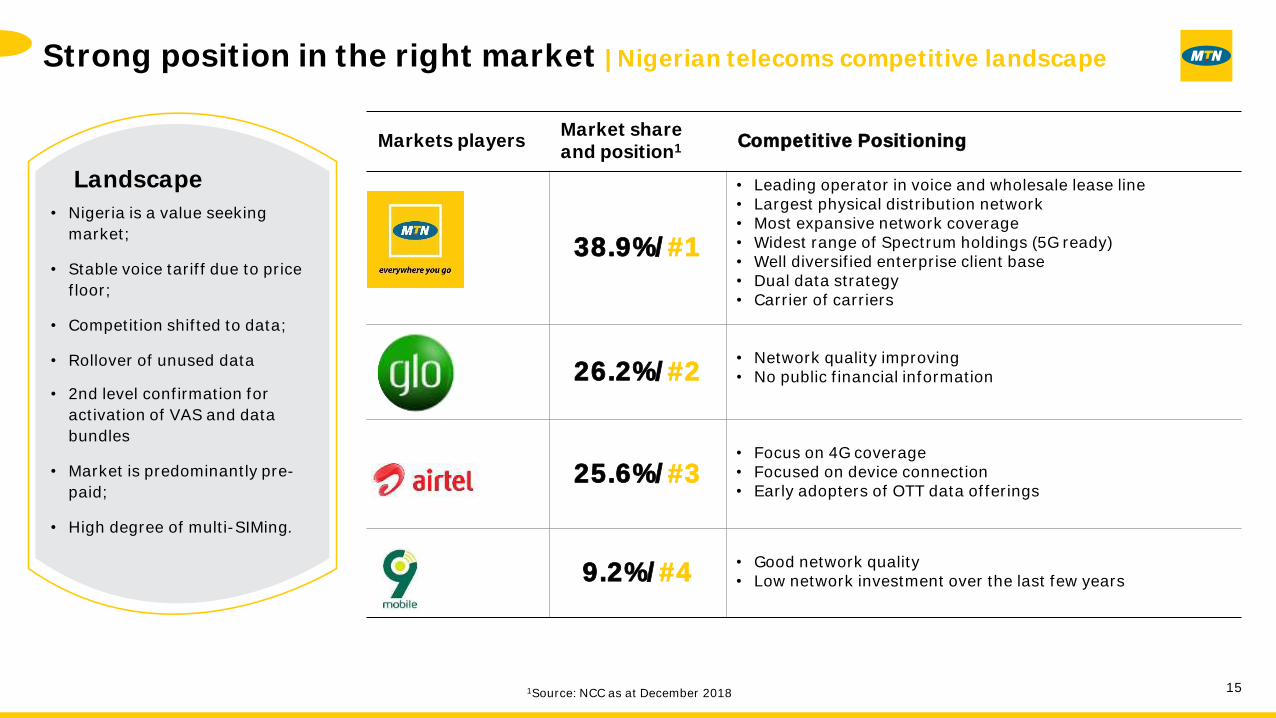
Strong position in the right market | Nigerian telecoms competitive landscape
Landscape
• Nigeria is a value seeking
market;
• Stable voice tariff due to price
floor;
• Competition shifted to data;
• Rollover of unused data
• 2nd level confirmation for
activation of VAS and data
bundles
• Market is predominantly pre-
paid;
• High degree of multi-SIMing.
Markets playersMarket share and position1 Competitive Positioning
38.9%/#1
• Leading operator in voice and wholesale lease line• Largest physical distribution network• Most expansive network coverage• Widest range of Spectrum holdings (5G ready)• Well diversified enterprise client base• Dual data strategy• Carrier of carriers
26.2%/#2• Network quality improving• No public financial information
25.6%/#3• Focus on 4G coverage• Focused on device connection• Early adopters of OTT data offerings
9.2%/#4• Good network quality• Low network investment over the last few years
1Source: NCC as at December 2018

Excitingdemographic opportunity

77.7% 78.8% 91.8%
2014A 2018A 2023E 2018A
-
50,000
100,000
150,000
200,000
250,000
40.0% 60.0% 80.0% 100.0% 120.0% 140.0% 160.0% 180.0% 200.0%Mobile Penetration (%)
3.1% 3.0%
1.5%
0.5%
2.1% 2.0%
0.9%
0.3%
17
Exciting demographic opportunity | young population & mobile penetration upside
Median Age 173%
144%
95%
Nigeria Mobile Penetration
WE
Actual penetration in Nigeria after elimination of multiple SIMs is much lower
Mexico
Egypt
Kenya
Colombia
Algeria
Israel
Jordan
Belgium
Saudi Arabia
France
MoroccoSpain
Germany
South Africa
Nigeria 2023E
Nigeria 2018A
Size of bubble represents number of subscribers
Nigeria 2014A
139m Subs
202m Subs
Historical (13A-18A CAGR) Forecast (18A-23E CAGR)
c.26 million population increase in 5 years
S. Africa
Kenya
South Africa
18 20 27 44
Source: Pyramid, CIA Factbook, Worldometers.Notes: (1) Based on pyramid Countries include Belgium, France, Germany and Spain (as opposed to full Western Europe). (2) Pyramid estimate. (3) Data as of 2018A.
(4) Mobile penetration and Subscribers for all countries is 2018A based.
Source: Pyramid
(4)
(3)
WE WE
Nigeria Kenya Nigeria Kenya S. Africa
156m Subs
• Low mobile penetration vs. African peers
• 47m new mobile subscribers expected by 2023(2)
(1)
Source: CIA Factbook, Worldometers, EIU

18
Exciting demographic opportunity | penetration growth driven by rural expansion
and data access, which creates significant opportunities for growth
Source: World Bank, Worldometers, Company Data.Notes: (1) Based on modernised definition of active subscriber.
Source: Company Data
Source: Company Data
Source: World Bank, Worldometers
Mobile Subs: 60.3mTotal Population: 200m
Breakdown of Nigerian Population Breakdown of MTNN Mobile Subs(1)
Breakdown of MTNN Data Subs
Total Data Subs: 49.9m
Urban
75%
Urban47%
Rural
53%
25%
Rural
24%
Rural
Urban
76%
48%
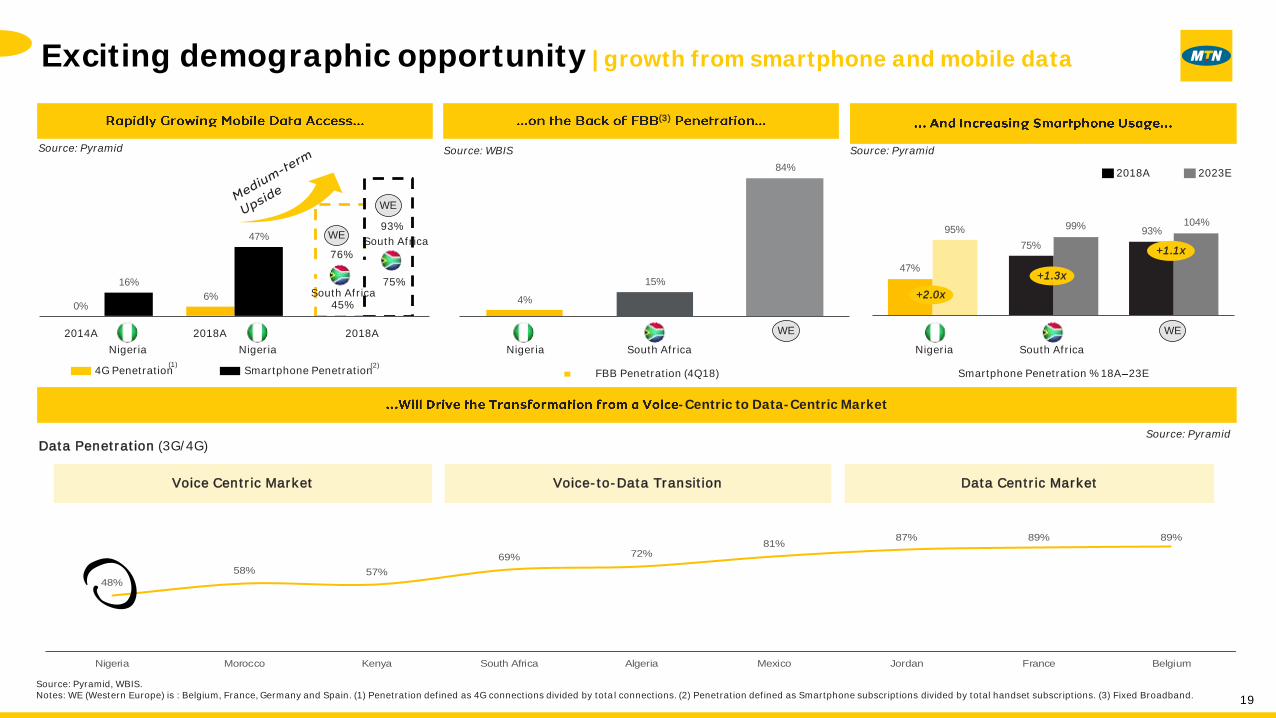
58% 57%
69% 72%81%
87% 89% 89%
Nigeria Morocco Kenya South Africa Algeria Mexico Jordan France Belgium
0%6%
16%
47%
19
Exciting demographic opportunity | growth from smartphone and mobile data
FBB Penetration (4Q18)
Data Penetration (3G/4G)
(3)
-Centric to Data-Centric Market
Voice Centric Market Voice-to-Data Transition Data Centric Market
Source: Pyramid, WBIS. Notes: WE (Western Europe) is : Belgium, France, Germany and Spain. (1) Penetration defined as 4G connections divided by total connections. (2) Penetration defined as Smartphone subscriptions divided by total handset subscriptions. (3) Fixed Broadband.
Source: Pyramid Source: WBIS
(1) (2)
75%
93%
WE
4G Penetration Smartphone Penetration
2014A 2018A
47%
75%
93%95% 99% 104%
4%
15%
84%
2018A
76%
45%
WE
Nigeria Nigeria
South Africa
South Africa
Nigeria South Africa
WE
Smartphone Penetration % 18A 23E
Source: Pyramid
2023E2018A
+2.0x
+1.3x
Nigeria South Africa
+1.1x
WE
Source: Pyramid

26%
52% 53% 52%
250
844
1,803
14.8 14.917.2 18.7 20.4
Q1 18 Q2 18 Q3 18 Q4 18 Q1 19
22.6 24.0 23.3 25.229.6
Q1 18 Q2 18 Q3 18 Q4 18 Q1 19
20
Exciting demographic opportunity | expected data usage and revenue growth
Data Revenue ContributionData Usage per User
Active Data Users(2)
Data Revenue Contribution(1)
(2G/3G/4G)Data Usage per User(1)
(MB per Month)
Nigeria (2023E)
+26 p.p.CAGR 2018A 2023E: +48%
Source: Pyramid, Company information.Notes: WE (Western Europe) is comprised of: Belgium, France, Germany and Spain. (1) As of 2018A. (2) Data subs with usage > 5 Megabytes per month. (3) Incidental users: usage between 0MB and 5MB per month. Dormant users: Data subs with no usage in last 90 days.
Nigeria South Africa Nigeria(2023E)
Incidental / Dormant Users(3)
Source: PyramidSource: Pyramid
WEWE
(Millions) (Millions)Potential to convert to
active data users
Source: Company Data Source: Company Data
NigeriaSouth Africa
2,954

21
Exciting demographic opportunity | Fintech and digital present a key opportunity
Source: Enhancing Financial Inclusion & Access (EFInA) 2018 Report, Central Bank of Nigeria.Note: (1) Source: Google Consumer Barometer, January 2018. 80% represents the % of population that believes new technologies offer more opportunities than risks.
Low Penetration of Banking Services
Mobile leapfrogging a number of traditional industries
Strong growth potential of Fintech / Digital content and services
Growth Potentialthrough
Fintech andDigital
+ =#1 in Digital
OptimismGlobally(1)
62.7m
Banked Population
36.9m
Unbanked/UnderservedPopulation
99.6mAddressable Market (Adult Population)
22
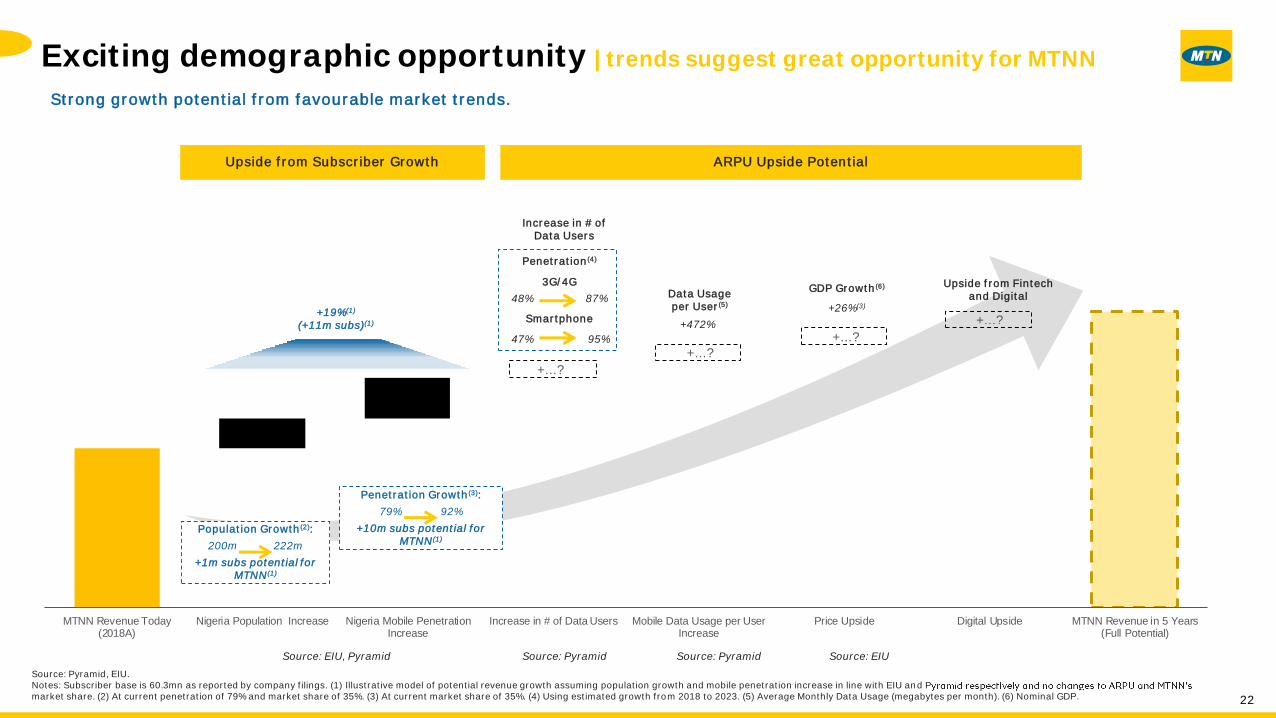
Exciting demographic opportunity | trends suggest great opportunity for MTNN
MTNN Revenue Today(2018A)
Nigeria Population Increase Nigeria Mobile PenetrationIncrease
Increase in # of Data Users Mobile Data Usage per UserIncrease
Price Upside Digital Upside MTNN Revenue in 5 Years(Full Potential)
+...?
+...?
+...?
+...?
Upside from Subscriber Growth ARPU Upside Potential
47% 95%
Data Usageper User(5)
+472%
Upside from Fintech and Digital
GDP Growth(6)
+26%(3)
Penetration(4)
3G/4G
Smartphone
48% 87%
Penetration Growth(3):
79% 92%
+10m subs potential for MTNN(1)
Increase in # of Data Users
Source: PyramidSource: EIU, Pyramid Source: EIUSource: Pyramid
Strong growth potential from favourable market trends.
Population Growth(2):
200m 222m
+1m subs potential for MTNN(1)
+19%(1)
(+11m subs)(1)
Source: Pyramid, EIU.Notes: Subscriber base is 60.3mn as reported by company filings. (1) Illustrative model of potential revenue growth assuming population growth and mobile penetration increase in line with EIU and Pmarket share. (2) At current penetration of 79% and market share of 35%. (3) At current market share of 35%. (4) Using estimated growth from 2018 to 2023. (5) Average Monthly Data Usage (megabytes per month). (6) Nominal GDP.

Corporate Governance & Regulation
24
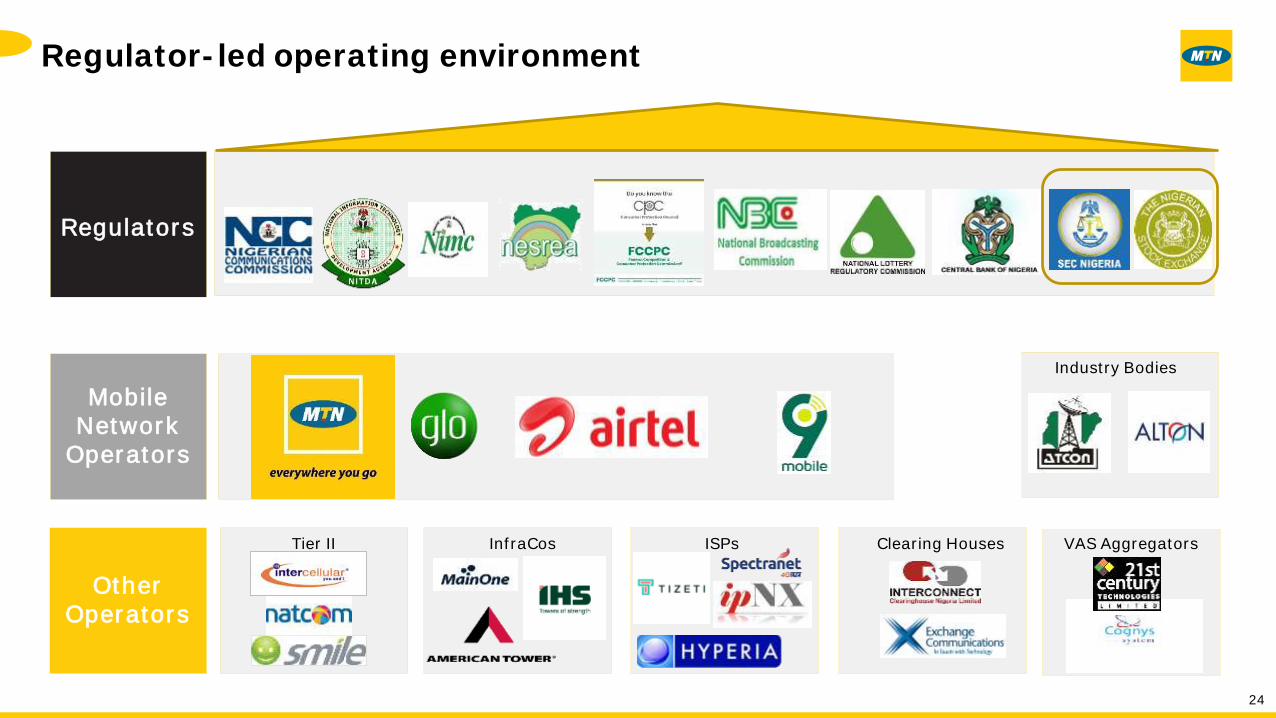
Regulator-led operating environment
Regulators
Mobile Network
Operators
Other Operators
Industry Bodies
Tier II InfraCos ISPs Clearing Houses VAS Aggregators
Regulatory developments
25
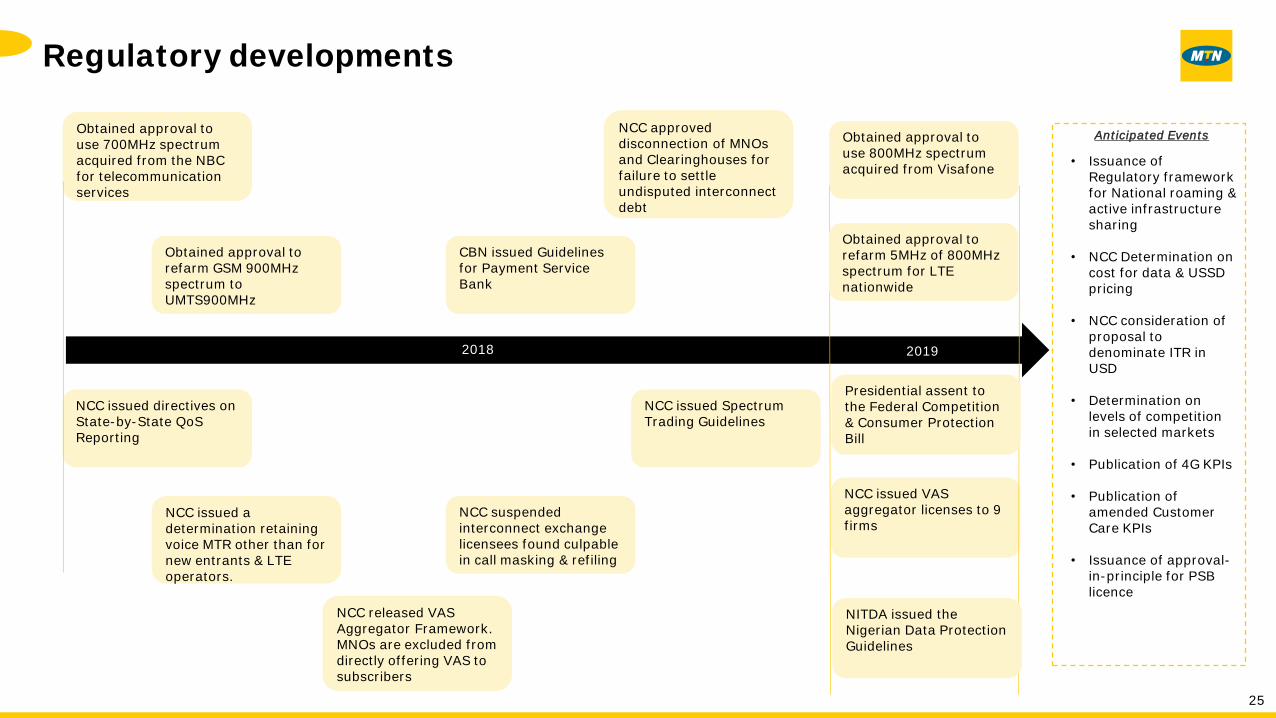
Obtained approval to use 700MHz spectrum acquired from the NBC for telecommunication services
Obtained approval to refarm GSM 900MHz spectrum to UMTS900MHz
CBN issued Guidelines for Payment Service Bank
Obtained approval to use 800MHz spectrum acquired from Visafone
NCC issued directives on State-by-State QoSReporting
NCC issued a determination retaining voice MTR other than for new entrants & LTE operators.
NCC issued VAS aggregator licenses to 9 firms
NCC suspended interconnect exchange licensees found culpable in call masking & refiling
NCC approved disconnection of MNOs and Clearinghouses for failure to settle undisputed interconnect debt
2018 2019
Anticipated Events
• Issuance of Regulatory framework for National roaming & active infrastructure sharing
• NCC Determination on cost for data & USSD pricing
• NCC consideration of proposal to denominate ITR in USD
• Determination on levels of competition in selected markets
• Publication of 4G KPIs
• Publication of amended Customer Care KPIs
• Issuance of approval-in-principle for PSB licence
Obtained approval to refarm 5MHz of 800MHz spectrum for LTE nationwide
NCC issued Spectrum Trading Guidelines
NCC released VAS Aggregator Framework. MNOs are excluded from directly offering VAS to subscribers
Presidential assent to the Federal Competition & Consumer Protection Bill
NITDA issued the Nigerian Data Protection Guidelines

Technology & Network Excellence
27
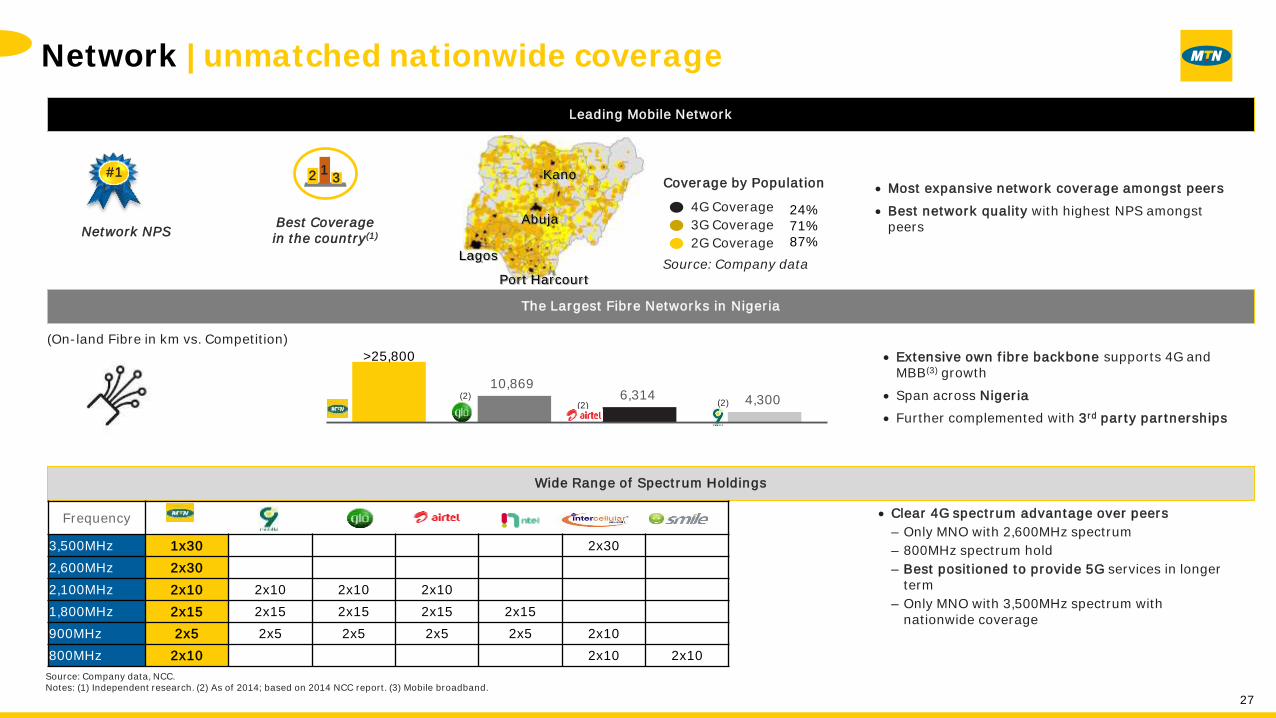
Network | unmatched nationwide coverage
Leading Mobile Network
The Largest Fibre Networks in Nigeria
Wide Range of Spectrum Holdings
Coverage by Population
4G Coverage
3G Coverage
2G Coverage
#1
Best Coveragein the country(1)
2 13
Source: Company data
(On-land Fibre in km vs. Competition)
24%71%87%
Network NPS
(2)(2)(2)
>25,800
10,8696,314 4,300
MTNN Globalcom Airtel 9Mobile
Source: Company data, NCC.Notes: (1) Independent research. (2) As of 2014; based on 2014 NCC report. (3) Mobile broadband.
Most expansive network coverage amongst peers
Best network quality with highest NPS amongst peers
Extensive own fibre backbone supports 4G and MBB(3) growth
Span across Nigeria
Further complemented with 3rd party partnerships
Clear 4G spectrum advantage over peers
– Only MNO with 2,600MHz spectrum
– 800MHz spectrum hold
– Best positioned to provide 5G services in longer term
– Only MNO with 3,500MHz spectrum with nationwide coverage
Kano
Abuja
Port Harcourt
Lagos
Frequency
3,500MHz 1x30 2x30
2,600MHz 2x30
2,100MHz 2x10 2x10 2x10 2x10
1,800MHz 2x15 2x15 2x15 2x15 2x15
900MHz 2x5 2x5 2x5 2x5 2x5 2x10
800MHz 2x10 2x10 2x10
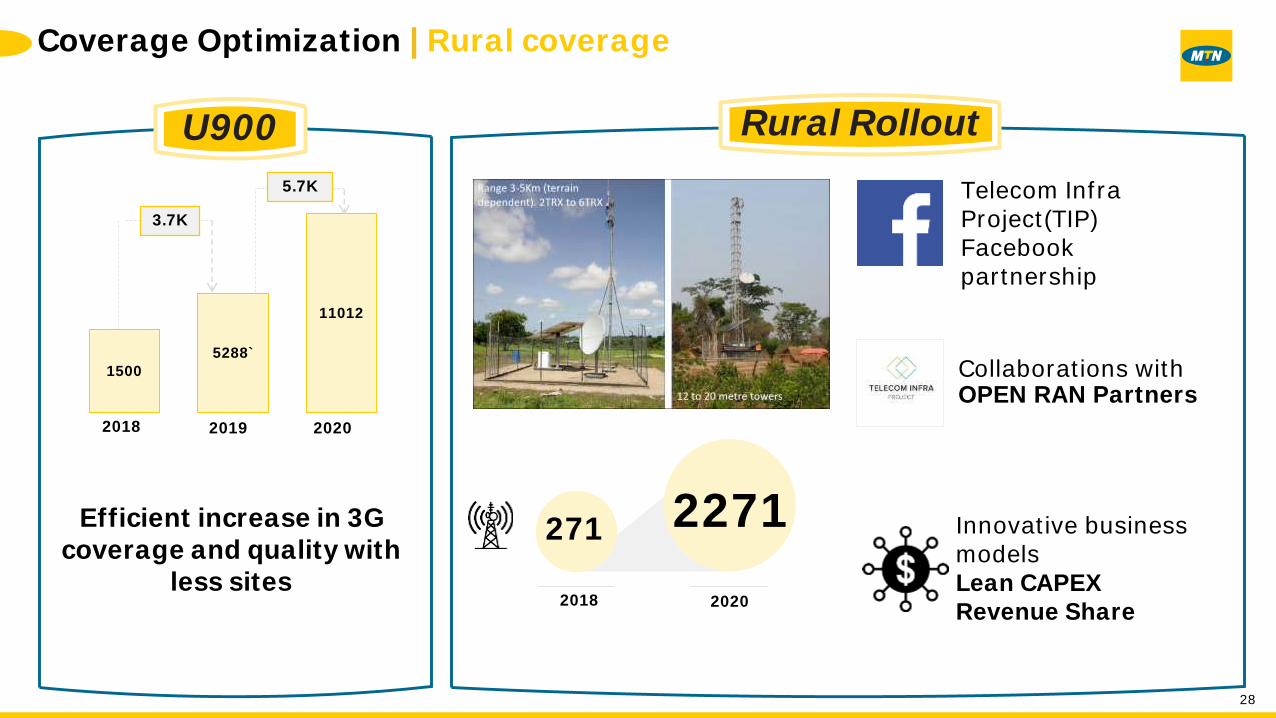
U900 Rural Rollout
Telecom Infra Project(TIP) Facebook partnership
Collaborations with OPEN RAN Partners
Innovative business models Lean CAPEX Revenue Share
271 2271
2018 2020
15005288`
11012
2018 2019 2020
5.7K
3.7K
Efficient increase in 3G coverage and quality with
less sites
Coverage Optimization | Rural coverage
28

Attractive return profile
Note: Q1 2019 numbers are unaudited

1849 44
74 63
30
Financial snapshot
Total Revenue
Notes: (1) Defined as Earnings Before Interest, Tax, Depreciation and Amortisation. (2) Excludes the impact of N20 billion writeback from remeasurement of financial liability (including writeback results in EBITDA and AFCF margin of 47% and 27% respectively). (3) Excludes N19.2 billion CBN resolution (including CBN payment results in FY 2018 EBITDA and AFCF margin of 42% and 20% respectively and Q4 2018 EDITDA margin of 37.8% ). (4) AFCF excludes non-cash transactions
45%(2) 44%(3)EBITDAMargin
39%
24% 21%AFCFMargin
16%
25% 18% CapexIntensity
25%
EBITDA(1)
Capex
Adjusted Free Cash Flow (AFCF)(4)
Quarterly EBITDA
Quarterly Total Revenue
41.8% 53.3%
794 887 1039
356 346 453
196 225 184
-2% 17%Y-o-Y
Growth 12%
191 143 223
249 256 259 275 282
104 114 112 123 150
(NGN bn)
44.3% 43.5% 44.7% IAS 17: 44.2%
19.0% 30.9%
47 64 74 38 87
25.1% 28.5% 13.8%
Quarterly Capex
14.5% 13.2%19.9% 18.5% 16.6%
7.2% 22.4%19.1% 16.8% 26.9% IAS 17: 20.5%
IAS 17: 21.7%
2016 2017 2018 Q1 2018 Q2 2018 Q3 2018 Q4 2018 Q1 2019
(3)
(3)
-2% 12%
Quarterly Adjusted Free Cash Flow (AFCF)

31
Understanding MTN Nigeria Revenue profile
Source: Company information.Notes: Percentages may not total 100% due to rounding.
Revenue Costs Capex Cash Flow Capital Structure
Data
Q1 2019 Split Composition Key Drivers
• Network quality and availability
• Marketing campaigns
• Customer value management
• Changes in ITRs
• New plans with efficient segment targeting
• Easier access to recharge
• Network quality and availability
• Data and smartphone penetration
• Focus on bundling; lifestyle products driving usage
• 4G and 3G expansion
• Attractive data propositions
• Smartphone adoption campaigns and consumer education
16.6%
Voice 74.9%• Voice Service
• Interconnect
• Mobile Data
• Fixed Data
Digital
• Redesigned VAS subscription model
• Local content
• Smart feature phone launch
1.0%• Rich Media; Mobile Advert; E-Commerce
• Value-Added Services
Other
• Despite impact of OTT messaging apps, SMS revenue grew driven by strong subscriber growth
• Outbound roaming and international outgoing SMS impacted by FX
4.5%
• SMS
• ICT and Infrastructure
• Devices
Fintech• Super agent roll-out
• New framework for payment service bank2.9%
• MoMo
• Xtratime
32
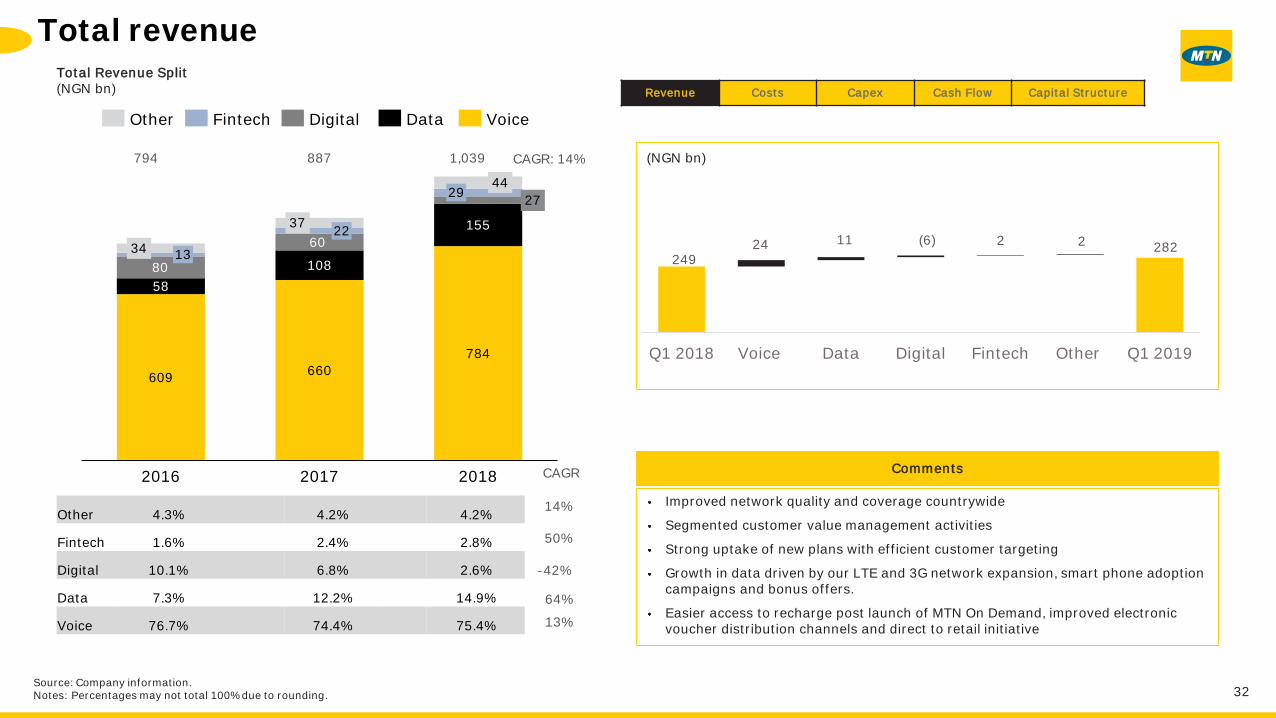
Total revenue
Source: Company information.Notes: Percentages may not total 100% due to rounding.
Total Revenue Split(NGN bn) Revenue Costs Capex Cash Flow Capital Structure
794 887 1,039
Comments
Improved network quality and coverage countrywide
Segmented customer value management activities
Strong uptake of new plans with efficient customer targeting
Growth in data driven by our LTE and 3G network expansion, smart phone adoption campaigns and bonus offers.
Easier access to recharge post launch of MTN On Demand, improved electronic voucher distribution channels and direct to retail initiative
Other 4.3% 4.2% 4.2%
Fintech 1.6% 2.4% 2.8%
Digital 10.1% 6.8% 2.6%
Data 7.3% 12.2% 14.9%
Voice 76.7% 74.4% 75.4%
609660
784
58
108
155
80
60
2729
34 13
2016
22
2017
44
2018
37
Other Digital DataFintech Voice
CAGR
14%
50%
-42%
64%
13%
249 24 11 (6) 2 2 282
Q1 2018 Voice Data Digital Fintech Other Q1 2019
CAGR: 14% (NGN bn)

Cost base summary
33
Revenue Costs Capex Cash Flow Capital Structure
Composition Key Drivers
Source: Company information.
Operating Expenses
• Site Lease Rental, Utilities and Fuel
• Maintenance
• Professional Fees
• Salaries, Staff Costs and Training
• Marketing
• Other
• Number of Sites
• Lease Rate Escalation
• Forex
• Inflation
• Headcount
• Media Campaigns and Sponsorships
59%
• Interconnect
• Dealer Commissions
• Digital / Fintech Costs
• Regulatory Fees and Levies
• Other
• Mobile Termination Rates (MTRs)
• Outgoing Minutes
• Channel Mix
• Discount Structure
• Statutory Payments
• Product Mix
Cost of Sales41%
Q1 2019 Split

Cost breakdown | cost of sales
34
Source: Company information.
Revenue Costs Capex Cash Flow Capital Structure
Cost of Sales Split(NGN bn)
Understanding Cost of Sales
Increased interconnect cost due to:
growth in subscriber base
Increased uptake of customer value
prepositions
Successfully reduced commission-to-sales
ratio, due to shift to digital airtime sales
Reduction in Digital and VAS costs in 2019
due to optimisation process
Increased regulatory fees in line with
revenue growth
76 84
96
44 45
51
28 21
7 5 6 8 17 19
23 12 8
14
2016 2017 2018
Other
Regulatory
Fintech
Digital
Commissions
Interconnect
184 184 199
23 26
12
14
3
1 2 2
5 6
3
4
Q1 2018 Q1 2019
50 54
80.8%76.8%
Gross margin 79.3% 80.0% 81.0%
Note: Other includes Recharge voucher, Handset & Accessories, SIM cards & Packs, Roaming, ICT & SIM services

35
Cost breakdown | operating expenses (Opex)
Source: Company information.
Revenue Costs Capex Cash Flow Capital Structure
Opex Split(NGN bn)
Lower Opex due to the adoption of IFRS 16
(change in accounting treatment of lease
rental)
On IAS 17 basis, opex was N104.0 billion,
representing 9.3% growth, which was below
inflation
YoY increase in maintenance cost in 2017
due to increase in number of sites and Naira
devaluation for FCY-denominated costs
135
213 245
24
24
28
28
43
45
27
30
30
18
16
17
21
30
25
2016 2017 2018
Other
Marketing
Professional Fees
Maintenance
Staff Cost
Lease Rentals, Utilities
& Fuel
254 356 390
58
43
6
7
13
12
7
6
4
4
7
6
Q1 2018 Q1 2019
95 78
Opexintensity 32.0% 40.1% 37.5% 38.2% 27.7% IAS 17:
36.9%Understanding Opex
Note: Other includes Travel & Entertainment, Transmission, Provisions for doubtful debts, General expenses and MTN foundation; 2016 excludes NCC fine treatment, while 2018 excludes CBN payment
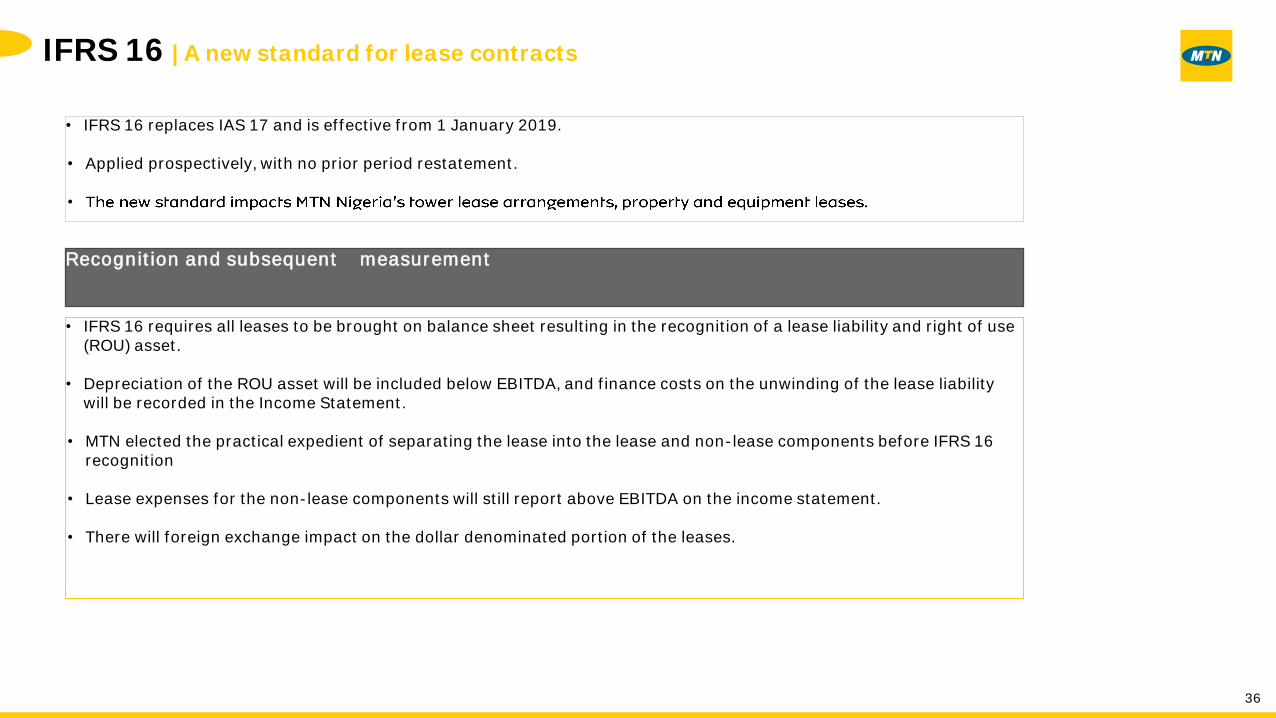
Recognition and subsequent measurement
• IFRS 16 requires all leases to be brought on balance sheet resulting in the recognition of a lease liability and right of use(ROU) asset.
• Depreciation of the ROU asset will be included below EBITDA, and finance costs on the unwinding of the lease liability will be recorded in the Income Statement.
• MTN elected the practical expedient of separating the lease into the lease and non-lease components before IFRS 16 recognition
• Lease expenses for the non-lease components will still report above EBITDA on the income statement.
• There will foreign exchange impact on the dollar denominated portion of the leases.
• IFRS 16 replaces IAS 17 and is effective from 1 January 2019.
• Applied prospectively, with no prior period restatement.
•
IFRS 16 | A new standard for lease contracts
36

IFRS 16 | Impact on income statement-Q1 2019
37
Revenue Costs Capex Cash Flow Capital Structure
53.3%
17.2%
44.2%
18.2%
Lease rental
Lease rental, Depreciation, Finance Cost and Tax
N3bn (1%)
N1.4bn (0.5%)
N25.8bn (9.2%)
PAT %
EBITDA %
IFRS 16 IAS 17

Capital expenditure breakdown
38
Capital Expenditure(NGN bn)
Overview of Capex
network, specifically:
4G rollout in major cities across the
country to improve network quality
3G densification and expansion
countrywide to improve availability,
reliability, data speed and overall user
experience
Other focus areas was on IT (including
hardware and software) to ensure a flexible,
scalable IT architecture
Revenue Costs Capex Cash Flow Capital Structure
Capex Mix (%)
Network 78% 87% 81% 84% 95%
IT 19% 10% 16% 14% 4%
Other Capex 3% 3% 3% 2% 1%
196 225 63
154
197
148
37
22
30
5
7
5
2016 2017 2018
Other Capex
IT
Network
184 18
Source: Company information.Notes: Percentages may not total 100% due to rounding
15
60
2
3
0.4
0.5
Q1 2018 Q1 2019

Free cash flow analysis
39
Revenue Costs Capex Cash Flow Capital Structure
2016 2017 2018 Q1 2019
EBITDA(1) 356 346 434 150
Capex(2) (165) (203) (211) (63)
AFCF 191 143 223 87
Change in Net Working Capital
61 (72) (2) (31)
Net Interest Paid (29) (36) (17) (21)
Income Tax Paid (80) (59) (22) (0)
NCC Fine Repayments
(80) (30) (110) (55)
Other(3) (3) (1) (0) (0)
Levered FCF 60 (56) 72 (19)
Source: Company information.Notes: (1) Excluding recognition and remeasurement of provision for the NCC fine; cash impact shown separately. (2) Shown net of proceeds received from (i) sale of assets held for sale and (ii) sale of PPE. Excludes acquisition of Visafone. (3) Includes
movements in share-based liabilities and non-current prepayments.
(NGN bn)
Capital structure overview
40
Revenue Costs Capex Cash Flow Capital Structure
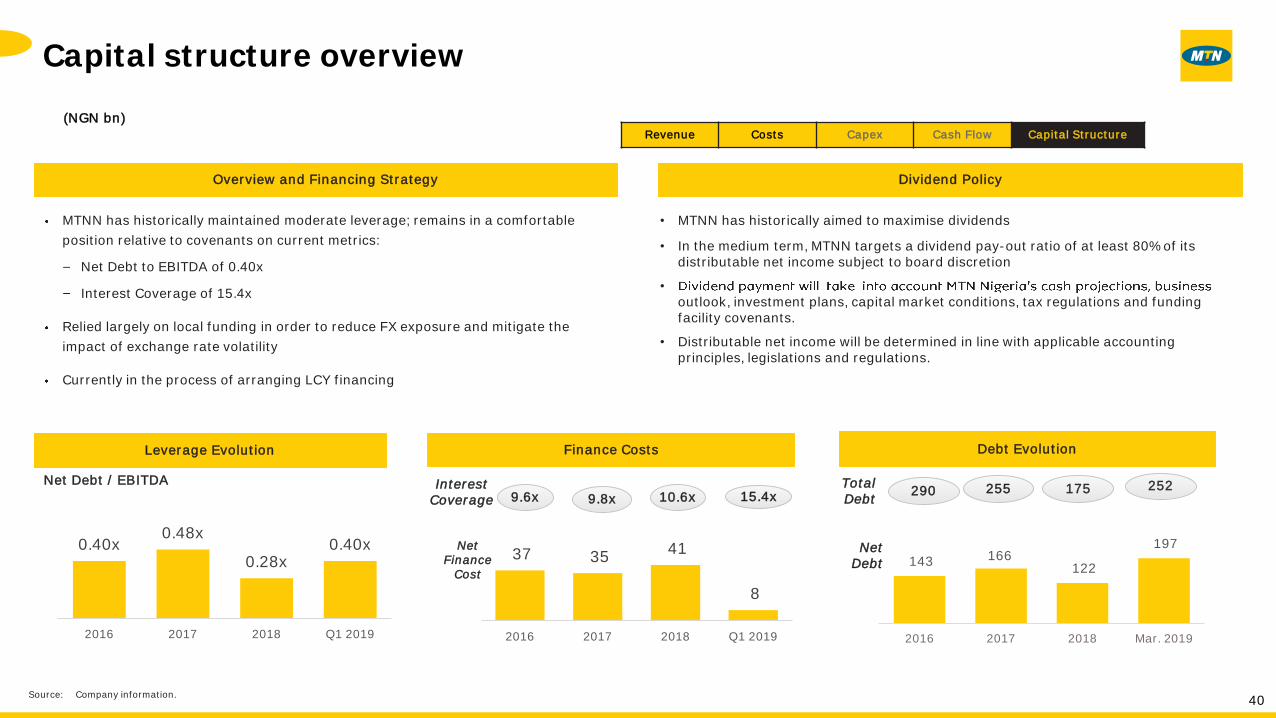
Overview and Financing Strategy Dividend Policy
Finance Costs
MTNN has historically maintained moderate leverage; remains in a comfortable
position relative to covenants on current metrics:
Net Debt to EBITDA of 0.40x
Interest Coverage of 15.4x
Relied largely on local funding in order to reduce FX exposure and mitigate the
impact of exchange rate volatility
Currently in the process of arranging LCY financing
290 255 252TotalDebt
Leverage Evolution
Net Debt / EBITDA
9.6x 9.8xInterest
Coverage
143 166 122
197
2016 2017 2018 Mar. 2019
17510.6x 15.4x
37 35 41
8
2016 2017 2018 Q1 2019
0.40x0.48x
0.28x0.40x
2016 2017 2018 Q1 2019
Source: Company information.
NetDebt
Net Finance
Cost
(NGN bn)
Debt Evolution
• MTNN has historically aimed to maximise dividends
• In the medium term, MTNN targets a dividend pay-out ratio of at least 80% of its distributable net income subject to board discretion
•
outlook, investment plans, capital market conditions, tax regulations and funding facility covenants.
• Distributable net income will be determined in line with applicable accounting principles, legislations and regulations.

Well positionedfor the long term

Key priorities
The Bright Journey from Basics to Best
42
Sustain #1 position in NPS across all categories
Optimize VAS subscription model to improve overall satisfaction
Educate Customers how best they can manage their subscriptions (Just For You)
BBest
customerexperience
Convert the last 24 months of growth to sustainable long terms performance
Deliver returns above inflation
Increase returns to compensate for challenging environment
RReturns and
efficiencyfocus
Extend and personalize CVM automated campaign tools
Deploy innovative, customer-centric solutions to clients.
Digitizing distribution channels
IIgnite
commercialperformance
Dual-data strategy
Monetise data portfolio
Grow digital services adoption
Reposition digital for the new future
Improve data experience through 4G coverage expansion
GGrowth throughdata and digital
Refresh culture and employee value proposition
Drive employee engagement
Strategic stakeholder management
Risk management, governance and transparency
HHearts
and minds
Smart capex and networkdeployment
Sustain and maintain network availability
Increasing spectrum efficiency
Monetize capacity
Rural capacity building
Digital transformation
TTechnologyexcellence

Looking ahead
Extending BRIGHT Revenue Streams
43

Opportunity to be unlocked across the 6 curves
Enterprise
Consumer mobile data & consumer
fixed data
Consumer Enterprise Wholesale
Enterprise
Wholesale (fixedand mobile)
Curve 6
Consumer Enterprise Wholesale
Consumer mobile voice, VAS and
hardware
Curve 1Consumer mobile
data and consumer fixed
data
Curve 2
Digital
Curve 3Fintech
Curve 4
Curve 5
44

• Low penetration supports subscriber growth
• Predominantly young population
• Price elasticity potential still exists for voice
• Best practice pricing & combo Bundles
• Ultra-rural site roll-out
• Personal pricing with AI
• Multi-product selling
• Distribution transformation
• Omni-channel experience
+12.7%Voice revenue
45
In Nigeria VOICE
Best coverage in NigeriaLargest distribution
footprint#1 Telco Brand
Investing inanalytics and AI
Market growth drivers
Q1 2019 Result MTN plan
Why MTN?

46
DATA is our core medium-
Why MTN?
Largest data network Ability to cross-sell CHASE strategyPioneer in low cost data
technology
+31.5%Data revenue
• Low data penetration
• 4G Coverage is < 50%
• Growing demand for data
• Increased level of awareness
• Pricing flexibility
• Fast Adoption of Youth
• CHASE Program Deliverables:
o 3G national coverage & extended 4G
o Handsets customized to meet immediate demand (Smart T)
o Affordability through Price transformation Optimize cost of production
o Service bundling including OTT partnership
o Education & Seamless access and Experience
Market growth drivers
Q1 2019 Result MTN plan
*Excludes fixed data
*
47
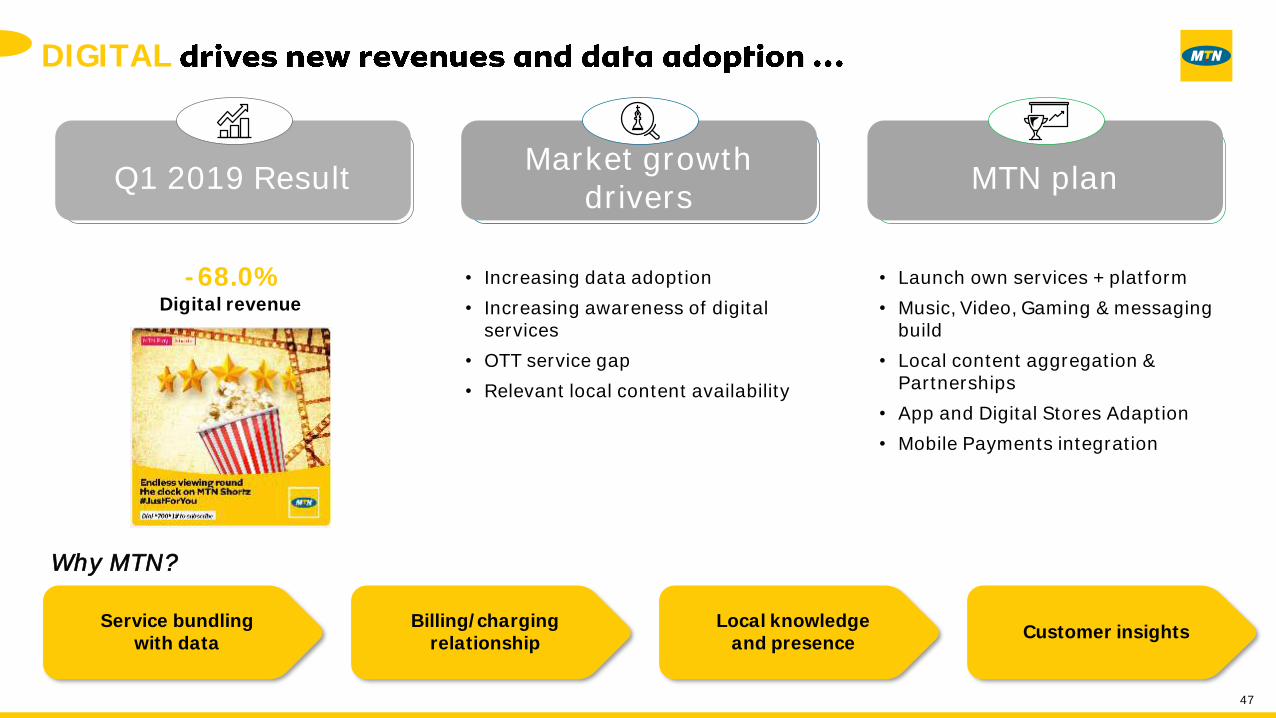
DIGITAL
Why MTN?
Service bundlingwith data
Billing/chargingrelationship
Local knowledgeand presence
Customer insights
-68.0%Digital revenue
• Increasing data adoption
• Increasing awareness of digital services
• OTT service gap
• Relevant local content availability
• Launch own services + platform
• Music, Video, Gaming & messaging build
• Local content aggregation & Partnerships
• App and Digital Stores Adaption
• Mobile Payments integration
Market growth drivers
Q1 2019 Result MTN plan
48
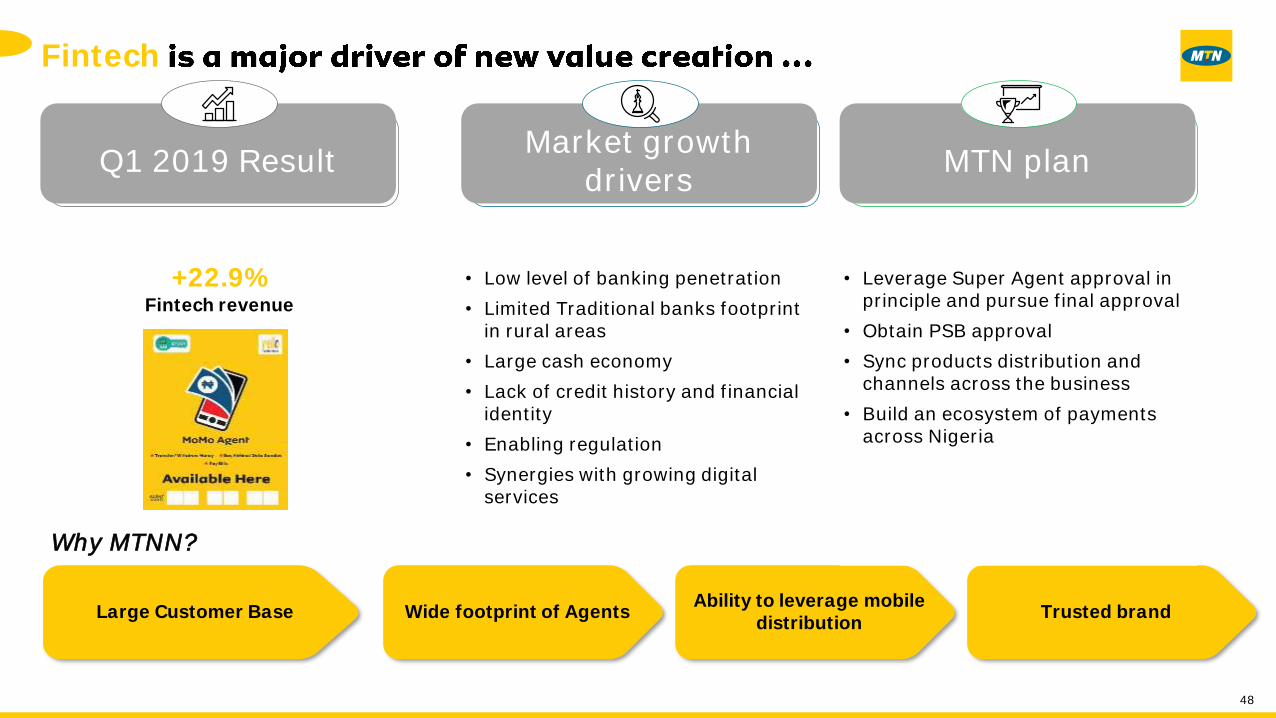
Fintech
Why MTNN?
Large Customer Base Wide footprint of Agents Ability to leverage mobile
distributionTrusted brand
+22.9%Fintech revenue
• Low level of banking penetration
• Limited Traditional banks footprint in rural areas
• Large cash economy
• Lack of credit history and financial identity
• Enabling regulation
• Synergies with growing digital services
• Leverage Super Agent approval in principle and pursue final approval
• Obtain PSB approval
• Sync products distribution and channels across the business
• Build an ecosystem of payments across Nigeria
Market growth drivers
Q1 2019 Result MTN plan
49
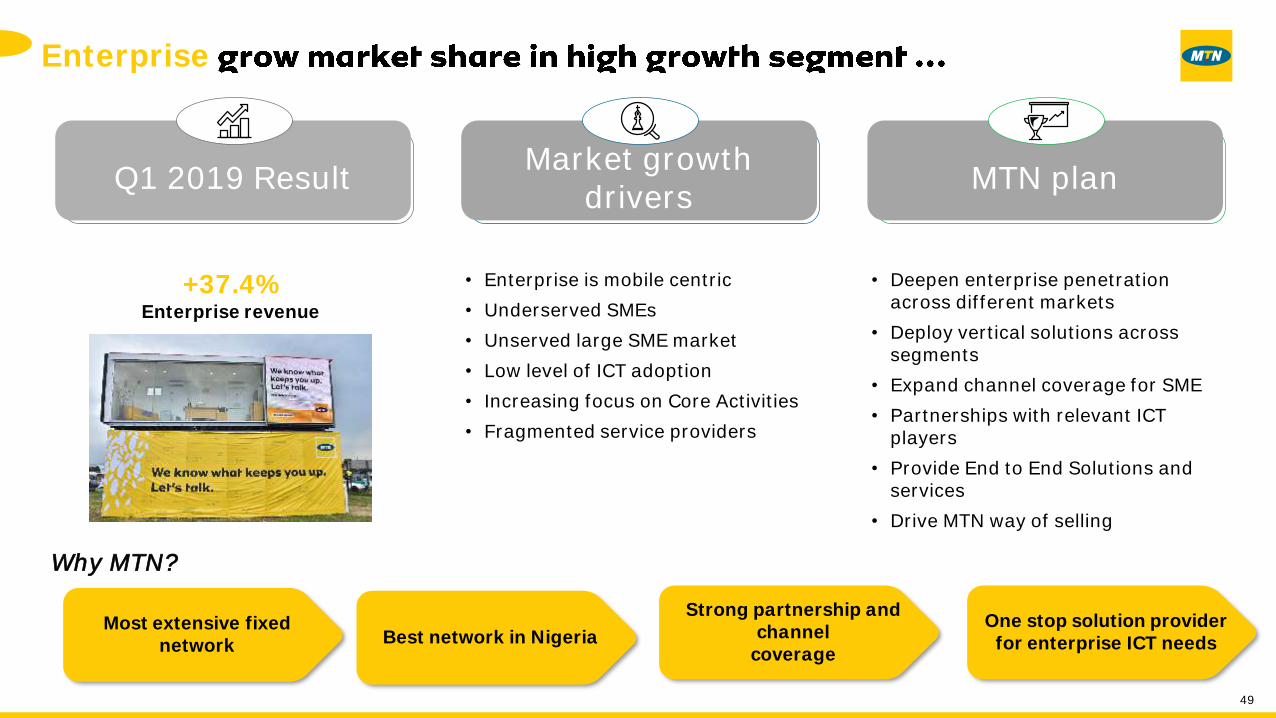
Enterprise
Why MTN?
Best network in NigeriaMost extensive fixed
network
Strong partnership and channel
coverage
One stop solution provider for enterprise ICT needs
+37.4%Enterprise revenue
• Enterprise is mobile centric
• Underserved SMEs
• Unserved large SME market
• Low level of ICT adoption
• Increasing focus on Core Activities
• Fragmented service providers
• Deepen enterprise penetration across different markets
• Deploy vertical solutions across segments
• Expand channel coverage for SME
• Partnerships with relevant ICT players
• Provide End to End Solutions and services
• Drive MTN way of selling
Market growth drivers
Q1 2019 Result MTN plan

50
Wholesale leverage Pan-African infrastructure across Group..
Why MTN?
Largestinfra player
Scale forterrestrial build
Efficient sales and service Carrier of Carriers
+25.8%wholesale revenue
• Huge capacity demand
• Satellite to fibre migration
• Managed MPLS needs
• Fast growth in digital services
• Increasing need to invest in infrastructure efficiently
• Monetize existing infrastructure
• Localize Global Connect capabilities
• Leverage Yellow connect platform
• Long term contracts with key players
Market growth drivers
Q1 2019 Result MTN plan

Q & A

Investor Relations Contact:Chima Nwaokoma Snr. Manager, External RelationsMTN Nigeria Communications Plc+234 803 200 [email protected]
everywhere you go
Thank you