
Mst. Rubina Aktar
78
ENERGY EFFICIENT HYBRID POWERED C-RAN ARCHITECTURES WITH DYNAMIC USER ASSOCIATION by Mst. Rubina Aktar Student ID: 1015062274 A thesis submitted to the Department of Electrical and Electronic Engineering of Bangladesh University of Engineering and Technology in partial fulfillment of the requirement for the degree of MASTER OF SCIENCE IN ELECTRICAL AND ELECTRONIC ENGINEERING Department of Electrical and Electronic Engineering BANGLADESH UNIVERSITY OF ENGINEERING AND TECHNOLOGY September 2019
Transcript of Mst. Rubina Aktar

ENERGY EFFICIENT HYBRID POWERED C-RAN
ARCHITECTURES WITH DYNAMIC USER
ASSOCIATION
by
Mst. Rubina Aktar Student ID: 1015062274
A thesis submitted to the Department of Electrical and Electronic Engineering of
Bangladesh University of Engineering and Technology in partial fulfillment of the
requirement for the degree of
MASTER OF SCIENCE
IN
ELECTRICAL AND ELECTRONIC ENGINEERING
Department of Electrical and Electronic Engineering
BANGLADESH UNIVERSITY OF ENGINEERING AND TECHNOLOGY
September 2019


iii
DEDICATION
TO MY DEAREST PARENTS AND LOVING DAUGHTER

iv
ACKNOWLEDGMENT
First and Foremost praise is to Almighty Allah, the greatest of all, on whom eventually
we depend for sustenance and guidance. I would like to thank Almighty for giving me
opportunity, determination and strength to do my research. His continuous grace and
mercy was with me throughout my life and ever more during the tenure of my research.
I would like to thank my supervisor Dr. Md. Farhad Hossain, Professor, Dept. of EEE,
BUET, for the patient guidance, encouragement and advice he has provided me
throughout my time as his student. I have been extremely lucky to have a supervisor who
cared much about my work, and who responded my questions and quires so promptly. In
addition to being an admirable supervisor, he is a man of principles and has immense
knowledge of research in general and his subject in particular. I am deeply indebted to
him for his steady guidance in publishing my thesis technical papers in IEEE
conferences.
I wish to express my gratitude to Md. Al-Hasan and Abu Jahid for their support
throughout my M.Sc. candidature. I am sure it would have not possible for me to
complete this task without their invaluable generosity and commitment.
I am grateful to my colleagues who have provided me adequate support for successful
completion of research works. Most importantly, none of this would have been possible
without the love and patience of my parents. I would like to express my heartfelt
gratitude to my family.

v
ABSTRACT
During the last decade, there has been remarkable development in cellular networks
market due to the ubiquitous availability of internet access in worldwide. The number of
users and corresponding cellular traffic has escalated astronomically. To cope with the
tremendous growth of data demand across the globe, cellular networks are deploying an
increasing number of base stations (BSs) which leads to a voluminous inflation in energy
consumption. Cloud radio access network (C-RAN) is new born mobile network
architecture has the potential to reduce the power consumption compared to the
traditional RAN network architecture. But, network densification in C-RAN places an
extensive burden on the electric grid system. Concerns about global warming and
increasing number of base stations (BSs) leading to rising energy consumption have
prompted extensive research effort focusing on energy efficiency (EE) issue for cellular
networks. The integration of renewable energy harvesting (REH) technology is expected
to be pervasively utilized by telecom operators aiming to reduce carbon foot-prints and
gird energy consumption. However, the dynamic nature of RE generation could lead to
energy outage and service quality deterioration. Thus utilization of commercial grid
supply in conjunction with RE generators is a more realistic option for sustainable
network operations.
In this thesis we propose hybrid powered C-RAN architectures and required energy usage
algorithms to enhance EE. Each RRH is equipped with renewable energy generators,
such as solar panel along with a set of batteries as an energy storage device and also
connected to grid energy supply. Afterward, dynamic user association policies integrated
with the proposed model for further improving EE. The prime goal is to quantify the EE
of various selection schemes namely distance-based, SINR-based, green energy-based
and traffic aware-based under the proposed network model. An extensive simulation-
based study is carried out for evaluating the EE performance of the proposed framework
varying different system parameters. Numerical results validate the proposed network
models compared to other counterparts.

vi
TABLE OF CONTENTS
ACKNOWLEDGMENT.................................................................................................... iv
ABSTRACT……………………………...………………………………………………..v
LIST OF FIGURES ........................................................................................................... ix
LIST OF TABLES ............................................................................................................. xi
LIST OF ABBEREVIATIONS ....................................................................................... xii
LIST OF SYMBOLS………………………………………………………………..…...xv
CHAPTER 1 INTRODUCTION .................................................................................... 1
1.1 Introduction………………………………………………………………..1
1.2 Background and present state of the problem ............................................. 1
1.3 Growth of global traffic and energy consumption in cellular networks ..... 2
1.4 Energy Efficiency in cellular network ........................................................ 5
1.5 Literature review ......................................................................................... 5
1.6 Motivation of the work ............................................................................... 7
1.7 Objectives with specific aims and possible outcome .................................. 7
1.8 Organization of the thesis ........................................................................... 8
CHAPTER 2 CLOUD RADIO ACCESS NETWORK ................................................ 9
2.1 Introduction ................................................................................................. 9
2.2 Background history ................................................................................... 11
2.3 Base Station architecture evolution .......................................................... 11
2.3.1 Traditional architecture…………………………………………………..11

vii
2.3.2 Base station with RRH…………………………………...………………12
2.3.3 Cloud radio access network (C-RAN)…………………………………...14
2.4 Architecture of C-RAN…………………………………………………..15
2.5 Advantages of C-RAN…………………………………………………...18
2.5.1 Adaptability to non-uniform traffic and scalability……………………...18
2.5.2 Energy and cost savings coming from statistical multiplexing gain in BBU
Pool and use of virtualization ............................................................................... 19
2.5.3 Increase of throughput ............................................................................. 20
2.5.4 Decrease of delays .................................................................................... 21
2.5.5 Ease in network upgrades and maintenance ............................................. 21
2.6 Challenges of C-RAN ............................................................................... 22
2.6.1 A need for high bandwidth, strict latency and jitter as well as low cost
transport network .................................................................................................. 22
2.6.2 BBU cooperation, interconnection and clustering .................................... 24
2.6.3 Virtualization technique ............................................................................ 25
2.7 Chapter summary ...................................................................................... 25
CHAPTER 3 THE PROPOSED MODEL AND PERFORMANCE METRICS......27
3.1 Introduction ............................................................................................... 27
3.2 System model ............................................................................................ 27
3.3 Network traffic model…………………………………………………....30
3.4 RRH Power consumption model………………………………………...30
3.5 Hybrid energy model……………………...……………………………..32
3.6 Energy storage dynamics…………………………………………….......33
3.7 Path loss model………………………………………………………......34
3.8 Performance metrics……………………………………………………. 35
3.9 User association (UA) policy……………………...………………….....36

viii
3.9.1 SINR-based ............................................................................................... 36
3.9.2 Traffic aware-based .................................................................................. 36
3.9.3 Distance-based .......................................................................................... 37
3.9.4 Green energy- based……………………………...…………………...…37
3.10 Chapter summary ...................................................................................... 37
CHAPTER 4 RESULTS AND ANALYSIS ................................................................. 38
4.1 Introduction ............................................................................................... 38
4.2 Simulation setup……………………………………………...………….38
4.3 Results and discussions ............................................................................. 38
4.3.1 Energy efficiency analysis of proposed hybrid network with grid supply.38
4.3.2 Energy efficiency analysis of proposed hybrid network with DG supply .44
4.3.3 Energy efficiency analysis of hybrid supply under different UA scheme. 49
4.4 Chapter summary………………..………………………………………...52
CHAPTER 5 CONCLUSIONS AND FUTURE WORKS…………………………..54
5.1 Conclusions ............................................................................................... 54
5.2 Future works ............................................................................................. 55

ix
LIST OF FIGURES
1.1 A forecast of mobile data traffic growth in coming year [1]. .................................... 3
1.2 Subscriber growth for global HSPA and LTE subscriber [1]. ................................... 3
1.3 Power consumption of a typical wireless cellular network [2] .................................. 4
1.4 Power consumption distribution in radio base stations [2] ........................................ 5
2.1 Traditional macro base station ................................................................................. 12
2.2 Base station with RRH. ............................................................................................ 13
2.3 C-RAN …………..……………………………………………………..………….13
2.4 Different separation method of BTS functions [9]………………………………...15
2.5 C-RAN architecture 1: Fully centralized solution [8]……………………………...16
2.6 C-RAN architecture 2: Partial centralized solution [8]…………………...………..17
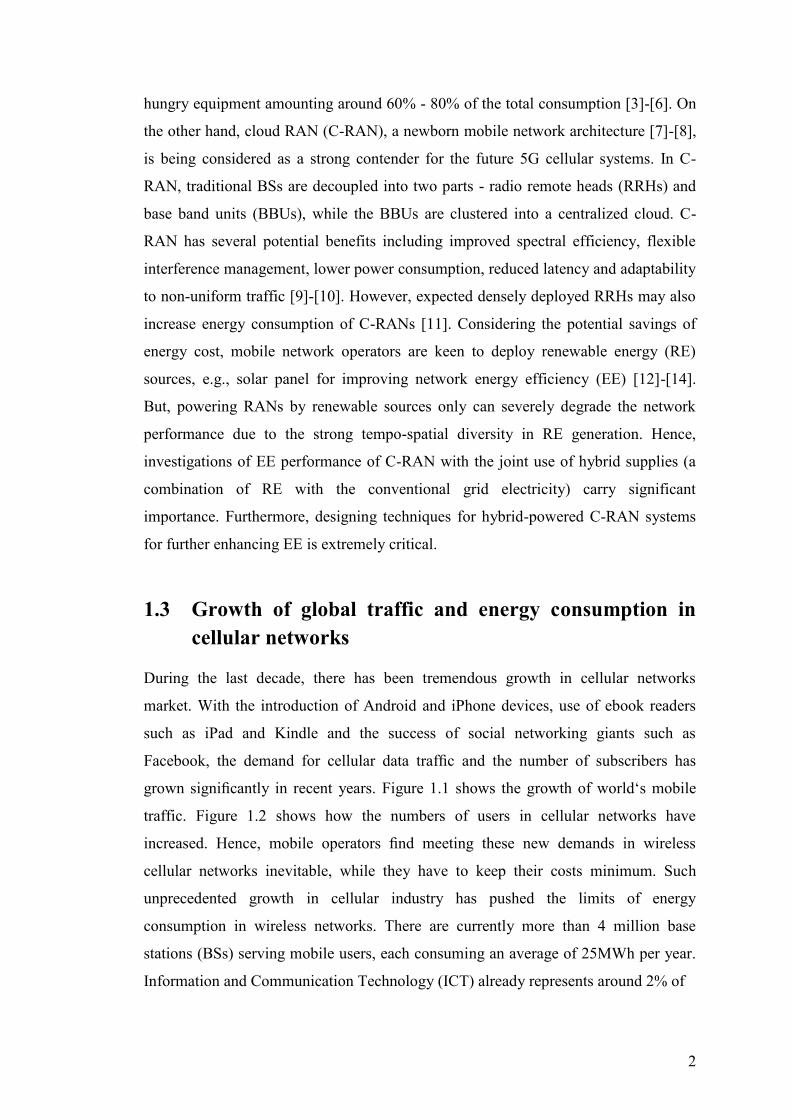
2.7 Daily load on base stations varies depending on base station location. Data source: [9]…...................................................................................................................................19
3.1 Conventional C-RAN………………………………..…………………………….28
3.2 Proposed network model with grid supply………………………………………...28
3.3 Proposed network model with diesel generator ....................................................... 29
3.4 Daily traffic profile of a residential area. ................................................................. 29
3.5 Load-dependent power model [58].. ........................................................................ 30
3.6 Average hourly solar energy generation…………………………………………...33
4.1 Comparison of on grid power consumption of the proposed C-RAN with different solar module capacity and conventional C-RAN………………………………………..40
4.2 Throughput of the proposed C-RAN and conventional C-RAN…….....……..…...40
4.3 Comparison of EE performance between proposed C-RAN and conventional C-RAN…………………………………………………………………………………….. 41
4.4 Energy efficiency gain for the proposed C-RAN network varying solar capacity...43
x
4.5 Comparison on EE performance of Macrocell RRH with bandwidth varying solar module capacity………..………………………………………………………….….….43
4.6 Input power consumption for a single RRH with two different transmitting power and antenna pattern……………………………………………………………………....44
4.7 Comparison of diesel power consumption with two different transmission power …………………………………………………………………………………………....45
4.8 Comparison of emission of proposed hybrid network with non-hybrid network. ............................................................................................................................ 45
4.9 Comparison of emission with two different transmission power.................... 46
4.10 Comparison of excess energy generation for omnidirectional configuration .......... 48
4.11 Comparison on EE performance varying solar module capacity for a RRH with 2/2/2 tri-sector antenna. .................................................................................................... 48
4.12 Throughput of the proposed C-RAN and conventional C-RAN……………..……49
4.13 Comparison of EE perfomance between proposed C-RAN and conventional C-RAN……………………………………………………………………………………...50
4.14 Energy efficiency gain for the proposed C-RAN network with different UA policies for 4kW solar PV ..................................................................... ………………………….51
4.15 Comparison of on grid power consumption of proposed C-RAN with different solar module capacity………………………………………………………...………….51
4.16 Energy efficiency gain for the proposed C-RAN network with different UA policies for 12kW solar PV ……………………………………………………………..52

xi
LIST OF TABLES
2.1 Compares traditional base station, base station with RRH and base station in C-RAN architecture. ....................................................................................................................... 14
2.2 IQ bit rates between a cell site and centralized BBU Pool [9] ................................. 23
2.3 Requirements for cloud computing and C-RAN applications [54] .......................... 25
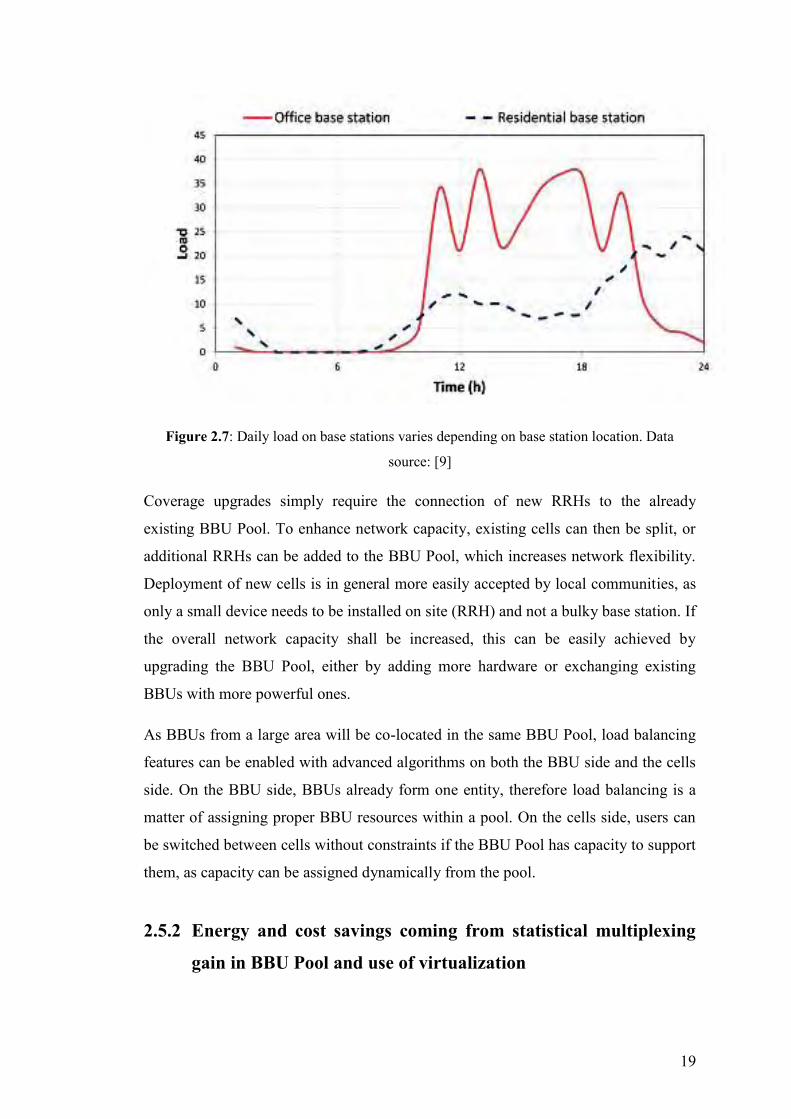
3.1 Power consumption breakdown ................................................................................ 32
3.2 Power consumption model parameter. ...................................................................... 32
4.1 Simulation parameter ................................................................................................ 39
4.2 Comparison of power consumption .......................................................................... 42
4.3 Comparison of CO emission with two different transmission powers…………….47

xii
LIST OF ABBREVIATIONS
Symbol Meaning
ARPU Average Revenue Per User
AWGN Additive White Gaussian Noise
BAP Battery Assisted Passive
BB Baseband
BBU Base Band Units
BS Base Stations
BW Bandwidth
CAPEX Capital Expenditure
CoMP Coordinate Multipoint
CPRI Common Public Radio Interface
C-RAN Cloud Radio Access Network
DG Diesel Generator
DPCs Distributed Processing Centers
DU Data Unit
EARTH Energy Aware Radio and Network Technologies
EE Energy Efficiency
EH Energy Harvest
eICIC Enhanced Inter-Cell Interference Coordination
eNB Evolved Node B
GHG Greenhouse Gas

xiii
GSM Global System for Mobile Communications
HetNets Heterogeneous network
ICI Inter Cell Interference
ICT Information and Communication Technology
IQ In-Phase/Quadrature
IRC Interference Rejection Combining
ITU International Telecoms Union
LTE Long-Term Evolution
LTE-A Long-Term Evolution-Advanced
LTEUL Long-Term Evolution Uplink
MAC Medium Access Control
MIMO Multiple-Input and Multiple-Output
MRC Maximum Ratio Combining
NE Network Elements
NFV Network Functions Virtualization
NP Non-Deterministic Polynomial-Time
OAM Operations, Administration And Maintenance
OBSAI Base Station Architecture Initiative
OFDMA Orthogonal Frequency Division Multiple Access
OPEX Operational Expenditure
ORI Open Radio Equipment Interface
PV Photovoltaic
QoS Quality of Service

xiv
RAN Radio Access Network
RB Resource Blocks
RE Renewable Energy
REH Renewable Energy Harvesting
RF Radio Frequency
RRH Radio Remote Heads
RRM Radio Resource Management
RRU Remote Radio Unit
RU Radio Units
SAM System Advisory Model
SDH Synchronous Digital Hierarchy
SDR Software Defined Radio
SINR Signal-to-Noise-Plus-Interference Ratio
TCO Total Cost of Ownership
TD-SCDMA Time Division Synchronous Code Division
Multiple Access
TREND Towards Real Energy-Efficient Network Design
UA User Association
UE User Equipment
UMTS Universal Mobile Telecommunications Service
WCDMA Wideband Code Division Multiple Access
WNC Wireless Network Cloud
WiMAX Worldwide Interoperability for Microwave Access

xv
LIST OF SYMBOLS
Symbol Meaning
Power Gradient
Static Consumption
Maximum Transmission Power
Sleep Mode Power
Number of Transceivers
Traffic Load
Harvested Energy
Maximum Harvested Energy
Green Energy Storage
Demand Energy
Percentage of Storage Energy
S(t) Remaining Storage Energy
Grid Consumption
PL Path-Loss
Path-Loss Exponent
Zero-Mean Gaussian Random Variable
Standard Deviation
N Number of RRH

xvi
K Number of User
Transmitted Power
Received Power
Intra-Cell Interference
Inter-Cell Interference
Carrier Frequency
Reference Distance
Maximum Storage Capacity
Total Throughput
µ Storage Factor
Energy Efficiency
On Grid Power Consumption

1
Chapter 1
Introduction
1.1 Introduction
A cellular network or mobile network is a communication network where the last link
is wireless. The network is distributed over land areas called cells, each served by at
least one fixed-location transceiver, but more normally three cell sites or base
transceiver stations. These base stations provide the cell with the network coverage
which can be used for transmission of voice, data, and other types of content. A cell
typically uses a different set of frequencies from neighboring cells, to avoid
interference and provide guaranteed service quality within each cell. Cellular network
infrastructures and mobile devices proliferate and because of this an increasing
number of users rely on cellular networks for their daily activities. Mobile networks
are the major energy guzzlers of information and communication technologies
infrastructures, and their contributions to global energy consumption are accelerating
because of the ever-increasing traffic demand. This growing energy consumption not
only escalates the operators‘ operational expenditure (OPEX) but also leads to a
significant rise of their carbon footprints. Hence, greening of mobile networks is
becoming a necessity to bolster social, environmental, and economic sustainability.
This chapter describes the background and motivation for this research work
describing the overview of the field and explaining the principle research problem. A
brief summary of the contributions of this thesis also presented.
1.2 Background and present state of the problem
The recent rapid growth in the number of subscribers and applications leads to
unprecedented rise of energy consumption in cellular networks. This has severe
detrimental effect on both the economical and the environmental aspects [1]-[2].
Overall, the ICT sector currently contributes around 2% of the global carbon
footprint, where cellular networks are the major stakeholders. In traditional cellular
systems, base stations (BSs) in the radio access network (RAN) are the most energy
2
hungry equipment amounting around 60% - 80% of the total consumption [3]-[6]. On
the other hand, cloud RAN (C-RAN), a newborn mobile network architecture [7]-[8],
is being considered as a strong contender for the future 5G cellular systems. In C-
RAN, traditional BSs are decoupled into two parts - radio remote heads (RRHs) and
base band units (BBUs), while the BBUs are clustered into a centralized cloud. C-
RAN has several potential benefits including improved spectral efficiency, flexible
interference management, lower power consumption, reduced latency and adaptability
to non-uniform traffic [9]-[10]. However, expected densely deployed RRHs may also
increase energy consumption of C-RANs [11]. Considering the potential savings of
energy cost, mobile network operators are keen to deploy renewable energy (RE)
sources, e.g., solar panel for improving network energy efficiency (EE) [12]-[14].
But, powering RANs by renewable sources only can severely degrade the network
performance due to the strong tempo-spatial diversity in RE generation. Hence,
investigations of EE performance of C-RAN with the joint use of hybrid supplies (a
combination of RE with the conventional grid electricity) carry significant
importance. Furthermore, designing techniques for hybrid-powered C-RAN systems
for further enhancing EE is extremely critical.
1.3 Growth of global traffic and energy consumption in cellular networks
During the last decade, there has been tremendous growth in cellular networks
market. With the introduction of Android and iPhone devices, use of ebook readers
such as iPad and Kindle and the success of social networking giants such as
Facebook, the demand for cellular data traffic and the number of subscribers has
grown significantly in recent years. Figure 1.1 shows the growth of world‘s mobile
traffic. Figure 1.2 shows how the numbers of users in cellular networks have
increased. Hence, mobile operators find meeting these new demands in wireless
cellular networks inevitable, while they have to keep their costs minimum. Such
unprecedented growth in cellular industry has pushed the limits of energy
consumption in wireless networks. There are currently more than 4 million base
stations (BSs) serving mobile users, each consuming an average of 25MWh per year.
Information and Communication Technology (ICT) already represents around 2% of

3
Figure 1.1: A forecast of mobile data traffic growth in coming year [1].
Figure 1.2: Subscriber growth for global HSPA and LTE subscriber [1].
total carbon emissions (of which mobile networks represent about 0.2%), and this is
expected to increase every year. In addition to the environmental aspects, energy costs
also represent a significant portion of network operators‘ overall expenditures
0
5
10
15
20
25
30
2014 2015 2016 2017 2018 2019
Exab
yte
pe
r m
on
th
57% CAGR 2014-2019
2012 2013 2014 2015 2016 2017
HSPA 1000 1600 2100 2700 3500 4200
LTE 60 133 250 402 627 940
0
1000
2000
3000
4000
5000
6000
Sub
scri
be
rs in
mill
ion

4
(OPEX). While the BSs connected to electrical grid may cost approximately 3000$
per year to operate, the off-grid BSs in remote areas generally run on diesel power
generators and may cost ten times more. The rising energy costs and carbon footprint
of operating cellular networks have led to an emerging trend of addressing energy
efficiency amongst the network operators and regulatory bodies such as 3GPP and
ITU [15] - [16]. This trend has stimulated the interest of researchers in an innovative
new research area called ―green cellular networks‖. In this regard, the European
Commission has recently started new projects within its seventh Framework
Programme to address the energy efficiency of mobile communication systems, viz.
―Energy Aware Radio and NeTwork TecHnologies (EARTH)‖,―Towards Real
Energy-efficient Network Design (TREND)‖ and ―Cognitive Radio and Cooperative
strategies for Power saving in multi-standard wireless devices (C2POWER)‖ [17] -
[19].
Figure 1.3: Power consumption of a typical wireless cellular network [2].
―Green radio‖ is a vast research discipline that needs to cover all the layers of the
protocol stack and various system architectures and it is important to identify the
fundamental trade-offs linked with energy efficiency and the overall performance
[20]. Figures 1.3 and 1.4 shows a breakdown of power consumption in a typical
0% 10% 20% 30% 40% 50% 60%
Retail
Data centre
Core transmission
Mobile switching
Base station

5
cellular network and gives us an insight into the possible research avenues for
reducing energy consumption in wireless communications.
Power amplifier50-80% (65%)
Power supply5-10% (7.5%)
Signal processing
5-15% (10%)
Air conditioning10-25% (17.5%)
Figure 1.4: Power consumption distribution in radio base stations [2].
1.4 Energy efficiency in cellular network
Energy awareness in telecommunication networks is the perception and identification
of all energy resources and characteristics gathered from all network elements (NE) in
order to precede certain power adjustment and maximize networks energy efficiency
(EE) and lifetime. Telecom sectors have been accused as the most energy-intensive
consumer in ICT industry that is responsible for the amount of greenhouse gas (GHG)
emissions and high operation cost. Energy efficiency in cellular networks is a growing
concern for cellular operators to not only maintain profitability, but also to reduce the
overall environment effects. This emerging trend of achieving energy in cellular
network is motivating the standardization authorities and network operators to
continuously explore future technologies in order to bring improvements in the
entire networks infrastructure. Therefore, it has now become essential to include to,
include energy efficiency as a major performance indictor in both the planning and
the operation stages of cellular networks.

6
1.5 Literature review
Recently, cellular network has drawn deep attention among academia and mobile
operator due to its ever-increasing energy demand in their infrastructures. In this
regard, few researches have been conducted for energy-efficient wireless network
with hybrid energy supplies [21]–[22]. A simple energy cooperation framework is
proposed between two surrounded BSs with hybrid supplies addressing the EE metric
[22]. Authors in [22], proposed an energy efficient algorithm that balances the energy
consumption among BSs enabling more subscribers to be served with renewable
energy sources under hybrid power supply. Authors also demonstrate the optimization
of green energy utilization during the peak traffic hours and shows a significant
amount of on-grid energy saving has been attained. To conserve the on-grid energy
consumption, the hybrid energy-powered cellular networks have drawn increasing
attentions recently [23]–[28]. Authors in [23] investigated user association and power
control between two BSs to minimize the time-average on-grid energy consumption.
Considering the lack of non-causal information of the energy harvesting EH process,
the authors proposed a resource allocation algorithm which only requires
instantaneous information of the channel fading and EH process. In [27], Sheng et al.
investigated the energy sharing and load shifting among the BSs with energy
harvesting capability. The authors formulate a NP-hard optimization problem to
minimize the on-grid energy consumption. Authors in [28] developed a greedy
algorithm to optimize the power control subject to network latency. In [26], Yang et
al. investigated the tradeoff between the network throughput and on-grid energy
consumption in a relay network, while considering the stochastic characteristics of
renewable energy and mobile traffic. Authors in [29] proposed an energy optimization
algorithm to minimize the on-grid consumption and thus enabling more users to be
served using solar energy in heterogeneous wireless networks powered by hybrid
supplies. But this article does not take into consideration the tempo-spatial variation
of green energy generation and cellular traffic diversity. Authors in [30] proposed a
simple energy-efficient hybrid model for green energy sharing among BSs via a
resistive power line in consideration of traffic dynamics. Cell zooming is another
method has the potential to balance the traffic load and reduce the energy
consumption have proposed in [31]. However, there are many issues that these works
do not tackle and remain to be addressed. To deploy renewable-powered BSs, it is

7
important to understand the interaction/competition between the renewable energy
supplier and the BS, especially considering the competition‘s impact on the QoS.
1.6 Motivation of the work
It is predicted that, increase global energy consumption in the future due to dramatic
escalation of mobile traffic. Due to this exponential growth in the number of mobile
users, the data traffic is increased incredibly leading to massive energy inflation and
incur high OPEX. In traditional cellular architecture, BSs consumed about half of the
total power in RAN infrastructure, while other half is used by other equipment‘s such
as cooling device, RF unit, baseband signal processing unit etc. [32]. The ever
growing energy consumption is pushing terrific pressure on the electricity grid supply
and exerting detrimental impact to the atmosphere. This aptitude has drawn intensive
attention for energy-efficient cellular networking and also has driven to address the
EE.
C-RAN is a newborn mobile network architecture whose concept was first proposed
in [39] has the potential to reduce the power consumption compared to the traditional
RAN network architecture. Moreover, C-RAN can efficiently serve a large number of
users, by implementing the knowledge of the network at the BBU pool. From the
energy efficiency perspective, densely deployed RRHs may increase energy
consumption of C-RANs, leading high OPEX and produce pollution intensive carbon
footprints. Being inspired this issue, we are motivated to propose a renewable energy
powered C-RAN for achieving an increased level of EE. Under the proposed network,
all the network are powered by hybrid supplies combining traditional grid power and
RE sources such as solar PV module with sufficient energy storage capacity. On the
other hand, the C-RAN powered by only grid supply is considered as the conventional
C-RAN. In the result section, we thoroughly investigate the proposed system
performance using Monte-Carlo simulations and thereafter, we compare EE
performance with the conventional C-RAN for further validation.
1.7 Objectives with specific aims and possible outcomes
The objectives of this thesis are:

8
1) To propose hybrid powered C-RAN architectures and required energy usage
algorithms to enhance EE.
2) To propose various dynamic user association policies and integrate with the
proposed architectures for further EE improvement.
3) To develop a simulation platform for evaluating the performance of the
proposed C-RAN.
4) Finally, the performance of the proposed framework will be compared with
that of the existing networks.
The possible outcome after the successful completion of the research work will
support lower grid power consumption and higher EE. The simulation platform will
be helpful to investigate and understand the effect of different network parameters on
the performance of the proposed C-RAN system and thus can be used for energy
efficient network design for C-RAN.
1.8 Organization of the thesis
This thesis consist of five chapters presenting the background material, reviews of the
relevant literature, proposed hybrid model with thorough investigation and insightful
analysis, summary of the key findings and potential future research opportunities.
Chapter 2 briefly describes the cloud radio access network with its different aspects.
Chapter 3 outlines the proposed network model along with network layout, network
traffic model, power consumption model, energy storage dynamics, hybrid energy
model, path loss model. Moreover, various dynamic user association policies integrate
with the proposed architecture. Furthermore, the formation of performance metrics
and details parameters of simulation setup has also been focused in this chapter.
Chapter 4 provides the simulation results on grid power consumption, DG power
consumption, carbon footprint, surplus electricity, throughput, EE, EE gain and so on
with insightful analysis.
Chapter 5 concludes the thesis by summarizing the major findings, as well as
identifying several potential research opportunities for the improvement.

9
Chapter 2
Cloud Radio Access Network
2.1 Introduction
Today‘s mobile operators are facing a strong competition environment. The cost to
build, operate and upgrade the Radio Access Network (RAN) is becoming more and
more expensive while the revenue is not growing at the same rate. The mobile internet
traffic is surging, while the ARPU is flat or even decreasing slowly, which impacts
the ability to build out the networks and offer services in a timely fashion. To
maintain profitability and growth, mobile operators must find solutions to reduce cost
as well as to provide better services to the customers. On the other hand, the
proliferation of mobile broadband internet also presents a unique opportunity for
developing an evolved network architecture that will enable new applications and
services, and become more energy efficient.
The RAN is the most important asset for mobile operators to provide high data rate,
high quality, and 24x7 services to mobile users. Traditional RAN architecture has the
following characteristics: first, each Base Station (BS) only connects to a fixed
number of sector antennas that cover a small area and only handle
transmission/reception signals in its coverage area; second, the system capacity is
limited by interference, making it difficult to improve spectrum capacity; and last but
not least, BSs are built on proprietary platforms as a vertical solution. These
characteristics have resulted in many challenges. For example, the large number of
BSs requires corresponding initial investment, site support, site rental and
management support. Building more BS sites means increasing CAPEX and OPEX.
Usually, BS‘s utilization rate is low because the average network load is usually far
lower than that in peak load; while the BS‘s processing power can‘t be shared with
other BSs. Isolated BSs prove costly and difficult to improve spectrum capacity.
Lastly, a proprietary platform means mobile operators must manage multiple none-
compatible platforms if service providers want to purchase systems from multiple
vendors. Causing operators to have more complex and costly plan for network

10
expansion and upgrading. To meet the fast increasing data services, mobile operators
need to upgrade their network frequently and operate multiple-standard network,
including GSM, WCDMA/TD-SCDMA and LTE. However, the proprietary platform
means mobile operators lack the flexibility in network upgrade, or the ability to add
services beyond simple upgrades.
In summary, traditional RAN will become far too expensive for mobile operators to
keep competitive in the future mobile internet world. It lacks the efficiency to support
sophisticated centralized interference management required by future heterogeneous
networks, the flexibility to migrate services to network edge for innovative
applications and the ability to generate new revenue from revenue from new services.
Mobile operators are faced with the challenge of architecting radio network that
enable flexibility. In the following sections, we will explore ways to address these
challenges.
C-RAN is a novel mobile network architecture, which has the potential to answer the
above mentioned challenges. The concept was first proposed in [39] and described in
detail in [41]. In C-RAN, baseband processing is centralized and shared among sites
in a virtualized BBU Pool. This means that it is well prepared to adapt to non-uniform
traffic and utilizes resources, i.e., base stations, more efficiently. Due to that fact that
fewer BBUs are needed in C-RAN compared to the traditional architecture, C-RAN
also has the potential to decrease the cost of network operation, because power and
energy consumption are reduced compared to the traditional RAN architecture. New
BBUs can be added and upgraded easily, thereby improving scalability and easing
network maintenance. A virtualized BBU Pool can be shared by different network
operators, allowing them to rent Radio Access Network (RAN) as a cloud service. As
BBUs from many sites are co-located in one pool, they can interact with lower delays
– therefore mechanisms introduced for LTE-Advanced (LTE-A) to increase spectral
efficiency and throughput, such as eICIC and CoMP are greatly facilitated. Methods
for implementing load balancing between cells are also facilitated. Furthermore,
network performance is improved, e.g., by reducing delay during intra-BBU Pool
handover.

11
2.2 Background history
C-RAN architecture is targeted by mobile network operators, as envisioned by China
Mobile Research Institute [41], IBM [39], Alcatel-Lucent [42], Huawei [43], ZTE
[44], Nokia Siemens Networks [45], Intel [45] and Texas Instruments [47]. Moreover,
C-RAN is seen as a typical realization of mobile network supporting soft and green
technologies in fifth generation (5G) mobile networks. However, C-RAN is not the
only candidate architecture that can answer the challenges faced by mobile network
operators. Other solutions include small cells, being part of HetSNets and Massive
MIMO. Small cells deployments are the main competitors for outdoor hot spot as well
as indoor coverage scenarios. All-in-one small footprint solutions like Alcatel-
Lucent‘s Light Radio [48] can host all base station functionalities in a several-liter
box. They can be placed outdoors reducing cost of operation associated to cooling and
cell site rental. However, they will be underutilized during low-activity periods and
cannot employ collaborative functionalities as well as C-RAN. Moreover, they are
more difficult to upgrade and repair than C-RAN. A brief comparison between C-
RAN, Massive MIMO and HetSNets is outlined in [49]. Liu et al. in [50] prove that
energy efficiency of large scale Small Cell Networks is higher compared with
Massive MIMO. Furthermore, cost evaluation on different options needs to be
performed in order for a mobile network operator to choose an optimal solution.
Comparison of TCO including CAPEX and OPEX over 8 years of a traditional LTE
macro base station, LTE C-RAN and LTE small cell shows that the total transport
cost per Mbps is highest for macro cell deployments - 2200$, medium for C-RAN -
1800$ and 3 times smaller for small cell - 600$ [51]. Therefore the author concludes
that C-RAN needs to achieve significant benefits to overcome such a high
transportation cost. Collaborative techniques such as CoMP and eICIC can be
implemented in small cells giving higher benefits in HetNet configuration instead of
C-RAN. The author envisions that C-RAN might be considered for special cases like
stadium coverage. However, C-RAN is attractive for operators that have free/cheap
fiber resources available.
2.3 Base station architecture evolution
2.3.1 Traditional architecture

12
In the traditional architecture, radio and baseband processing functionality is
integrated inside a base station. The antenna module is generally located in the
proximity (few meters) of the radio module as shown in Figure 2.1 as coaxial cables
employed to connect them exhibit high losses. This architecture was popular for 1G
and 2G mobile networks deployment.
Mobile core
network
BS
BS Figure 2.1: Traditional macro base station.
2.3.2 Base station with RRH In a base station with RRH architecture, the base station is separated into a radio unit
and a signal processing unit, as shown in Figure 2.2. The radio unit is called a RRH or
Remote Radio Unit (RRU). RRH provides the interface to the fiber and performs
digital processing, digital to analog conversion, analog to digital conversion, power
amplification and filtering. The baseband signal processing part is called a BBU or
Data Unit (DU). This architecture was introduced when 3G networks were being
deployed and right now the majority of base stations use it. The distance between a
RRH and a BBU can be extended up to 40 km, where the limitation is coming from
processing and propagation delay. Optical fiber and microwave connections can be
used. In this architecture, the BBU equipment can be placed in a more convenient,
easily accessible place, enabling cost savings on site rental and maintenance
compared to the traditional RAN architecture, where a BBU needs to be placed close

13
Mobile core
network
BBU
BBU
RRH
RRH
Figure 2.2: Base station with RRH.
to the antenna. RRHs can be placed up on poles or rooftops, leveraging efficient
cooling and saving on air-conditioning in BBU housing. RRHs are statically assigned
to BBUs similarly to the traditional RAN. One BBU can serve many RRHs. RRHs
can be connected to each other in a so called daisy-chained architecture. An Ir
interface is defined, which connects RRH and BBU.
Mobile core
network
RRH
RRH
BBU pool
Figure 2.3: C-RAN

14
2.3.3 Cloud radio access network (C-RAN) In C-RAN, in order to optimize BBU utilization between heavily and lightly loaded
base stations, the BBUs are centralized into one entity that is called a BBU/DU
Pool/Hotel. A BBU Pool is shared between cell sites and virtualized as shown in
Figure 2.3. A BBU Pool is a virtualized cluster which can consist of general purpose
processors to perform baseband (PHY/MAC) processing. C-RAN is the term used now to describe this architecture, where the letter C can be
interpreted as: Cloud, Centralized processing, Cooperative radio, Collaborative or
Clean. Figure 2.3 shows an example of a C-RAN mobile LTE network. The fronthaul
part of the network spans from the RRHs sites to the BBU Pool. The backhaul
connects the BBU Pool with the mobile core network. At a remote site, RRHs are co-
located with the antennas. RRHs are connected to the high performance processors in
the BBU Pool through low latency, high bandwidth optical transport links. Digital
baseband, i.e., IQ samples, are sent between a RRH and a BBU.
Table 2.1 Compares traditional base station, base station with RRH and base station in
C-RAN architecture.
Architecture Radio and base-
band functionalities
Problem it addresses
Problems it Causes
Traditional
base station
Co-located in one
unit -
High power
consumption
Resources are
underutilized
Base station
with RRH
Spitted between
RRH and BBU.
RRH is placed
together with
antenna at the
remote site. BBU
located within 20-
40 km away.
Lower power
consumption.
More
convenient
placement of
BBU
Resources
are underutilized
C-RAN Spitted into RRH Even lower Considerable

15
and BBU. RRH is
placed together with
antenna at the
remote site. BBUs
from many sites are
co-located in the
pool within 20-40
km away.
power
consumption.
Lower number
of BBUs needed
cost reduction
transport
resources
between RRH
and BBU
2.4 Architecture of C-RAN
It‘s a natural evolution of the distributed BTS, which is composed of the baseband
Unit (BBU) and remote radio head (RRH). According to the different function
splitting between BBU and RRH, there are two kinds of C-RAN solutions: one is
called ‗full centralization‘, where baseband (i.e. layer 1) and the layer 2, layer 3 BTS
functions are located in BBU; the other is called ‗partial centralization‘, where the
RRH integrates not only the radio function but also the baseband function, while all
other higher layer functions are still located in BBU. For the solution 2, although the
BBU doesn‘t include the baseband function, it is still called BBU for the simplicity.
The different function partition method is shown in Figure 2.4
Main
control &
clock
Baseband
processingDigital IF Transmitter/
ReceiverPA & LNA
Core
network
AntennaGPS
BBURRU
Solution 2 Solution 1
Figure 2.4: Different separation method of BTS functions [9].

16
Based on these two different function splitting methods, there are two C-RAN
architectures. Both of them are composed of three main parts: first, the distributed
radio units which can be referred to as Remote Radio Heads (RRHs) plus antennas
which are located at the remote site; second, the high bandwidth low-latency optical
transport network which connect the RRHs and BBU pool; and third, the BBU
composed of high-performance programmable processors and real-time virtualization
technology.
RRH RRH
RRHRRHRRH UE
UE
UEUE
UE
UEUE
Optical transport
L1/L2/L3/O&M L1/L2/L3/O&M L1/L2/L3/O&M
Virtual baseband pool
Figure 2.5: C-RAN Architecture 1: Fully centralized solution [8].
The ―fully centralized‖ C-RAN architecture, as shown in Figure 2.5, has the
advantages of easy upgrading and network capacity expansion; it also has better
capability for supporting multi-standard operation, maximum resource sharing, and
it‘s more convenient towards support of multi-cell collaborative signal processing. Its
major disadvantage is the high bandwidth requirement between the BBU and to carry
the baseband I/Q signal. In the extreme case, a TD-LTE 8 antenna with 20MHz
bandwidth will need a 10Gpbs transmission rate.

17
The ―partial centralized‖ C-RAN architecture, as shown in Figure 2.6, has the
advantage of requiring much lower transmission bandwidth between BBU and RRH,
by separating the baseband processing from BBU and integrating it into RRH.
Compared with the ‗full centralized‘ one, the BBU-RRH connection only need to
carry demodulated data, which is only 1/20~1/50 of the original baseband I/Q sample
data. However, it also has its own shortcomings. Because the baseband processing is
integrated into RRH, it has less flexibility in upgrading, and less convenience for
multi-cell collaborative signal processing. With either one of these C-RAN
architectures, mobile operators can quickly deploy and make upgrades to their
network. The operator only needs to install new RRHs and connect them to the BBU
pool to expand the network coverage or split the cell to improve capacity. If the
network load grows, the operator only needs to upgrade the BBU pool‘s HW to
accommodate the increased processing capacity.
RRH/L1 RRH/L1
RRH/L1RRH/L1RRH/L1 UE
UE
UEUE
UE
UEUE
Optical transport
L2/L3/O&M L2/L3/O&M L2/L3/O&M
Virtual baseband pool
Figure 2.6: C-RAN Architecture 2: Partial centralized solution [8].

18
Moreover, the ‗fully centralized solution‘, in combination with open platform and
general purpose processors, will provide an easy way to develop and deploy software
defined radio (SDR) which enables upgrading of air interface standards by software
only, and makes it easier to upgrade RAN and support multi-standard operation. Different from traditional distributed BS architecture, C-RAN breaks up the static
relationship between RRHs and BBUs. Each RRH does not belong to any specific
physical BBU. The radio signals from /to a particular RRH can be processed by a
virtual BS, which is part of the processing capacity allocated from the physical BBU
pool by the real-time virtualization technology. The adoption of virtualization
technology will maximize the flexibility in the C-RAN system.
2.5 Advantages of C-RAN
2.5.1 Adaptability to non-uniform traffic and scalability
Typically, during a day, users are moving between different areas, e.g., residential and
office. Figure 2.7 illustrates how the network load varies throughout the day. Base
stations are often dimensioned for busy hours, which mean that when users move
from office to residential areas, the huge amount of processing power is wasted in the
areas from which the users have moved. Peak traffic load can be even 10 times higher
than during off-the-peak hours [41]. In each cell, daily traffic distribution varies, and
the peaks of traffic occur at different hours. Since in C-RAN baseband processing of
multiple cells is carried out in the centralized BBU pool, the overall utilization rate
can be improved. The required baseband processing capacity of the pool is expected
to be smaller than the sum of capacities of single base stations. The ratio of sum of
single base stations capacity to the capacity required in the pool is called statistical
multiplexing gain.
In [52] an analysis on statistical multiplexing gain is performed as a function of cell
layout. The analysis shows that in the Tokyo metropolitan area, the number of BBUs
can be reduced by 75% compared to the traditional RAN architecture.
19
Figure 2.7: Daily load on base stations varies depending on base station location. Data
source: [9]
Coverage upgrades simply require the connection of new RRHs to the already
existing BBU Pool. To enhance network capacity, existing cells can then be split, or
additional RRHs can be added to the BBU Pool, which increases network flexibility.
Deployment of new cells is in general more easily accepted by local communities, as
only a small device needs to be installed on site (RRH) and not a bulky base station. If
the overall network capacity shall be increased, this can be easily achieved by
upgrading the BBU Pool, either by adding more hardware or exchanging existing
BBUs with more powerful ones.
As BBUs from a large area will be co-located in the same BBU Pool, load balancing
features can be enabled with advanced algorithms on both the BBU side and the cells
side. On the BBU side, BBUs already form one entity, therefore load balancing is a
matter of assigning proper BBU resources within a pool. On the cells side, users can
be switched between cells without constraints if the BBU Pool has capacity to support
them, as capacity can be assigned dynamically from the pool.
2.5.2 Energy and cost savings coming from statistical multiplexing
gain in BBU Pool and use of virtualization

20
By deploying C-RAN, energy, and as a consequence, cost savings, can be achieved.
80% of the CAPEX is spent on RAN [41], therefore it is important to work towards
reducing it.
Energy in mobile network is spent on power amplifiers, supplying RRH and BBU
with power and air conditioning. 41% of OPEX on a cell site is spent on electricity
[1]. Employing C-RAN offers potential reduction of electricity cost, as the number of
BBUs in a C-RAN is reduced compared to a traditional RAN. Moreover, in the lower
traffic period, e.g., during the night, some BBUs in the pool can be switched off not
affecting overall network coverage. Another important factor is the decrease of
cooling resources, which takes 46% of cell site power consumption [41]. Due to the
usage of RRHs air conditioning of radio module can be decreased as RRHs are
naturally cooled by air hanging on masts or building walls. ZTE estimates that C-
RAN enables 67%-80% power savings compared with traditional RAN architecture,
depending on how many cells one BBU Pool covers, which stays in line with China
Mobile research claiming 71% power savings [53].
Civil work on remote sites can be reduced by gathering equipment in a central room,
what contributes to additional OPEX savings. In total, 15% CAPEX and 50% OPEX
savings are envisioned comparing to RAN with RRH [54] or traditional RAN
architecture. However, the cost of leasing the fiber connection to the site may increase
CAPEX. IQ signal transported between RRHs and BBUs brings up a significant
overhead. Consequently, the installation and operation of transport network causes
considerable costs for operators.
Moreover, virtualization helps to reduce cost of network deployment and operation, at
the same time enabling operators to offer additional services, not only serve as
pipelines for carrying user date.
2.5.3 Increase of throughput
eICIC and CoMP are important features of LTE-A that aim at minimizing inter cell
interference and utilizing interference paths constructively, respectively. If all the
cells within a CoMP set are served by one BBU Pool, then a single entity doing signal
processing enables tighter interaction between base stations. Therefore interference

21
can be kept to lower level and consequently the throughput can be increased. It has
been proven that combining clustering of cells with CoMP makes more efficient use
of the radio bandwidth [55]. In [56] Huiyu et al. discuss the factors affecting the
performance of CoMP with LTE-A in C-RAN uplink (UL), i.e., receiver algorithm,
reference signals orthogonality and channel estimation, density and size of the
network. In [41] authors present simulation results which compare spectrum
efficiency of intra-cell and inter-cell JT to non-cooperative transmission. 13% and
20% increase in spectrum efficiency was observed, respectively. For a cell edge user,
spectrum efficiency can increase by 75% and 119%, respectively.
2.5.4 Decrease of the delays
The time needed to perform handovers is reduced as it can be done inside the BBU
Pool instead of between eNBs. In GSM, the total average handover interrupt time is
lower and the signaling is reduced due to better synchronization of BBUs. In UMTS
signaling, Iub transport bearer setup and transport bandwidth requirements are
reduced, however, the performance improvement may not be sensed by the user. For
LTE X2-based inter-eNB handover the delay and failure rate are decreased.
Moreover, the general amount of signaling information sent to core mobile network is
reduced, after being aggregated in the pool.
2.5.5 Ease in network upgrades and maintenance
C-RAN architecture with several co-located BBUs eases network maintenance: not
only C-RAN capacity peaks and failure might be absorbed by BBU Pool automatic
reconfiguration, therefore limiting the need for human intervention, but whenever
hardware failures and upgrades are really required, human intervention is to be done
only in a very few BBU pool locations. On the contrary for traditional RAN, the
servicing may be required at as many cell sites as there are in the network. C-RAN
with a virtualized BBU Pool gives a smooth way for introducing new standards, as
hardware needs to be placed in few centralized locations. Therefore deploying it can
be considered by operators as a part of their migration strategy. Co-locating BBUs in
BBU Pool enables more frequent CPU updates than in case when BBUs are located in
remote sites. It is therefore possible to benefit from the IT technology improvements

22
in CPU technology, be it frequency clock (Moore‘s law) or energy efficiency (as
currently seen in Intel mobile processor road map or ARM architecture). Software
Defined Radio (SDR) is a well-known technology that facilitates implementation in
software of such radio functions like modulation/demodulation, signal generation,
coding and link-layer protocols. With such technology, C-RAN BBU Pool can
support multi-standard multi-system radio communications configured in software.
Upgrades to new frequencies and new standards can be done through software
updates rather than hardware upgrades as it is often done today on non-compatible
vertical solutions. Multi-mode base station is therefore expected to alleviate the cost
of network development and Operations, Administration and Maintenance (OAM).
2.6 Challenges of C-RAN
Before the commercial deployment of C-RAN architectures a number of challenges
need to be addressed: A. High bandwidth, strict latency and jitter as well as low cost
transport network needs to be available, B. Techniques on BBU cooperation,
interconnection and clustering need to be developed as well as C. Virtualization
techniques for BBU Pool need to be proposed.
2.6.1 A need for high bandwidth, strict latency and jitter as well as
low cost transport network
The C-RAN architecture brings a huge overhead on the optical links between RRH
and BBU Pool. Comparing with backhaul requirements, the one on fronthaul are
envisioned to be 50 times higher [34]. IQ data is sent between BBU and RRH as
shown in Figure 2.2. The main contributors to the size of IQ data are: turbo coding
(e.g., in UMTS and LTE 1:3 turbo codes is used resulting in three times overhead),
chosen radio interface (e.g., CPRI) IQ sample width and oversampling of LTE signal.
For example, 30.72 MHz sampling frequency is standardized for 20 MHz LTE, which
is more than 20 MHz needed according to Nyquist - Shannon sampling theorem. Total
bandwidth depends also on number of sectors and MIMO configuration. Equation 2.1
summarizes factors that influence IQ bandwidth. Scenario of 20 MHz LTE, 15+1
CPRI IQ Sample width, 10/8 line coding, 2x2 MIMO transmission resulting in 2.4576
Gbps bit rate in fronthal link is often treated as a baseline scenario. Consequently, for

23
20 MHz 4x4MIMO, 3 sector base station, the expected IQ throughput exceeds 10
Gbps. Examples on expected IQ bit rate between cell site and BBU in LTE-A, LTE,
Time Division Synchronous Code Division Multiple Access (TD-SCDMA) and GSM
Table 2.2: IQ bit rates between a cell site and centralized BBU Pool [9]
Cell configuration
Bit rate
20 MHz LTE, 15+1 CPRI IQ Sample width,
10/8 line coding, 2x2 MIMO 2.5 Gbps
5x20 MHz LTE-A, 15 CPRI IQ Sample width,
2x2 MIMO, 3 sectors 13.8 Gbps
20 MHz LTE, 4x2 MIMO, 3 sectors 16.6 Gbps
TD-LTE, 3 sectors 30 Gbps
1.6 MHz TD-SCDMA, 8Tx/8Rx antennas, 4
times sampling rate 330 Mbps
TD-SCDMA S444, 3 sectors 6 Gbps
200 kHz GSM, 2Tx/2Rx antennas,
4x sampling rate 25.6 Mbps
networks can be found in Table 2.2. The centralized BBU Pool should support 10 -
1000 base station sites [1], therefore a vast amount of data needs to be carried towards
it.
IQ Bandwidth = sampling Frequency • sample Width •2 • line Coding • M IM O • no
Of Sectors. (2.1)
The transport network not only needs to support high bandwidth and be cost efficient,
but also needs to support strict latency and jitter requirements. Below different
constraints on delay and jitter are summarized:
i. The most advanced CoMP scheme, JT, requires 0.5µs timing accuracy in
collaboration between base stations, which is the tightest constraint. However,
it is easier to cope with synchronization challenges in C-RAN compared to
traditional RAN due to the fact that BBUs are co-located in the BBU Pool.

24
ii. According to [41], regardless of the delay caused by the cable length, round
trip delay of user data may not exceed 5 µs, measured with the accuracy of
16.276ns on each link or hop [33].
iii. The sub-frame processing delay on a link between RRHs and BBU should be
kept below 1ms, in order to meet HARQ requirements. Due to the delay
requirements of HARQ mechanism, generally maximum distance between
RRH and BBU must not exceed 20-40 km [41].
2.6.2 BBU cooperation, interconnection and clustering
Cooperation between base stations is needed to support CoMP in terms of sharing the
user data, scheduling at the base station and handling channel feedback information to
deal with interference. Co-location of many BBUs requires special security and
resilience mechanisms. Solutions enabling connection of BBUs shall be reliable,
support high bandwidth and low latency, low cost with a flexible topology
interconnecting RRHs. Thus, C-RAN must provide a reliability that is better or
comparable to traditional optical networks like Synchronous Digital Hierarchy (SDH),
which achieved high reliability due to their ring topology. Mechanisms like fiber ring
network protection can be used. Cells should be optimally clustered to be assigned to
one BBU Pool, in order to achieve statistical multiplexing gain, facilitate CoMP, but
also to prevent the BBU Pool and the transport network from overloading. One BBU
Pool should support cells from different areas such as office, residential or
commercial. After analyzing interferences a beneficial assignment of cells to one
BBU Pool can be chosen.
To achieve optimal energy savings of the C-RAN, base stations need to be chosen in a
way that will optimize the number of active RRHs/BBU units within the BBU Pool.
Proper RRH aggregation and assignment to one BBU Pool can also facilitate CoMP.
To achieve optimal throughput on the cell edges cooperative transmission/reception
schemes are needed to deal with large Inter Cell Interference (ICI), improving
spectrum efficiency. The resource sharing algorithms have been developed by the
research community. They need to be combined with an algorithm clustering the cells
to reduce scheduling complexity. Therefore, the well-designed scheduler in C-RAN
also has an impact on the spectrum efficiency.

25
2.6.3 Virtualization technique
A virtualization technique needs to be proposed to distribute or group processing
between virtual base station entities and sharing of resources among multiple
operators. Any processing algorithm should be expected to work real time - dynamic
processing capacity allocation is necessary to deal with a dynamically changing cell
load. Virtualization and cloud computing techniques for IT applications are well
defined and developed. However, C-RAN application poses different requirements on
cloud infrastructure than cloud computing. Table 2.3 compares cloud computing and
C-RAN requirements on cloud infrastructure.
Table 2.3: Requirements for cloud computing and C-RAN applications [54]
IT - Cloud computing Telecom - Cloud
RAN
Client/base station data rate
Mbps range, bursty, low activity
Gbps range, con- stant stream
Latency and Jitter Tens of ms < 0.5 ms, jitter in
ns range
Life time of in- Formation
Long (content data)
Extremely short (data symbols and received samples)
Allowed recovery time
s (second) range (some- times hours)
ms (milliseconds) range to avoid network outage
Number of clients per centralized location
Thousands, even millions Tens, maybe hundreds
2.7 Chapter Summary
With the arrival of the mobile Internet era, today‘s RAN architecture is facing more
and more challenges that the mobile operators need to solve: mobile data flow
increase drastically caused by the popularization of smart terminals, very hard to
improve spectrum efficiency, lack of flexibility to multi-standard, dynamic network
load because of ―tides effect‖ and expensive to provide ever increasing internet
service to end users. Mobile operators must consider the evolution of the RAN to high
efficient and lost cost architecture.

26
C-RAN is a promising solution to the challenges mentioned above. By using new
technologies, we can change the network construction and deployment ways,
fundamentally change the cost structure of mobile operators, and provide more
flexible and efficient services to end users. With the distributed RRH and centralized
BBU architecture, advanced multipoint transmission/reception technology, SDR with
multi-standard support, virtualization technology on general purpose processor, more
efficient way of dealing with the tides effect and service on the edge of the RAN, C-
RAN will be able to provide today‘s mobile operator with a competitive infrastructure
to keep profitable growth in the dynamic market environment.

27
Chapter 3
The Proposed Model and Performance Metrics
3.1 Introduction
This chapter presents the proposed network layout and other key features with
mathematical model in the context of next-generation mobile networks. Green energy
model, energy storage principle, RRH power consumption model and different UA
policies are also presented. Moreover, overviews of performance metrics are also
discussed in this section.
3.2 System model
We consider a hybrid powered C-RAN architecture consisting of BBU pool and radio
units (RUs). The RUs consist of N numbers of RRH that are jointly support K
numbers of users. Let, R = { , , .......,N} and K = { , , ……,K} be the set
of RRHs and randomly located active users, respectively. All the RRHs are
connected to BBU pool i.e., the central controller; through the high bandwidth wired
front-haul links. Based on the network topology and energy availability at RRHs, the
central controller schedules and distributes the data properly to various RRHs. The
BBU pool and all RRHs are powered by both the grid power/DG and RE source. Each
RRH is also connected with its own energy storage device such as battery bank to
store surplus electricity for future use. The grid power is supplied to the network
entities through energy router. Here, the main functions of energy router include the
interconnection of energy unit, energy distribution, the demand management of the
load side. However, RRH switched on to grid power supply/DG in the absence of
storage energy in order to ensure reliability as well as zero outage. A segment of
proposed network model shown in Figure 3.2 and Figure 3.3.

28
RRH RRH
RRHRRHRRH UE
UE
UEUE
UE
UEUE
Baseband PoolUE------User Equipment
RRH-----Remote Radio HeadBBU-----Base Band Unit
BBU 1BBU 2 BBU 3
Optical transport
Cloud for centralized processing
-----Grid supply
Figure 3.1: Conventional C-RAN.
RRH
Baseband Pool
------User Equipment
RRH-----Remote Radio HeadBBU-----Base Band Unit
BBU 1BBU 2 BBU 3
Fronthaul Links
Cloud for centralized processing
Grid Supply
Wireless Link
RRH RRH
Storage device
Solar PV array
Energy router
Figure 3.2: The proposed hybrid network model with grid supply.

29
RRH
UE
Baseband Pool
BBU 1 BBU 2BBU 3
Fronthaul Links
UEUE
RRHRRH
Cloud layer
Network layer
Energy layer
Solar PV DG
Battery
Figure 3.3: Proposed hybrid network model with diesel generator.
Figure 3.4: Daily traffic profile of a residential area.

30
3.3 Network traffic model
It is worth mentioning that the power consumption depends on the traffic load and
that the mobile traffic distribution exhibits both temporal and spatial diversity [57].
The total number of mobile users in the system varies at different time slots— the
temporal diversity of the mobile traffic. Also, the number of users on individual BSs
are different—the spatial diversity of mobile traffic. Figure 3.4 shows the typical daily
traffic intensity under a cellular network. Assuming all the mobile users are randomly
distributed in the area and the RRHs transmit data to all the users with the same data
rate.
3.4 RRH power consumption model
The total supply power of a RRH can be approximated as an affine function of
transmission power [58]. In other words, it can be expressed as a sum of load
dependent share (dynamic consumption) which increases linearly by a power gradient
and load independent (static consumption) share ( ). According to Figure 3.5,
when BS operating at transmission power ( ), the supply power consumption is
reached at maximum ( ). In contrary, RRH may enter at sleep mode ( ) when
power consumption is extremely low. Here, we take a power consumption model of
RRH, in which the total power consumption in a RRH is a function of traffic
distribution.
Dynamic consumption
Static consumption
Pmax
Psupply /(W)
Po
Psleep
P1
γ Pmax /W
Figure 3.5: Load-dependent power model [58].

31
= { ( ( ))
(3.1)
where is the number of transceivers per RRH, = + is the
maximum power consumption in a RRH. The parameter is the traffic load, where
= 1 indicates that a fully loaded system, e.g. RRH transmitting at full power and at
full bandwidth, and = 0 indicates an idle system. The idle mode power consumption
does not depend on traffic. It depends on only power consumption of different
parameters of BSs like as power amplifier (PA), radio frequency (RF) transceiver,
baseband (BB) engine. Now, can be expressed as below [58],
=
( )( )( ) (3.2)
where , and are the three loss factor represents the losses incurred by
DC-DC conversion, main supply and active cooling respectively. In C-RAN, as there
is no longer require any cooling arrangement for RRH, hence we set to a zero
value. , and are the power consumption of BB engine, RF transceiver
and PA respectively. However, both the power consumption and scales
linearly with the number of transceiver and bandwidth BW. For some basic
consumptions, and
, we thus define;
=
(3.3)
and =
(3.4)
On the other hand, The PA power consumption depends on the maximum
transmission power per antenna and the PA efficiency ,
=
( ) (3.5)
where is the possible feeder losses. RRH power consumption model
parameters are summarized in Table 3.1 and Table 3.2.
32
Table 3.1: Power consumption breakdown
Parameters Value
Feeder loss, [dB] 0
PA efficiency, (%) 31.1
BB power, [W] 29.6
RF Transceiver power, [W] 12.9
PA power, [W] 64.4
DC-DC, (%) 7.5
Cooling, (%) 0
Main supply, (%) 9
3.5 Hybrid energy model
Renewable energy generation is most promising approach for minimizing on grid
power consumption and also reducing greenhouse gasses. Here, we consider solar PV
as the green energy generators at each RRH. Solar energy generation is depends on
some factors, such as temperature, solar light intensity, panel materials, and the
geographic location of the solar panels. Figure 3.6 shows the average hourly solar
energy generation for full year in Dhaka city using System Advisory Model (SAM)
software.
Table 3.2: Power consumption model parameter
Antenna pattern (Watt) (Watt)
Omnidirectional 1 20
84 2.8 56.0 1 40
Tri-sector 2/2/2 6 20
6 40

33
Figure 3.6: Average hourly solar energy generation.
It is observed that, solar energy generation start from around 6:00 AM. The energy
generation remains increasing and reaches at peaks at around 1:00 PM, and ends at
about 6:00 PM. Due to the variation in energy generation, the available solar energy
may not always guarantee the sufficient energy supplies to the RRHs. In that case, on
grid power supply is required to run the RRH in order to avoid outage.
3.6 Energy storage dynamics
RUs can harvest energy from the renewable energy source buying energy from the
grid supply. Let, )(tnE is the harvested energy by thn RRH in time slot t. The
following energy harvest constraint holds in each time slot:
max)()( tntnE
where )(tn denotes the amount of ambient energy. Due to the impact of
environmental changes, the value of )(tn diametrically changes across time slots,

34
which is upper limited by max . Denote by )(tn the green energy storage of the thn
RRH at time t. The following green energy saving holds each time slot [59]:
)()()1()( tntnEtntn (3.6)
where (t) is the demand energy of a specific RRH .The factor indicate the
percentage of storage energy retained after unit period of time, which is bounded by
10 .
Under the proposed network, the green utilization and on-grid energy consumption of thn RRH under different scenarios are as follows:
Case I: If )()( tntn , then the thn RRH will be served by its own storage and there
is no longer requiring of grid energy consumption. The total storage energy remaining
after fulfilling demand by itself can be expressed as,
)()()( tntnts (3.7)
Case II: If )()( tntn , then thn RRH will take energy from grid supply. In this case,
the on grid consumption of thn RRH can be written as,
)()()( tntntng (3.8)
3.7 Path loss model
In this paper, we consider a channel model with log normally distributed shadow
fading. If d is the distance between transmitter and receiver, then path loss in dB can
be formulated as [37],
X
od
dodPLdLP )(10log10)()( , dB (3.9)
where is the path-loss exponent and )( odPL is the path-loss in dB at a reference
distance od in km. Usually, )( odPL is computed assuming free space propagation

35
model. X is zero-mean Gaussian random variable with standard deviation which
is also in dB.
Thus, received power in dBm for thk UE at a distance nkd , from thn RRH is given
by
)()(,)(, dPLdBmkn
rPdBmkn
rP (3.10)
where knrP , is the transmitted power by the thn RRH in dBm. Then the received
signal-to-noise-plus-interference ratio for thk UE can be given by
NPerkIrakI
knrP
knSINR
int,int,
,
, (3.11)
where rakI int, is intra-cell interference and erkI int, is inter-cell interference. NP is
additive white Gaussian noise (AWGN) power given by )(10log10174 fNP in
dBm where ( f ) is the bandwidth in Hz. Orthogonal frequency division multiple
access (OFDMA) technique nullify the intra-cell interference ( rakI int, ).
3.8 Performance metrics
EE is the key performance indicators that assess the feasibility of a cellular network
given in terms of bit per joule. In particular, EE metric measures how efficiently data
can be transmitted per unit energy consumption. The low power consumption to
transmit the same amount of data implies the more energy efficient operations. In this
paper, we evaluate EE performance metric for the proposed RE-CRAN as the ratio of
total throughput of the network to that of the net on-grid power consumed by the
network. The total network throughput can be formulated by Shanon‘s capacity
theorem as
K
k
BN
n knSINRftotalC1 1
),1(2log , kbps (3.12)
where K is the total number of UE and NB is the total number of transmitting RRHs

36
for serving thk user.
Now the EE metric denoted as can be written as
netPtotalC
EE , bit/joule (3.31)
where, netP is the net on grid power consumption, as the difference between total input
power consumption and the solar storage power.
However, EE gain is another useful metrics is used to compare the network
performance under different scenarios. EE gain can be defined as the ratio of the
considered system and baseline reference. Here, conventional C-RAN as shown in
Figure 3.1 is considered as reference system.
3.9 User association (UA) policy
UA means the UE connects to a RRH in a suitable way to receive best signal quality.
Associating users with the closest RRH does not always ensure the best SINR due to
the randomness of shadow fading. Different UE-RRH connection algorithm has been
adopted in this paper.
3.9.1 SINR-based
A user orders the neighbouring RRHs in a descending manner depending on received
signal quality. Thereafter, user connects to a RRH that provides maximum SINR
among neighbouring cells. It is noteworthy that a single RRH is assumed for data
transmission each association policy. Therefore, dynamic point selection coordinated
multipoint scheme is carried out in this paper varying four different user connection
policies.
3.9.2 Traffic aware-based
A similar concept of sleep-mode based mechanism is followed under this scheme. It is
widely recognized that incoming traffic arrival varies both time and space. The
considered RRHs operating under below threshold traffic are shift into sleep mode for
further energy saving. However, the remaining incoming request will be taken care by

37
neighbouring active RRH intending to zero outage. For instance, is currently
operated under low traffic mode switch their traffic into that served least
number of traffic load. In this case, the RRHs are ranked in ascending manner based
on traffic demand. Provided that reached their maximum demand, then the rest
of incoming request will be transferred to the next possible RRH from the RRH set.
3.9.3 Distance-based
In a conventional scheme, a UE generally connects to nearest RRH. Under this policy,
UE categorized the surrounding RRHs in an ascending order. Notably, the nearest
RRH may not always supports the UE owing to the random shadow fading effect.
3.9.4 Green energy-based
The green energy generation exhibits tempo-spatial diversity. Therefore, each RRH
may have different storage capability due to variation of solar generation and traffic
dynamics. Under the green energy-aware UA scheme, a user categorizes the RRH in a
subsiding way. According to definition, UE associates the RRH that have highest
green energy storage capability
3.10 Chapter summary
In this chapter, we have proposed a frame work for an energy efficient cellular
network with hybrid powered RRHs, where PV solar module acts as the main energy
source for a RRH and the grid/DG remains as the standby. Mathematical modeling of
the energy generation system, SINR expression and energy storage algorithm have
been clearly presented in this chapter. This chapter has also entailed discussion of the
different performance metrics in order to assess the achievement of entire cellular
networks.
38
Chapter 4
Results and Analysis
4.1 Introduction
Energy efficiency (EE) is a key concern in diverse domains of next-generation mobile
networks due to dramatic surge of energy consumption. Both the energy savings and
network performance subsequently form the basis of EE metrics. The simulation
results of the proposed hybrid model are described in this chapter. The simulation
setup and various simulated results such as on grid power consumption, throughput,
EE, EE gain performance and so on are shown in the section 4.2 and section 4.3.
4.2 Simulation setup
A MATLAB based Monte-Carlo method is conducted to evaluate the system
performance and the results are calculated by taking mean of 10000 iterations. The
considered networks are assumed to be deployed with omnidirectional antenna with
hexagonal fashion. We assume the number of users on each RRH is different over a
day and they are randomly distributed. The RRHs transmit data to all the users with
the same data rates. We further assume that one resource block is allocated to one
user. Inter-cell interference effect is taken from the neighboring serving RRH.
According to the LTE standard [60], the key model parameters of the system are set
which are summarized in table 4.1.
4.3 Results and discussions
4.3.1 Energy efficiency analysis of the proposed hybrid network with grid supply
This section analyzes the performance of the proposed network in terms of grid power
consumption and energy efficiency for different solar PV capacities (1kW, 2kW, 3kW
and 4kW) with respect to conventional C-RAN. Here, the conventional C-RAN
scheme defines the cellular system is powered by only traditional grid supply without

39
RE source integration. Figure 4.1 illustrates the grid power consumption varying
installed on-site solar capacity over a day. Until 6AM, the RRH is fully run by grid
supply when the sunlight is not available or empty energy storage in the battery bank.
Table 4.1: Simulation parameters
Parameters Value
Resource block
System bandwidth, BW
Carrier frequency, fc
Cell radius
BS transmit power
Noise power density
Cell layout
Reference distance, d0
Path loss exponent,
Shadow fading,
Maximum storage capacity,
Storage factor, μ
Traffic model
180 kHz
10 MHz
2 GHz
1000 m
43 dBm
-174 dBm/Hz
Hexagonal
100m
3.574
8 dB
4 kWh
0.92 i.e. 8% loss
Tempo-spatial diversity
On-grid consumption sharply falls down to zero level with the availability of
incoming solar energy generation. As observed, the grid energy consumption is zero
for a prolonged period of time (i.e., 8AM to 7PM for 1kW panel capacity). During
day time the batteries store excess electricity generation for future use after fulfill the
RRH demand. As seen, grid energy savings are widen for the higher solar PV capacity
leading to substantial improvement of network performance. On the other hand, once
again grid electricity is required to serve associated UEs in the absence of green
energy storage. However, 4kW solar panel attains an improved performance as
evident form the figure. It can be concluded that the maximum utilization of green
energy significantly reduces grid consumption. In contrary, conventional C-RAN
always tends to run using grid power and thereby, our proposed system shows
superior performance. Figure 4.2 presents the throughput performance of C-RAN over

40
1AM 6AM 11AM 3PM 9PM 12AM0
0.5
1
1.5
2
2.5
Hours of a day
On
gri
d p
ow
er
co
ns
um
pti
on
(k
W)
Conventional C-RAN
Proposed network with 1kW solar PV
Proposed network with 2kW solar PV
Proposed network with 3kW solar PV
Proposed network with 4kW solar PV
Figure 4.1: Comparison of on grid power consumption of the proposed C-RAN with different
solar module capacity and conventional C-RAN.
1AM 6AM 11AM 4PM 9PM 12AM0
0.5
1
1.5
2
2.5
3
3.5
4
4.5x 10
5
Hours of a day
Th
rou
gh
pu
t (k
bp
s)
Conventional C-RAN
Proposed C-RAN
Figure 4.2: Throughput of the proposed C-RAN and conventional C-RAN.

41
a day. The throughput curve apparently follows the given traffic demand graph as
observed from the figure. In addition, the throughput curves for both the proposed
system and conventional C-RAN overlap with each other. This is due to the
throughput is entirely depends on system bandwidth as well as resource blocks (RB)
and independent on power consumption. We assume one user occupies one RB and
thus, it follows the given traffic distribution. Therefore, the nature of power
consumption by RRH doesn't make any change on data transmission rate.
1AM 6AM 11AM 4PM 9PM 12AM10
20
30
40
50
60
70
Hours of a day
En
erg
y e
ffic
ien
cy
(K
bit
s/j
ou
le)
Conventional C-RAN
Proposed network with 1kW solar PV
Proposed network with 2kW solar PV
Proposed network with 3kW solar PV
Proposed network with 4kW solar PV
Figure 4.3: Comparison of EE perfomance between proposed C-RAN and conventional C-
RAN.
Figure 4.3 demonstrates the comparison of EE performance the proposed model with
conventional C-RAN over a period of a day. According to the definition, EE is
inversely related to the net grid power consumption ( ). The minimum grid power
consumption is found for 4kW solar panel in Figure 4.1 and hence, superior EE
performance is obtained under this condition as clearly seen from the figure.
However, all the four curves involved with hybrid scheme follows a similar pattern.
During midnight to early morning, EE falls down due to the absence of sunlight and is
found to reach infinity for the prolonged period with the solar energy availability. The

42
break lines identify the infinity region that indicates there is no on-grid energy
consumption. Under this condition, the RRHs are fully powered by stored solar
energy implying the best EE performance is achieved. As mentioned in table 4.2,
during some period on grid power consumption ( ) goes to zero as the stored solar
energy at that period fully neutralized the demand of on-grid consumption. Since the
throughput is same for all hybrid schemes, EE of proposed network varies with an
installed solar capacity. The figure also includes the EE metric curve of the
conventional C-RAN scheme which shows inferior performance compared to our
proposed model. However, the empty region of the proposed C-RAN hybrid model is
comparatively wider for 4kW energy harvester capacity compared to others.
Therefore, the proposed network with 4kW solar PV exhibits better EE performance.
On the other hand, EE curves shifts downward once again as the stored green energy
is much lower to feed RRH load demand during night. Furthermore, EE gap is more
noticeable in night time due to the variation of energy storage capability.
Table 4.2: Comparison of power consumption
Network model
Solar PV capacity Hours of a day On grid
consumption
Proposed RE-
CRAN
1kW PV 08.00AM – 07.00PM Nill
2 kW PV 08.00AM – 08.00PM Nill
3 kW PV 08.00AM – 09.00PM Nill
4 kW PV 08.00AM – 10.00PM Nill
Conventional
C-RAN
No solar PV
used 01.00 AM– 12.00 AM Always Present
Figure 4.4 illustrates the energy efficiency gain of our proposed model for different
solar capacities. As seen, the proposed hybrid system with 4kw solar capacity has
been identified as 129% more energy efficient C-RAN than the 1kW PV capacity.
From the aforementioned analysis, it can be easily inferred that proposed C-RAN with
greater solar capacity is a preferred in the context of green cellular communication.

43
1kW 2kW 3kW 4kW0
0.5
1
1.5
2
2.5
3
3.5
EE
gain
Figure 4.4: Energy efficiency gain for the proposed C-RAN network varying solar capacity.
5 10 15 200
500
1000
1500
2000
2500
3000
3500
EE
(K
bp
s/W
att)
Bandwidth (MHz)
Conventional 1kw 2kw 3kw 4kw
Figure 4.5: Comparison on EE performance of Macrocell RRH with bandwidth varying solar
module capacity.

44
A comparison of key network performance metric, i.e., EE with bandwidth for
conventional system and different solar module capacity is demonstrated in Figure
4.5. The EE decreases with the increment of bandwidth because the grid power
consumption is increased at this time. Therefore, the proposed network with 4kW
solar PV exhibits better EE performance. Because, 4kW solar PV has muchmore
energy harvester capacity compared to others.
4.3.2 Energy efficiency analysis of the proposed hybrid network with DG supply
This section also analyze the proposed network performance in terms of diesel power
consumption, excess electricity, Greenhouse gas (GHG) emissions impact and energy
efficiency for different solar PV capacities (1kW, 2kW, 3kW and 4kW). However, the
results presented in this section are analyzed for two different BS type varying
transmission power.
Figure 4.6 illustrates the input power consumption for omnidirectional and tri-sector
2/2/2 configurations with 2 different transmission power (i.e., 43 dBm and 46 dBm
1AM 6AM 11AM 4PM 9PM 12AM0
200
400
600
800
1000
1200
Hours of a day
Po
we
r c
on
su
mp
tio
n (
Wa
tt)
NTRX
= 1, PTX
= 20W
NTRX
= 1, PTX
= 40W
NTRX
= 6, PTX
= 20W
NTRX
= 6, PTX
= 40W
Figure 4.6: Input power consumption for a single RRH with two different transmitting power
and antenna pattern.

45
1 2 3 40
2000
4000
6000
8000
10000
12000
14000
16000
18000
Solar module capacity (kW)
ED
G
(Wh
)
NTRX
= 6, PTX
= 20W
NTRX
= 6, PTX
= 40W
Figure 4.7: Comparison of diesel power consumption with two different transmission powers.
1AM 6AM 11AM 4PM 9PM 12AM0
0.5
1
1.5
2
2.5
Hours of a day
Ca
rbo
n e
mis
sio
n (
kg
)
DG only
DG with solar PV
Figure 4.8: Comparison of emission of the proposed hybrid network with non-hybrid
network.
over a day. A BS with 2/2/2 pattern implies that each macrocell are configured with
three sectors and each sector have two antennas. As expected, power consumption of

46
2/2/2 is higher than the omnidirectional configuration. Besides, a high the value of
transmission power ( ) resulting in higher input power consumption.
Figure 4.7 illustrates the DG energy production with installed solar panel capacity for
tri-sector RRH enabled macrocell RRH varying transmission power. As observed, a
higher value of solar module capacity indicates lower value of diesel consumption. A comparison of pollution intensive carbon emissions of proposed hybrid (DG + PV)
network with non-hybrid (DG only) network is demonstrated in Figure 4.8. It is clear
from figure, the proposed system attains an improved performance as it produces
lower amount of greenhouse gas emission.
1 2 3 40
2
4
6
8
10
12
14
16
18
Solar module capacity(kW)
Ca
rbo
n f
oo
tpri
nts
(K
g)
NTRX
= 6, PTX
= 20W
NTRX
= 6, PTX
= 40W
Figure 4.9: Comparison of emission with two different transmission power.
Figure 4.9 demonstrates the pollution intensive carbon emissions with different solar
module capacity for two different transmission power. Both curves are rapidly goes
down to reach their minimum value with the increment of PV array capacity and
follows similar pattern of Figure 4.7 as explained beforehand. Since high results
greater power consumption and consequently pushed the DG operating hour to cope

47
with the BS load demand. In addition, GHG emission factor is linearly scaled with
as well as operating hours. As a result, = 40W produces greater amount of
emissions compared to 20W transmission power as mentioned in table 4.3.
On the other hand, the amount of emissions is found lower for the higher PV
array capacity. Solar EH can alone carry the BS load demand for omni- directional
configuration where no DG module is required. This is because, the energy
consumption for = 20W and = 40W is 2694Wh and 3373Wh respectively.
Whereas 1kW solar panel with dual tracking mode produce 3910Wh according to (1).
Therefore, surplus energy is remained in battery bank for further use in the absence of
solar energy. In other words, the C-RAN with omnidirectional configuration fully run
by green energy sources and hence emits zero carbon emission that considered as an
eco-friendly solution. The challenges of RE variability can be mitigated by storing
surplus electricity to the energy storage system.
Table 4.3: Comparison of emission with two different transmission powers.
Solar module capacity
(kW)
Energy produced from
DG, (kWh) DG fuel
consum-ption
(L/kWh)
Required diesel (L)
𝑜 Emissi
-on (Kg/L)
Carbon footprints (Kg)
= 6,
= 20W
= 6,
= 40W
= 6, = 20W
= 6, = 40W
1 12.258 16.33
0.38
4.65804
2.68
12.48355 16.63047
2 8.348 12.42 3.17224 8.501603 12.64853
3 4.438 8.51 1.68644 5.45361 8.666584
4 0.528 4.6 0.20064 0.537715 4.68464
From Figure 4.10 it is clearly observed that, greater the module capacity resulting in
higher the surplus energy. The amount of surplus electricity improves the system

48
reliability ensuring the zero outage. The excess solar energy can be shared to the
neighboring BS via physically installed power cables for further enhancing EE.
1 2 3 40
2000
4000
6000
8000
10000
12000
14000
Solar module capacity (kW)
Su
rplu
s E
lectr
icit
y (
Wh
)
NTRX
= 1, PTX
= 20
NTRX
= 1, PTX
= 40
Figure 4.10: Comparison of excess energy generation for omnidirectional configuration.
1AM 6AM 11AM 4PM 9PM 12AM0
200
400
600
800
1000
1200
1400
1600
1800
2000
Hours of a day
En
erg
y e
ffic
ien
cy (
kb
its/jo
ule
)
1kW solar PV
2kW solar PV
3kW solar PV
4kW solar PV
Figure 4.11: Comparison on EE performance varying solar module capacity for a RRH with
2/2/2 tri-sector antenna.

49
Figure 4.11 represents the EE performance of a RRH with 2×2×2 tri-sector antenna.
Until 6AM, the RRH is fully run by DG supply whatever the solar module capacity.
Because, the sunlight is not available at this time. The DG consumption sharply falls
down to zero level with the availability of incoming solar energy generation. The
minimum DG power consumption is found for 4kW solar panel in Figure 4.7 and
hence, superior EE performance is obtained under this condition. However, all the four
curves follows a similar pattern. During midnight to early morning, EE falls down due
to the absence of sunlight and is found to reach infinity for the prolonged period with
the solar energy availability. The break lines identify the infinity region that indicates
there is no DG consumption. However, 4kW solar panel attains an improved
performance as evident form the figure. It can be concluded that the maximum
utilization of green energy significantly minimizes the DG consumption.
4.3.3 Energy efficiency analysis of proposed hybrid network under different UA schemes
Figure 4.12 presents the comparison of throughput among the different UA schemes
of the proposed network over a day along with conventional schemes. As seen from
5
1AM 6AM 11AM 4PM 9PM 12AM0
0.5
1
1.5
2
2.5
3
3.5
4
4.5x 10
SINR-based
Traffic aware-based
Green energy-based
Conventional (Distance-based)
Th
rou
gh
pu
t (k
bp
s)
Hours of a day
Figure 4.12: Throughput of the proposed C-RAN and conventional C-RAN.

50
the figure, throughput curves clearly follow the traffic pattern in a day. It is also
observed that, the throughput at peak traffic hour is higher than the low traffic hour.
From the all hybrid proposed models along with the conventional distance-based
model, the SINR-based model gives the highest throughput performance for its
improved SINR performance.
Figure 4.13 demonstrates the EE comparison of the proposed model with the
conventional C-RAN over a period of a day. In accordance with the definition, EE is
directly proportional to the throughput. Since SINR-based UA provides higher
throughput, hence it provides higher EE than other hybrid schemes. The figure also
shows that the EE curve of energy-based scheme gives inferior performance compared
to our other proposed model. This is because, the installed 4kW solar capacity is not
sufficient to run a RRH in whole day solely as shown in Figure 4.1. However, all the
four curves involved with hybrid scheme follows a similar pattern. Between midnight
to early morning, EE falls owing to the absence of sunlight and is found to reach
infinity for the prolonged period with the solar energy availability. The break lines
identify the infinity region that indicates there is no grid energy consumption.
1AM 6AM 11AM 4PM 9PM 12AM0
20
40
60
80
100
120
140
Hours of a day
En
erg
y e
ffic
ien
cy
(k
bit
s/jo
ule
)
Green energy-based
Conventional (Distance-based)
Traffic aware-based
SINR-based
Figure 4.13: Comparison of EE perfomance between proposed C-RAN and conventional C-
RAN.

51
-0.4
-0.2
0
0.2
0.4
0.6
EE
ga
in
SINR-based Traffic aware-based Green energy-based
0.8
Figure 4.14: Energy efficiency gain for the proposed C-RAN network with different UA policies for 4kW solar PV.
1AM 6AM 11AM 4PM 9PM0
0.2
0.4
0.6
0.8
1
1.2
1.4
1.6
1.8
Hours of a day
On
gri
d p
ow
er
co
ns
um
pti
on
(k
W)
6kW solar PV
8kW solar PV
10kW solar PV
12kW solar PV
12AM
Figure 4.15: Comparison of on grid power consumption of proposed C-RAN with different
solar module capacity.

52
Figure 4.14 shows the energy efficiency gain of proposed model for different UA
policies. As seen, the proposed hybrid system with SINR-based has been identified as
62% and 83% more energy efficient than the traffic aware and green energy-based
algorithm.
0
0.2
0.4
0.6
EE
ga
in
SINR-based Traffic aware-based Green energy-based
0.8
Figure 4.16: Energy efficiency gain for the proposed C-RAN network with different UA
policies for 12kW solar PV.
Another quantitative comparison of the energy efficiency gain of proposed model for
different UA policies is demonstrated in Figure 4.16. It has been observed that, the
proposed hybrid system with green energy-based is now identified as 72% and 180%
more energy efficient than the SINR-based and traffic aware-based algorithm. This is
because, the installed 12kW solar capacity is sufficient to run a RRH in whole day
solely as shown in Figure 4.15.
It can be concluded that, if the installed solar module capacity is sufficient to run a
RRH in whole day, the green energy-based UA scheme will provides superior
performance than the others schemes.
4.4 Chapter summary
In this chapter, a comprehensive results analysis have thoroughly been investigated in
order to measure the effectiveness of the proposed system model in terms of EE and

53
EE gain metrics varying system parameters such as throughput, bandwidth, solar
module capacity, on-grid power consumption, etc. under different user association
policies. Furthermore, details parameters of simulation setup has also been focused.
Thereafter, a comprehensive Monte-Carlo based MATLAB simulations considering
both tri-sector and omnidirectional antenna with hexagonal cell layout have been
carried out to evaluate the EE performance.

54
Chapter 5
Conclusions and Future works
5.1 Conclusions
In order to cope up with fast growing and ubiquitous mobile data usage, cellular
network has to be expanded worldwide. Consequently more and more BSs are needed
to be deployed. As BSs is the main energy hungry elements in a network power usage
in cellular network would also increase tremendously. For this concern energy
efficiency discussion is one of the paramount issues of today‘s high speed cellular
network system.
This thesis has proposed and investigated an energy efficiency of C-RAN with hybrid
supplies. In addition, different UA schemes integrate with the proposed architectures
for further EE improvement. The system performance has thoroughly been
investigated using Monte Carlo based MATLAB simulation taking into account
several limiting factors. Finding for different analysis of this thesis are summarized as
below.
i. This thesis has proposed and investigated hybrid powered C-RAN
architectures to enhance EE. More specifically, various dynamic user
association policies and integrate with the proposed architectures for further
EE improvement.
ii. On-grid energy consumption of the proposed hybrid system has been
observed. The maximum utilization of green energy significantly reduces grid
consumption.
iii. A comparison of pollution intensive carbon emissions of proposed hybrid (DG
+ PV) network with non-hybrid (DG only) network has been demonstrated
and the proposed hybrid system has improved performance than the non-
hybrid network.

55
iv. EE performance and EE gain performance of the considered hybrid scheme
with different solar PV modules capacities has been observed. C- RAN with
4kW PV capacity has been identified as 129% more energy efficient than with
1kW PV capacity.
v. EE and EE gain has been improved significantly with different UA schemes.
vi. SINR-based UA scheme has been identified as 62% and 83% more energy
efficient than the traffic aware and green energy-based algorithm respectively
when there is insufficient green energy to run RRH during the whole day.
vii. Green energy-based UA scheme has been identified as 72% and 180% more
energy efficient than the SINR-based and traffic aware-based algorithm
respectively when there is sufficient green energy to run RRH during the
whole day.
5.2 Future works
At the current stage of the propose research, developed dynamic network operation
mechanism have much room for being improved and extended in several interesting
directions. Some of these potential researches opening are summarized below.
Cost assessment: In C-RAN architecture, the optical fiber between BBU pool
and RRHs has to carry a large amount of total cost. Hence, future work will
focus on the generalized algorithms for C-RAN architecture with cost
assessment.
Energy cooperation: Energy cooperation among RRHs is the key to achieve
higher energy efficiency. A renewable energy cooperation of C-RAN
networks paradigm can be explored for improving energy efficiency
performance.
User association in heterogeneous C-RAN: A User-RRH pairing and
resource allocation strategy in heterogeneous C-RAN can be improved energy
efficiency. A stochastic geometry model for user association in H-CRAN can
be improved which can be considered as a future focus for thorough study.

56
References
[1] World Economic Forum, ―The Global Information Technology Report: ICTs
for Inclusive Growth,‖ 2015.
[2] Hasan, Z., Boostanimehr, H. and Bhargava, V.K., ―Green Cellular Networks:
A Survey, Some Research Issues and Challenges,‖ IEEE Communications
Surveys and Tutorials, vol. 13, Sep. 2011, pp. 524-540 (2011).
[3] Son, K., Kim, H., Yi, Y. and Krishnamachari, B., ―Base Station Operation and
User Association Mechanisms for Energy-Delay Tradeoffs in Green Cellular
Networks,‖ IEEE Journal on Selected Areas in Communications, vol. 29, June
2011, pp. 1525-1536 (2011).
[4] Ismail, M., Zhuang, W., Serpedin, E. and Qaraqe, K., ―A Survey of Green
Mobile Networking: From the Perspectives of Network Operators and Mobile
Users,‖ IEEE Communications Surveys and Tutorials, vol. 17, Mar. 2015, pp.
1535-1556 (2015).
[5] Wu, J., Zhang, Z., Hong, Y., et al., ―Cloud radio access network (C-RAN): a
primer,‖ IEEE Network, vol. 29, Feb. 2015, pp. 35-41 (2015).
[6] Pompili, D., Hajisami, A. and Viswanathan, H., ―Dynamic provisioning and
allocation in Cloud Radio Access Networks (C-RANs),‖ Ad Hoc Networks,
vol. 30, Mar. 2015, pp. 128–143 (2015).
[7] Lin, Y., Shao, L., Zhu, Z., Wang, Q. and Sabhikhi, R. K., ―Wireless network
cloud: Architecture and system requirements,‖ IBM Journal of Research and
Development, vol. 54, Apr. 2010, pp. 1 – 4 (2010).
[8] ―C-RAN The Road Towards Green RAN,‖ China Mobile Research Institute,
Tech. Rep., Oct. 2011.
[9] Checko, A., et al., ―Cloud RAN for mobile networks—A technology
overview,‖ IEEE Communications Surveys & Tutorials, vol. 17, Sep. 2014, pp.
405-426 (2014).
[10] Checko, A., Kardaras, G., Lanzani, C., Temple, D., Mathiasen, C., Pedersen, L.
A., and Klaps, B., ―OTN Transport of Baseband Radio Serial Protocols in C-
RAN Architecture for Mobile Network Applications,‖ MTI Mobile and Altera,
Tech. Rep., Mar. 2014.
[11] Zhang, D., Chen, Z., Cai, X.L., et al., ―Resource allocation for green cloud
radio access networks with hybrid energy supplies,‖ IEEE Transactions on

57
Vehicular Technology, vol. 67, Feb. 2018, pp. 1684-1697 (2018).
[12] Zeng, D., Zhang, J., Guo, S., Gu, L. and Wang, K., ―Take renewable energy
into C-RAN toward green wireless access networks,‖ IEEE Network, vol. 31,
Jul. 2017, pp. 62–68 (2017).
[13] He, X., Chen, Y., Chai, K. K. and Zhang, T., ―Energy efficient resource
allocation in heterogeneous cloud radio access networks,‖ IEEE Wireless
Communications and Networking Conference (WCNC), May 2017, pp. 1558-
2612 (2017).
[14] Chia, Y. K., Sun, S., and Zhang, R., ―Energy Cooperation in Cellular Networks
with Renewable Powered Base Stations,‖ IEEE Wireless Communications and
Networking Conference (WCNC), vol. 13, Dec. 2014, pp. 6996 - 7010 (2014).
[15] GPP TR 32.826, Telecommunication management; Study on Energy Savings
Management (ESM), (Release 10), Mar. 2010.
[16] ITU-T Focus Group on Future Networks (FG FN), FG-FN OD-66, Draft
Deliverable on ―Overview of Energy Saving of Networks‖, Oct. 2010.
[17] ―Energy Aware Radio and NeTwork TecHnologies (EARTH)‖.
https://www.ict-earth.eu/
[18] Towards Real Energy-efficient Network Design (TREND)‖. http://www.fp7-
trend.eu/
[19] ―Cognitive Radio and Cooperative strategies for Power saving in multistandard
wireless devices (C2POWER)‖. http://www.ict-c2power.eu/
[20] Yan, C., Zhang, S., Xu, S., and Li, G. Y., ―Fundamental trade-offs on green
wireless networks,‖ IEEE Communications Magazine, vol. 49, 2011, pp. 3037
(2011).
[21] Jahid, A., Shams, A. B., and Hossain, M. F., ―Energy cooperation among BS
with hybrid power supply for DPS CoMP based cellular networks,‖ IEEE
International Conference on Electrical, Computer and Telecommunication
Engineering (ICECTE), Rajshahi, Bangladesh, Dec. 2016, pp. 1-4 (2016).
[22] Han, T., and Ansari, N., ―On optimizing green energy utilization for cellular
networks with hybrid supplies,‖ IEEE Transactions on Wireless
Communications, vol. 12, 2013, pp. 3872-3882 (2013).
[23] Mao, Y., Zhang, J., and Letaief, K. B., ―A lyapunov optimization approach for
green cellular networks with hybrid energy supplies,‖ IEEE Journal on
Selected Areas in Communications, vol. 33, 2015, pp. 2463–2477 (2015).

58
[24] Zhai, D., Sheng, M., Wang, X., and Li, Y.,―Leakage-aware dynamic resource
allocation in hybrid energy powered cellular networks,‖ IEEE Transactions
Communications, vol. 63, 2015, pp. 4591–4603 (2015),
[25] Yang, J., Yang, Q., Shen, Z., and Kwak, K. S., ―Suboptimal online resource
allocation in hybrid energy supplied ofdma cellular networks,‖ IEEE
Communications Letters, vol. 20, 2016, pp. 1639–1642 (2016).
[26] Yang, B., Shen, Y., Han, Q., Chen, C., Guan, X., and Zhang, W., ―Energy-
efficient resource allocation for time-varying OFDMA relay systems with
hybrid energy supplies,‖ IEEE Systems Journal, vol. 12, Mar. 2018, pp. 702-
713 (2018).
[27] Sheng, M., Zhai, D., Wang, X., Li, Y., Shi, Y., and Li, J., ―Intelligent energy
and traffic coordination for green cellular networks with hybrid energy
supplies,‖ IEEE Transactions on Vehicular Technology, vol. 66, Feb. 2017, pp.
1631 – 1646 (2017).
[28] Chamola, V., Sikdar, B., and Krishnamachari, B., ―Delay aware resource
management for grid energy savings in green cellular base stations with hybrid
power supplies,‖ IEEE Transactions on Communications, vol. 65, Mar. 2017.
[29] Han, T., and Ansari, N., ―On optimizing green energy utilization for cellular
networks with hybrid energy supplies,‖ IEEE Transactions on Wireless
Communications, vol. 12, Aug. 2013, pp. 3872 – 3882 (2013).
[30] Jahid, A., Ahmad, A. S., and Hossain, M. F., ―Energy efficient BS cooperation
in DPS CoMP based cellular networks with hybrid power supply,‖ IEEE
International Conference on Computer and Information Technology (ICCIT),
Dhaka, Bangladesh, Dec. 2016, pp. 93-98 (2016).
[31] Nahas, M., Abdul-Nabi, S., Bouchnak, L., and Sabeh, F., ―Reducing Energy
Consumption in Cellular Networks by Adjusting Transmitted Power of Base
Stations,‖ Symposium on Broadband Networks and Fast Internet (RELABIRA),
Baabda, Lebanon, May 2012.
[32] Pompili, D., Hajisami, A., and Viswanathan, H., ―Dynamic provisioning and
allocation in Cloud Radio Access Networks (C-RANs),‖ Ad Hoc Networks,
vol. 30, Jul. 2015, pp. 128–143 (2015).
[33] Chamola, V., and Sikdar, B., ― Solar powered cellular base stations: current
scenario, issues and proposed solutions,‖ IEEE Communications magazine, vol.
54, May 2016, pp. 108-14 (2016).

59
[34] Liu, C., and Natarajan, B., ―Power management in heterogeneous networks
with energy harvesting base stations,‖ Physical Communication, vol.16, Sep.
2015, pp.14-24 (2015).
[35] Jahid, A., Shams, A. B., and Hossain, M. F., ―Energy efficiency of JT CoMP
based green powered LTE-A cellular networks,‖ IEEE Conference on Wireless
Communications, Signal Processing and Networking (WiSPNET), Chennai,
India, Mar. 2017, pp. 1768-1774 (2017).
[36] Jahid, A., and Hossain, M. S., ―Energy-cost aware hybrid power system for
off-grid base stations under green cellular networks,‖ IEEE International
Conference on Electrical Information and Communication Technology (EICT),
Khulna, Bangladesh, Dec. 2017, pp. 1-6 (2017).
[37] Jahid, A., Shams, A. B., and Hossain, M. F., ―Energy cooperation among BS
with hybrid power supply for DPS CoMP based cellular networks,‖ IEEE
International Conference on Electrical, Computer and Telecommunication
Engineering (ICECTE), Rajshahi, Bangladesh, Dec. 2016, pp. 1- 4 (2016).
[38] Han, T., and Ansari, N., ―On optimizing green energy utilization for cellular
networks with hybrid supplies,‖ IEEE Transactions on Wireless
Communications, vol. 12, May 2013, pp. 3872-3882 (2013).
[39] Lin, Y., Shao, L., Zhu, Z., Wang, Q., and Sabhikhi, R. K., ―Wireless network
cloud: Architecture and system requirements,‖ IBM Journal of Research and
Development, vol. 54, Apr. 2010, pp. 1 – 4 (2010).
[40] Checko, A., Christiansen, H. L., Yan, Y., Scolari, L., Kardaras, G., Berger, M.
S., and Dittmann, L., ―Cloud ran for mobile networks a technology overview,‖
IEEE Communication and Surveys Tutorials, vol. 17, Sep. 2015, pp. 405–426
(2015).
[41] China Mobile Research Institute. C-RAN The Road Towards Green RAN.
White Paper, Oct. 2011.
[42] Segel, J., lightRadio Portfolio: White Paper 3. Tech. rep. Alcatel-Lucent Bell
Labs, 2011.
[43] Huawei, "Cloud RAN Introduction," The 4th CJK International Workshop –
Technology Evolution and Spectrum. Sept. 2011.
[44] ZTE Green Technology Innovations White Paper. Tech. rep. ZTE, 2011.
[45] Guan, H., Kolding, T., and Merz, P.,. "Discovery of Cloud-RAN. Tech. rep.
Nokia Siemens Networks," Apr. 2010.

60
[46] Intel Heterogenous Network Solution Brief. Tech. rep. 2011.
[47] Flanagan, T., "Creating cloud base stations with TI‘s KeyStone multicore
architecture," Tech. rep. Texas Instruments, October 2011.
[48] Rowell, C., Han, S., Xu, Z., Li, G., and Pan, Z., ―Toward Green and Soft: a 5G
Perspective,‖ Communications Magazine, vol. 52, Feb. 2014.
[49] Hwang, B. Song, and Soliman, S., ―A Holistic View on Hyper-Dense Hetero-
geneous and Small Cell Networks,‖ Communications Magazine, vol. 51, Feb.
2013.
[50] Liu, W., Han, S., Yang, C., and Sun, C., ―Massive MIMO or Small Cell
Network: Who is More Energy Efficient?,‖ Wireless Communications and
Networking Conference Workshops (WCNCW), Apr. 2013, pp. 24–29 (2013).
[51] Madden, J., "Cloud RAN or Small Cells?" Tech. rep. Mobile Experts, April
2013.
[52] Zhou, S., Zhao, M., Xu, X., Wang, J., and Yao, Y., ―Distributed wireless
communication system: a new architecture for future public wireless access,‖
Communications Magazine, vol. 41, Mar. 2003.
[53] Peng, M., Li, Y., Zhao, Z., and Wang, C., ―System architecture and key
technologies for 5G heterogeneous cloud radio access networks,‖ Network, vol.
29, Mar. 2015, pp. 6–14 (2015).
[54] Chen, C., C-RAN: the Road Towards Green Radio Access Network.
Presentation. August 2012.
[55] Irmer, R., Droste, P., and Marsch, M., et. al. ―Coordinated multipoint:
Concepts, performance, and field trial results,‖ Communications Magazine,
vol. 49, Mar. 2011, pp. 6–14 (2011).
[56] Huiyu, Y., Naizheng, Z., Yuyu, Y., and Skov, V., ―Performance Evaluation of
Co- ordinated Multipoint Reception in CRAN Under LTE-Advanced uplink,‖
7th International ICST Conference on Communications and Networking in
China (CHINACOM), Aug. 2012, pp. 778–783 (2012).
[57] Dufkova, K., Bjelica, M., Moon, B., and Kencl, L., ―Energy savings for cellular
network with evaluation of impact on data traffic performance,‖ IEEE
European Wireless Conference, pp. 916-923, Apr. 2010.
[58] Holtkamp, H., Auer, G., Giannini, V., and Haas, H., ―A parameterized base
station power model,‖ IEEE Communications Letters, vol. 17, Sep. 2013, pp.
2033-2035 (2013).

61
[59] L. Huang and M. Neely, ―Utility optimal scheduling in energy-harvesting
networks,‖ IEEE/ACM Transactions Network, vol. 21, no. 4, pp. 1117–1130,
2013.
[60] 3GPP, ―Requirements for Further Advancements For Evolved Universal
Terrestrial Radio Access (E-UTRA) (LTE-Advanced) (Release 10),‖ TR
36.913, V 10.0.0, 2011.


![Parvin Aktar M.A. B.Ed. Assistant teacher[English] Dhalla union council high school](https://static.fdocuments.in/doc/165x107/568160c1550346895dcfe956/parvin-aktar-ma-bed-assistant-teacherenglish-dhalla-union-council-high-56cb5d640b134.jpg)