MSIT 413: Wireless Technologies - Northwestern University
101
N O R T H W E S T E R N U N I V E R S I T Y MSIT | Master of Science in Information Technology MSIT 413: Wireless Technologies Week 2 Michael L. Honig Department of EECS Northwestern University September 2017 1
Transcript of MSIT 413: Wireless Technologies - Northwestern University

N O R T H W E S T E R NU N I V E R S I T Y
MSIT | Master of Science in Information Technology
MSIT 413: Wireless Technologies Week 2
Michael L. Honig Department of EECS
Northwestern University
September 2017 1

N O R T H W E S T E R NU N I V E R S I T Y
MSIT | Master of Science in Information Technology
Wireless Standards: Our Focus
Cellular PAN MAN LAN Sensor/IoT GSM CDMA2000 WCDMA UMTS 1xEVDO 1xEVDV 1G/2G/3G LTE (4G) 3GPP/3GPP2 5G
WiFi 802.11a/ac/b/g/n
802.16 WiMax
Bluetooth ZigBee Z-Wave NFC Sigfox Neul LoRaWAN
2

N O R T H W E S T E R NU N I V E R S I T Y
MSIT | Master of Science in Information Technology
Classification of Wireless Systems
• Cellular • Wireless Local Area Networks (WLANs) • Wireless Metropolitan Area Networks
(WMANs) • Wireless Personal Area Networks (WPANs) • Sensor Networks
3

N O R T H W E S T E R NU N I V E R S I T Y
MSIT | Master of Science in Information Technology
Comparison of Wireless Systems
4

N O R T H W E S T E R NU N I V E R S I T Y
MSIT | Master of Science in Information Technology
Wireless Local Area Networks (WLANs)
• Very high data rates (up to 600 Mbps/user!)
• Low mobility within confined region (building or campus)
• Unlicensed bands – Industrial, Scientific, Medical (ISM): 2.4 GHz – National Information Infrastructure (UNII): 5 GHz
• Must accept interference, therefore uses spread spectrum signaling, or random access with collision avoidance.
• Family of standards (IEEE 802.11)
5

N O R T H W E S T E R NU N I V E R S I T Y
MSIT | Master of Science in Information Technology
Overview of 802.11 Standard
IEEE 802.11
IEEE 802.11b Extension
2 Mbps DQPSK
1 Mbps DBPSK
1 Mbps 2GFSK
2 Mbps 4GFSK
Diffuse IR DS-SS FHSS
850 to 950 nm 2.4 GHz
6
11 Mbps DQPSK-CCK
5.5 Mbps DQPSK-CCK

N O R T H W E S T E R NU N I V E R S I T Y
MSIT | Master of Science in Information Technology
7
Overview of 802.11 Standard
IEEE 802.11
11 Mbps DQPSK-CCK
5.5 Mbps DQPSK-CCK
IEEE 802.11b Extension
2 Mbps DQPSK
1 Mbps DBPSK
1 Mbps 2GFSK
2 Mbps 4GFSK
Diffuse IR DS-SS FHSS
850 to 950 nm 2.4 GHz
discontinued
discontinued

N O R T H W E S T E R NU N I V E R S I T Y
MSIT | Master of Science in Information Technology
WLAN Family of Standards: 802.11 • 802.11:
2 Mbps (with fallback to 1 Mbps), 1997 & 1999
• 802.11b: provides additional 5.5 and 11 Mbps rates in the 2.4 GHz band
• 802.11a: provides up to 54 Mbps in the 5 GHz band
• 802.11g: Supports roaming, higher rate, backward compatible with 802.11b
• 802.11n: High throughput amendment using multiple antennas (Multi-Input Multi-Output (MIMO))
• 802.11ac: High throughput in 5 GHz band (> 1 Gbps) using wider bandwidth, multi-user MIMO 8

N O R T H W E S T E R NU N I V E R S I T Y
MSIT | Master of Science in Information Technology
Additional 802.11 Standards • 802.11ad (WiGig): up to 7 Gbps in 60 GHz band (2016) • 802.11ax: enhancement of 11ac, introduces OFDMA, scheduling • 802.11e: QoS & Security Enhancements • 802.11f: Inter Access Point Protocol (IAPP) • 802.11h: Power Management for 5 GHz in Europe • 802.11i: Security enhancements • 802.11j: Enhancements to 802.11a for operation in Japan • 802.11k: Radio resource management • 802.11m: Technical corrections and clarifications • 802.11u: Interfacing with external networks • 802.11v: Upper layer interface for managing 802.11 equipment
9

N O R T H W E S T E R NU N I V E R S I T Y
MSIT | Master of Science in Information Technology
802.11a/b/g/n Comparison
Comparison table
10

N O R T H W E S T E R NU N I V E R S I T Y
MSIT | Master of Science in Information Technology
Integrated WLAN-Cellular Network
MS
cellular! WISP/Operator Hotspot!
BTS"
As the user moves, different access choices become available.!
Internet!
BSC
AP"AP"AP"
Home! Enterprise!
Ethernet"segments"
AP"
Application Servers!
N O R T H W E S T E R NU N I V E R S I T Y
MSIT | Master of Science in Information Technology
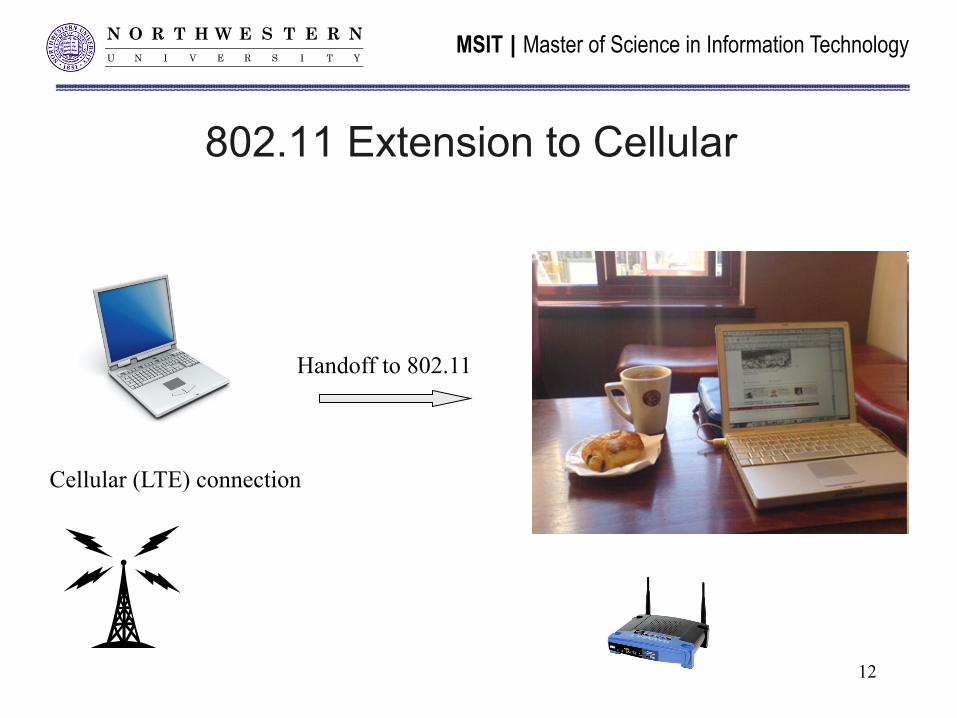
802.11 Extension to Cellular
Handoff to 802.11
Cellular (LTE) connection
12

N O R T H W E S T E R NU N I V E R S I T Y
MSIT | Master of Science in Information Technology
Integrated WLAN/Cellular Network
• High data rates at hot spots covered by WLANs. • Lower data rates elsewhere provided by cellular. • Single account; single bill • Roaming, session mobility • Common applications and services • Cellular traffic à WiFi offload
13

N O R T H W E S T E R NU N I V E R S I T Y
MSIT | Master of Science in Information Technology
Classification of Wireless Systems
• Cellular • Wireless Local Area Networks (WLANs) • Wireless Metropolitan Area Networks
(WMANs) • Wireless Personal Area Networks (WPANs) • Sensor Networks
14

N O R T H W E S T E R NU N I V E R S I T Y
MSIT | Master of Science in Information Technology
Personal Area Networks (PANs)
15

N O R T H W E S T E R NU N I V E R S I T Y
MSIT | Master of Science in Information Technology
Bluetooth: A Global Specification for Wireless Connectivity
• Wireless Personal Area Network (WPAN).
• Provides wireless voice and data over short-range radio links via low-cost, low-power radios (“wireless” cable).
• Initiated by a consortium of companies (IBM, Ericsson, Nokia, Intel)
• IEEE standard: 802.15.1 16

N O R T H W E S T E R NU N I V E R S I T Y
MSIT | Master of Science in Information Technology
Bluetooth Specifications
• Allows small portable devices to communicate together in an ad-hoc “piconet” (up to eight connected devices).
• Frequency-hopped spread-spectrum in the 2.4 GHz UNII band.
• Range set at 10m.
• Gross data rate of 1 Mbps (TDD). – 64 kbps voice channels
• Interferes with 802.11b/g/n
• Second generation (Bluetooth 3.0+) supports rates up to 25 Mbps. Competes with Wireless USB.
17

N O R T H W E S T E R NU N I V E R S I T Y
MSIT | Master of Science in Information Technology
Wireless Challenges
18

N O R T H W E S T E R NU N I V E R S I T Y
MSIT | Master of Science in Information Technology
Today
• Cellular terminology • Interference and capacity (voice) • Performance measures (SINR, user capacity) • Blocking and grade of service • Channel assignments
19

N O R T H W E S T E R NU N I V E R S I T Y
MSIT | Master of Science in Information Technology
Cellular Concept
Cellular Switch (MTSO)
Handoff
Enables frequency reuse!
PSTN
Low power Transmitters
Location Database
Micro- cells
20

N O R T H W E S T E R NU N I V E R S I T Y
MSIT | Master of Science in Information Technology
Cellular Frequency Assignments
E D
F
C A
E B
G D
C
E
A B
C
D F
A G
B A
G D
C
B A
F G
C G D
A D
B C
F E
G
B
cell cluster (contains all channels) co-channel cells
21

N O R T H W E S T E R NU N I V E R S I T Y
MSIT | Master of Science in Information Technology
Example of Cellular Layout
drive test plots Opensignal.com
22
N O R T H W E S T E R NU N I V E R S I T Y
MSIT | Master of Science in Information Technology
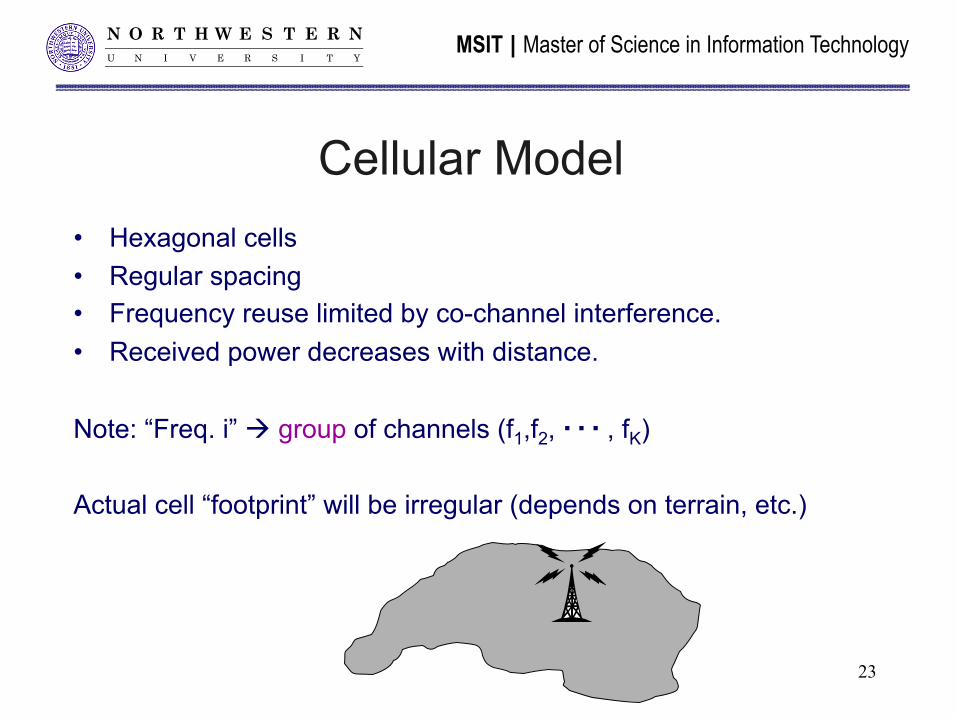
Cellular Model • Hexagonal cells • Regular spacing • Frequency reuse limited by co-channel interference. • Received power decreases with distance.
Note: “Freq. i” à group of channels (f1,f2, , fK) Actual cell “footprint” will be irregular (depends on terrain, etc.)
…
23

N O R T H W E S T E R NU N I V E R S I T Y
MSIT | Master of Science in Information Technology
Cellular Terminology
• Cell cluster: group of N neighboring cells which use the complete set of available frequencies.
• Cell cluster size: N
• Frequency reuse factor: 1/N
• Uplink or reverse link: Mobiles à Base station
• Downlink or forward link: Base station à mobiles
• Co-channel cells: cells which are assigned the same frequencies
C
D F
A
B A
F G
C G D
A D
B C
F E
G
B
cell cluster
24

N O R T H W E S T E R NU N I V E R S I T Y
MSIT | Master of Science in Information Technology
Frequency Reuse (Ex) • Given
– 50 MHz for Frequency Division Duplex (FDD) cellular
– 200 kHz simplex channel (one direction) – Cell cluster size N=3
• Channel Bandwidth (BW) = • Total available channels = • Available channels per cell =
25

N O R T H W E S T E R NU N I V E R S I T Y
MSIT | Master of Science in Information Technology
Frequency Reuse (Ex) • Given
– 50 MHz for Frequency Division Duplex (FDD) cellular
– 200 kHz simplex channel (one direction) – Cell cluster size N=3
• Channel Bandwidth (BW) = 2 x 200 = 400 kHz • Total available channels = 50,000/400 = 125 • Available channels per cell = 125/3 ≈ 41
26

N O R T H W E S T E R NU N I V E R S I T Y
MSIT | Master of Science in Information Technology
Co-Channel Cells
A
A A
A
A
A
A
i=3, j=2 N=i2+ij+j2=19
For hexagonal model, N is restricted: N=i2+ij+j2, where i, j are positive integers
Other examples: i= j=1 è N=3 i=0, j=2 è N=4 i=1, j=2 è N=7 i=2, j=2 è N=12
27

N O R T H W E S T E R NU N I V E R S I T Y
MSIT | Master of Science in Information Technology
Example with i=j=1 (N=3)
C A
C A
B A
C B
B A
C
C B
C A
B B A
A C
A C
B A
C
B
cell cluster
Cell cluster shape also covers the plane. 28
N O R T H W E S T E R NU N I V E R S I T Y
MSIT | Master of Science in Information Technology
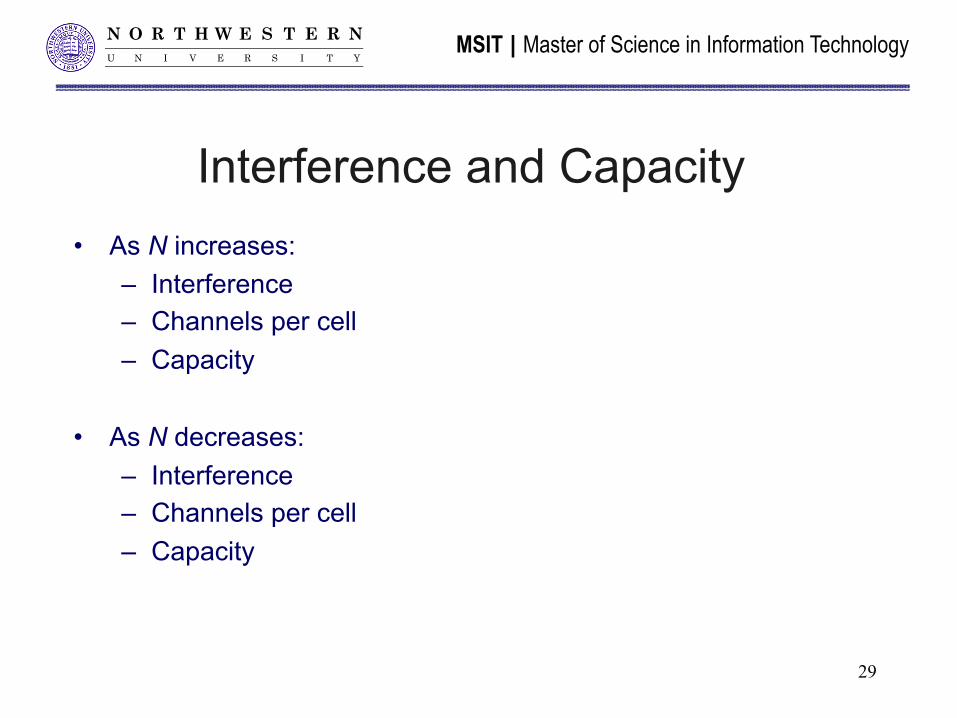
Interference and Capacity • As N increases:
– Interference – Channels per cell – Capacity
• As N decreases: – Interference – Channels per cell – Capacity
29

N O R T H W E S T E R NU N I V E R S I T Y
MSIT | Master of Science in Information Technology
Interference and Capacity • As N increases:
– Interference decreases – Channels per cell decrease – Capacity decreases
• As N decreases: – Interference increases – Channels per cell increase – Capacity increases
Objective: choose the minimum N subject to acceptable interference levels. 30

N O R T H W E S T E R NU N I V E R S I T Y
MSIT | Master of Science in Information Technology
Sources of Interference
31

N O R T H W E S T E R NU N I V E R S I T Y
MSIT | Master of Science in Information Technology
Sources of Interference • Other users – Multiple-Access interference • Multipath (reflections of signals) • Other devices or systems (e.g., in unlicensed band)
• Categories: – Co-channel (frequency bands coincide) – Adjacent-channel
frequency Channel 1 Channel 2
power Note: as transmitted power increases, so does the interference
32

N O R T H W E S T E R NU N I V E R S I T Y
MSIT | Master of Science in Information Technology
802.11b/g/n Channels (2.4 GHz)
• 14 overlapping (staggered) channels (11 in the U.S.) • Center frequencies are separated by 5 MHz • Bandwidth/interference controlled by “spectral mask”
– 30 dB attenuation 11 MHz from center frequency – 50 dB attenuation 22 MHz from center frequency
Channels: 1 6 11
Comparison table
33
frequency à

N O R T H W E S T E R NU N I V E R S I T Y
MSIT | Master of Science in Information Technology
Co-Channel Reuse Ratio
1 2
5 4
3 . R
1 2
5 4
7 6
3 .
D
7 6
NRD 3=
From hexagonal geometry
As D/R increases, interference decreases (improved isolation between co-channel cells). 34

N O R T H W E S T E R NU N I V E R S I T Y
MSIT | Master of Science in Information Technology
Co-Channel Reuse Ratio • Small D/R:
– Small N, large number of channels/cell – More interference (fixed cell size)
• Large D/R: – Small capacity – Less interference (improved call quality)
• Numerical examples: i=1, j=0 è N=1, D/R= √3 i= j =1 è N=3, D/R= 3 i=1, j=2 è N=7, D/R= 4.58 i=2, j=2 è N=12, D/R= 6
35

N O R T H W E S T E R NU N I V E R S I T Y
MSIT | Master of Science in Information Technology
Performance Measure: Signal-to-Interference-Plus-Noise Ratio (SINR)
• Expressed in dB (10 log (SINR))
• Typically, the interference power dominates (ignore noise) – SINR à Signal-to-Interference Ratio (SIR or S/I)
• Total interference power is the sum over all interferers:
– More co-channel users à more interference
Power Noise Power ceInterferenPower Signal Received
+=SINR
36

N O R T H W E S T E R NU N I V E R S I T Y
MSIT | Master of Science in Information Technology
Why is SINR Important?
37

N O R T H W E S T E R NU N I V E R S I T Y
MSIT | Master of Science in Information Technology
Why is SINR Important? • The data rate depends on SINR:
• Recall the Shannon rate: R = B log2 (1 + SINR) – B is bandwidth (Hz), rate is measured in bits per second – Is it better to increase bandwidth or power?
• Why is SINR important for a voice service?
SINR (dB)
Data rate (bits/sec)
actual curve depends on technology.
38

N O R T H W E S T E R NU N I V E R S I T Y
MSIT | Master of Science in Information Technology
Why is SINR Important?
• For a voice service, R is fixed (say, around 10 kbps). This determines a minimum SINR that is required:
SINR
Data rate
voice rate
required SINR
• Smaller SINR à more co-channel users can be served • Required SINR for voice users in cellular systems:
– 1G (AMPs): SINR ≥ 18 dB ≈ 63.1 – 2G (GSM): SINR ≥ 12 dB ≈ 16 – 2G (CDMA): SINR ≥ 7 dB ≈ 5 – 3G (CDMA): SINR ≥ 3-5 dB ≈ 2-3 39

N O R T H W E S T E R NU N I V E R S I T Y
MSIT | Master of Science in Information Technology
First Tier Interference: Uplink
Mobile-to-Cell Site Interference (Uplink)
6 co-channel cells (due to hexagonal cells) à 6 times the interference from a single cell
40

N O R T H W E S T E R NU N I V E R S I T Y
MSIT | Master of Science in Information Technology
First Tier Interference: Downlink
Cell Site-to-Mobile Interference (Downlink)
6 co-channel cells (due to hexagonal cells) à 6 times the interference from a single cell
41

N O R T H W E S T E R NU N I V E R S I T Y
MSIT | Master of Science in Information Technology
Signal Attenuation
reference distance d0
distance d
Reference power at reference distance d0 Path loss exponent
In dB: Pr = P0 (dB) – 10 n log (d/d0)
Pr (dB)
log (d)
slope = -10n, n ~ 2 to 4 for urban cellular
P0
log (d0)

N O R T H W E S T E R NU N I V E R S I T Y
MSIT | Master of Science in Information Technology
First Tier Co-Channel Cells
1 R
D First Tier
Interfering Cell
Signal power S ≈ P0 (R/d0)-n Total Interference power
I ≈ 6 P0 (D/d0)-n Therefore S/I = R-n/(6D-n) = (D/R)n/6 S/I (dB) = 10n log (D/R) – 10 log 6 = 10n log (3N)1/2 – 10 log 6 (will take n=4)
43

N O R T H W E S T E R NU N I V E R S I T Y
MSIT | Master of Science in Information Technology
D
Same Principle for Other Wireless Devices
Interfering router
Signal power S ≈ P0 (R/d0)-n Total Interference power
I ≈ 3 P0 (D/d0)-n Therefore S/I = R-n/(6D-n) = (D/R)n/3 S/I (dB) = 10n log (D/R) – 10 log 3 = 10 n log (3N)1/2 – 10 log 3 (will take n=4)
R
44

N O R T H W E S T E R NU N I V E R S I T Y
MSIT | Master of Science in Information Technology
SIR vs. Frequency Reuse
S/I (dB) = 40 log (3N)1/2 – 10 log 6
Cell cluster size N
Sig
nal-t
o-In
terfe
renc
e R
atio
(dB
)
45

N O R T H W E S T E R NU N I V E R S I T Y
MSIT | Master of Science in Information Technology
S/I Example
• Suppose desired S/I = 10 dB = 10
• From the graph, we can take N=3, that is, we need a 3-cell reuse pattern.
• But is this really adequate?
46

N O R T H W E S T E R NU N I V E R S I T Y
MSIT | Master of Science in Information Technology
Worst Case Interference
R
D D+R
D+R
D-R
D-R
D
D
Recalculating the S/I taking into account the different distances between co-channel cells would give an S/I < 10 dB. To make sure the S/I ≥ 10 dB, we must increase N à 4 (i=0, j=2), for which the S/I = 14 dB. However, even 14 dB may not allow for additional Impairments due to different terrains, imperfect cell site location. Hence taking N=7 is safer… Drawback?
47

N O R T H W E S T E R NU N I V E R S I T Y
MSIT | Master of Science in Information Technology
Worst Case Interference
R
D D+R
D+R
D-R
D-R
D
D
Recalculating the S/I taking into account the different distances between co-channel cells would give an S/I < 10 dB. To make sure the S/I ≥ 10 dB, we must increase N à 4 (i=0, j=2), for which the S/I = 14 dB. However, even 14 dB may not allow for additional Impairments due to different terrains, imperfect cell site location. Hence taking N=7 is safer… Changing N=3 à N=7 reduces the capacity by a factor of 3/7!
48

N O R T H W E S T E R NU N I V E R S I T Y
MSIT | Master of Science in Information Technology
To Increase Capacity in Cellular Systems:
49

N O R T H W E S T E R NU N I V E R S I T Y
MSIT | Master of Science in Information Technology
To Increase Capacity in Cellular Systems:
• Buy more spectrum • Antenna sectoring • Cell splitting • Different cell configurations (zone microcell) • Power control • Migrate to higher efficiency systems
1G à 2G à 3G à 4G (LTE)
50

N O R T H W E S T E R NU N I V E R S I T Y
MSIT | Master of Science in Information Technology
To Increase Capacity in Cellular Systems:
• Assign more spectrum • Antenna sectoring • Cell splitting • Different cell configurations (zone microcell) • Power control • Migrate to higher efficiency systems
1G à 2G à 3G à 4G (WiMAX or LTE)
51
N O R T H W E S T E R NU N I V E R S I T Y
MSIT | Master of Science in Information Technology
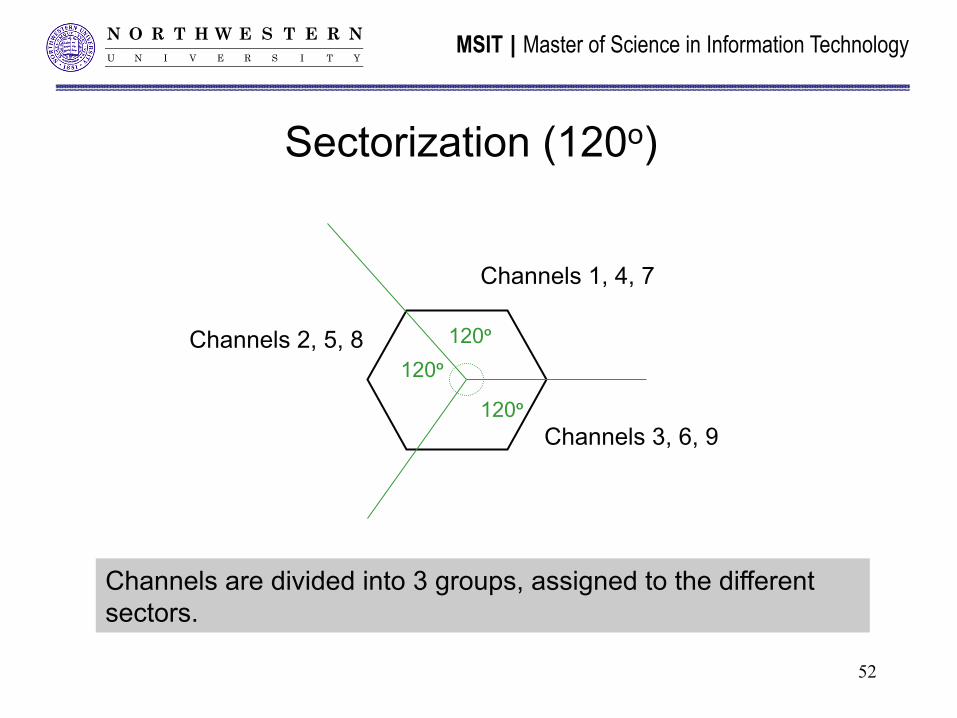
Sectorization (120o)
120o
52
120o
120o
Channels are divided into 3 groups, assigned to the different sectors.
Channels 1, 4, 7
Channels 2, 5, 8
Channels 3, 6, 9

N O R T H W E S T E R NU N I V E R S I T Y
MSIT | Master of Science in Information Technology
Sectorization (120o)
120o
Two Interferers in First Ring per Sector
Cell Site-to-Mobile Interference (Downlink) Mobile-to-Cell Site Interfaces (Uplink)
120o
120o
Use directional antennas to reduce the number of interferers from 6 to 2. S/I increases by factor of 3 (about 5 dB)
53

N O R T H W E S T E R NU N I V E R S I T Y
MSIT | Master of Science in Information Technology
60o Sectorization One Interferer in First Tier per Sector
Cell Site-to-Mobile Interference (Downlink) Mobile-to-Cell Site Interfaces (Uplink)
60o 60o
60o
60o
60o 60o
Number of interferers reduced from 6 to 1. S/I increases by factor of 6 (about 8 dB).
54

N O R T H W E S T E R NU N I V E R S I T Y
MSIT | Master of Science in Information Technology
R D + 0.7 R
60o Sectorization: Worst Case Interference
. .
M
.
. D
2
1
Even larger improvement relative to worst-case omni-directional antennas (about 11 dB).
55
N O R T H W E S T E R NU N I V E R S I T Y
MSIT | Master of Science in Information Technology
Disadvantages of Sectoring
56

N O R T H W E S T E R NU N I V E R S I T Y
MSIT | Master of Science in Information Technology
Disadvantages of Sectoring
• Additional complexity • Increased handoffs
(can be accommodated at base station instead of cellular switch (MTSO), so not a major concern)
• Less effective in dense urban environments due to scattering of radio waves across sectors.
• Reduced trunking efficiency
57

N O R T H W E S T E R NU N I V E R S I T Y
MSIT | Master of Science in Information Technology
“Smart” Antennas (Beamforming)
Different beams can use the same frequency!
Narrow “beam” focused on one user
This is one type of Multi-Input Multi-Output (MIMO) technology. 58

N O R T H W E S T E R NU N I V E R S I T Y
MSIT | Master of Science in Information Technology
To Increase Capacity in Cellular Systems:
• Assign more spectrum • Antenna sectoring • Cell splitting • Different cell configurations (zone microcell) • Power control • Migrate to higher efficiency systems
1G à 2G à 3G à 4G (WiMAX or LTE)
59

N O R T H W E S T E R NU N I V E R S I T Y
MSIT | Master of Science in Information Technology
Cell Splitting
4 7
1
2 1
3 6
5
3
Growing by Splitting Cell 4 Into Cells of Small Size
7
1
2
1
3 6
5
3
(4) (2)
(3) (6)
(7) (5)
(1)
Smaller cells è lower power, more channels available per unit area. 60

N O R T H W E S T E R NU N I V E R S I T Y
MSIT | Master of Science in Information Technology
Mixed Micro/Macro Cells How to accommodate both pedestrian (low-mobility) and high-mobility users?
Micro-cell overlay reduces capacity of macro-cellular network!
High power (expensive) Transmitters
Micro-cell (e.g., city block)
Low power (inexpensive) transmitters
Macro-cell (1-2 mile radius)
61
N O R T H W E S T E R NU N I V E R S I T Y
MSIT | Master of Science in Information Technology
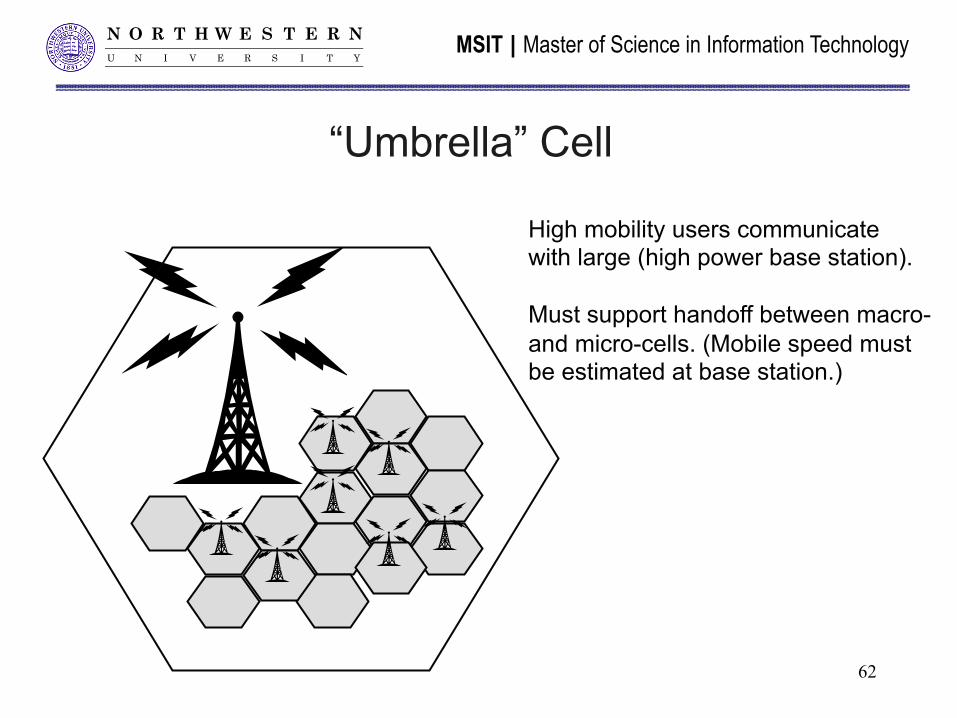
“Umbrella” Cell
High mobility users communicate with large (high power base station). Must support handoff between macro- and micro-cells. (Mobile speed must be estimated at base station.)
62

N O R T H W E S T E R NU N I V E R S I T Y
MSIT | Master of Science in Information Technology
802.11 Extension to Cellular
Handoff to 802.11
Cellular connection
63

N O R T H W E S T E R NU N I V E R S I T Y
MSIT | Master of Science in Information Technology
To Increase Capacity in Cellular Systems:
• Assign more spectrum • Antenna sectoring • Cell splitting • Different cell configurations (zone microcell) • Power control • Migrate to higher efficiency systems
1G à 2G à 3G à 4G (WiMAX or LTE)
64

N O R T H W E S T E R NU N I V E R S I T Y
MSIT | Master of Science in Information Technology
Zone Microcells
x
xR
T
x
xR
T
Base Station
x
xR
T
Zone
Sel
ecto
r Microwave or fiber optic link
• Any channel can be assigned to any zone. • No handoff between zones. • Radiation localized, improves S/I. • Highways, urban corridors.
65
“Remote Radio Heads”
N O R T H W E S T E R NU N I V E R S I T Y
MSIT | Master of Science in Information Technology
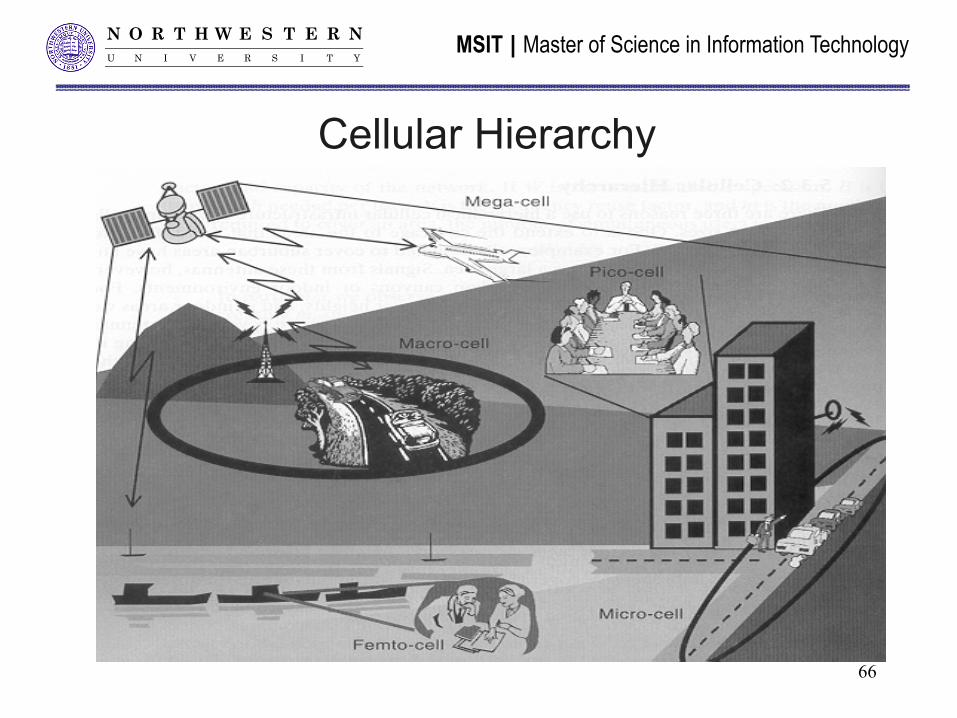
Cellular Hierarchy
66

N O R T H W E S T E R NU N I V E R S I T Y
MSIT | Master of Science in Information Technology
Remote Antennas / Radio Heads
67
Blue circles represent remote antennas or “radio heads”. Signals from a cluster of antennas are processed by a “Remote Central Processor”. Envisioned as part of 5G.

N O R T H W E S T E R NU N I V E R S I T Y
MSIT | Master of Science in Information Technology
To Increase Capacity in Cellular Systems:
• Assign more spectrum • Antenna sectoring • Cell splitting • Different cell configurations (zone microcell) • Power control • Migrate to higher efficiency systems
2G à 3G à 4G (LTE) à 5G?
68

N O R T H W E S T E R NU N I V E R S I T Y
MSIT | Master of Science in Information Technology
Power Control and System Migration
• Power control – Advantages?
69

N O R T H W E S T E R NU N I V E R S I T Y
MSIT | Master of Science in Information Technology
Power Control and System Migration • Power control
– Minimizes interference – Saves battery power – Solves “near-far” problem (crucial in CDMA)
70

N O R T H W E S T E R NU N I V E R S I T Y
MSIT | Master of Science in Information Technology
Power Control and System Migration • Power control
– Minimizes interference – Saves battery power – Solves “near-far” problem (crucial in CDMA)
• Migration to 3G/4G/802.11 extensions… – Target S/I decreases;
enables increased frequency reuse • IS-136 (2G) requires S/I > 12 dB à N=4 • GSM (2G) requires S/I > 9 dB à N=3 • IS-95 requires S/I > 7 dB (N=1) • CDMA 2000 requires S/I > 3-5 dB (depending on mobility)
71

N O R T H W E S T E R NU N I V E R S I T Y
MSIT | Master of Science in Information Technology
Will 4G Satisfy Projected Demand?
72

N O R T H W E S T E R NU N I V E R S I T Y
MSIT | Master of Science in Information Technology
Increases in Cellular Capacity Capacity(SpectralEffi
ciency
73
N O R T H W E S T E R NU N I V E R S I T Y
MSIT | Master of Science in Information Technology
Trunking and Grade of Service (GoS) Idea (trunking): Allocate channels on a per-call basis.
Select from pool of available channels.
74

N O R T H W E S T E R NU N I V E R S I T Y
MSIT | Master of Science in Information Technology
Trunking and Grade of Service (GoS) Idea (trunking): Allocate channels on a per-call basis.
Select from pool of available channels.
time
System capacity
Number of Calls in progress
1
2
3
4
blocked or delayed call
service times
Example: set of channels is (f1, f2, f3)
f2 f3 f2 f2 f1 f1 call arrival f1
75

N O R T H W E S T E R NU N I V E R S I T Y
MSIT | Master of Science in Information Technology
Grade of Service (GoS)
• GoS measures: – Blocking probability – Probability that delay > time T
(e.g., maximum acceptable delay for voice call)
• GoS pertains to busiest hour (e.g., rush hour)
• GoS depends on: – ??
76

N O R T H W E S T E R NU N I V E R S I T Y
MSIT | Master of Science in Information Technology
Grade of Service (GoS)
• GoS measures: – Blocking probability – Probability that delay > time T
(e.g., maximum acceptable delay for voice call)
• GoS pertains to busiest hour (e.g., rush hour)
• GoS depends on: – Number of channels – Call arrival rate λ– Average holding time H
Traffic engineering problem: determine the number of channels so that GoS meets some target performance (e.g., Prob of blocking < 2%). 77

N O R T H W E S T E R NU N I V E R S I T Y
MSIT | Master of Science in Information Technology
Traffic Intensity Traffic intensity is defined as λ H, and measured in Erlangs.
Example: λ=1 call/minute, H= 1 minute, λ H = 1 Erlang è on average, users request 1 channel λ H = ½ Erlang è there are no requests for channels more than
50% of the time
f1
f2
fC
Offered traffic (“load”) λ H = A Channel
assignment
Offered traffic is not the same as the carried traffic, due to blocking!
Departing, or “carried” traffic
C channels . . .
78

N O R T H W E S T E R NU N I V E R S I T Y
MSIT | Master of Science in Information Technology
Erlang B Formula (1917) • Formula for computing blocking probability assuming:
– Blocked calls disappear – Requests for channel arrive according to a Poisson random
process (inter-arrival times are independent, exponentially distributed)
• Applies to infinite user population
– C channels available – Exponentially distributed
service time – Blocking probability formula:
time
Prob(call lasts < t secs) 1
3 minutes
1-e-t/τ
“Blocked calls cleared” formula (A = λH) 79

N O R T H W E S T E R NU N I V E R S I T Y
MSIT | Master of Science in Information Technology
Erlang B Curves
80

N O R T H W E S T E R NU N I V E R S I T Y
MSIT | Master of Science in Information Technology
Erlang C Formula
• Blocked calls enter a queue • First come, first served • Call is blocked if queuing delay D > T • Formula for probability of blocking given in text.
81

N O R T H W E S T E R NU N I V E R S I T Y
MSIT | Master of Science in Information Technology
Example
• Take PB = 2%, C=5 è Offered load A < 1.7 Erlangs
• If each user is busy 1/10 of the time (0.1 Erlang/user), Total # users < 17 (maximum)
• For C=10: A < 5 Erlangs or 50 users
• For C=100: A=88 or 880 users
• Observation: A/C (or users per channel) increases with C (e.g., 10 groups of 10 channels can support only 500 users)
• Trunking efficiency increases as C increases
82

N O R T H W E S T E R NU N I V E R S I T Y
MSIT | Master of Science in Information Technology
Trunking Efficiency
• Refers to the traffic intensity (Erlangs) that can be supported given a fixed number of channels and a target blocking probability.
• For a fixed blocking probability: – Trunking efficiency improves with the number of channels.
è Best to pool as many channels as possible.
83

N O R T H W E S T E R NU N I V E R S I T Y
MSIT | Master of Science in Information Technology
Voice Capacity • Defined as
– Example: SE = 2 Erlangs/MHz/km2
è 1 MHz supports 2 Erlangs/km2 (Note that 1 km2 may correspond to a cell.)
– If on average, each user is active 1/10 of the time, then 1 Erlang corresponds to 10 users.
• Traffic per cell depends on…
)(kmarea Total(MHz)] bandwidth [Total(Erlangs) carried trafficTotal
2×
84

N O R T H W E S T E R NU N I V E R S I T Y
MSIT | Master of Science in Information Technology
• Defined as
– Example: SE = 2 Erlangs/MHz/km2 è 1 MHz supports 2 Erlangs/km2 (Note that 1 km2 may correspond to a cell.)
– If on average, each user is active 1/10 of the time, then 1 Erlang corresponds to 10 users.
• Traffic per cell depends on: – Number of channels – Grade of Service (e.g., typically 2%) – S/I requirement (determined by cluster size N)
)(kmarea Total(MHz)] bandwidth [Total(Erlangs) carried trafficTotal
2×
85
Voice Capacity

N O R T H W E S T E R NU N I V E R S I T Y
MSIT | Master of Science in Information Technology
Effect of Sectorization
• Does sectorization increase user capacity (Erlangs) per cell?
86

N O R T H W E S T E R NU N I V E R S I T Y
MSIT | Master of Science in Information Technology
Effect of Sectorization
• For fixed N, sectorization – Increases the S/I – Reduces trunking efficiency
• Example: 90 channels per cell, 120o sectors gives 30 channels per sector, which reduces the number of Erlangs that can be supported for a given blocking probability.
• Can we use sectorization to increase user capacity? – Yes, must also reduce N
• Increases channels per cell è increases user capacity • Increases interference, lowers S/I • Sectorization then increases S/I
87

N O R T H W E S T E R NU N I V E R S I T Y
MSIT | Master of Science in Information Technology
Channel Allocation
• Consider GSM: 25 MHz (simplex), 200 kHz channels à 125 channels (1 is used for control signaling)
• How to allocate channels to cells?
Suburb (lightly loaded)
Train station
Shopping mall
88

N O R T H W E S T E R NU N I V E R S I T Y
MSIT | Master of Science in Information Technology
Channel Allocation
• Consider GSM: 25 MHz (simplex), 200 kHz channels à 125 channels (1 is used for control signaling)
• How to allocate channels to cells? – Objective: equalize blocking probability
(target is around 2%)
• Fixed channel allocation assigns fixed set of channels to each cell – Drawback?
Suburb (lightly loaded)
Train station
mall
89

N O R T H W E S T E R NU N I V E R S I T Y
MSIT | Master of Science in Information Technology
Channel Allocation
• Consider GSM: 25 MHz (simplex), 200 kHz channels à 125 channels (1 is used for control signaling)
• How to allocate channels to cells? – Objective: equalize blocking probability
(target is around 2%)
• Fixed channel allocation assigns fixed set of channels to each cell. – Drawback: traffic is time-varying
• Dynamic channel allocation varies the number of channels per cell, depending on the load.
Suburb (lightly loaded)
Train station
mall
90

N O R T H W E S T E R NU N I V E R S I T Y
MSIT | Master of Science in Information Technology
Dynamic Channel Allocation
2,6 1,3
Channels already in use
5
1,3,4
new call: search for channel
91
N O R T H W E S T E R NU N I V E R S I T Y
MSIT | Master of Science in Information Technology
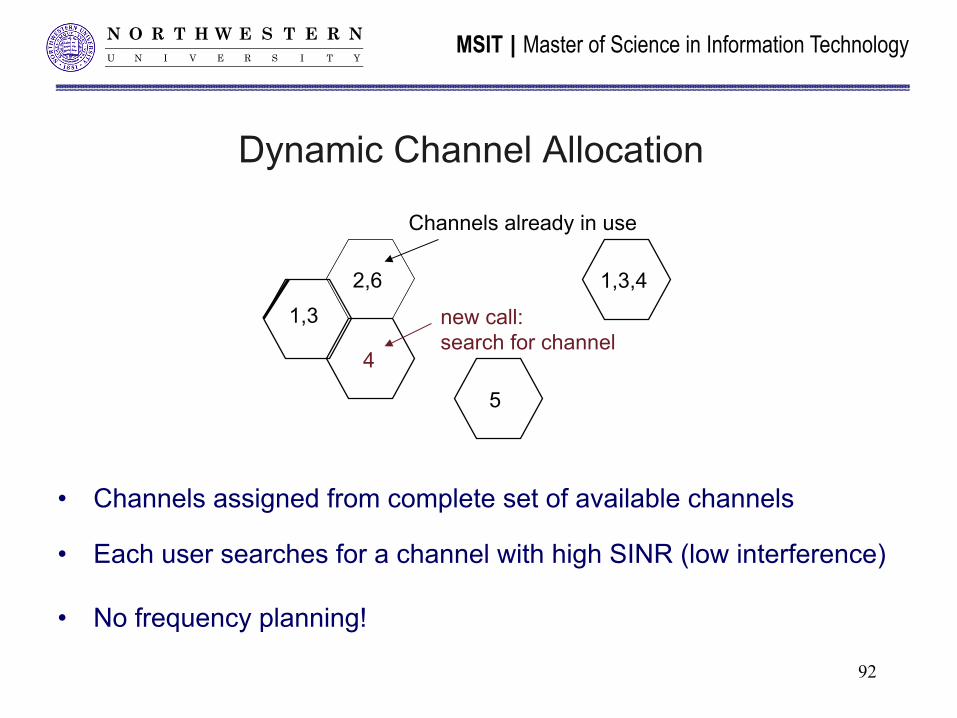
Dynamic Channel Allocation
• Channels assigned from complete set of available channels
• Each user searches for a channel with high SINR (low interference)
• No frequency planning!
2,6 1,3
Channels already in use
5
1,3,4
new call: search for channel
4
92

N O R T H W E S T E R NU N I V E R S I T Y
MSIT | Master of Science in Information Technology
802.11b/g/n Channels
• 14 overlapping (staggered) channels (11 in the U.S.) • Center frequencies are separated by 5 MHz • Bandwidth/interference controlled by “spectral mask”
– 30 dB attenuation 11 MHz from center frequency – 50 dB attenuation 22 MHz from center frequency
Channels: 1 6 11
Comparison table
93

N O R T H W E S T E R NU N I V E R S I T Y
MSIT | Master of Science in Information Technology
Dynamic Channel Allocation: 802.11b/g
Channel 6 Channel 1 Channel 11
94

N O R T H W E S T E R NU N I V E R S I T Y
MSIT | Master of Science in Information Technology
Dynamic Channel Allocation: 802.11b/g
Channel 6 Channel 1 Channel 11
Channel 6
Add new router
interference
95

N O R T H W E S T E R NU N I V E R S I T Y
MSIT | Master of Science in Information Technology
Dynamic Channel Allocation: 802.11b/g
Switches to channel 1 Channel 1 Channel 11
Channel 6
interference
96

N O R T H W E S T E R NU N I V E R S I T Y
MSIT | Master of Science in Information Technology
Dynamic Channel Allocation: 802.11b/g
channel 1 Switches to channel 6 Channel 11
Channel 6
interference
97

N O R T H W E S T E R NU N I V E R S I T Y
MSIT | Master of Science in Information Technology
Dynamic Channel Allocation: 802.11b/g
channel 1 channel 6 Channel 11
Switches to channel 1
interference
Dynamic channel assignment becomes unstable! 98

N O R T H W E S T E R NU N I V E R S I T Y
MSIT | Master of Science in Information Technology
Overlapping Channel Assignment
channel 1 channel 6 Channel 11
Channel 3
Interference (less than before) Interference
(less than before) power
frequency Channels: 1 3 6 99

N O R T H W E S T E R NU N I V E R S I T Y
MSIT | Master of Science in Information Technology
Channel Allocation • Objective: equalize grade of service (blocking probability) over coverage area
à Allows increase in subscriber pool.
• Fixed Channel Assignment (FCA): channels assigned to each cell are predetermined.
– Separate channels within a cell to avoid adjacent-channel interference – Nonuniform FCA: distribute channels among cells to match averaged traffic load
over time.
• Channel borrowing: borrow channels from neighboring cell – Temporary: high-traffic cells return borrowed channels – Static: channels are non-uniformly distributed and changed in a predictive manner to
match anticipated traffic
• Dynamic Channel Assignment (DCA): channels are assigned to each call from the complete set of available channels
– Must satisfy S/I constraint – Channels returned to pool after call is completed – Can be centralized (supervised by MSC) or distributed (supervised by BS) – Distributed DCA used in DECT 100

N O R T H W E S T E R NU N I V E R S I T Y
MSIT | Master of Science in Information Technology
FCA vs. DCA
• Moderate/High complexity – Must monitor channel occupancy,
traffic distribution, S/I (centralized)
• Better under light/moderate traffic
• Insensitive to changes in traffic
• Stable grade of service
• Low probability of outage (call termination)
• Suitable for micro-cellular systems (e.g., cordless)
• Moderate/high call setup delay • No frequency planning • Assignment can be centralized or
distributed
• Low complexity
• Better under heavy traffic • Sensitive to changes in traffic • Variable grade of service • Higher probability of outage
• Suitable for macro-cellular systems
(e.g., cellular)
• Low call setup delay • Requires careful frequency planning • Centralized assignment
DCA FCA
101