SEPTEMBER 8-12, 2014 INOGATE PIPELINE QRA SEMINAR PIPELINE QRA SEMINAR 1.

MSHA's Draft Quantitative Risk Assessment (QRA) of RCMD:
Current flaws and possible fixes
Comments of
Dr. Tony Cox, Cox & Associates
On behalf of
The National Mining Association
2-15-11 A6~4-CoMfi-74-Jt

Outline
• Hazard identification
• Exposure assessment
• Exposure-response relationship
• Risk characterization
• Uncertainty characterization
• Conclusions and recommendations

. '
Outline
• Hazard identification ~ omitted
• Exposure assessment ·
• Exposure-response relationship ~ omitted
• Risk characterization
• Uncertainty characterization ~ omitted
• Conclusions and recommendations

Outline
• Hazard identification ~ omitted
• Exposure assessment ~ incorrect/irrelevant
• Exposure-response relationship ~ omitted
• Risk characterization ~ incorrect
• Uncertainty characterization~ omitted
• Conclusions and recommendations -Risk if present standards ·enforced: not quantified
- Probability that tightening standard will not decrease risk: Not quantified
. .
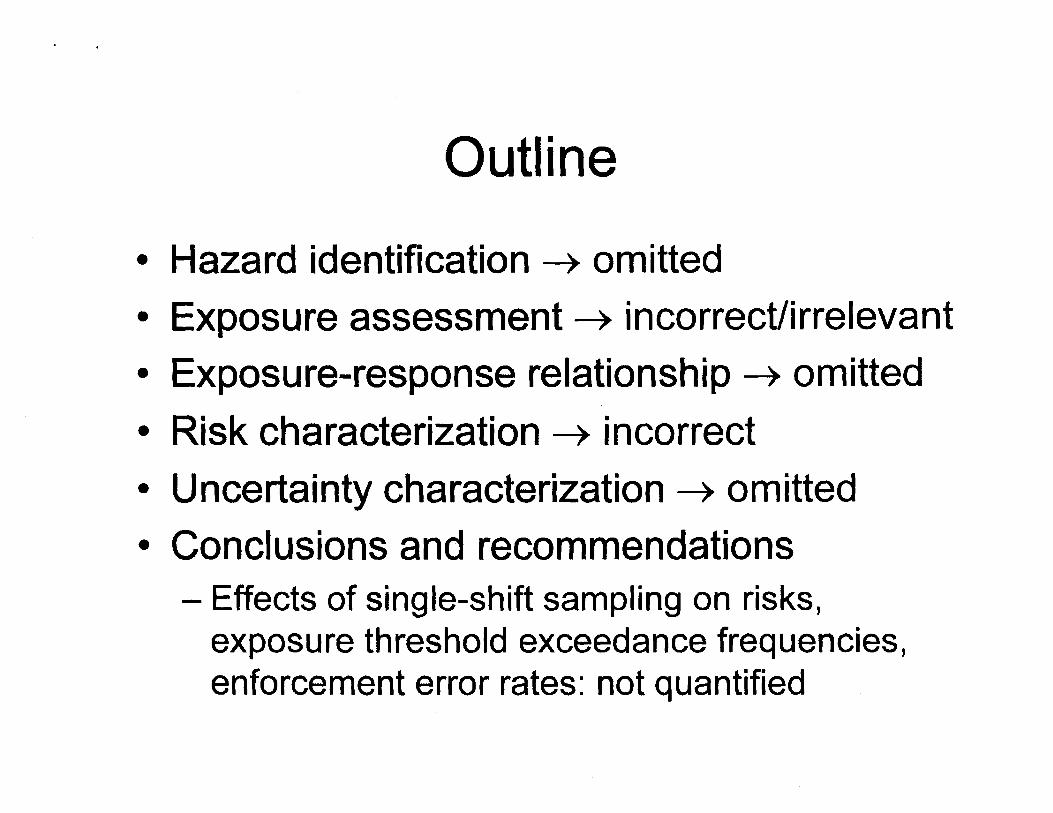
Outline
• Hazard identification~ omitted
• Exposure assessment ~ incorrect/irrelevant
• Exposure-response relationship ~ omitted
• Risk characterization~ incorrect
• Uncertainty characterization ~ omitted
• Conclusions and recommendations - Effects of single-shift sampling on risks,
exposure threshold exceedance frequencies, enforcement error rates: not quantified

Hazard identification • Do current levels of RCMD create an excess
risk of adverse human health effects? - What is the evidence, pro and con?
• Toxicological, clinical, epidemiological
- What is the weight of evidence?

Hazard identification • Do current levels of RCMD create an excess
risk of adverse human health effects? - What is the evidence, pro and con?
• Toxicological, clinical, epidemiological
- What is the weight of evidence?
• MSHA's QRA: Assume yes • Supporting rationale/evidence/critical
discussion: None • QRA skips hazard identification
- Proofiness: "The art of using bogus mathematical arguments to prove something that you know in your heart is true- even when it's not"

Regression of trends f:. causation
%Respirable Coat DJst Samples Exceeding Applicable standards for Designated
Occupations f*-cOBI oust·~ Target --.-coal ou& -Aaual] 20~---------------------
~~1 ·~ * :! l 5+-------------------------~ 0~--~----~----~----T---~
2002 2)03 2004 2005 2003
Exposure down ? ~?
FIGURE 2. Trends In coal workers' pneumoconiosis prevalence by tenure among examinees employed at underground coal mines - U.S. National Coal Workers• X-Ray Surveillance Program, 1987-2002
25
-20 ~ 0 -B 15
s::::: J? ~ 10 ~ a.
5
0
.. ~-
0-9 10-14 15-19
--. 20-24 .::,25
-........ ...... - ........ - ......... ___ ..::..=..:. ---- w----...___ '• • • • • • •' ' : ~::,:::.:, ....................... ··:.:::..:::_. ____ _
.. ·-·-· -·-·--~·-· 1987 1989 1991 1993 1995 1997 1999 2001
Years
Disease down
Proofiness: Attribute decline in lung diseases to tighter RCMD standards

Regression of trends f:. causation 60
50
l ~
~ 'A\lll'lt'n
l :'.10
20
10
0 1956 '960 1tl55 1070 ~g;:,
L_,
Figure 2: Trends in Cigarette Smoking Among Persona > 18 Years Old, by Gender-united Statea, 1955-1997 -Before 1992. current smckers were de~rr.ed as persons who r&portcd haven1; smoked~ 1 00 cigarettes and who currently smoked Since 1992 current smokers have been defulcd as persons who reportoo havtng smoked ~ 100 c1garenes during the•r hlettme and wnc reported srnokang every day or some days. Source of data: 1955 Curren! Populatton Survey. Nat o•~allnlorvtew Survey. 1965-1 997
Smoking down ? ~?
FIGURE 1. Number of slkosls deaths and 8Qe-adlusted 1110rtallty nte•, bv yearNallonal Occupalonal Respiratory Mortally System. Unttecl States,1968~
l.a;G 10
[J Number
1.0110 - RaUl • ! 7i)
~ i .. iGO
~flfmm - .
2 250
1.. IW2 19711 1910 181& 18 1111112 IGIIIi 3100
v..v
• ~r nullon l»ffOOS aged 2.15 yuars.
Disease down
Proofiness: Attribute decline in lung diseases to tighter RCMD standards

Regression: Wrong tool for the job • Regressing trend variables against each
other makes even independent variables (random walks) look "significantly correlated"l
II) -1 ~
~r\ 1., I
I· \ II !
I ·\ \~~ ~-c ~\ \vV \vi\;~
- J I I v \ >- l • I ' I
-a- II) .\ . ~~~r • ! I I\
~~
~~ 'J 'j
0 20 40 60 80 100
c(t. t)
t=4.94
Cb 0 -1 0
10
0
N -1 CDo • 0 0
0
~
0 -1 0 7 Cb cg
0 0 0
fiP 0 N -{ 0 .- 0 oo 0 • 0
-4·2 0 2 4
X
=>
I ~Jrb.G ~~sib-., 1
16~--------------------~ u... • •
• • 1~.1 • • ••
1J
> aj : ••••••••
6 •
, ... ~ . • • • :-1 • • • ••
•• ·J .,___,...____.-....-...,.........,..------t
·J ' a 1: 16 ~ ~L :a s~
X

Hazard identification • What would a sound hazard identification show? • Weight of evidence is that inflammation
mediated lung diseases caused by poorly soluble particulates have exposure-response thresholds. -E.g., "Tissues and cells respond to mild
oxidative stress by increasing antioxidant defenses. However, high levels of ROS/RNS may overwhelm antioxidant defenses, resulting in oxidant-mediated injury or cell death" (C )

Hazard identification • What would a sound hazard identification show? • Weight of evidence is that inflammation
mediated lung diseases caused by poorly soluble particulates have exposure-response thresholds.
• A useful risk assessment should address how current and proposed future standards affect exposures compared to such exposureresponse thresholds (or steep nonlinearities ). - Would tighter standards create incremental health benefits,
beyond those from enforcing current standards? - MSHA's QRA does not address thresholds ~ No answer

Exposure assessment
• Key question: Do currently permitted levels of exposure increase risk of harm?
• • c 0 Q. .. ! v ;c 0 ... ~ • v c • ., -v c -
Threshold Concentration
!
Chemical concentration

Exposure assessment
• Key question: Do currently permitted levels of exposure increase risk of harm?
• ., II: 0 s:L ., ! u ;c 0 ...
' • u c • G -v II: -
Threshold Concentration
! Past I Past mean extreme
Chemical concentration
Risks attributed to past mean cumulative exposures may have been caused by much higher extreme cumulative exposures.

Exposure assessment
• Key question: Do currently permitted levels of exposure increase risk of harm?
• • c 0 ID. • ! u ;c 0 ... l5 ., u c • 0 -u c -
Past mean
Threshold Concentration
! Past extreme
Chemical concentration
Risks attributed to past mean exposures may have been caused by much higher extreme exposures.

Exposure assessment
• Key question: Do currently permitted levels of exposure increase risk of harm?
• QRA does not actually address this question - QRA estimates future cumulative mean exposures, but
not past variances or response thresholds • Cumulative mean exposures have no known relevance to risk
- QRA simply assumes that the answer is yes. • Attributes harm to RCMD, without showing any causation
• Past harm may have resulted from higher-thancurrently-permitted exposures - Such exposures have not been estimated

Exposure assessment
• Estimates of mean cumulative exposures are inappropriate for risk assessment - Proposed measures that decrease exposure mean but increase
variance could still increase risk - Need to quantify upper tail of exposure distribution
• ., c 0 Q. ., ! u -X 0 .. • • u c • " -u c -
Threshold
Chemical concentration

Exposure assessment
• MSHA inflates its exposure ·estimates - One-way "adjustments" - Why not two-way? - Neglects to counter-adjust exposure-response estimates - Ignores measurement errors in exposure estimates ~ biases
Click to LOOK INSIDE! · ,:~:::;;;:~um:---·-'· · ~
.. ~ .. ; :
.: ...... _ :~• .-c. ·•. -
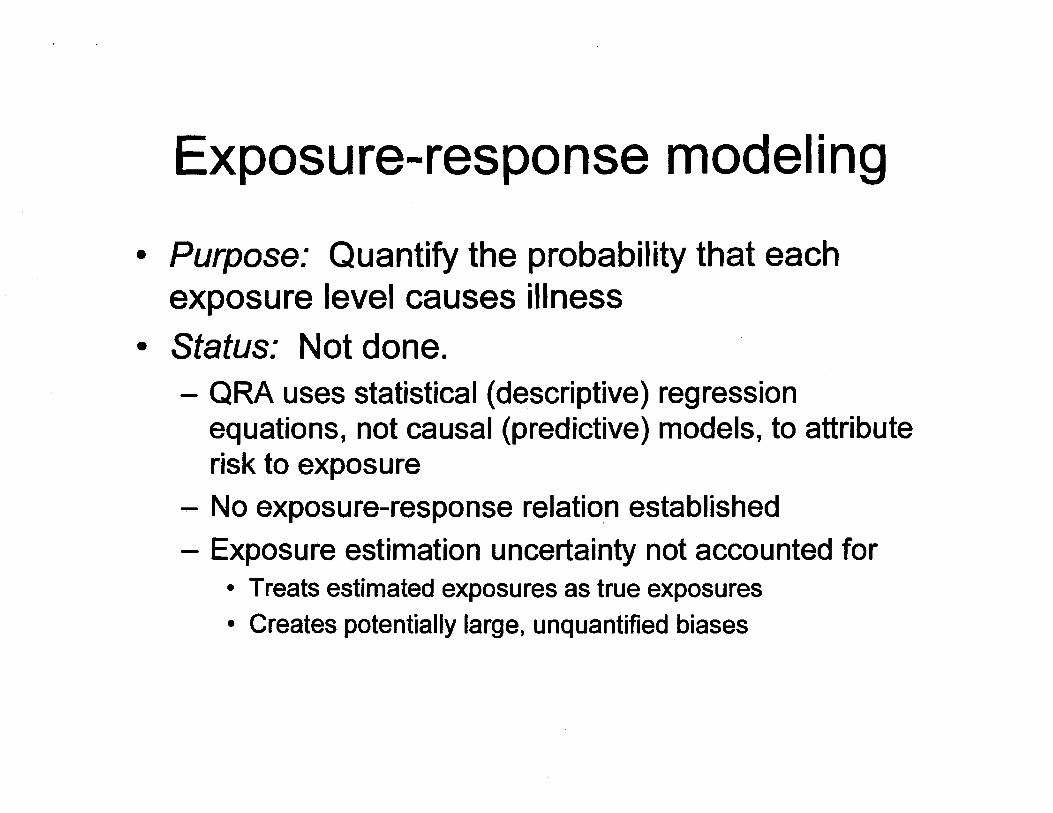
Exposure-response modeling
• Purpose: Quantify the probability that each exposure level causes illness
• Status: Not done. - QRA uses statistical (descriptive) regression
equations, not causal (predictive) models, to attribute risk to exposure
- No exposure-response relatio.n established
- Exposure estimation uncertainty not accounted for • Treats estimated exposures as true exposures
• Creates potentially large, unquantified biases

Exposure-response modeling
• This is not an exposure-response relation!
175 '0
i 150 en 5 ;; 125 ... ~ 100 CD en B 75
.;,{! Cl)
0:: 50 m G)
25 0
.n
i ! i-AAge • ED ! I
+-----i j j Age=73 i : ~- l ~ .. ,.L---1-1 I
I I
I ~ /
I - i L------~- ______ .t_
i i I
-------~--·
i 1
-~ 1'---------4-~ I ~ I
. -.,.E~.,...,e:: ··+------~----' i I I I
Age • II!
0 ,~ l ! ! r ~I I I I I I I II I I I II I
0.0 0.5 1.0 1.5 20 Average Dust Coocentration mg/m 3
Plotting predicted hypothetical responses against hypothetical mean exposures does not create (or provide evidence of) a valid exposure-response relation .
Figure 14. - Estimated relationship between average coal mine dust concentration experienced over a 45-year working lifetime and excess risk of developing emphysema severity corresponding to FEV 1 < 65% of predicted normal value. for white, never-smoking U.S. coal miners at ages 65,73, and 80 years.

Attribution vs. Causation
• The risk "attributable" to a source (in epidemiology) is not the risk caused by it (and is often much larger) - The QRA treats them as the same thing
-Attributes a relative risk of 4.4 to coal even when exposure = 0
• Use with caution (MSHA QRA) vs. Don't use!
-Assigns some risks from smoking to RCMD
- Attributable risk can be positive even when exposure does no harm

Risk characterization • Purpose: Show the frequency and severity of
health effects with and without proposed rule.
• Status: MSHA has not performed a risk characterization for effects of proposed action - Estimates are provided only for hypothetical exposure
scenarios and obsolete conditions (smoking, etc.). - No causal modeling ~ No accurate or validated
predictions

Risk characterization: Bogus claims
175 "C
ffi 150 en
~ 125 ... ~ 100 Q) en B 75
.;6! en --0::: 50 m 8 25 )(
w
i
! -------~----
1 I I i
I , _______ r_ : ! 1------·+ y£ ~ ,joG -; l I
Age= eo
Age= 73
Age= 8~
' I I -~/..,........- ·-· : ·--...:,r-----1-
; I I I
,...,.....- i i ; [ 0 ~I I I I I I I I I I I I I I I
0.0 0.5 1.0 1.5 2.0 Average Dust Coocentration, mg/m 3
Thresholds?
Confounding? • Smoking • SES
High exposures? (Right tail)
Variance?
Uncertainties? • Confidence? • Model?
Figure 14. - Estimated relationship between average coal mine dust concentration experienced over a 45-year working lifetime and excess risk of developing emphysema severity corresponding to FEV1 < 65% of predicted normal value, for white, never-smoking U.S. coal miners at ages 65. 73. and 80 years.
Proofiness: Hypothetical statistical relation presented as real causal relation.
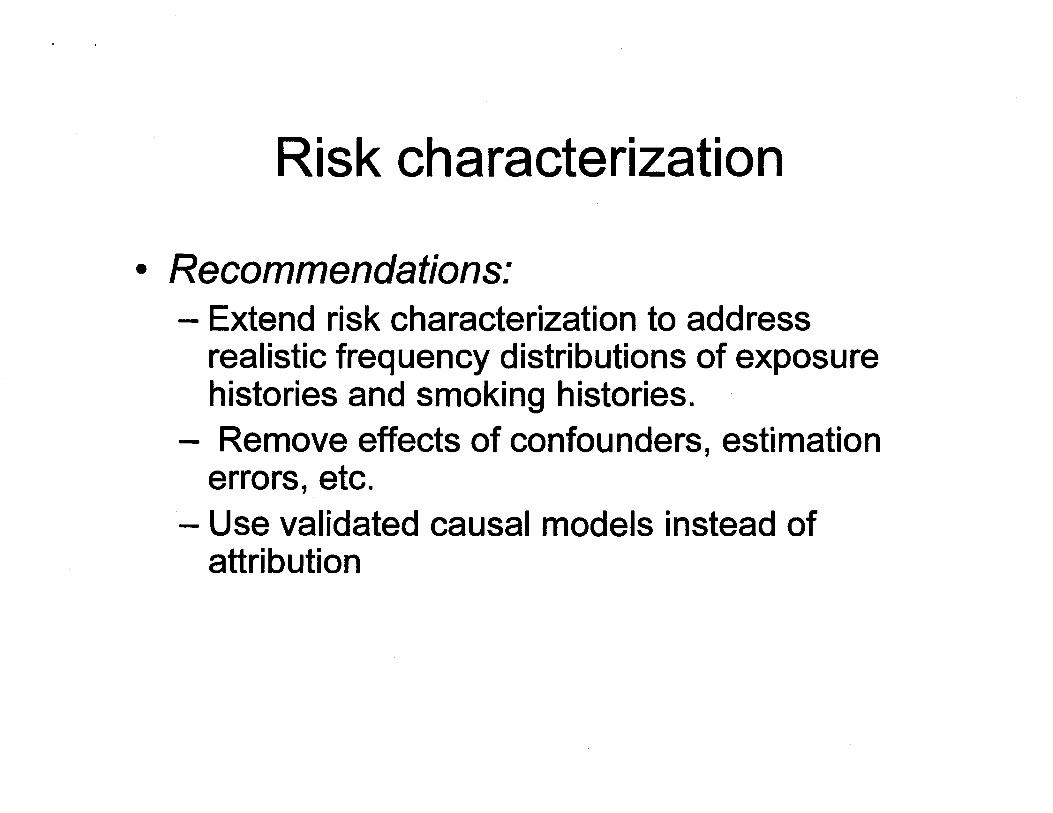
Risk characterization
• Recommendations: -Extend risk characterization to address
realistic frequency distributions of exposure histories and smoking histories.
- Remove effects of confounders, estimation errors, etc.
- Use validated causal models instead of attribution

Uncertainty characterization
• MSHA's QRA omits this step.
175 "0 Age • S 0
i 150 C/)
a Age • 7 3
= 125 ~
~ 100
Age • 0 ~
Gl C/)
~ 75 ~ .ra a:: 50 Ia 8 25 )(
w 0
0.0 0.5 1.0 1.5 2.0 Average Dust Coocermltion, nvm 3
Figure 14. - Estimated relationship betvween average coal mine dust concentration experienced over a 45-year wortcing lifetime and excess risk of developing emphysema severity corresponding to FEV1 < 65•;. of predicted normal value. for white. never ..smoking U.S. coal miners at ages 65, 73. and 80 years.
Proofiness: Show a single answer- all exposure kills! - as the only possibility.

Uncertainty characterization
• MSHA's QRA omits this step.
175 I I I I I I I I I I I J I I I I ' I I I I
"0 A g • • :0
i 150 l ! Ill Age " 7l
a . . . , G t :i 125 ~ "\: j j v T A II • = 0 ~ ._ I .
~ 100 ~ Q) Ill
B 75 I 9 ! ~ ~
~ 50 1 ; /r/. ...,< I I fa 8 251- ... ~.,..c I t ~I ~
0 ''1 I I I i I I I I I I I i i I I I I I I
0.0 0.5 1.0 1.5 2.0 Average Dust Col'l:Bf1tmtion, nYJ!m 3
What is probability that the proposed measure would ... • Increase risk? • Leaveitunchanged?
MSHA's QRA does not show policy makers any uncertainties
Figure 14. -Estimated relationship between average coal mine dust concentration experienced over a 45-year working lifetime and excess risk of developing emphysema severity corresponding to FEV, < 65% of predicted normal value, for white. never-smoking U.S. coal miners at ages 65, 73, and 80 years.
Proofiness: Show a single answer- all exposure killsl - as the only possibility.

Single-Shift Sampling: A bad idea
• QRA does not address sample variance around estimated means
• QRA provides no basis for risk-informed decisions. - Type 1 vs. type 2 errors?
- Frequency of exceeding threshold?
- Sampling and decision rules not designed to minimize errors or total cost/harm
• Basing enforcement criteria on less data is undesirable

Single-Shift Sampling: A bad idea • Recommendation: Repl.ace proposed
single-shift sampling with well-designed statistical sampling and decision rules that reduce errors, rather than increasing them. f(x)
~ 'iii c:: (J)
Q
~ :.0 G)
-e a..
Acceptance Region
I C<<<<<J V<I<<< X
L II. u
Sequential Probability Ratio Test
Reject Ho •....••• ·••·•··•••••••·•·•• ············
·················· •••··• Continue sam piing •···•••·•·••··•· ....
····· ········ ·············
····· ...................
Fail to reject Ho

Summary
• Hazard identification ~ omitted
• Exposure assessment~ incorrect/irrelevant
• Exposure-response relationship ~ omitted
• Risk characterization ~ incorrect
• Uncertainty characterization ~ omitted

Conclusions and Recommendations
• Correct or withdraw misleading claims and language. MSHA's QRA ... - Does not obtain unbiased estimates -Does not assess risk from current exposures - Does not assess reduction in risk from
reduction in exposure (ca.usal effect)
• Add missing hazard identification section • Add missing exposure-response modeling • Add missing uncertainty characterization

-· en ~ c: co ..c I-

en -ro ·-1-Q) ......, ro ~ -ro c 0 ·-......, ·-

MSHA's QRA biases exposure and risk estimates upward
• Excludes post-abatement measurements
• "Adjusts" exposures upward, but not downward -Takes higher of two estimates
- Creates an upward bias, even when current estimates are unbiased
• Does not counter-adjust the estimated exposure-response relations to reflect~ adjustments on exposure inputs - Creates upward bias in risk estimates

MSHA ORA's models are not validated for use in QRA
• Models produce conflicting predictions, so not all of them can be correct
• Models attribute risks to coal even when exposure is zero, so not good causal models
• Models use attribution formulas for *single* factors, but multiple factors (age, smoking, exposure, perhaps income and location) contribute to risk.
• Models do not explain historical data; not validated - Historical declines in exposure, changes in smoking,
recent increases in risk


![QRA Technical Guidance - National Environment Agency · QRA Technical Guidance [Revision No: 1] [Date of Revision: 31st March 2016] Contents 1 QRA Study ...](https://static.fdocuments.in/doc/165x107/5ace3a7d7f8b9a1d328b8ec2/qra-technical-guidance-national-environment-technical-guidance-revision-no-1.jpg)
![QRA Technical Guidance - National Environment … QRA Technical Guidance [Revision No: 3] [Date of Revision: 9th November 2016] Contents 1 QRA Study 2 2 Hazard Identification ...](https://static.fdocuments.in/doc/165x107/5afd2f647f8b9a3234914282/qra-technical-guidance-national-environment-qra-technical-guidance-revision.jpg)