MSHA Method P7: Infrared Determination of Quartz in ... P7.pdf · INFRARED DETERMINATION OF QUARTZ...
18
DEPARTMENT OF LABOR MINE SAFETY AND HEALTH ADMINISTRATION PITTSBURGH SAFETY AND HEALTH TECHNOLOGY CENTER ANALYTE: MATRIX: PROCEDURE: INFRARED DETERMINATION OF QUARTZ IN RESPIRABLE COAL MINE DUST Quartz METHOD NO.: Respirable Coal RANGE: Mine Dust Infrared Spectrophotometry PRECISIONTotaJ: ACCURACY: SECTION 1: TECHNICAL OVERVIEW 1.1. PRINCIPLE OF THE METHOD. P-7 20-700 micrograms of quartz 7-10% RSD ±13% (SAE) 1.1.1. Airborne respirable dust samples are collected on preweighed membrane filters using MSHA/NIOSH approved personal respirable dust samplers as described in 30 CFR Part 74. 1.1.2. After collection, the filter capsules are reweighed to one thousandth of a milligram in order to determine the net sample mass. 1.1.3. The sample filters are ashed in a low-temperature radio-frequency asher to destroy the organic matrix (coal dust and collection filter). 1.1.4. Ashed samples are deposited onto an approximately 9 mm diameter area of a vinyl acrylic copolymer, VAC (DM450) filter. Redeposited samples to be analyzed for quartz must be of the same deposit diameter as calibration samples. 1.1.5. The redeposited, ashed dust samples are scanned by infrared spectrophotometry between wave numbers of 1,000 and 700 em·' to determine the quartz and kaolinite content. 1.1.6. The mass of quartz in the deposit is determined (after correcting for the interference by kaolinite) by comparison to calibration curves for standard quartz samples and standard kaolinite samples. 1.1. 7. The percentage of quartz in the sample is calculated using the quartz mass determined from the analysis and the sample's mass of dust. 1.1.8. Absorbance peak areas are measured between 930 em_, and 900 em_, for kaolinite and between 815 em_, and 770 em·' for quartz (plus kaolinite) with absorbance maxima near 915 em·' and 800 em-' respectively. The terms "absorbance at 915cm- 1 " or "absorbance at 800cm _,, throughout this procedure are references to the peak areas defined above. MSHAP-7 Page 1 of 18 REVISED: Feb 2013
-
Upload
trinhthien -
Category
Documents
-
view
216 -
download
0
Transcript of MSHA Method P7: Infrared Determination of Quartz in ... P7.pdf · INFRARED DETERMINATION OF QUARTZ...

DEPARTMENT OF LABOR MINE SAFETY AND HEALTH ADMINISTRATION
PITTSBURGH SAFETY AND HEALTH TECHNOLOGY CENTER
ANALYTE:
MATRIX:
PROCEDURE:
INFRARED DETERMINATION OF QUARTZ IN RESPIRABLE COAL MINE DUST
Quartz METHOD NO.:
Respirable Coal RANGE:
Mine Dust
Infrared Spectrophotometry PRECISIONTotaJ:
ACCURACY:
SECTION 1: TECHNICAL OVERVIEW
1.1. PRINCIPLE OF THE METHOD.
P-7
20-700 micrograms
of quartz
7-10% RSD
±13% (SAE)
1.1.1. Airborne respirable dust samples are collected on preweighed membrane filters using MSHA/NIOSH approved personal respirable dust samplers as described in 30 CFR Part 74.
1.1.2. After collection, the filter capsules are reweighed to one thousandth of a milligram in order to determine the net sample mass.
1.1.3. The sample filters are ashed in a low-temperature radio-frequency asher to destroy the organic matrix (coal dust and collection filter).
1.1.4. Ashed samples are deposited onto an approximately 9 mm diameter area of a vinyl acrylic copolymer, VAC (DM450) filter. Redeposited samples to be analyzed for quartz must be of the same deposit diameter as calibration samples.
1.1.5. The redeposited, ashed dust samples are scanned by infrared spectrophotometry between wave numbers of 1,000 and 700 em·' to determine the quartz and kaolinite content.
1.1.6. The mass of quartz in the deposit is determined (after correcting for the interference by kaolinite) by comparison to calibration curves for standard quartz samples and standard kaolinite samples.
1.1. 7. The percentage of quartz in the sample is calculated using the quartz mass determined from the analysis and the sample's mass of dust.
1.1.8. Absorbance peak areas are measured between 930 em_, and 900 em_, for kaolinite and between 815 em_, and 770 em·' for quartz (plus kaolinite) with absorbance maxima near 915 em·' and 800 em-' respectively. The terms "absorbance at 915cm-1
" or "absorbance at 800cm _,, throughout this procedure are references to the peak areas defined above.
MSHAP-7 Page 1 of 18 REVISED: Feb 2013

1.2.2. SAFETY.
1.2.1. Lab coats, gloves and safety glasses (when working with isopropanol) should be worn when performing this procedure.
1.2.2. Each chemical should be regarded as a potential health hazard, and exposure to these chemicals should be as low as reasonably achievable. Every individual performing this procedure should be familiar with the Material Safety Data Sheets (MSDS) for every reagent used.
1.2.3. Isopropanol is flammable and must be used in a fume hood.
1.2.4. Avoid inhaling silica dust. Silica is classified as a carcinogen.
1.3. SPECIMEN REQUIREMENTS AND PRESERVATION.
1.3.1. Air samples are collected on polyvinyl chloride (PVC) filters (5 urn pore size), 37 mm cassettes. Samples are collected with an approved respirable coal dust sampler (CFR 30, Part 74) at a flow rate of2.0 Llmin. At least one blank (control) sample should be submitted with each set of air samples.
1.4. GLASSWARE.
All reusable lab ware (beakers, etc.) is cleaned prior to use by washing with detergent, followed by rinsing with tap water. Lab ware for sample preparation is subsequently rinsed with isopropanol before use, ifhand washed. NOTE: Use minimal amounts of isopropanol for rinsing. Glassware may be air dried or oven dried at 90°C ± 1 0°C.
1.5. RANGE AND DETECTION:
1.5 .1. The calibration range is 20 to 700 micrograms of quartz. The minimum sample mass required is 0.100 milligrams of dust for inspectors and 0.450 milligrams of dust for operators.
1.5.2. The method detection limit (MDL) is approximately 4 J.tg. The method detection limit is defined as "the minimum concentration that can be measured and reported with 99% confidence that the value is above zero".
1.5.3. The linear dynamic range (LDR) is defined as the concentration range over which the analytical curve remains linear. The limits of the linear dynamic range are 20 to 700 J.lg for quartz and up to 750 J.lg for kaolinite.
1.6. INTERFERENCES
1.6.1. Cristobalite, tridymite, kaolinite, and amorphous silica have absorbance peaks at 800 cm·1• Of
these, however, only kaolinite has been detected in coal mine dust.
MSHAP-7
1.6.1.1. Coal mine dust frequently contains kaolinite. Since kaolinite has an absorption band at the same wave number as quartz (~800 cm-1
), its presence causes an overestimation of the quartz mass. However, kaolinite also has an infrared absorbance band at~ 915 cm-1
• (The kaolinite absorbance at 915 cm-1 is approximately four times that at 800 cm-1
.) The kaolinite content in the sample is determined from the 915 cm-1 band and the kaolinite contribution to the absorbance at 800 cm-1 is determined from the absorbance of kaolinite at 915 cm-1 using the calibration data. The quartz absorbance is the remainder of the absorbance at 800 cm-1 after subtracting the kaolinite contribution from the total absorbance.
Page 2 of18 REVISED: Feb 2013
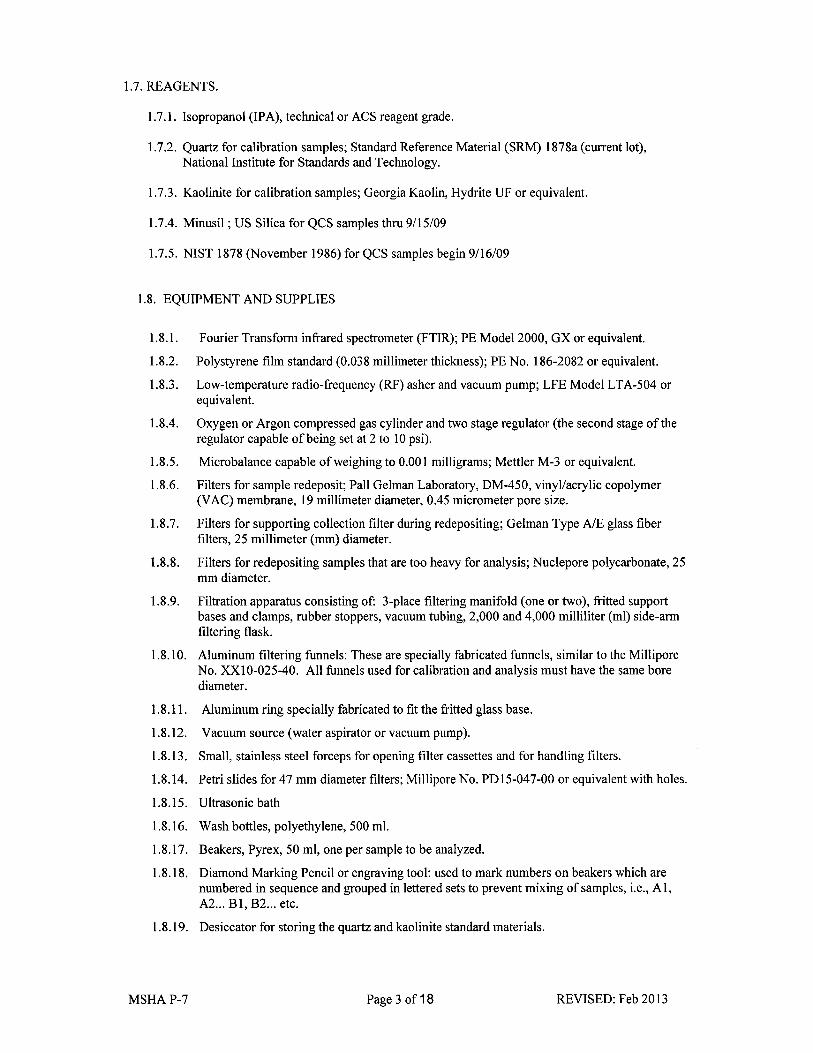
1.7. REAGENTS.
1.7.1. Isopropanol (IPA), technical or ACS reagent grade.
1.7.2. Quartz for calibration samples; Standard Reference Material (SRM) 1878a (current lot), National Institute for Standards and Technology.
1.7.3. Kaolinite for calibration samples; Georgia Kaolin, Hydrite UF or equivalent.
1.7.4. Minusil; US Silica for QCS samples thru 9/15/09
1.7.5. NIST 1878 (November 1986) for QCS samples begin 9116/09
1.8. EQUIPMENT AND SUPPLIES
1.8.1. Fourier Transform infrared spectrometer (FTIR); PE Model2000, GX or equivalent.
1.8.2. Polystyrene film standard (0.038 millimeter thickness); PE No. 186-2082 or equivalent.
1.8.3. Low-temperature radio-frequency (RF) asher and vacuum pump; LFE Model LT A-504 or equivalent.
1.8.4. Oxygen or Argon compressed gas cylinder and two stage regulator (the second stage of the regulator capable of being set at 2 to 10 psi).
1.8.5. Microbalance capable of weighing to 0.001 milligrams; Mettler M-3 or equivalent.
1.8.6. Filters for sample redeposit; Pall Gelman Laboratory, DM-450, vinyl/acrylic copolymer (VAC) membrane, 19 millimeter diameter, 0.45 micrometer pore size.
1.8.7. Filters for supporting collection filter during redepositing; Gelman Type AlE glass fiber filters, 25 millimeter (mm) diameter.
1.8.8. Filters for redepositing samples that are too heavy for analysis; Nuclepore polycarbonate, 25 mm diameter.
1.8.9. Filtration apparatus consisting of: 3-place filtering manifold (one or two), fritted support bases and clamps, rubber stoppers, vacuum tubing, 2,000 and 4,000 milliliter (ml) side-arm filtering flask.
1.8.1 0. Aluminum filtering funnels: These are specially fabricated funnels, similar to the Millipore No. XX10-025-40. All funnels used for calibration and analysis must have the same bore diameter.
1.8.11. Aluminum ring specially fabricated to fit the fritted glass base.
1.8.12. Vacuum source (water aspirator or vacuum pump).
1.8.13. Small, stainless steel forceps for opening filter cassettes and for handling filters.
1.8.14. Petri slides for 47 mm diameter filters; Millipore No. PD15-047-00 or equivalent with holes.
1.8.15. Ultrasonic bath
1.8.16. Wash bottles, polyethylene, 500 ml.
1.8.17. Beakers, Pyrex, 50 ml, one per sample to be analyzed.
1.8.18. Diamond Marking Pencil or engraving tool: used to mark numbers on beakers which are numbered in sequence and grouped in lettered sets to prevent mixing of samples, i.e., A 1, A2 ... B 1, B2 ... etc.
1.8.19. Desiccator for storing the quartz and kaolinite standard materials.
MSHAP-7 Page 3 of18 REVISED: Feb 2013

1.8.20. Sample holders for infrared instrument (These are specially-made steel plates with a center hole having a diameter the same as, or slightly smaller than, that of the sample deposit (9 mm). Small ring magnets are used to hold the filters in position on the sample holder.)
1.8.21. Slide warmer for drying filters after filtering.
1.8.22. Volumetric pipettes, Class A, Pyrex-type or borosilicate glass, in the following sizes: 1, 2, 3, 5, 10, 15, and 25 ml for preparing calibration standards.
1.8.23. Pipette filler, rubber or neoprene.
1.8.24. Flasks, volumetric, Pyrex-type, with stoppers, 500 ml.
1.8.25. Spatula, micro, stainless steel, for use in weighing out quartz and kaolinite standard materials.
1.8.26. Weighing boats, aluminum 12 mm; Cahn Instruments No. 1187.
1.8.27. Drying oven for drying quartz and kaolinite standards.
1.9. STANDARDS:
Quartz (NIST SRM).
1.9.1. STANDARD PREPARATION: (The FTIRs are calibrated approximately once a year, after failure of CCV or instrument maintenance). Continuing Calibration Verification (CCV) and quality control samples are analyzed to verify the calibration with each use.
1.9.2. Kaolinite Calibration
MSHAP-7
1.9.2.1. Prepare a suspension ofkaolinite in IPA, 50 micrograms of kaolinite per milliliter of isopropanol. The shelflife ofthe suspension is six months from date of preparation.
1.9.2.1.1. Weigh out 25.00 ±0.01 milligrams of dried (~1hr at 105°C) kaolinite.
1.9.2.1.2. Quantitatively transfer the kaolinite to a 500 milliliter volumetric flask, adjust the temperature of the suspension to approximately 20°C using either hot or cold water baths as necessary, and bring to volume with reagent grade IP A.
1.9.2.1.3. Disperse the kaolinite by sonicating the flask in an ultrasonic bath for 30 minutes.
1.9.2.1.4. Cool the flask in a cold water bath until the temperature of the suspension returns to approximately20°C.
1.9.2.2. Prepare kaolinite standards using the filtering apparatus. Place two Type AlE glass fiber filters and a 19 mm vinyl/acrylic copolymer (VA C) filter (0.45 11m pore size) on a fritted support. Position and clamp the filtering funnel in place and visually check for leaks using reagent grade IP A.
1.9.2.3. The filters will contain the following quantities of the kaolinite standard material: 50, 100, 300, and 500 and 750 micrograms. These are obtained by pipetting 1, 2, 6, 10, and 15 milliliters, respectively, of the standard suspension onto the filters.
1.9.2.4. Vigorously shake the flask with the suspension about 15 times.
1.9.2.5. Withdraw an aliquot ofthe suspension from the center of the flask with the appropriate pipette, and then allow this to drain back into the flask to condition the pipette. Repeat.
Page 4 of18 REVISED: Feb 2013

1.9.2.6. Draw the liquid up to the mark on the pipette, adjusting as necessary.
1.9.2.7. Drain the suspension into the filter funnel. Do not blow out the pipette.
1.9.2.8. Apply vacuum to the funnel and complete the preparation of the kaolinite standard as described in Sections 2.5 .16 to 2.5 .18.
1.9.2.9. Complete preparation of the remaining standards as described above. Shake the flask about 15 times before each aliquot is withdrawn.
1.9.2.10. When dry, scan the standards on the infrared spectrophotometer between the wave numbers of 1,000 and 700 em-\ following Sections 3.1.1.4 to 3.1.1.6.
1.9.2.11. Record the absorbance peak area of kaolinite between 900cm -I and 930 cm-1 and between 770cm -I and 815cm -I for each ofthe kaolinite standards.
1.9.2.12. Using the calibration program located on K\Quartz.Lab\Programs\VB6.0\calib.exe perform a least squares fit, zero intercept linear regression analysis on the absorbance peak area at -915 cm-1 to the absorbance peak area at -800 cm-1
. The slope of this line is the calibration factor used to determine the kaolinite contribution to the 800 cm-1 quartz peak (Calibration Factor 9151800 in Sec 1.12.1.1.)
1.9.2.13. Using the calibration program located on K\Quartz.Lab\Programs\VB6.0\calib.exe perform a least squares fit, zero intercept linear regression on the area of the absorbance peak at 915 cm-1 to kaolinite mass in micrograms. The slope of this line is the factor used to determine the mass of kaolinite in a sample.
1.9.3. Quartz Calibration
MSHAP-7
1.9.3.1. Prepare a suspension ofNIST SRM 1878a (current lot) in reagent grade isopropyl alcohol (IPA), 20 micrograms ofNIST SRM per milliliter of alcohol. The shelf life of the prepared suspension is 6 months from the preparation date.
1.9.3.1.1. Weigh out 10.00 ±0.01 milligrams of dried NIST SRM 1878a.
1.9.3.1.2. Quantitatively transfer the NIST SRM to a 500 ml volumetric flask, adjust the temperature of the suspension to approximately 20°C using either hot or cold water baths as necessary, and bring to volume with reagent grade IP A.
1.9.3.1.3. Disperse the NIST SRM by sonicating the flask in an ultrasonic bath for about 30 minutes.
1.9.3.1.4. Cool the flask in a cold water bath until the temperature of the suspension returns to approximately 20°C.
1.9.3.2. Prepare the quartz standards using the filtering apparatus. Place two Type AlE glass fiber filters and one 19 mm V AC (0.45 Jlm pore size) filter on each fritted support.
1.9.3.3. The filters will contain the following quantities of the quartz standard material: 20, 40, 100, 300, 500 and 700 micrograms. These are obtained by pipetting 1, 2, 5,15,25,35 milliliters, respectively, of the standard suspension onto the filters. Complete preparation of the standards following sections 1.9.2.2 through 1.9.2.9.
1.9.3.4. Record the absorbance peak area of quartz at 800 cm-1 for each standard.
1.9.3.5. Using the calibration program located on K\Quartz.Lab\Programs\VB6.0\calib.exe
Page 5 of18 REVISED: Feb 2013

perform a least squares fit, zero intercept linear regression analysis on the absorbance peak area at 800 cm"1 to the mass of quartz in micrograms. This slope of this line is the calibration factor used to determine the mass of quartz in the sample (Calibration factor (Areaquartz/ugquartz) in Sec 1.12.2.).
1.9.3.6. Verify the calibration by analyzing a NIST 2679 or separately prepared standard solution. Submit calibration and verification sheets to supervisor and QA office.
1.10 .QUALITY ASSURANCE/QUALITY CONTROL:
1.10.1. Method or Matrix Blank. A filter (37 nun PVC) that is processed in the same manner as samples. Therefore, it contains all the reagents in the same volume as used in the processing of samples. Analyze at a rate of one per each analytical batch. The method or matrix blank must be less than the method detection limit. Also referred to as the lab blank.
1.10.2. Field Blank. A filter submitted with air samples that is used to verify that contamination ofthe filters has not occurred in the field during sampling. The field blank should be less than the method detection limit. The analysis of field blanks can be done only occasionally if noncontamination has been confirmed with current field and laboratory operations.
1.10.3. Initial Calibration Verification (ICV). The ICV is a NIST SRM 2679 or separately prepared standard. The ICV is a sample that is prepared independently of the standards used to prepare the calibration. The ICV is used to verify the accuracy of the calibration curve. The measured ICV values must be within the NIST SRM 2679 acceptance range or, in the case of separately prepared standards, within± 5% of the true value.
1.10.4. Continuing Calibration Verification (CCV). The CCV is a filter standard used for calibration. The CCV does not go through the sample preparation procedure. The CCV is used to re-verify the accuracy of the calibration curve. The measured CCV values must be within 5% of the true values. Analyze at the beginning and the end of each analytical batch to verify calibration.
1.1 0.5. Quality Control Sample (QCS). A sample having a known concentration value that is taken through the entire sample preparation procedure. Currently NIST 1878 is used for the QCS samples with a weight between 75 and 300 Jlg. A minimum of two quality control samples must be run per each analytical batch. Acceptance limits are calculated based on the mean percent recovery.
1.10.6. Matrix Spike. A sample, which contains a known amount of, added analyte. The matrix spike (MS) is used to measure the accuracy of the method for the sample matrix. QC charts are located on K:\Quartz.Lab\QAdata\QA YY.xls.
1.10.7. Matrix Spike Duplicate. The QCS samples are analyzed as individual samples. Acceptance criteria for the matrix spike duplicates are calculated based on the average standard deviation of the percent recovery of all the QCS.
1.10.8. Media Blank. DM 450 membrane filters (19 mm) which are the same as used for depositing samples are used. The media blank is used as the background scan on the instrument.
1.1 0.9 Reporting Limit Check. A filter analyzed to verify the limit of quantification. This is a low level standard, which has been previously analyzed and contains approximately 20 Jlg of quartz. This sample is used to verify the instrument performance at the reporting limit. (Referred to in the run sequence as a Low CCV). Acceptance limit is +/- 20%.
1.1 0.10 The turn around goal for this analysis is three working days from the day of sample receipt.
MSHAP-7 Page 6 of18 REVISED: Feb 2013

1.10.11. CORRECTIVE ACTION BY ANALYSTS:
If the results of control samples exceed the acceptance criteria for an analytical procedure, the system may be "Out-of-Control" causing analytical results generated to be suspect. Laboratory personnel should immediately cease operations and take action to identify and resolve the problem. Corrective action may be required to bring the analytical system "In-Control". Corrective actions shall be documented on a corrective action/problem report in the LIMS. Corrective action includes the checking of results for calculation and/or transcription errors, recalibration of instrument, re-analyzing of all samples and checking environmental conditions. If the problem cannot be identified the laboratory supervisor and/or quality assurance coordinator is to be notified.
1.1 0.12. Additional Quality Control Procedures are required for samples having quartz concentrations greater or equal to 5% and quartz masses greater than or equal to 25 micrograms.
Prior to transmitting the results, samples meeting these criteria will be rescanned a second time to verify the original analysis. Any discrepancies will be reconciled before the results of the affected sample sets are exported.
1.10.13. QUALITY CONTROL CHARTS:
Control charts are used to determine if the measurement system process is in control and whether the results generated by the measurement system are acceptable. The control chart provides the tool for distinguishing the pattern of indeterminate (random) variation from the determinate (assignable cause) variation. This technique displays the test data from a process or method in a form, which graphically compares the variability of all test results with the average or expected variability of small groups of data, in effect, a graphical analysis of variance. The data from a series of analytical tests are plotted with the vertical scale in units appropriate for the quality characteristic being evaluated and the horizontal scale in units of batch number or time. The control chart is actually a graphical presentation ofQC efficiency. If the procedure is "InControl", the results will almost always be within established control limits. Further, the chart will disclose trends and cycles from assignable causes, which are corrected promptly. See Appendix A for example of control charts.
1.11. PROCEDURE:
1.11.1. Preliminary treatment of filters and bulk samples is always necessary because of the complexity and variability of sample matrices.
1.11.2. Refer to Section 2 for the preparation and low temperature ashing procedure for filters and bulks. Asher instructions are located on K:\Quality Assurance \Procedure for Asher Startup and Shutdown.
1.11.3. Follow instrument work instructions in Section 3.
1.11.4. After all function verification/preventive maintenance (FV /PM) checks have been completed the run may be started. FV /PM is automatically stored and can be viewed using the program located on K:\Quartz.Lab\Programs\VB6.0\FVPM.exe. The entire run with instrument checks should be set up in accordance with the run sequence outlined in Appendix C.
1.11.5. If any sample result exceeds the highest calibration standard for quartz or kaolinite, the sample will be re-suspended in IPA, and an appropriate number of portions redeposited and filters re-analyzed. (This is referred to as a split on the data sheet)
1.12. CALCULATIONS AND REPORTING:
MSHAP-7 Page 7 of18 REVISED: Feb 2013

NOTE: Computer programs perform calculations.
1.12.1. Calculate the corrected absorbance peak area for quartz at 800 cm"1 by:
1.12.1.1. Determine the kaolinite contribution to the combined quartz kaolinite peak at 800 cm"1 from the calibration data:
Kaolinite abs peak area.@ 800 cm"1 =kaolinite abs.@ 915 cm"1
Calibration factor 9I5/8oo
where Calibration factor 9151800 is the slope of the regression line for kaolinite peak area at 915 cm"1 versus kaolinite peak area at 800 cm·1analysis (Sec. 1.9.2.12)
1.12.1.2. Subtract the kaolinite contribution to the 800 cm·1 combined quartz kaolinite peak from the total absorbance peak area at 800 cm"1corrected abs.peak area quartz@ 800 cm·1 = abs. peak area (quartz and kaolinite) @800 cm·1 -kaolinite abs.peak area . @ 800 cm·1
1.12.2. Calculate the mass of quartz present in the samples using the calibration information:
Mass of quartz (Jlg) = corrected peak area quartz @ 800 cm·1
Calibration factor (Area quartz! ug quartz)
Where Calibration factor (Area quartz/ ug quartz) is the slope of the regression line of the absorbance peak area at 800 cm·1 versus ug quartz analysis (Sec. 1.9.3.5)
1.12.3. To determine the percent quartz, divide the mass of quartz (micrograms) by the sample mass (converted to micrograms) and multiply by one hundred.
1.13. DISPOSAL:
%quartz = mass of quartz (!lg) X 100 mass of sample (Jlg)
1.13 .1. IPA will be disposed of as liquid organic waste. All acids will be disposed of as inorganic waste.
1.13.2. All filters, standards and quality control samples are considered "Hazardous Waste", and must be disposed of accordingly.
1.14. REFERENCES:
1.14.1. Anderson, C. C., Collaborative Tests of Two Methods for Determining Free Silica in Airborne
Dust DHHS (NIOSH) Publication No. 83-124; Contract No. 210-79-0059, February 1983.
1.14.2. Freedman, R. W., S. Z. Toma, and H. W. Lang, On Filter Analysis of Quartz in Respirable Coal Dust by Infrared Absorption and X-ray Diffraction, Am. Ind. Hyg. Assoc. J., v. 35, 1974, p. 411.
1.14.3. Toma, S. Z., and S. A. Goldberg, Direct Infrared Analysis of Alpha Quartz Deposited on Filters, Analytical Chemistry, v. 44, February 1972, p. 431.
1.14.4. NIOSH 7603, Silica, Crystalline in coal mine dust, by IR, NIOSH Manual of Analytical Methods, Fourth Edition, 8/15/94.
MSHAP-7 Page 8 of18 REVISED: Feb 2013

SECTION 2: SAMPLE PREPARATION PROCEDURE:
2.1. INTRODUCTION/PRINCIPLE OF METHOD:
This method can determine the mass of silica particulates in respirable coal mine dust. The airborne particulates are collected on filters, i.e. polyvinyl chloride (PVC) using calibrated sampling pumps. This method provides for a sample preparation using a low temperature ashing procedure. Ashed samples are subsequently suspended in isopropanol, filtered and deposited onto a DM450 filter and analyzed using Fourier Transform Infrared Spectrophotometry (FTIR).
2.2. SAFETY:
2.2.1. Laboratory coats, gloves and safety glasses must be worn during entire sample preparation process.
2.2.2. Isopropanol is flammable and must be used in a hood.
2.2.3. All sample preparation will be performed under a suitable hood.
2.2.4. Avoid inhaling silica dust. Silica is classified as a carcinogen.
2.3. REAGENTS:
2.3.1. Isopropanol, technical and reagent grade.
2.4. QUALITY CONTROL:
2.4.1. Method or Matrix Blank.
2.4.1.1. For each batch, a matrix blank will be analyzed. A clean matrix, i.e. 37-mm PVC filter is placed into a beaker and is treated in the same manner as a sample. NOTE: (control) blank(s) should also be included with every filter sample set.
2.4.2. Quality Control Sample.
2.4.2.1 For each batch at least two quality control samples will be included. Record the mass of quartz and kaolinite for the QC Samples.
2.5. PROCEDURES:
NOTE: Samples with a total weight of>3.0 mg require pretreatment. (See 2.5.2.2.) However, samples with< 3.0 mg weight may require this procedure depending on mineral content. Ifashed samples do not adhere to the filter after filtration, follow the procedure outlined in 1.11.5.
2.5.1. Samples are received in the quartz laboratory from the weighing laboratory.
2.5.2. Visual basic computer programs are used to retrieve the data files from the network and print data handling reports (often called a "mom" sheet) for the samples. (See Appendix C).
2.5.2.1. Listed on the data handling sheet for each sample are: the laboratory number which is assigned to each sample, the cassette number, the sample mass, the sample purpose, whether the sample needs to be recomposited or not, the beaker number to place the sample into, and the Quality Control (QC) samples which are to be analyzed with the batch of field samples.
MSHA P-7 Page 9 of18 REVISED: Feb 2013

2.5.2.2. Recomposites are printed at the bottom of the mom sheet if only a portion of a sample needs to be analyzed because the sample weight is greater than 3.0 milligrams. Remove a portion of the dust from these samples by performing the following:
2.5.2.2.1 .Place the filter in a 50 milliliter beaker and add approximately 10-15 milliliters of isopropyl alcohol.
2.5.2.5.2. Sonicate the beaker in an ultrasonic bath for 1-2 minutes to disperse the dust.
2.5.2.5.3. Swirl and pour a portion of the slurry (alcohol and dust) through a filtering funnel onto 25mm polycarbonate filter which has been pre-weighed to 0.001 milligrams. Allow the sample to filter until the alcohol is gone. Carefully remove the funnel from the manifold base and using forceps place the filter with the sample into a petri dish and place on a slide warmer until the sample is dry.
2.5.2.5.4. Post-weigh the filter to 0.001 milligrams. The sample weight is the difference between the filter post-weight and the filter pre-weight. Place sample filter in beaker, dust side down.
2.5.2.5.5. Record the filter pre and post weights on the redeposit record sheet. Keep the redeposit sheet with the sample handling sheet; the analysis program will ask for the redeposited weights.
2.5.2.5.6. Continue with sample preparation per 2.5.7.
2.5.3. The computer programs also create sample tracking files with the cassette number and received date for each sample. (the beginning of the F file)
2.5.4. The computer programs also write the data files (F, Q, and non-transmitted sheet), which are used by the FTIR instrument programs and the quartz data files maintained in the laboratory. A list of current computer programs and macros are located on K:\Quality Assurance\Computer Programs\FTIR.
2.5.5. Assemble the numbered beakers, the respirable coal mine dust samples to be analyzed, and the sample handling data sheet that is obtained from the computer.
2.5.6. Using the forceps, remove the collection filter and stainless steel wheel from the cassette capsule and place them, first the wheel and then the filter with the dust side down, into the bottom of a numbered beaker. If dust is present on capsule, tap to dislodge dust into beaker then place the filter and the wheel in the beaker.
2.5.7. Put the beakers containing the samples into the low-temperature asher. With each run of filters ashed (up to 25), also include at least two quality control (QC) samples, a matrix (lab) blank and (control) field blank.
2.5.8. Ash samples for approximately 90 minutes, at a forward power setting no higher than 400 watts RF power and an oxygen flow rate of approximately 135 mVminute. Occasionally samples may need to go through the ashing cycle again if they do not completely ash. Make a note on the mom sheet if a sample does not completely ash. Carefully remove the glass beakers from the low-temperature asher. As each beaker is removed, gently rinse the sides with about 10 ml of technical grade IPA using a wash bottle. DO NOT squirt the IPA directly at the bottom of the beaker as this will blow the ash out of the beaker.
2.5.9. Set-up the filtering apparatus. Place two Type A/E glass fiber filters (back-up pads) on top of each fritted support.
MSHAP-7 Page 10 of 18 REVISED: Feb 2013

2.5.10. For each sample to be filtered, place one 19 mm DM450 filter on top of the glass fiber filters.
2.5.11. Position the filter funnel and clamp securely in place. NOTE: Filtration apparatus has been customized to prevent leakage.
2.5.12. Sonicate the beakers containing the dust/alcohol slurry inte the ultrasonic bath for 1 to 2 minutes to disperse the dust.
2.5.13. Remove the beakers from the bath; wipe any excess water from the outside.
2.5.14. Carefully pour the slurry into the filter funnel, being careful not to lose any drops of alcohol. Apply the vacuum.
2.5.15. Quantitatively transfer by rinsing the inside of the beaker with IPA from the wash bottle and add the rinsing to the funnel.
2.5.16. When the depth of the liquid in the funnel reaches about 2 centimeters above the filter, gently rinse the inside of the funnel with IPA and filter until all alcohol is removed.
2.5.17. When filtration is complete, remove the clamp and lift off funnel while taking care not to scrape off or disturb the deposit on the filter. Release the vacuum.
2.5.18. Remove each filter from the filter base. Number the edge of the filter with the beaker number and place the filter in a petri slide which is numbered and lettered the same as the beaker so that the sample identity is maintained. Record the set of petri dishes on the batch sheet if the dishes have an alpha prefix different than the beakers.
2.5.19. Prepare a media blank by filtering IPA through a 19 mm DM 450 filter. Place the blank filter in a petri slide marked "blank".
2.5.20. Set the petri slides containing the filters on the slide warmer to permit evaporation. Several holes, approximately l mm in diameter drilled through the top of the Petri slides ensure thorough evaporation of the alcohol. Allow the filters to dry for about 15 minutes. Remove the petri slides from the slide warmer and close the lids.
Note: Drying samples in this manner is necessary due to the presence of an interfering peak, created from the combination ofthe alcohol, polystyrene (petri slide) and the heat from
the hotplate, which causes an error in the baseline position and the quartz measurement. Incomplete drying of the samples results in an abnormal spectrum (see applicable spectra in Appendix B).
2.6 Bulk Preparation Procedure 2.6.1 A bulk sample is sent in from the field, usually in a plastic bag. Particle size is unknown.
2.6.2 Once received in the lab, the bulk sample is ground down using a mortar and pestle to crush the sample into particles less than 1 Oum in size.
2.6.3 The ground sample is wet sieved through a lOum sieve using isopropanol and an ultrasonic bath.
2.6.4 Of the sample that passes through the sieve, a portion is pipetted onto a preweighed Nuclepore filter.
2.6.5 Dry the filter on a hot plate and weigh to ensure there is enough weight gain (roughly 1.5-2 mg.) If there is not enough weight gain, pipet more sample onto the filter, dry and reweigh. Do this until there is a sufficient amount of sample on the filter.
MSHAP-7 Page 11 of 18 REVISED: Feb 2013

2.6.6 Put the sample in a numbered beaker. If there is more than one sample, keep track of which sample is in which beaker.
2.6.7 Ash the filter as for normal enforcement samples (P-7 2.5.8.)
2.6.8 Include 3 specially prepared QA samples in the set. To prepare QA samples for bulk analysis, weigh approximately 0.6-0.8 mg SRM 1878 onto a weighing pan. Transfer the material to a beaker, rinsing the pan into the beaker with 30 ml isopropanol. Sonicate the beaker, and then divide the slurry evenly onto three preweighed Nuclepore filters (approximately 10 ml of slurry on each filter.) Allow the filters to dry, and then reweigh to get a final weight for use in calculating% recovery. Ash the QA samples in the same set as the prepared bulk samples.
2.6.9 Once the samples have been ashed, follow procedures for filtering enforcement samples (2.5.9-2.5.20.)
2.6.1 0 After the filters have dried sufficiently, analyze using the "single" program K:\Quartz.Lab\Programs\newvb3\SINGLE.EXE.
2.6.11 When done analyzing, the program will print out a results page, listing the amount of quartz (ug) in each sample.
2.6.12 Enter the quartz results into the spreadsheet K\Quartz.Lab\Misc\bulks\template.xls to get% quartz for the samples, and a% recovery for the QAs.
MSHAP-7 Page 12 of18 REVISED: Feb 2013

SECTION 3. INSTRUMENT WORK INSTRUCTIONS
3.1. PROCEDURE:
3.1.1. INSTRUMENT CHECK AND QUALITY CONTROL:
3.1.1.1. Set the instrument parameters on the FTIR as follows:
Resolution: Scm·' Number of scans: 1
Apodization: Medium for 2000 Series Normal for 1700 Series
Note: When using the FTIR, the setting of these parameters and the following sections, 3.1.1.2 through 3.1.1.4 are performed through computer programs.
3.1.1.2. Energy throughput to the detector is checked before the sample analysis begins.
3.1.1.2.1. Ifthe energy does not increase to acceptable levels, the program will not continue.
3 .1.1.2.2. Determine and correct the problem or notify the supervisor.
3 .1.1.2.3. Record the correction in the instrument log book.
3 .1.1.2.4. Restart the analysis.
3 .1.1.3. Prior to scanning any set of samples or standards, check the operation of the infrared spectrophotometer using a polystyrene film standard. Scan the polystyrene standard between 1,000 and 700 em·'. An absorption band should occur at -907 em·'. The wave number (peak
location) ofthe absorption band should be found between 906 em·' and 908 em·'.
Note: If the peak location is not within these criteria, then it may indicate that there is a problem with the spectrophotometer. No samples should be analyzed until the problem is brought to the supervisor's attention and until corrective action is taken by the operator or repair personnel.
The polystyrene film is used as a standard and must be cared for accordingly. Keep polystyrene films in suitable containers to prevent them from becoming dirty or scratched.
3.1.1.4. Scan a media blank and store the scan. This establishes the background against which all samples spectra are compared. Background subtraction is performed automatically by the operating software. Scan the QC samples. If they pass proceed to samples. If they fail you have a choice to either continue with analysis or quit and print results, but you can not rerun without approval by supervisor.
3.1.1.5. Scan all samples between wave numbers of 1,000 and 700 em·', beginning with the QC samples. Follow the run sequence listed in Appendix B. If quartz is present in a sample, a doublet will be present in the scanned range, with the higher frequency peak observed at 800 em·'. Kaolinite in the sample is recognizable as an absorption band at 915 em·', usually on the shoulder of a broad, more intense band. (If both quartz and kaolinite are present in a sample, the kaolinite band in the 800 em·' region is obscured by the quartz doublet) See Appendix C for example of scan. Make note of any spectral anomalies, which may interfere with the kaolinite or quartz determinations. If quartz mass plus kaolinite mass add up to more than sample mass an "X" is marked on the sheet for further checks. Consult with the supervisor or QA Manager if potential interferences are present.
MSHAP-7 Page 13 of18 REVISED: Feb 2013

3 .1.1.6. Print the results for all samples
3.1.1.7. The result sheet is given to the supervisor/designated approver for review and approval prior to transmission of sample results. The supervisor or person assigned to review the results verifies that the QC sample results are acceptable and initials the hard copy report.
3.1.1.8. Computer programs (Refer to macros) write the files, which will be transmitted. The programs verify sample weights if the sample had to be recomposited. Not all results get transmitted. Two separate files are created. (See SOP P-79 Data Collection and Reporting.)
MSHAP-7 Page 14 of18 REVISED: Feb 2013

SECTION 4: APPROVAL AND REVIEW
4.1. APPROVAL:
PREPARED BY:
Signature Date
REVIEWED AND APPROVED BY:
Signature Date
Quality Manager
Signature Date
Technical Manager
Signature Date
4.2 ANNUAL REVIEW:
NAME DATE CHANGES
NAME DATE CHANGES
NAME DATE CHANGES
NAME DATE CHANGES
NAME DATE CHANGES
MSHAP-7 Page 15 of 18 REVISED: Feb 2013

Appendix A. Control Charts (Updated on K:\Quality Assurance\Quartz.Lab\QA\QADATA)
MSHAP-7
QC CHARTS PERCENT RECOVERY
120.0 --r------------------~
~ 110.0
~ u 100.0 ~
90.0
Set Number
QC CHARTS STANDARD DEVIATION 12 ~~---------~-----~····--------~~--------~-~ ----····~------,
10
8
6
4
2
0 ---·-····-···--·-···--
0
" ~
Set Number ____j ---------·------
Page 16 of 18 REVISED: Feb 2013

Appendix B.
Quartz Standard
0.7
0.6
0.5
0.4
0.3
0.2
0 .1
0 1000 900 800 700
Normal Spectrum with Calcite
1000 900 800 700
em -1 L_ _____________________________________________ .~
1000
MSHAP-7
Spectrum with Alcohol
--.......-- 1 0.9 0.8 0.7 0.6 0.5 0.4 0.3 0.2 0.1
-2ii-2ii-2ii-2ii:.,..:....-.........c......ill>o~~+O
900 800 700
Page 17 of 18 REVISED: Feb 2013

Appendix C.
05/05/2008
Beaker Set: E Run ID: 8918 INFRARED QUARTZ ANALYSIS- MSHA METHOD P-7
FTIR 2000 (Instrument F)
ENERGY- 5003 POLYSTYRENE- peak location: 906.9 cm-1 net absorbance: 0.2202
20 ug LOW CCV: 22 ug 300 ug CCV: 302 ug (100.7%)
QA QUARTZ RESULTS- Set No. 8918
QASample Mean st. dev. No.
22008 22009 22010
prep. ug 193 269 203
anal. ug 168 251 185
Abs. %Rec (85.0-101.4 %) (0-10.8) (warning limits) 7.9763 87.0 11.9021 93.3 8.7894 91.1 90.5 3.2 ACCEPTABLE
SAMPLE RESULTS LIMS CASS. SAMPLE WT. KAOL. QUARTZ
DISH No. No. mg abs. ug abs. ug % 01 2008034927 57739211 0.738 0.9562 46 1.2629 27 3.7 02 2008034928 57739227 0.254 0.3657 17 0.8488 18 7.1 03 2008034933 57733410 0.329 0.3159 15 0.4738 10 3.0 04 2008034934 57733512 0.291 0.2260 11 0.3844 8 2.7 05 2008034935 57733387 0.544 0.5435 26 0.6972 15 2.8 06 2008034936 57733412 0.229 0.1738 8 0.2880 6 2.6 07 2008034937 57733396 0.270 0.2154 10 0.3375 7 2.6 08 2008034938 57733419 0.224 0.0798 4 0.1220 3 1.3 09 2008034951 57653428 0.384 0.2178 10 0.3036 6 1.6 10 2008034952 57653400 1.310 3.5016 168 2.8734 61 4.7 11 2008034955 57653464 1.241 3.0819 147 1.9153 40 3.2 12 2008034956 57653457 0.515 1.0034 48 3.6092 76 14.8 13 2008034958 57653438 0.367 0.6078 29 2.1229 45 12.3 14 2008034959 57653417 0.619 1.0091 48 2.3993 51 8.2 15 2008034971 57747218 0.189 0.3312 16 1.2960 27 14.3 16 2008034974 57747211 0.213 0.8540 41 0.8481 18 8.5 17 2008034979 57734737 0.840 0.4751 23 1.8914 40 4.8 18 2008034981 57734657 0.328 0.2663 13 0.1259 3 0.9 19 2008034984 57734653 0.369 0.1773 8 0.2684 6 1.6 20 2008034986 57754716 0.223 0.1449 7 0.1988 4 1.8
fbl8918 57733056 -0.02677 -1.3 0.01670 0.4 lbl8918 -0.03422 -1.6 0.04064 0.9
300 ug CCV: 302 ug (100.7%)
Analyzed by: WHW Asher: ANA TECH 4
Prep By: WHW Filtered By: WHW Total: 20
Total for Export: 9
MSHAP-7 Page 18 of 18
VOID CODE PURP Record
A 1 H 2 H 3 H 4 A 5 H 6 H 7 H 8 H 9 A 10 A 11 A 12 H* 13 A 14 H* 15 H 16 A 17 H 18 H 19 H 20
REVISED: Feb 2013