MSC372 BeaverLakeChlaStandard€¦ · link back to basic nutrient concentrations with a defined...
24
ARKANSAS WATER RESOURCES CENTER | PUBLICATION MSC372 FUNDED BY BEAVER WATERSHED ALLIANCE EVALUATING THE ASSESSMENT METHODOLOGY FOR THE CHLOROPHYLL‐A AND SECCHI TRANSPARENCY CRITERIA AT BEAVER LAKE,ARKANSAS 2015 January
Transcript of MSC372 BeaverLakeChlaStandard€¦ · link back to basic nutrient concentrations with a defined...
ARKANSAS WATER RESOURCES CENTER | PUBLICATION MSC372 FUNDED BY BEAVER WATERSHED ALLIANCE
EVALUATING THE ASSESSMENT METHODOLOGY FOR THE CHLOROPHYLL‐A AND SECCHI TRANSPARENCY CRITERIA AT BEAVER LAKE, ARKANSAS
2015 January
ARKANSAS WATER RESOURCES CENTER | PUBLICATION MSC372 FUNDED BY BEAVER WATERSHED ALLIANCE
2 Scott and Haggard, 2015
Introduction
The U.S. Environmental Protection Agency (EPA)
has called on states to develop nutrient criteria
or numeric translators for narrative criteria for
all water bodies that would be protective of
designated beneficial uses. The EPA (2010)
recommended a weight of evidence approach to
develop numeric criteria, based on reference
conditions, mechanistic modeling or stressor‐
response analysis. State adoption of numeric
criteria has been slow, and most states have
used stressor‐response analysis as the primary
source of information to derive criteria. In fact,
many states have set numeric criteria for the
response variable (e.g., chlorophyll‐a [chl‐a]),
essentially managing nutrients with an effects‐
based approach.
The total phosphorus (TP) and chl‐a relationship
was first established for northern temperate
lakes and shows that phytoplankton biomass
measured as chl‐a increased proportionally to TP
(Dillon and Rigler 1974). This model has been
widely applied in lake and reservoir manage‐
ment to identify P reductions necessary to
achieve chl‐a water quality targets (Cooke et al.
2005), and has been coupled to secchi trans‐
parency (ST) to provide another effects‐based
assessment of water quality (Carlson 1977). As
such, twenty‐two states have adopted chl‐a
criteria on a statewide, regional, or site‐specific
basis (EPA 2014 web site). Each of these chl‐a
standards are associated with a specific assess‐
ment method, including sampling frequency,
depth, and location. The mean or median of chl‐
a concentrations during the growing season
measured near the surface and at the deepest
point in the water body has been the most
common assessment method adopted by states
(Table 1). The chl‐a criteria across these states
ranged from 1.5 to 27 µg/L and were site‐specific
(reservoir or geographic location) or specific to a
designated beneficial use, i.e. domestic water
supply.
Variation in the chl‐a criteria among states
occurs because there are different water quality
goals for states, regions, and individual water‐
bodies. Further, there is regional vari‐ability in
the non‐linear TP–chl‐a relation‐ships (Filstrup et
al. 2014), as well as difference in the distribution
of chl‐a concentrations across eco‐regions
(Herlihy et al. 2013). Recent work has demon‐
strated that lakes and reservoirs can be classified
based upon biological, chemical and physical
attributes to further improve the relation
between nutrients and chl‐a for regional
standards (Yuan and Pollard, 2014). However,
depending on the scale of the regional group‐
ings, the chl‐a and TP relationship may be robust
and Jones et al. (2011) suggested the increase in
chl‐a with TP was similar across Missouri
reservoirs.
From a human health perspective, there is need
Evaluating the Assessment Methodology for the Chlorophyll‐A and Secchi Transparency Criteria at Beaver Lake, Arkansas
J. Thad Scott1 and Brian E. Haggard2
1Crop, Soil and Environmental Sciences Department, University of Arkansas, Fayetteville,
Arkansas: [email protected] 2Arkansas Water Resources Center, University of Arkansas, Fayetteville,
Arkansas: [email protected]
ARKANSAS WATER RESOURCES CENTER | PUBLICATION MSC372 FUNDED BY BEAVER WATERSHED ALLIANCE
3 Scott and Haggard, 2015
to link nutrients, algae, organic carbon, and
disinfection by‐products (DBP) or cyano‐toxins
when establishing numeric criteria for chl‐a
(Yuan et al. 2013). Callinan et al. (2013) sug‐
gested that a mean chl‐a threshold between 4
and 6 µg/L would be protective of water supply
lakes and reservoirs in New York, with regard to
the production of DBPs. However, other work
has shown that DBP formation potential
increases only mildly as chl‐a increases over
orders of magnitude due to eutrophication
(Mash et al. 2014). Instead, DBP formation
potential was more strongly influenced by
seasonal variation in dissolved organic carbon
(DOC) concentrations. The production of the
cyano‐toxin Microcystin has been linked to
elevated phytoplankton biomass measured as
chl‐a, as well as the nitrogen (N) and
phosphorous (P) concentrations that drive these
biomass increases across lakes (Scott et al.
2013). Yuan et al. (2014) used the frequency of
occurrence of high Microcystin concentration to
identify chl‐a thresholds that ranged from 1‐14
µg/L. There is a great need to extend stressor‐
response to these specific water quality
outcomes that directly influence the capacity of
waterbodies to support their designated bene‐
ficial uses. However, these standards must also
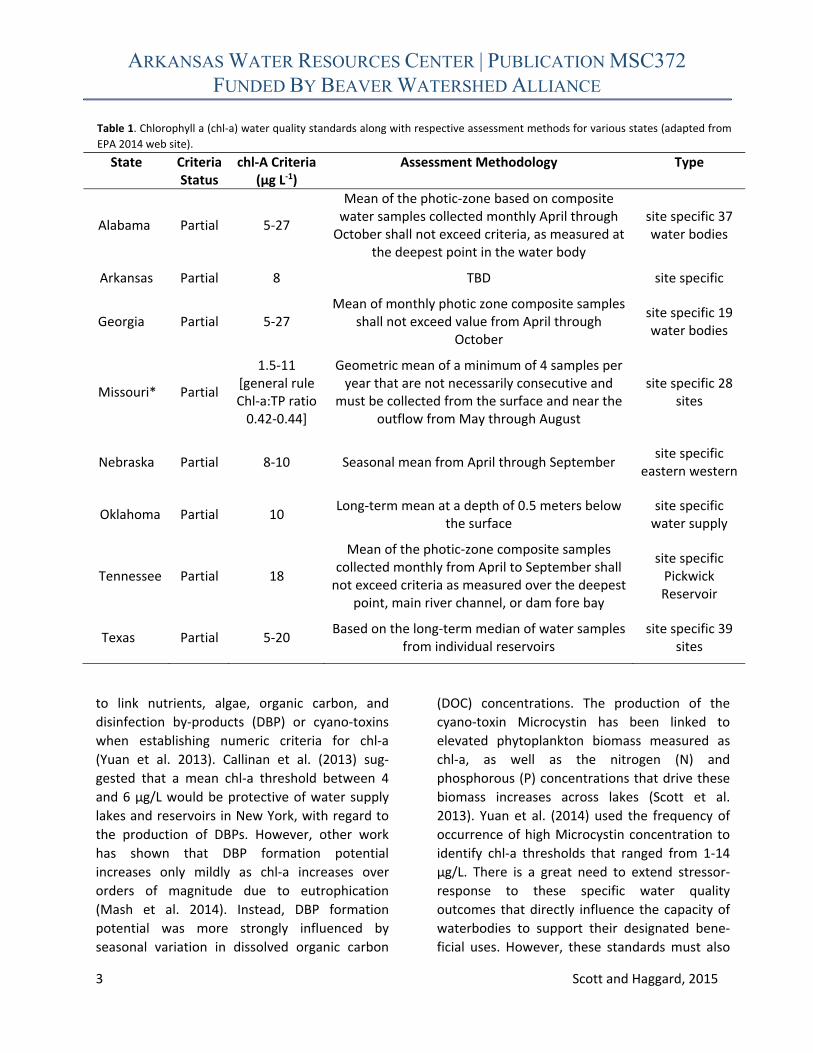
Table 1. Chlorophyll a (chl‐a) water quality standards along with respective assessment methods for various states (adapted from
EPA 2014 web site).
State Criteria Status
chl‐A Criteria (µg L‐1)
Assessment Methodology Type
Alabama Partial 5‐27
Mean of the photic‐zone based on composite water samples collected monthly April through October shall not exceed criteria, as measured at
the deepest point in the water body
site specific 37 water bodies
Arkansas Partial 8 TBD site specific
Georgia Partial 5‐27 Mean of monthly photic zone composite samples
shall not exceed value from April through October
site specific 19 water bodies
Missouri* Partial
1.5‐11 [general rule Chl‐a:TP ratio 0.42‐0.44]
Geometric mean of a minimum of 4 samples per year that are not necessarily consecutive and
must be collected from the surface and near the outflow from May through August
site specific 28 sites
Nebraska Partial 8‐10 Seasonal mean from April through September site specific
eastern western
Oklahoma Partial 10 Long‐term mean at a depth of 0.5 meters below
the surface site specific water supply
Tennessee Partial 18
Mean of the photic‐zone composite samples collected monthly from April to September shall not exceed criteria as measured over the deepest
point, main river channel, or dam fore bay
site specific Pickwick Reservoir
Texas Partial 5‐20 Based on the long‐term median of water samples
from individual reservoirs site specific 39
sites
ARKANSAS WATER RESOURCES CENTER | PUBLICATION MSC372 FUNDED BY BEAVER WATERSHED ALLIANCE
4 Scott and Haggard, 2015
link back to basic nutrient concentrations with a
defined measurement frequency and duration in
order to inform watershed management.
Effects‐Based Water Quality Criteria in Beaver
Lake, Arkansas
The State of Arkansas recently adopted its first
effects‐based water‐quality criteria related to
nutrients. A site specific chl‐a and ST standard
was adopted for Beaver Lake in Northwest
Arkansas (APCEC 2012). According to State of
Arkansas Regulation Number 2, which is the
state regulation defining water quality standards
(APCEC 2012), the growing season (May –
October) geometric mean chl‐a concen‐ tration
in Beaver Lake near Hickory Creek shall not
exceed 8 µg/L and the annual average ST shall
not be less than 1.1 m. The standards were
adopted from the recommendations of a
working group that conducted a multi‐tiered
analysis (FTN 2008). The basis for choosing the 8
µg/L chl‐a standard and the 1.1 m ST standard
came from a weight of evidence approach and
included the following six specific considerations
(from FTN 2008, Section 9.3):
1. Chl‐a and ST criteria adopted into regulation
or recommended for adoption in surrounding
states
2. Ecoregional values published by the EPA
3. Percentile values for reference lakes and
extant values for Beaver Lake
4. Statistical analysis of Beaver Lake and
reference lake data
5. Empirical nutrient loading relationships
6. Dynamic modeling results
The recommended standards for both chl‐a and
ST were derived to protect the designated uses
of Beaver Lake, which include its role as a
drinking water source to Northwest Arkansas
(FTN 2008). However, it is also clear that the
standards recommended in the report and
ultimately adopted by the State of Arkansas
represent an expected average condition at the
Hickory Creek location in Beaver Lake. This is
supported by the following quotation borrowed
from Section 9.3 of the standard development
report (FTN 2008):
“The chlorophyll regression equation was used to
estimate concentrations at Lowell, and
subsequently at the Hickory Creek site by
averaging the values from the Highway 412 and
Lowell sites. The Hickory Creek site is located
about half the way between Highway 412 and
Lowell. A growing season geometric mean
chlorophyll concentration of 10 and 12 μg/L at
Highway 412 results in a predicted geometric
chlorophyll mean of 4.5 and 4.8 μg/L at Lowell,
with the upper 95% geometric means at Lowell
estimated as 6.5 and 6.9 μg/L, respectively. The
associated Hickory Creek growing season
geometric chlorophyll means estimated for the
Hickory Creek site were 7.5 and 8.5 μg/L,
respectively. The DeGray reference lake chloro‐
phyll concentration was 9 μg/L, which is
consistent with this estimated value.”
Although it is not obvious why the exact “10 to
12” µg/L chl‐a was used for the Highway 412
location in the above quotation, those values are
in the same range as promulgated chl‐a criteria
in other states (Table 1). However, the criteria in
those states typically apply to the deepest
location in the lake near the outfall or dam. The
Highway 412 location in Beaver Lake is
immediately below the input of the White River,
which is almost 50 km from the dam. The range
of chi‐a reported for the Highway 412 location
throughout the standard development docu‐
ment was 5.2 to 32.6 µg/L (FTN 2008). This
reported range included geometric means for
different observation periods and from empirical
and dynamic modeling activities. The application
of this average condition as shown above
quotation demonstrates that the average expec‐
ARKANSAS WATER RESOURCES CENTER | PUBLICATION MSC372 FUNDED BY BEAVER WATERSHED ALLIANCE
5 Scott and Haggard, 2015
ted chl‐a concentration in Beaver Lake at Hickory
Creek is approximately 7.5 to 8.5 µg/L. Thus, the
adopted 8 µg/L is practically equivalent to the
long‐term expected average condition at Hickory
Creek. A similar methodology was used to derive
the 1.1 m ST standard, and numerous references
throughout the standard develop‐ment
document indicate that the long‐term expected
condition at Hickory Creek was approximated by
this value (FTN 2008).
The intent of the standard development activ‐
ities reported by FTN (2008) was clearly to
identify values of chl‐a and ST that when
exceeded would result in a failure of Beaver Lake
to meet its designated uses. This range of values
is similar to other standards in neighboring
states and is supported by the scientific
literature discussed previously. However, the
standards recommended and ultimately adopted
were not expected to result in Beaver Lake being
immediately listed on the Arkansas 303d list of
impaired water bodies. This is clear from the
following quotation borrowed from Section
9.4.2. – Rationale for Criteria in standard
development document (FTN 2008):
“The chlorophyll and Secchi transparency mean
values are considered conservative and pro‐
tective of the designated uses, but should not
result in frequent non‐attainment assessments.”
Thus, the approximate average expected
conditions of 8 µg/L chl‐a and 1.1 m ST at the
Hickory Creek location in Beaver Lake were not
expected to result in frequent violations.
A substantial missing component of the standard
development document (FTN 2008) was the
derivation of assessment criteria that define the
allowable frequency and duration of exceedance
of the water quality standards. A common
assessment methodology used in surface water
assessment by the State of Arkansas is to allow
no more than one violation in a five year assess‐
ment period (ADEQ personal communication,
2014). Adoption of this method for the Beaver
Lake chl‐a and ST standards would very obviously
result in a water quality violation because the
standards were equivalent to a long‐term
expected average condition in Beaver Lake at
Hickory Creek. Thus, assuming the data have a
normal distribution, the standards should be
expected to be exceeded in approximately half
of the years in an assessment period. It is
therefore important to create an assessment
methodology which is consistent with the
information used to develop the water quality
standards for Beaver Lake. As written in the
standard development document, the standards
should be protective of designated uses, but not
result in frequent non‐attainment if chl‐a
concentrations and ST does not vary from its
long‐term expected condition at Hickory Creek.
Study Objectives
Although the chl‐a and ST developed for Beaver
Lake were specifically intended to apply to the
location near Hickory Creek, no historic data
were available for that site. As alluded to above,
a regression relationship demonstrated that the
selected standards were approximately equiv‐
alent to the long‐term expected average
conditions for Beaver Lake at Hickory Creek.
Since the time of standard development, six
years of assessment data have been collected at
the Hickory Creek location. In addition, similar
data have been collected at several other
locations in the lake using the same sampling
and analysis methodologies.
The objective of this study was to derive an
initial assessment methodology based on the
method(s) used to develop the site‐specific
numeric criteria for chl‐a and ST in Beaver Lake
at Hickory Creek. In order to accomplish this, we
evaluated the probability of exceeding the prom‐
ARKANSAS WATER RESOURCES CENTER | PUBLICATION MSC372 FUNDED BY BEAVER WATERSHED ALLIANCE
6 Scott and Haggard, 2015
ulgated criteria, based on the data publicly
available through the U.S. geological Survey
(USGS) National Water Information System
(NIWS). We explicitly evaluated the risk of
exceeding the 8 µg/L chl‐a standard and the 1.1
m ST standard using data collected in Beaver
Lake since 2001 because those data were
collected using standardized techniques that
were replicated through the entire period of
record. This analysis provided specific expec‐
tations about the number of violations of the
adopted water quality standards that should be
expected based on an allowable level of risk
(10%‐20%), which was consistent with the
acceptable risk presented in the standard
development document (FTN 2008). We also
evaluated Beaver Lake chl‐a, ST, and TP data
relative to common limnological models that are
often used in water quality assessment in order
to provide context regarding potential assess‐
ment methodologies.
Methods
Study Site and Data Description
Beaver Lake is a large multi‐use reservoir of the
U.S. Army Corps of Engineers on the White River
in Arkansas, and it is the most upstream
reservoir on the river system; the downstream
USACE reservoirs include Table Rock Lake and
Bull Shoals Lake within the White River Basin.
This reservoir has been authorized for flood
control, hydroelectric power generation, and
domestic and industrial water supply (USACE,
1998), and the reservoir is also used for
recreation and fish and wildlife management.
Beaver Lake is the water supply for northwest
Arkansas, providing domestic water supply to
approximately 400,000 citizens and multiple
industries, including poultry processing facilities.
There are currently four public water suppliers
using the reservoir, and the most upstream is the
Beaver Water District (BWD). The water‐quality
standards, i.e. geometric mean chl‐a concen‐
tration and annual arithmetic average ST criteria,
were developed to protect the reservoir from a
drinking water per‐spective, but the other uses
were also considered (FTN 2008).
Beaver Lake and its tributaries were monitored
routinely for water quality by numerous
agencies, including the Arkansas Department of
Environmental Quality (ADEQ), Arkansas Water
Resources Center (AWRC), BWD, and the U.S.
Geological Survey (USGS). The USGS collects
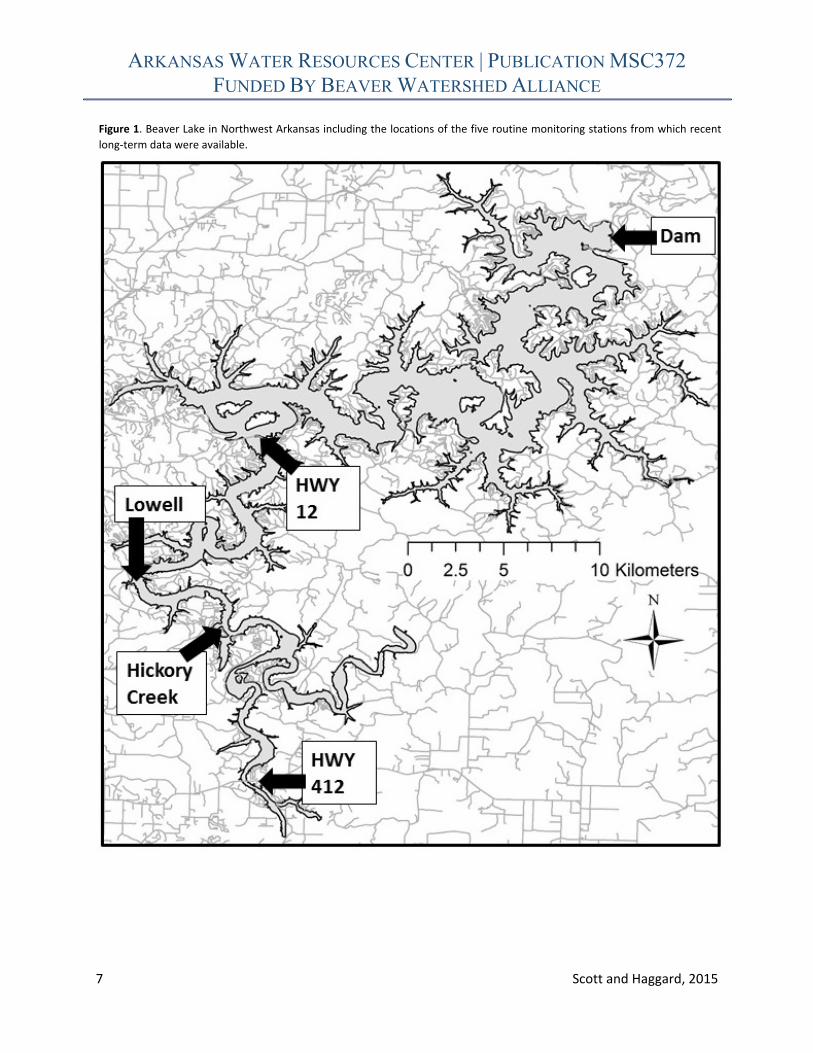
water samples from Beaver Lake at five locations
(Figure 1), Highway 412, Hickory Creek, Lowell,
Highway 12, and then the dam (from upstream
to downstream, respectively). The USGS
measures ST and collects water samples at these
locations from three depths, including
approximately 2 m below the surface, the
metalimnion near the thermocline, and in the
hypolimnion above the sediment‐water inter‐
face. The water samples are collected from
Beaver Lake and then transported to the USGS
National Water Quality Lab, where each water
sample is analyzed for TP, chl‐a, and other typical
water‐quality constituents. Secchi transparency
was measured and water samples collected
approximately 6‐8 times per year on average,
and the frequency of collection is greater during
the growing season (defined as May through
October).
The USGS database was used in this study to
quantify the probability of exceeding the State of
Arkansas numeric criteria for Beaver Lake, and in
the evaluation of the assessment methodology
from calendar year (CY) 2001 through 2014. Only
one sampling depth (~2 m below the surface)
was used to calculate geometric mean concen‐
tration of chl‐a at each site during the growing
season (May through October) of each CY, and
the arithmetic average of all ST measurements
within a CY was used. The water quality standard
is currently assessed using data from Hickory, as
ARKANSAS WATER RESOURCES CENTER | PUBLICATION MSC372 FUNDED BY BEAVER WATERSHED ALLIANCE
7 Scott and Haggard, 2015
Figure 1. Beaver Lake in Northwest Arkansas including the locations of the five routine monitoring stations from which recent
long‐term data were available.
ARKANSAS WATER RESOURCES CENTER | PUBLICATION MSC372 FUNDED BY BEAVER WATERSHED ALLIANCE
8 Scott and Haggard, 2015
defined by Arkansas Regulation Number 2
(APCEC 2012). However, water sampling at
Hickory Creek (by the USGS) only began in CY
2009 – thus, data was not avai‐lable at the point
of potential regulation during the development
of the chl‐a and ST criteria. All data used in this
study are publicly available through the USGS
National Water Information System (NWIS,
http://waterdata.us‐gs.gov/nwis). ADEQ does
not have specific guidelines on the number of
allowable exceedances of water quality criteria.
However, ADEQ does often apply a threshold of
two or more exceedances in a five year assess‐
ment as evidence of impairment because this
would represent a 40% loss of use (ADEQ
personal communication, 2014).
Predicted Data
Because data at Hickory Creek was only available
for CY 2009 through 2014, this would provide
only 6 geometric mean chl‐a and arithmetic aver‐
age ST from which to estimate probabilities of
exceeding the defined criteria. Therefore, we
had to predict values for chl‐a and ST at Hickory
Creek based on available data at the other sites,
particularly the sites upstream (HWY 412) and
downstream (Lowell). The document (FTN 2008)
that developed the implemented criteria was
used to provide guidance on how we predicted
values at Hickory Creek, keeping our techniques
similar to those used in criteria development. By
predicting values at Hickory Creek, this allowed
us to create a database where we have 14 years
of predicted values of geometric mean chl‐a
concentration during the growing season and
annual arithmetic average ST to evaluate the
probability of exceeding the criteria.
In order to derive expected values for Hickory
Creek, we utilized measured data from 2009‐
2014 to determine if there was a statistically
significant relationship between chl‐a at Highway
412 and Hickory Creek or between chl‐a at
Lowell and Hickory Creek. No such relationship
was apparent from the data. Thus, we employed
the method used in the standard development
(FTN 2008) in which the relation between
geometric mean chl‐a concentration at Highway
412 and Lowell to predict this response variable
at Hickory Creek with data from 2001 through
2014. Simple linear regression was used to
develop a relation a predictive equation between
the geometric mean concentration of chl‐a at
Highway 412 and Lowell (chl‐aLowell = 0.3174∙chl‐
a412 + 2.385, R2=0.40, p=0.02). This equation was
used to predict values at Lowell based on the
observed geometric mean chl‐a at Highway 412.
The predicted geomean chl‐a concentrations for
Lowell were averaged with the measured
geometric means at Highway 412 to estimate
values for Hickory Creek. This technique was
replicated from the method used in the standard
development (FTN 2008). We recognize that
these values at Hickory Creek are predicted, and
that caution should be used in the interpretation
of the probability of exceed‐ing the chl‐a criteria
at this site.
The development of expected ST data for
Hickory Creek followed the same method. Brief‐
ly, we utilized measured data from 2009‐2014 to
determine if there was a statistically significant
relationship between chl‐a at Highway 412 and
Hickory Creek or between chl‐a at Lowell and
Hickory Creek. Indeed, a strong relationship
between the annual average ST at Lowell and the
annual average ST at Hickory creek (STHickory =
0.5020∙STLowell + 0.4436, R2=0.75, p=0.03). This
prediction model was then used to estimate the
annual average ST for years in which ST
measured values were not available for Hickory
Creek.
Probability of Exceeding Criteria
The hydrologic frequency method was used to
measure the probability that the water‐quality
ARKANSAS WATER RESOURCES CENTER | PUBLICATION MSC372 FUNDED BY BEAVER WATERSHED ALLIANCE
9 Scott and Haggard, 2015
standard (i.e., criteria) would be exceeded. Our
main assumption here is that the occurrence of
each event or measurement against the criteria
(i.e., geometric mean chl‐a from May through
October and annual arithmetic average ST) is a
random stochastic process. The probability of a
particular criteria being exceeded in any year is
PT, and this probability is independent and
specifically not dependent on previous measure‐
ment against the criteria or the history of chl‐a
and ST in Beaver Lake. Assuming that exceeding
the criteria was a Bernoulli random variable and
based on a binomial distribution, we can
calculate the probability of K occurrences or
measurements exceeding the criteria in N years:
ʄ(K; PT, N) = !
! ! 1 (1)
where ʄ(K; PT, N) is the probability of exactly K
occurrences of a measurement exceeding the
criteria in N years, if PT is the probability of an
exceedance in any single year (Haan et al. 1994).
For example, we can calculated the probability of
the criteria being exceeded exactly two times (K
= 2) in a five year period (N=5). We essentially
used this equation to calculate the entire
spectrum of K over N years, such that in a 5 year
period we would have to estimate the
probability of exactly 0, 1, 2, 3, 4 and 5 events,
where the criteria would be exceeded within the
period. The probabilities of 2, 3, 4 and 5
exceedances are then summed to represent the
probability of seeing two or more measurements
that would exceed the criteria. These calc‐
ulations were made for both geometric mean
chl‐a during the growing season (May through
October) and the annual arithmetic average of
the ST at Beaver Lake.
The above equation requires that we estimate
the probability of the criteria being exceeded
within any given single year, i.e. PT. This requires
that we use the available data (i.e., geomean chl‐
a concentration and annual average STs) from
the U.S. Geological Survey, and we used the
reduced equation representing many types of
hydrologic frequency analysis (from Haan et al.
1994):
XT 1 CVKT 2
where XT is criteria of interest, is the mean of
the available data (i.e., the mean of the
geometric mean chl‐a concentrations during the
growing season for each individual year or the
mean of the arithmetic average for ST for each
individual year), CV is the coefficient of variation
of the available data (i.e., standard deviation
divided by the mean), and KT is a coefficient that
is a function of the probability distribution
selected.
In this case, we selected the normal distribution
because the skewness of the data available from
the water supply intake at Beaver Lake was near
zero, suggesting that we could use the
standardized Z scores or values from the
standardized cumulative normal distribution. XT,
CV and are known variables, so the equation
was solved for KT which was then used to look up
the corresponding Z score (Appendix 2, Haan et
al. 1994) and estimate the probability of the
criteria being exceeded in any given year, i.e. PT.
The inverse of PT can be used to represent the
return interval (i.e., T‐year event) for the criteria
at each individual sampling site within Beaver
Lake:
PT 3
A T‐year event can be thought of as the average
time between events that have a magnitude
greater than XT – of course, this would be over a
long period of time and much longer than the
available period of data for Beaver Lake. We
used this concept to give an idea of how
frequently we might expect the criteria to be
ARKANSAS WATER RESOURCES CENTER | PUBLICATION MSC372 FUNDED BY BEAVER WATERSHED ALLIANCE
10 Scott and Haggard, 2015
exceeded at each individual monitoring site
across Beaver Lake.
We provide a probability analysis of exceeding
the criteria for three time periods, including (1)
2001 through 2008, representing the time period
used to develop the criteria and produce the
final report (FTN 2008), (2) 2001 through 2014,
representing recent, continuous data available
through present day, and (3) data collected from
2009‐2014 for which measured data were
actually available at the Hickory Creek location.
The reality is that the longer the time period the
better in hydrologic frequency analysis, assuming
that the distribution of the values is stationary
over time – that is, not changing due to some
anthropogenic or climatic factor which has
changed over time.
Results
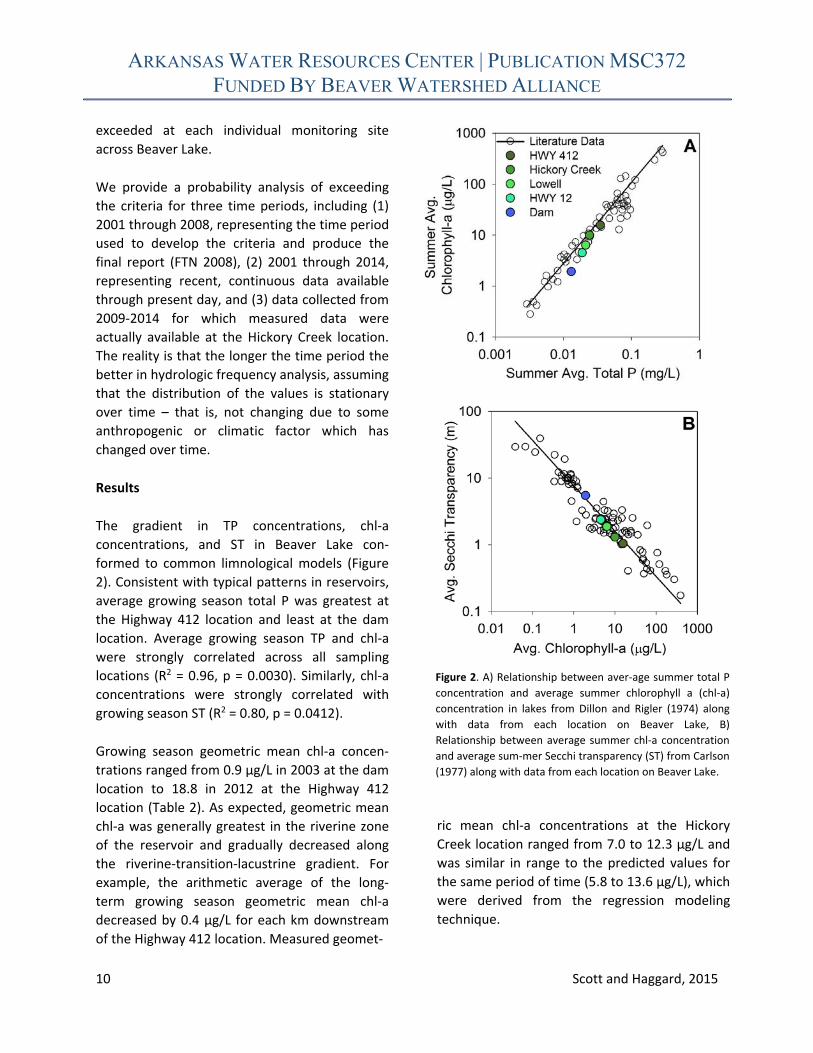
The gradient in TP concentrations, chl‐a
concentrations, and ST in Beaver Lake con‐
formed to common limnological models (Figure
2). Consistent with typical patterns in reservoirs,
average growing season total P was greatest at
the Highway 412 location and least at the dam
location. Average growing season TP and chl‐a
were strongly correlated across all sampling
locations (R2 = 0.96, p = 0.0030). Similarly, chl‐a
concentrations were strongly correlated with
growing season ST (R2 = 0.80, p = 0.0412).
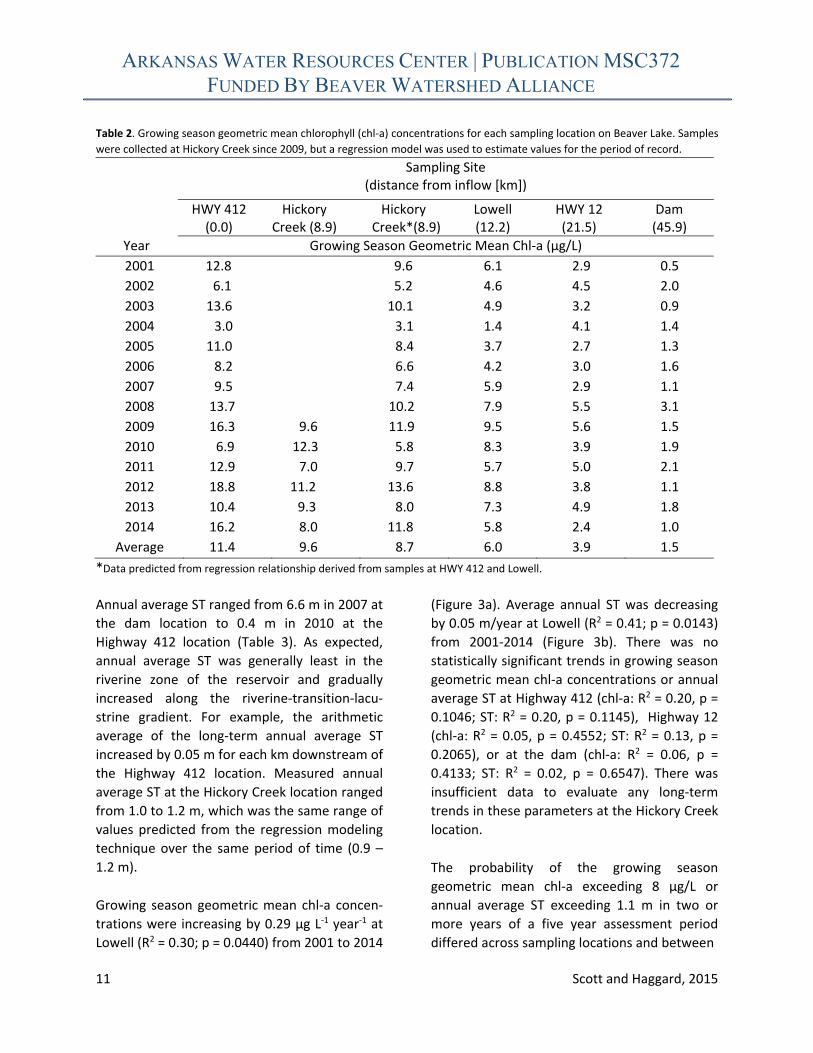
Growing season geometric mean chl‐a concen‐
trations ranged from 0.9 µg/L in 2003 at the dam
location to 18.8 in 2012 at the Highway 412
location (Table 2). As expected, geometric mean
chl‐a was generally greatest in the riverine zone
of the reservoir and gradually decreased along
the riverine‐transition‐lacustrine gradient. For
example, the arithmetic average of the long‐
term growing season geometric mean chl‐a
decreased by 0.4 µg/L for each km downstream
of the Highway 412 location. Measured geomet‐
ric mean chl‐a concentrations at the Hickory
Creek location ranged from 7.0 to 12.3 µg/L and
was similar in range to the predicted values for
the same period of time (5.8 to 13.6 µg/L), which
were derived from the regression modeling
technique.
Figure 2. A) Relationship between aver‐age summer total P
concentration and average summer chlorophyll a (chl‐a)
concentration in lakes from Dillon and Rigler (1974) along
with data from each location on Beaver Lake, B)
Relationship between average summer chl‐a concentration
and average sum‐mer Secchi transparency (ST) from Carlson
(1977) along with data from each location on Beaver Lake.
ARKANSAS WATER RESOURCES CENTER | PUBLICATION MSC372 FUNDED BY BEAVER WATERSHED ALLIANCE
11 Scott and Haggard, 2015
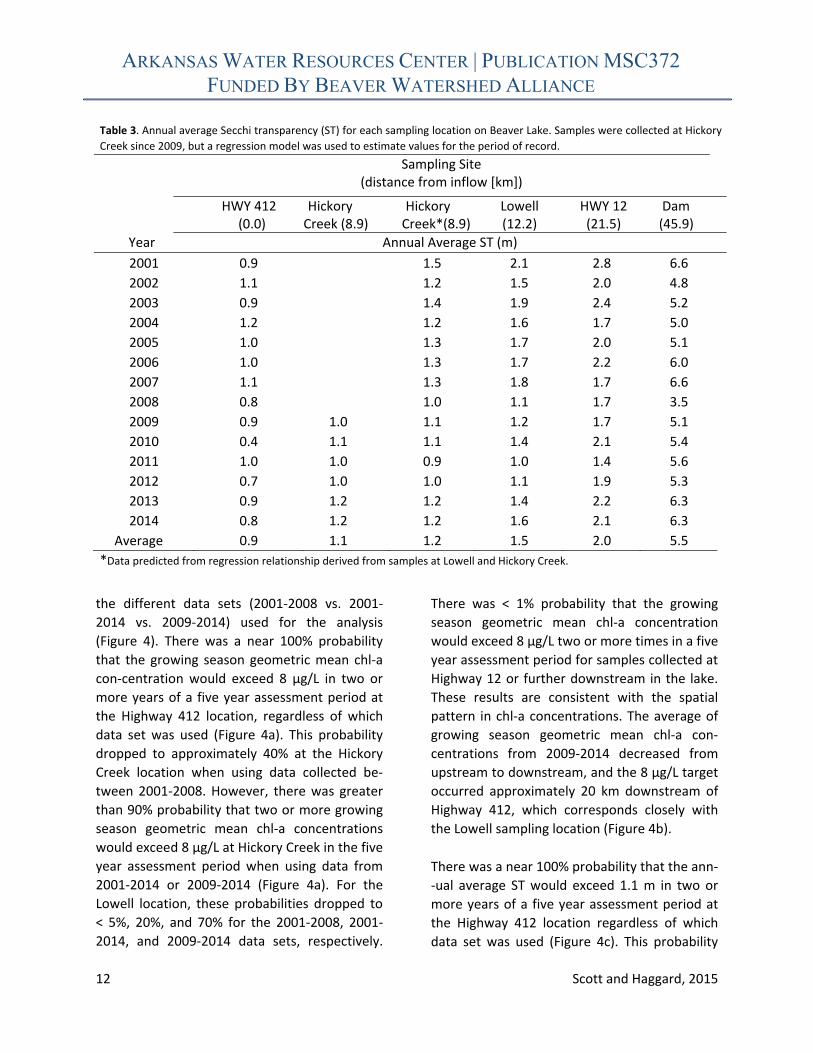
Annual average ST ranged from 6.6 m in 2007 at
the dam location to 0.4 m in 2010 at the
Highway 412 location (Table 3). As expected,
annual average ST was generally least in the
riverine zone of the reservoir and gradually
increased along the riverine‐transition‐lacu‐
strine gradient. For example, the arithmetic
average of the long‐term annual average ST
increased by 0.05 m for each km downstream of
the Highway 412 location. Measured annual
average ST at the Hickory Creek location ranged
from 1.0 to 1.2 m, which was the same range of
values predicted from the regression modeling
technique over the same period of time (0.9 –
1.2 m).
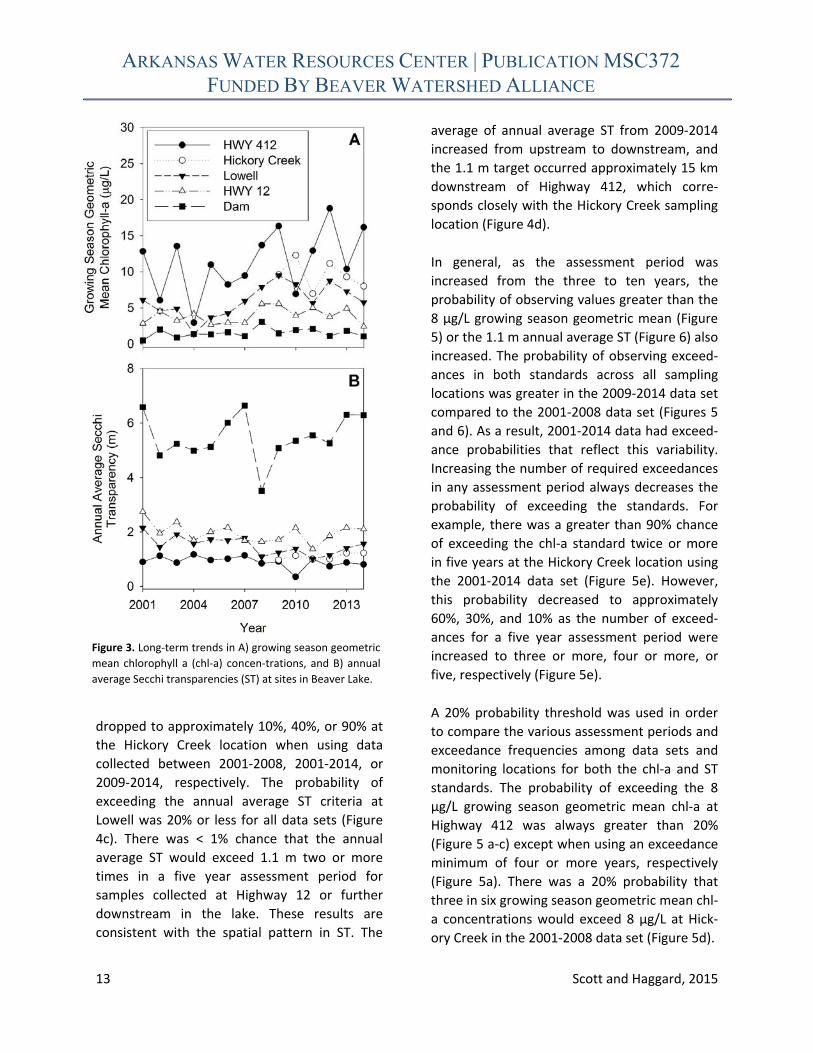
Growing season geometric mean chl‐a concen‐
trations were increasing by 0.29 µg L‐1 year‐1 at
Lowell (R2 = 0.30; p = 0.0440) from 2001 to 2014
(Figure 3a). Average annual ST was decreasing
by 0.05 m/year at Lowell (R2 = 0.41; p = 0.0143) from 2001‐2014 (Figure 3b). There was no
statistically significant trends in growing season
geometric mean chl‐a concentrations or annual
average ST at Highway 412 (chl‐a: R2 = 0.20, p =
0.1046; ST: R2 = 0.20, p = 0.1145), Highway 12
(chl‐a: R2 = 0.05, p = 0.4552; ST: R2 = 0.13, p =
0.2065), or at the dam (chl‐a: R2 = 0.06, p =
0.4133; ST: R2 = 0.02, p = 0.6547). There was
insufficient data to evaluate any long‐term
trends in these parameters at the Hickory Creek
location.
The probability of the growing season
geometric mean chl‐a exceeding 8 µg/L or
annual average ST exceeding 1.1 m in two or
more years of a five year assessment period
differed across sampling locations and between
Table 2. Growing season geometric mean chlorophyll (chl‐a) concentrations for each sampling location on Beaver Lake. Samples
were collected at Hickory Creek since 2009, but a regression model was used to estimate values for the period of record.
Sampling Site (distance from inflow [km])
HWY 412 (0.0)
Hickory Creek (8.9)
Hickory Creek*(8.9)
Lowell (12.2)
HWY 12 (21.5)
Dam (45.9)
Year Growing Season Geometric Mean Chl‐a (µg/L)
2001 12.8 9.6 6.1 2.9 0.5
2002 6.1 5.2 4.6 4.5 2.0
2003 13.6 10.1 4.9 3.2 0.9
2004 3.0 3.1 1.4 4.1 1.4
2005 11.0 8.4 3.7 2.7 1.3
2006 8.2 6.6 4.2 3.0 1.6
2007 9.5 7.4 5.9 2.9 1.1
2008 13.7 10.2 7.9 5.5 3.1
2009 16.3 9.6 11.9 9.5 5.6 1.5
2010 6.9 12.3 5.8 8.3 3.9 1.9
2011 12.9 7.0 9.7 5.7 5.0 2.1
2012 18.8 11.2 13.6 8.8 3.8 1.1
2013 10.4 9.3 8.0 7.3 4.9 1.8
2014 16.2 8.0 11.8 5.8 2.4 1.0
Average 11.4 9.6 8.7 6.0 3.9 1.5
*Data predicted from regression relationship derived from samples at HWY 412 and Lowell.
ARKANSAS WATER RESOURCES CENTER | PUBLICATION MSC372 FUNDED BY BEAVER WATERSHED ALLIANCE
12 Scott and Haggard, 2015
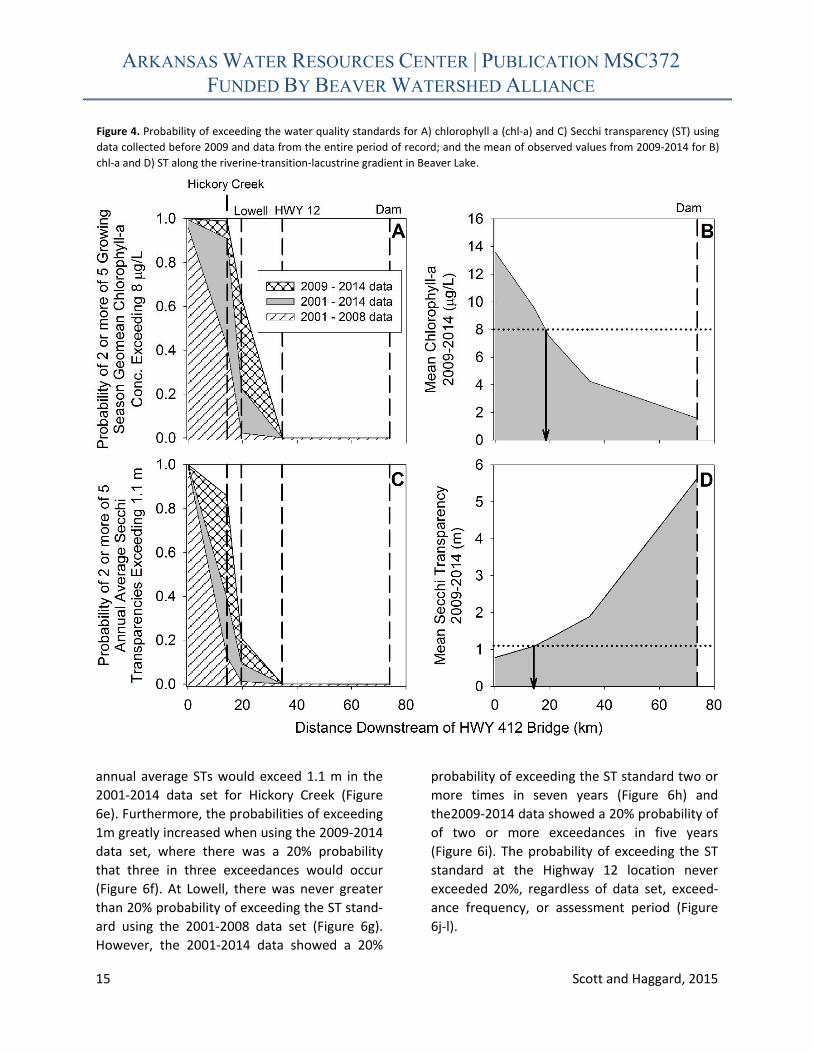
the different data sets (2001‐2008 vs. 2001‐
2014 vs. 2009‐2014) used for the analysis
(Figure 4). There was a near 100% probability
that the growing season geometric mean chl‐a
con‐centration would exceed 8 µg/L in two or
more years of a five year assessment period at
the Highway 412 location, regardless of which
data set was used (Figure 4a). This probability
dropped to approximately 40% at the Hickory
Creek location when using data collected be‐
tween 2001‐2008. However, there was greater
than 90% probability that two or more growing
season geometric mean chl‐a concentrations
would exceed 8 µg/L at Hickory Creek in the five
year assessment period when using data from
2001‐2014 or 2009‐2014 (Figure 4a). For the
Lowell location, these probabilities dropped to
< 5%, 20%, and 70% for the 2001‐2008, 2001‐
2014, and 2009‐2014 data sets, respectively.
There was < 1% probability that the growing
season geometric mean chl‐a concentration
would exceed 8 µg/L two or more times in a five
year assessment period for samples collected at
Highway 12 or further downstream in the lake.
These results are consistent with the spatial
pattern in chl‐a concentrations. The average of
growing season geometric mean chl‐a con‐
centrations from 2009‐2014 decreased from
upstream to downstream, and the 8 µg/L target
occurred approximately 20 km downstream of
Highway 412, which corresponds closely with
the Lowell sampling location (Figure 4b).
There was a near 100% probability that the ann‐
‐ual average ST would exceed 1.1 m in two or
more years of a five year assessment period at
the Highway 412 location regardless of which
data set was used (Figure 4c). This probability
Table 3. Annual average Secchi transparency (ST) for each sampling location on Beaver Lake. Samples were collected at Hickory
Creek since 2009, but a regression model was used to estimate values for the period of record.
Sampling Site (distance from inflow [km])
HWY 412 (0.0)
Hickory Creek (8.9)
Hickory Creek*(8.9)
Lowell (12.2)
HWY 12 (21.5)
Dam (45.9)
Year Annual Average ST (m)
2001 0.9 1.5 2.1 2.8 6.6
2002 1.1 1.2 1.5 2.0 4.8
2003 0.9 1.4 1.9 2.4 5.2
2004 1.2 1.2 1.6 1.7 5.0
2005 1.0 1.3 1.7 2.0 5.1
2006 1.0 1.3 1.7 2.2 6.0
2007 1.1 1.3 1.8 1.7 6.6
2008 0.8 1.0 1.1 1.7 3.5
2009 0.9 1.0 1.1 1.2 1.7 5.1
2010 0.4 1.1 1.1 1.4 2.1 5.4
2011 1.0 1.0 0.9 1.0 1.4 5.6
2012 0.7 1.0 1.0 1.1 1.9 5.3
2013 0.9 1.2 1.2 1.4 2.2 6.3
2014 0.8 1.2 1.2 1.6 2.1 6.3
Average 0.9 1.1 1.2 1.5 2.0 5.5
*Data predicted from regression relationship derived from samples at Lowell and Hickory Creek.
ARKANSAS WATER RESOURCES CENTER | PUBLICATION MSC372 FUNDED BY BEAVER WATERSHED ALLIANCE
13 Scott and Haggard, 2015
dropped to approximately 10%, 40%, or 90% at
the Hickory Creek location when using data
collected between 2001‐2008, 2001‐2014, or
2009‐2014, respectively. The probability of
exceeding the annual average ST criteria at
Lowell was 20% or less for all data sets (Figure
4c). There was < 1% chance that the annual
average ST would exceed 1.1 m two or more
times in a five year assessment period for
samples collected at Highway 12 or further
downstream in the lake. These results are
consistent with the spatial pattern in ST. The
average of annual average ST from 2009‐2014
increased from upstream to downstream, and
the 1.1 m target occurred approximately 15 km
downstream of Highway 412, which corre‐
sponds closely with the Hickory Creek sampling
location (Figure 4d).
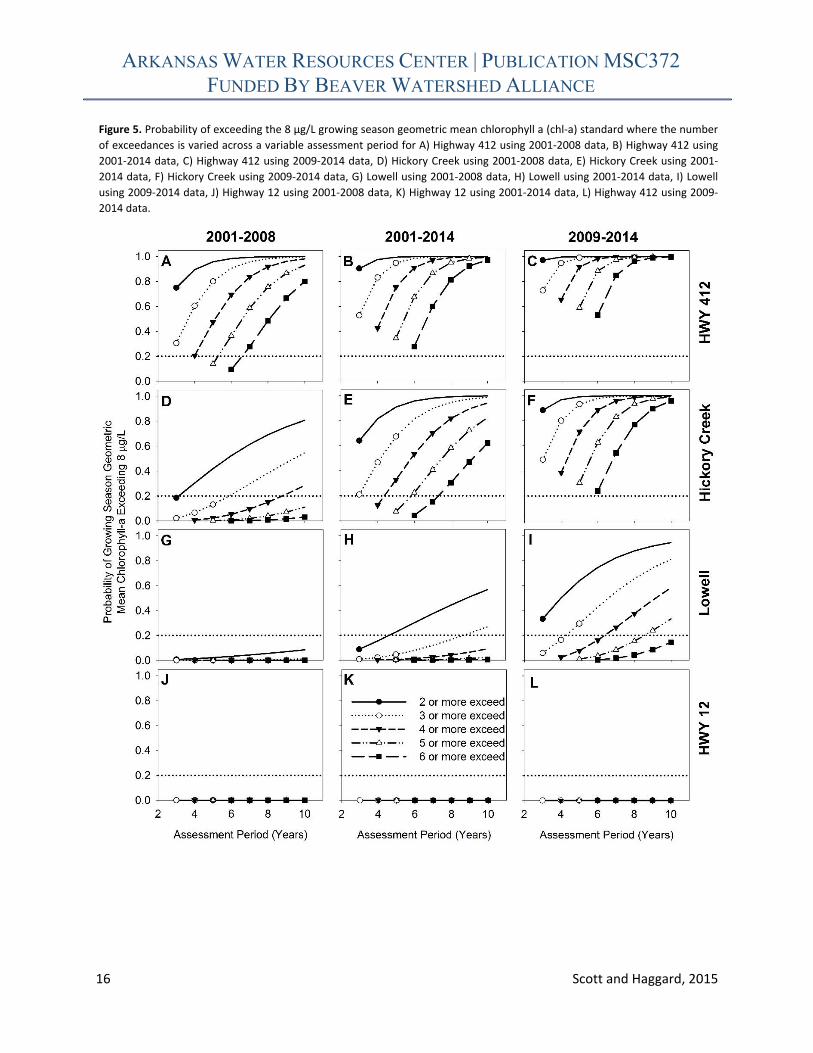
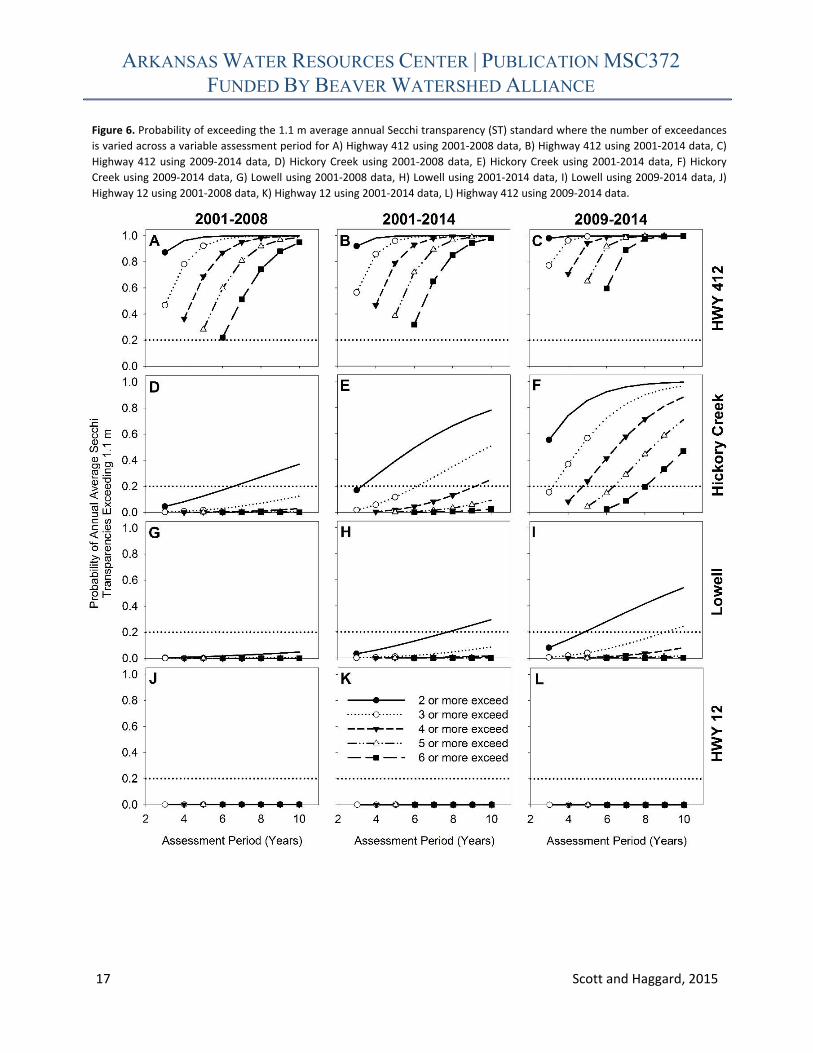
In general, as the assessment period was
increased from the three to ten years, the
probability of observing values greater than the
8 µg/L growing season geometric mean (Figure
5) or the 1.1 m annual average ST (Figure 6) also
increased. The probability of observing exceed‐
ances in both standards across all sampling
locations was greater in the 2009‐2014 data set
compared to the 2001‐2008 data set (Figures 5
and 6). As a result, 2001‐2014 data had exceed‐
ance probabilities that reflect this variability.
Increasing the number of required exceedances
in any assessment period always decreases the
probability of exceeding the standards. For
example, there was a greater than 90% chance
of exceeding the chl‐a standard twice or more
in five years at the Hickory Creek location using
the 2001‐2014 data set (Figure 5e). However,
this probability decreased to approximately
60%, 30%, and 10% as the number of exceed‐
ances for a five year assessment period were
increased to three or more, four or more, or
five, respectively (Figure 5e).
A 20% probability threshold was used in order
to compare the various assessment periods and
exceedance frequencies among data sets and
monitoring locations for both the chl‐a and ST
standards. The probability of exceeding the 8
µg/L growing season geometric mean chl‐a at
Highway 412 was always greater than 20%
(Figure 5 a‐c) except when using an exceedance
minimum of four or more years, respectively
(Figure 5a). There was a 20% probability that
three in six growing season geometric mean chl‐
a concentrations would exceed 8 µg/L at Hick‐
ory Creek in the 2001‐2008 data set (Figure 5d).
Figure 3. Long‐term trends in A) growing season geometric
mean chlorophyll a (chl‐a) concen‐trations, and B) annual
average Secchi transparencies (ST) at sites in Beaver Lake.
ARKANSAS WATER RESOURCES CENTER | PUBLICATION MSC372 FUNDED BY BEAVER WATERSHED ALLIANCE
14 Scott and Haggard, 2015
When using the 2001‐2014 data set, there was
a 20% probability than five in six growing
season geometric mean chl‐a concentrations
would exceed 8 µg/L at Hickory Creek (Figure
5e). Six of six samples met the 20% probability
threshold at the Hickory Creek location with the
2009‐2014 data set (Figure 5g). At Lowell, there
was never greater than 20% probability of
exceeding the chl‐a standard using the 2001‐
2008 data set (Figure 5g). However, the 2001‐
2014 data showed a 20% probability of
exceeding the chl‐a standard two or more times
in five years (Figure 5h). There was a 20%
probability of having four of six growing season
geometric mean chl‐a exceed 8 µg/L at Lowell
with the 2009‐2014 data set (Figure 5i). The
probability of exceeding the chl‐a standard at
Highway 12 never exceeded 20%, regardless of
data set, exceedance frequency, or assessment
period (Figure 5j‐l).
The probability or exceeding the 1.1 annual
average ST at Highway 412 was always greater
than 20% regardless of data set, exceedance
frequency, or assessment (Figure 6a‐c). There
was a 20% probability that two in seven annual
average STs would exceed 1.1 m in the 2001‐
2008 data set for Hickory Creek (Figure 6d).
However, there was an approximate 20%
probability that two in three or three in six
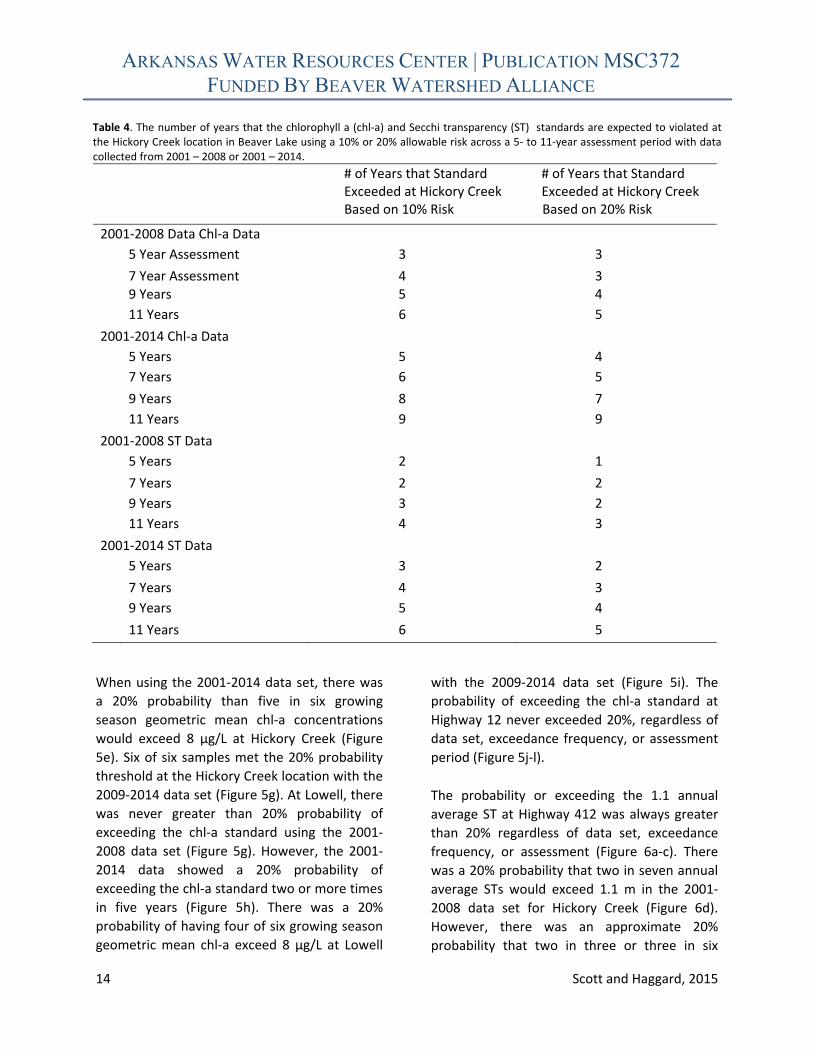
Table 4. The number of years that the chlorophyll a (chl‐a) and Secchi transparency (ST) standards are expected to violated at the Hickory Creek location in Beaver Lake using a 10% or 20% allowable risk across a 5‐ to 11‐year assessment period with data collected from 2001 – 2008 or 2001 – 2014.
# of Years that Standard Exceeded at Hickory Creek Based on 10% Risk
# of Years that Standard Exceeded at Hickory Creek Based on 20% Risk
2001‐2008 Data Chl‐a Data
5 Year Assessment 3 3
7 Year Assessment 4 3 9 Years 5 4
11 Years 6 5
2001‐2014 Chl‐a Data
5 Years 5 4
7 Years 6 5
9 Years 8 7
11 Years 9 9
2001‐2008 ST Data
5 Years 2 1
7 Years 2 2
9 Years 3 2
11 Years 4 3
2001‐2014 ST Data
5 Years 3 2
7 Years 4 3
9 Years 5 4
11 Years 6 5
ARKANSAS WATER RESOURCES CENTER | PUBLICATION MSC372 FUNDED BY BEAVER WATERSHED ALLIANCE
15 Scott and Haggard, 2015
annual average STs would exceed 1.1 m in the
2001‐2014 data set for Hickory Creek (Figure
6e). Furthermore, the probabilities of exceeding
1m greatly increased when using the 2009‐2014
data set, where there was a 20% probability
that three in three exceedances would occur
(Figure 6f). At Lowell, there was never greater
than 20% probability of exceeding the ST stand‐
ard using the 2001‐2008 data set (Figure 6g).
However, the 2001‐2014 data showed a 20%
probability of exceeding the ST standard two or
more times in seven years (Figure 6h) and
the2009‐2014 data showed a 20% probability of
of two or more exceedances in five years
(Figure 6i). The probability of exceeding the ST
standard at the Highway 12 location never
exceeded 20%, regardless of data set, exceed‐
ance frequency, or assessment period (Figure
6j‐l).
Figure 4. Probability of exceeding the water quality standards for A) chlorophyll a (chl‐a) and C) Secchi transparency (ST) using
data collected before 2009 and data from the entire period of record; and the mean of observed values from 2009‐2014 for B)
chl‐a and D) ST along the riverine‐transition‐lacustrine gradient in Beaver Lake.
ARKANSAS WATER RESOURCES CENTER | PUBLICATION MSC372 FUNDED BY BEAVER WATERSHED ALLIANCE
16 Scott and Haggard, 2015
Figure 5. Probability of exceeding the 8 µg/L growing season geometric mean chlorophyll a (chl‐a) standard where the number
of exceedances is varied across a variable assessment period for A) Highway 412 using 2001‐2008 data, B) Highway 412 using
2001‐2014 data, C) Highway 412 using 2009‐2014 data, D) Hickory Creek using 2001‐2008 data, E) Hickory Creek using 2001‐
2014 data, F) Hickory Creek using 2009‐2014 data, G) Lowell using 2001‐2008 data, H) Lowell using 2001‐2014 data, I) Lowell
using 2009‐2014 data, J) Highway 12 using 2001‐2008 data, K) Highway 12 using 2001‐2014 data, L) Highway 412 using 2009‐
2014 data.
ARKANSAS WATER RESOURCES CENTER | PUBLICATION MSC372 FUNDED BY BEAVER WATERSHED ALLIANCE
17 Scott and Haggard, 2015
Figure 6. Probability of exceeding the 1.1 m average annual Secchi transparency (ST) standard where the number of exceedances
is varied across a variable assessment period for A) Highway 412 using 2001‐2008 data, B) Highway 412 using 2001‐2014 data, C)
Highway 412 using 2009‐2014 data, D) Hickory Creek using 2001‐2008 data, E) Hickory Creek using 2001‐2014 data, F) Hickory
Creek using 2009‐2014 data, G) Lowell using 2001‐2008 data, H) Lowell using 2001‐2014 data, I) Lowell using 2009‐2014 data, J)
Highway 12 using 2001‐2008 data, K) Highway 12 using 2001‐2014 data, L) Highway 412 using 2009‐2014 data.
ARKANSAS WATER RESOURCES CENTER | PUBLICATION MSC372 FUNDED BY BEAVER WATERSHED ALLIANCE
18 Scott and Haggard, 2015
Discussion
The objective of this study was to derive an
initial assessment methodology based on the
method(s) used to develop the site‐specific
numeric criteria for chl‐a and ST in Beaver Lake
at Hickory Creek. Our intention was to provide
information for the regulatory agencies and
stakeholders on options for assessing the
promulgated criteria as currently written in
Arkansas Regulation No. 2 (APCEC 2012),
because the numeric criteria were not originally
linked to an assessment method. In order to
meet these objectives, we used the original
standard development document, and our own
analysis of data collected in Beaver Lake since
2001 to re‐create the work done in the standard
development, to derive a single assessment
methodology recommendation. We also offer
several other assessment options for consider‐
ation.
Assessment Methodology Recommendation and
Justification
Assessment Methodology Recommendation
The minimum number of exceedances that
trigger a water‐quality violation should be
greater than one‐half the number of years in the
assessment period.
The chl‐a and ST standards for Beaver Lake at
Hickory Creek were developed to protect the
drinking water designated use of Beaver Lake at
a location above all water utility intakes (FTN
2008). Although the standards were developed
from a weight of evidence approach, the
recommended standards were also effectively
equivalent to the expected long‐term average
conditions in Beaver Lake at Hickory Creek.
Thus, at least half of the growing season
geometric mean chl‐a values and annual
average ST values in an assessment period
should be expected to exceed these criteria.
This assumes that the long‐term geometric
mean chl‐a and annual average ST are normally
distributed with equal errors, which is sup‐
ported by our analysis.
Given that the number of violations should be
greater than or equal to one‐half the number of
years in an assessment period, it seems logical
that the assessment period should be an odd
number of years. In Table 4, we offer the
expected number of years in which chl‐a and ST
data should be expected to exceed the water
quality standards based an allowable risk of
10% or 20%, across several options for odd‐
numbered assessment periods. The 2001‐2008
data represent the conditions measured in
Beaver Lake prior to the recommendation of
the water quality standards and show that
approximately half of the growing season
geometric mean chl‐a would be greater than 8
µg/L over any assessment period, regardless of
whether a 10% or 20% allowable risk is used.
These results are similar to the range of
acceptable risks quantified in the original
standard development document for chl‐a at
the Lowell location (12% ‐ 18% risk, FTN 2008).
When the entire 2001 – 2014 data set was used,
virtually all of the geometric mean chl‐a are
expected to exceed the standard in a five‐year
assessment and as many as nine exceedances
are expected in an eleven‐year assessment,
regardless of the 10% or 20% risk level. A similar
pattern was apparent for ST violations, but the
number of years in violation was slightly less
across all options.
The substantially greater number of expected
violations that occur when using the 2001 –
2014 data set indicate that chl‐a and ST values
in Beaver Lake have changed in recent years.
Although detecting those trends and causes was
beyond the scope of this study, it is important
to note that using the recommended minimum
ARKANSAS WATER RESOURCES CENTER | PUBLICATION MSC372 FUNDED BY BEAVER WATERSHED ALLIANCE
19 Scott and Haggard, 2015
number of exceedances for any assessment
period (3 out of 5 years, 4 out of 7 years, 5 out
of 9 years, or 6 out of 11 years) will likely result
in a water quality violation. The apparent
increase in chl‐a and decrease in ST identified in
this study may well indeed indicate that water
quality has deteriorated in Beaver Lake since
2008. Thus, selecting the recommended min‐
imum allowable exceedances would likely result
in a listing that was justified.
Also considered when choosing an assessment
methodology is determining whether or not the
lake is actually supporting its drinking water
supply designated use. This can be defined as
whether or not municipal water providers have
been able to meet their drinking water
standards using conventional treatment
processes. Beaver Water District, the major
water utility using Beaver Lake as a raw water
source, has not violated drinking water
standards during this time (BWD personal
communication, 2014). However, BWD adopted
a non‐conventional treatment technique, in
order to address stage 2 treatment criteria for
the DBP total trihalomethanes (TTHM) that
were implemented in 2013. BWD added
chlorine dioxide as a pre‐treatment oxidant in
order to decrease TTHM levels in their
distribution system, and the use of this non‐
conventional treatment decreased TTHM levels.
If this treatment option had not been added,
TTHM levels would likely not be in compliance
with the stage 2 treatment criteria adopted in
2013 (BWD personal communication, 2014).
A recent study also examined how eutro‐
phication may affect TTHMs during the
treatment of Beaver Lake water. Experimental
nutrient additions to Beaver Lake water were
used to increase chl‐a by three orders of
magnitude. The formation potential of
trichloromethane (TCM), which is a major
component of TTHMs, increased by only 0.05
µg/L for every 1 µg/L increase in chl‐a (Mash et
al. 2014). Instead, the replication of the
experiment across the growing season revealed
a much larger potential for variation in TCM
based on seasonal variations in DOC and other
related chemical characteristics of the Beaver
Lake source water. For example, TCM formation
potential at 8 µg/L chl‐a varied from less than
90 to more than 160 µg/L, across the different
experiments over the growing season (Mash et
al. 2014). However, the study did indicate that
a greater amount of treatment resources
would be necessary to disinfect and coagulate
water with greater chl‐a, which agrees with
patterns observed since 2008 from the Beaver
Water District.
The initial assessment criteria recommended
here were based on the information and
methods used to develop the chl‐a and ST
standards initially. However, in defining an
assessment method, the regulatory agencies
are effectively defining whether or not Beaver
Lake is impaired for its designated beneficial
uses, which include drinking water supply. As
stated previously, choosing the recommended
minimum allowable exceedances (3 out of 5
years, 4 out of 7 years, 5 out of 9 years, or 6 out
of 11 years) will likely result in an immediate
listing of Beaver Lake. Although we maintain
the primary recommendation that the
minimum number of exceedances that trigger a
water‐quality violation should be greater than
one‐half the number of years in the assessment
period, regulatory agencies may prefer to
consider other assessment options which would
not immediately result in listing Beaver Lake as
impaired. We identify a few of those options in
the following text.
Other Assessment Options
A number of other assessment options could be
appropriate for the chl‐a and ST criteria for
ARKANSAS WATER RESOURCES CENTER | PUBLICATION MSC372 FUNDED BY BEAVER WATERSHED ALLIANCE
20 Scott and Haggard, 2015
Beaver Lake at Hickory Creek. Each of these
considerations are first based on the fact that
the standards were effectively equivalent to a
long‐term expected average condition in Beaver
Lake at Hickory Creek. Thus, they first comply
with our assessment methodology recom‐
mendation. They also offer possibilities for
decreasing the risk of a violation based on how
the growing season geometric mean chl‐a and
annual average ST data are assessed.
Consider a Long‐Term Assessment Period
ADEQ currently relies primarily on a five year
assessment period. As stated previously, the
use of greater than 1 violation in a five year
period suggests a 40% loss of use, which ADEQ
often relies on in assessment (ADEQ personal
communication, 2014). However, we have
demonstrated in this study that a more than
one in five year assessment is inappropriate
because the adopted standards were equivalent
to expected long‐term average conditions.
Indeed our analysis is supported by the fact that
four of six growing season geometric mean chl‐
a and three of six annual average ST measured
at the Hickory Creek location in Beaver Lake
exceed the water quality standards. Expanding
the assessment period to seven, nine, or even
eleven years would allow one to five additional
years of data to be collected to inform the
current assessment. Multiple studies have
indicated that decadal‐scale trends in chl‐a in
lakes may be related to climatic variability
(Arhonditis et al. 2004, Hampton et al. 2008). A
similar analysis has not yet been conducted for
Beaver Lake, although that analysis is planned
as part of the second and third phases of this
project. In the meantime, using a longer
assessment period that approaches or exceeds
a decade in length (9 or 11 years) may capture
the full range of potential chl‐a variation due to
climate variability.
The regulatory agencies could also consider
using a rolling or moving average of the growing
season geometric mean chl‐a concentrations
and the annual average ST. This would ‘smooth’
the variability in chl‐a concentrations that could
be driven by climatic patterns, lake man‐
agement or anthropogenic factors. Although
this approach was not explored in detail, the
same analysis used in this study could be
applied to the moving average over a defined
period. However, the constraint that the criteria
promulgated were effectively representative of
the long‐term average condition at Hickory
Creek still influences the probabilities of
exceedance – because even a moving average
of the growing season geometric mean chl‐a or
annual average ST for the Hickory Creek
location should be approximately equivalent to
the numeric criteria defined for Beaver Lake.
For example, there was a 32% risk that a five‐
year moving average of the annual average ST
would be less than 1.1 m in two out of five
years at Hickory Creek. The risk that the chl‐a
criteria would be exceeded in two out of five
years was 86% when using a five year moving
average of the growing season geometric mean
chl‐a concentrations at Hickory Creek.
Consider Coupling the Standards
The chl‐a and ST were likely intended to be
considered as separate. In other words, a
violation of either standard would result in
listing the lake as impaired. However, the
patterns in chl‐a and ST in Beaver Lake conform
to common limnological models that have been
used to manage eutrophication. Thus, the
growing season geometric mean chl‐a
concentration and annual average ST at Hickory
Creek are strongly related because chl‐a
concentration largely controls ST (Carlson
1977). Thus, another option for decreasing the
risk of listing Beaver Lake as impaired given the
current promulgated standards would be to
ARKANSAS WATER RESOURCES CENTER | PUBLICATION MSC372 FUNDED BY BEAVER WATERSHED ALLIANCE
21 Scott and Haggard, 2015
require that both standards are violated in
more than half of the years in which the lake is
assessed. This assessment method would
provide the most conservative approach for
listing the lake as impaired because it
effectively decreases the risk of a single variable
resulting in a water quality violation. Instead,
the approach relies on confirmatory evidence
and is supported by the fact that Beaver Lake
conforms to common limnological models that
show a strong relationship between chl‐a and
ST.
Consider Revising the Standards
As currently adopted into Arkansas State Law,
the chl‐a and ST standards apply to a growing
season geometric mean and an annual average,
respectively, observed in monthly sampling at
the Hickory Creek location in Beaver Lake. The
standard values were based on a weight of
evidence approach, but the location to which
they were applied in Beaver Lake was
effectively equivalent to the expected long‐
term average conditions. Thus, another possible
consideration for assessment is moving the
location against which the criteria are
evaluated. This would allow room for variation
so that the minimum number of violation could
be less than half of the years in an assessment
period, because the long‐term expected
average conditions downstream of Hickory
Creek were expected to be less than the
promulgated standards. The probability of
exceedance analysis presented within this study
could be used to inform regulatory agencies and
stakeholders on the number of exceedances
allowed with an assessment period. For
example, two or more exceedances for chl‐a
and/or ST in five years at Lowell would be
within the desired risk (20% or less). When
using a five year moving average, there was a
10% or less risk that two or more exceedances
would occur in five years for chl‐a or ST. The
difficulty with this approach is that the actual
monitoring location is currently written into
Arkansas Regulation No. 2, and would require a
revision to the standard.The options presented
in this section were intended to demonstrate
how water quality in Beaver Lake could be
assessed against the promulgated standards
that would minimize the risk of exceeding the
standards. We have provided these consider‐
ations because in selecting an assessment
methodology, the regulatory agencies are
effectively tasked with identifying whether or
not the lake is impaired based on current
conditions. This choice is subjective and the
considerations provided in this section
represent scientifically‐defensible approaches
that could be used to identify a violation or
non‐violation based on current conditions. That
choice is beyond the scope of the science and
instead relies on the opinion of the regulatory
agencies in concert with input from various
stakeholders, which should be informed by
science.
Limnological Patterns in Beaver Lake and Data
Limitations
As expected according to reservoir limnology
theory (Thornton et al. 1990), chl‐a concen‐
trations decreased and STs increased along the
riverine‐transition‐lacustrine gradient in Beaver
Lake. More importantly, chl‐a concentrations
among these sites varied predictably according
to the model for natural lakes proposed by
Dillon and Rigler (1974). Similarly, the ST in
Beaver Lake was strongly related to chl‐a
concentrations and conformed to the model
proposed by Carlson (1977). Thus, Beaver Lake
is similar to many reservoirs in that its
productivity is greatest near the inflow and
diminishes closer to the dam. But, the lake also
conforms to common limnological models that
are often used in water‐quality management
decisions for natural lakes.
ARKANSAS WATER RESOURCES CENTER | PUBLICATION MSC372 FUNDED BY BEAVER WATERSHED ALLIANCE
22 Scott and Haggard, 2015
The probability analyses used to derive assess‐
ment methodologies in this project require
relatively long‐term data and assume no
directional change over the period of record. It
is important to note that both of these
requirements had to be stretched in order to
complete the analysis. For example, long‐term
data were not available for the Hickory Creek
location, so a modeling approach based on the
original standard development (FTN 2008) was
used to calculate exceedance probabilities for
this site. Further, there was a long‐term trend in
the growing season geometric mean chl‐a and
annual average ST at the Lowell location. No
trends were apparent at the other monitoring
locations. However, too few data were available
to assess this trend at Hickory Creek.
The occurrence of long‐term trends at the
Lowell location at Beaver Lake support the idea
that algal biomass is increasing through time at
this location. What remains unknown is
whether or not these trends were driven by
changes in the watershed or by long‐term
climate‐based variability (Arhonditis et al. 2004,
Hampton et al. 2008). These possibilities will be
explored in the next phase of the project. For
the purposes of this project, we simply
acknowledge this trend observed at a single
monitoring location and developed the follow‐
ing recommendations based on the probability
analyses shown in the results.
It is important to emphasize that long‐term data
were not available at the Hickory Creek location
when the chl‐a and ST standards were
developed and adopted (FTN 2008). As a result,
the standard developers used a regression
relationship between measured values at the
Highway 412 and Lowell locations for both chl‐a
and ST to derive estimates for these parameters
at Hickory Creek. Their model had very poor
predictive power for chl‐a (R2 = 0.11; p = 0.1),
but was stronger for ST (R2 = 0.55; p < 0.001).
The poor predictive power of their model was
perhaps attributable to limited data available
for their analysis. That same analysis was
repeated for chl‐a predictions at Hickory Creek
in this study (predicted data in Table 2).
Although the chl‐a model was substantially
improved using USGS data collected from 2001‐
2014 (R2 = 0.40; p = 0.03), the predictions
derived from the model were not strongly
correlated to the measured values between
2009‐2014 (Figure 7a). We also used a direct
predictive model to estimate the ST at Hickory
Creek from the ST at Lowell, which was stronger
than the model developed by FTN (2008). The
ST model using data from 2001‐2008 performed
better (R2 = 0.75; p = 0.01), and predicted
values were reasonably correlated with
measured values between 2009 and 2014
(Figure 7b).
The reliance on predicted data at Hickory Creek
for standard development is important,
particularly given the poor prediction power of
the models derived from existing data (Figure
7). Thus, the exceedance probabilities calc‐
ulated using these data could be unreliable.
However, the exceedance probability calculated
for the Highway 412 location and Lowell
locations were based on actual direct
measurements. Because the exceedance prob‐
abilities at Hickory Creek fell between the
exceedance probabilities at the Highway 412
location and Lowell (Figure 4), the estimates
should be reasonably realistic. Nevertheless,
the chl‐a and ST standards for Hickory Creek
should be re‐evaluated when sufficient data
(> 10 years) are available.
One issue that should be reiterated is the
possible lack of stationarity in the data collected
between 2001‐2014. Although the Lowell
location was the only one in which growing
season geometric mean chl‐a and annual
average ST were changing through time, the
ARKANSAS WATER RESOURCES CENTER | PUBLICATION MSC372 FUNDED BY BEAVER WATERSHED ALLIANCE
23 Scott and Haggard, 2015
relationships between these variables and time
at the other locations may suggest a weak
trend. Thus, a more detailed examination of the
trends is necessary to understand it chl‐a and ST
are changing in Beaver Lake. If these para‐
meters are changing, the next obvious question
will be why? It is entirely possible that changes
in the watershed could be leading to increased
nutrient inputs that are driving increased chl‐a
and decreased ST. However, it is also possible
that the trends in these data are attributable to
long‐term climatic variation, which has been
shown for other lakes around the world
(Arhonditsis et al. 2004; Hampton et al. 2008).
Thus, phases two and three of the current
project, which will evaluate trends in the in‐lake
variables and watershed nutrient concen‐
trations will provide crucial information as to if
and how the lake may be changing with time
and what effect watershed management could
have on reversing these trends.
Conclusion
The purpose of this project was to derive an
initial assessment methodology based on the
original methods used to develop the chl‐a and
ST standards for Beaver Lake. Based on the
methods for standard development, we have
offered a specific recommendation that the
minimum number of exceedances that trigger a
water‐quality violation should be greater than
one‐half the number of years in the assessment
period. Adopting this minimum alone would
likely result in a violation of the water quality
standards for Beaver Lake, based on the current
data available for Beaver Lake at Hickory Creek
and the exceedance probabilities derived using
the approach used to develop the standards.
Thus, we have also offered several other
considerations that would minimize the risk of
listing the lake as impaired in an immediate
assessment. We have offered these options
because the values of the standards were not
originally expected to result in immediate water
quality violations in Beaver Lake (FTN 2008).
Thus, these considerations provide the regula‐
tory agencies with scientifically‐defensible
approaches to decide, based on current data,
whether or not Beaver Lake is impaired for its
designated beneficial uses.
Literature Cited
APCEC (Arkansas Pollution Control and Ecology
Commission). 2012. REGULATION NO.
2: Regulation establishing water quality
standards for surface waters of the
State of Arkansas. APCEC #014.00‐002.
Arhonditsis, G.B., M. Winder, M.T. Brett, and
D.E. Schindler. 2004. Patterns and
mechanisms of phytoplankton varia‐
bility in Lake Washington (USA). Water
Research 38: 4013‐4027.
Callihan, C.W., J.P. Hassett, J.B. Hyde, R.A.
Entringer, and R.K. Klake. 2013.
Proposed nutirnet criteria for water
supply lakes and reservoirs. Journal –
Am. Water Works Assoc. 105:E157‐
E172.
Carlson, R.E. 1977. A trophic state index for
lakes. Limnology and Oceanography 22:
361‐368.
Cooke, G.D., E.B. Welch, S.A. Peterson, S.A.
Nichols. 2005. Restoration and manage‐
ment of lakes and reservoirs. Taylor and
Francis.
Dillon, P.J. and F.H. Rigler. 1974. The
phosphorus‐chlorophyll relationship in
lakes. Limnology and Oceanography 19:
767‐773.
EPA. 2014. State Development of Numeric
Criteria for Nitrogen and Phosphorus
Pollution.http://cfpub.epa.gov/wqsits/n
nc‐development/.
EPA. 2010. Using Stressor‐response Relation‐
ships to Derive Numeric Nutrient
Criteria stressor‐response guidance
ARKANSAS WATER RESOURCES CENTER | PUBLICATION MSC372 FUNDED BY BEAVER WATERSHED ALLIANCE
24 Scott and Haggard, 2015
document. Office of Water EPA‐820‐S‐
10‐001.
Filstrup, C.T., T. Wagner, P.A. Spraano, E.H.
Stanley, C.A. Stow, K.E. Webster, and
J.A. Downing. 2014. Regional variability
among nonlinear chlorophyll‐phos‐
phorus relationships in lakes. Limnol.
Oceanogr. 59(5):1691‐1703.
FTN and Associates. 2008. Beaver Lake site‐
specific water quality criteria develop‐
ment: Recommended criteria. FTN No.
3055‐021.
Haan, C.T., B.J. Barfield, and J.C. Hayes. Design
Hydrology and Sedimentology for Small
Catchments. Academic Press, San
Diego, CA, USA; 588 pp.
Hampton, S.E., L.R. Izmest’eva, M.V. Moore, S.L.
Katz, B. Dennis, E.A. Silow. 2008. Sixty
years of environmental change in the
world’s largest freshwater lake – Lake
Baikal, Siberia. Global Change Biology
14: 1947‐1958.
Herlihy, A.T., N.C. Kamman, J.C. Sifneos, D.
Charles, M.D. Enache, and R.J.
Stevenson. 2013. Using multiple ap‐
proaches to develop nutrient criteria for
lakes in the conterminous USA.
Freshwater Science 32(2): 367‐384.
Jones, J.R., D.V. Obrecht, and A.P. Thorpe. 2011.
Chlorophyll maxima and chlorophyll:
total phosphorus ratios in Missouri
reservoirs. Lake and Reservoir Manage‐
ment 27: 321‐328.
Mash, C.A., B.A. Winston, D.A. Meints, A.D.
Pifer, J.T. Scott, W. Zhang, and J.L.
Fairey. 2014. Assessing tricholoro‐
methane formation and control in algal‐
stimulated waters amended with
nitrogen and phosphorus. Environ‐
mental Science Process and Impacts 16:
1290‐1299.
Scott, J.T., M.J. McCarthy, T.G. Otten, MM.
Steffon, B.C. Baker, E.M. Grantz, S.W.
Wilhelm, H.W. Paerl. 2013. Comment:
an alternative interpretation of the
relationship between TP:TN and
microcystins in Canadian lakes.
Canadian Journal of Fisheries and
Aquatic Sciences. 70: 1265‐1268.
Thornton, K.W., B.L. Kimmel, and F.E. Payne.
1990. Reservoir Limnology: Ecological
Perspectives. Wiley Publishers, New
York City, New York.
USACE (U.S. Army Corp of Engineers), 1998.
Beaver Lake, White River; Water
Control Manual. Department of the
Army, Little Rock District, Corps of
Engineers.
Yuan, L.L., and A.I. Pollard. 2014. Classifying
lakes to improve precision of nutrient‐
chlorophyll relationships. Freshwater
Science 33(4): 1184‐1194.
Yuan, L.L., A.I. Pollard, S. Pather, J.L. Oliver, and
L. D’Anglada. 2014. Managing
microcystin: identifying national‐scale
thresholds for total nitrogen and
chlrophyll a. Freshwater Biology 59:
1970‐1981.