M.Sc. in Meteorology Synoptic Meteorology
135
M.Sc. in Meteorology Synoptic Meteorology [MAPH P312] Prof Peter Lynch Second Semester, 2004–2005 Seminar Room Dept. of Maths. Physics, UCD, Belfield.
Transcript of M.Sc. in Meteorology Synoptic Meteorology
M.Sc. in Meteorology
Synoptic Meteorology[MAPH P312]
Prof Peter Lynch
Second Semester, 2004–2005Seminar Room
Dept. of Maths. Physics, UCD, Belfield.
Part 5
Atmospheric Chemistry
These lectures follow closely the text of Wallace & Hobbs.
2
3
Introduction�Atmospheric chemistry studies were
originally concerned with determiningthe major gases in the Earth’satmosphere.
� In the latter half of the 1900s air pol-lution became an increasing problem.
�Acid deposition was recognized as awidespread problem in the 1970s.
4
� It became obvious that pollutants canbe transported over large distances andundergo significant transformations asthey move through the atmosphere.
�The identification in 1985 of signifi-cant depletion of ozone in the Antarc-tic stratosphere focussed attention onstratospheric chemistry.
�More recently, studies of the effects oftrace chemical constituents in the at-mosphere on the climate of the Earthhave moved to centre stage.
5
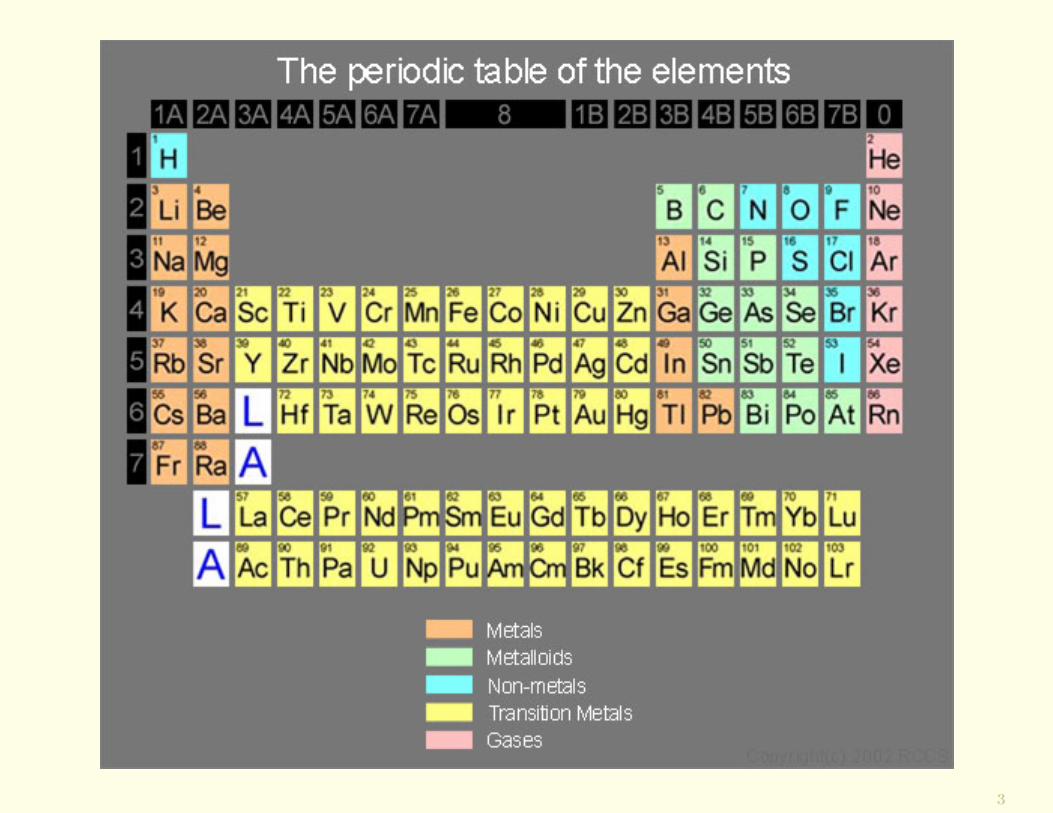
1. Composition of Tropospheric Air• Oxygen occupies 21% by volume of dry air.
• Nitrogen occupies 78%.
• The next two most abundant gases in air areargon (∼1%) and carbon dioxide (∼0.03%).
• Together these four gases account for 99.99% of thevolume of dry air.
• Many of the remaining minute amounts of the many othergases in air are of prime importance in atmospheric chem-istry because of their chemical reactivity.
6
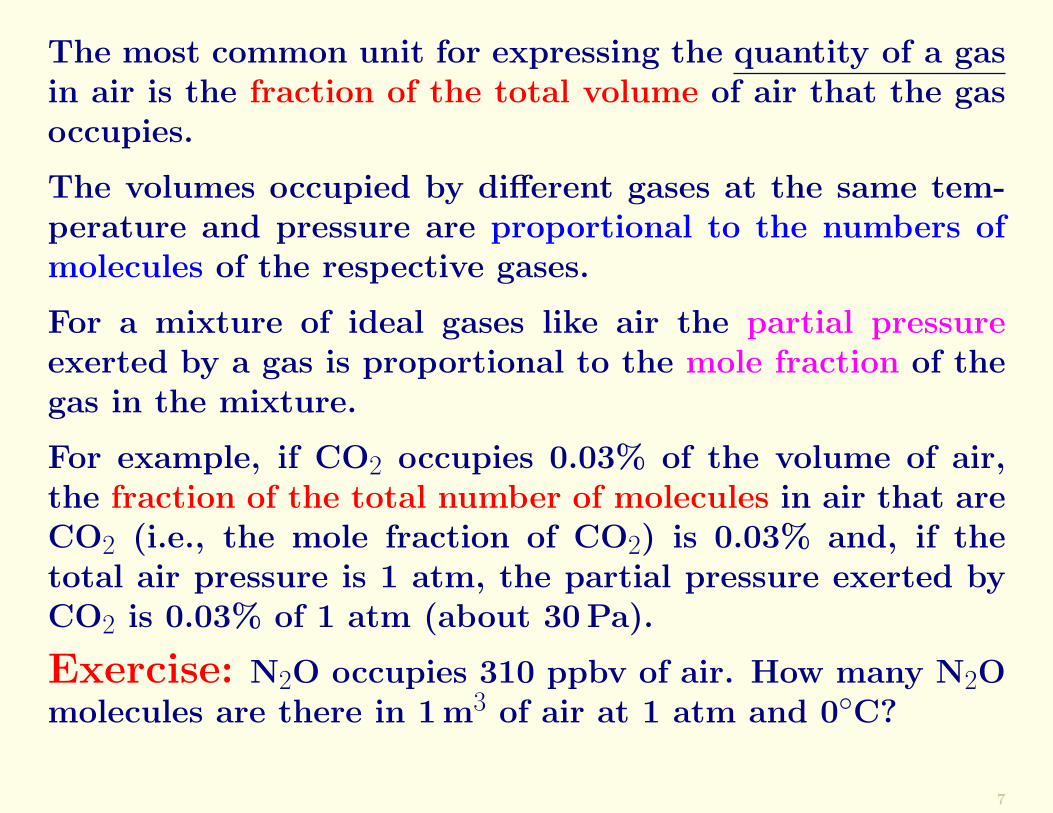
The most common unit for expressing the quantity of a gasin air is the fraction of the total volume of air that the gasoccupies.
The volumes occupied by different gases at the same tem-perature and pressure are proportional to the numbers ofmolecules of the respective gases.
For a mixture of ideal gases like air the partial pressureexerted by a gas is proportional to the mole fraction of thegas in the mixture.
For example, if CO2 occupies 0.03% of the volume of air,the fraction of the total number of molecules in air that areCO2 (i.e., the mole fraction of CO2) is 0.03% and, if thetotal air pressure is 1 atm, the partial pressure exerted byCO2 is 0.03% of 1 atm (about 30Pa).
Exercise: N2O occupies 310 ppbv of air. How many N2Omolecules are there in 1m3 of air at 1 atm and 0◦C?
7
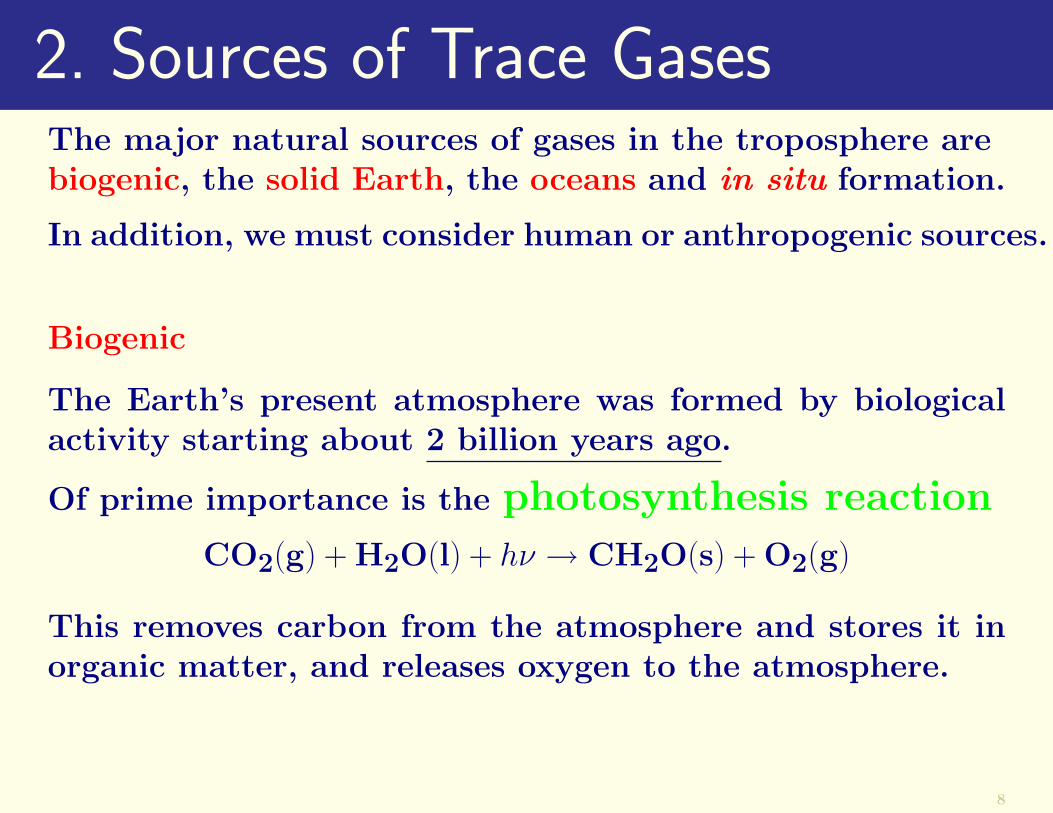
2. Sources of Trace GasesThe major natural sources of gases in the troposphere arebiogenic, the solid Earth, the oceans and in situ formation.
In addition, we must consider human or anthropogenic sources.
Biogenic
The Earth’s present atmosphere was formed by biologicalactivity starting about 2 billion years ago.
Of prime importance is the photosynthesis reaction
CO2(g) + H2O(l) + hν → CH2O(s) + O2(g)
This removes carbon from the atmosphere and stores it inorganic matter, and releases oxygen to the atmosphere.
8
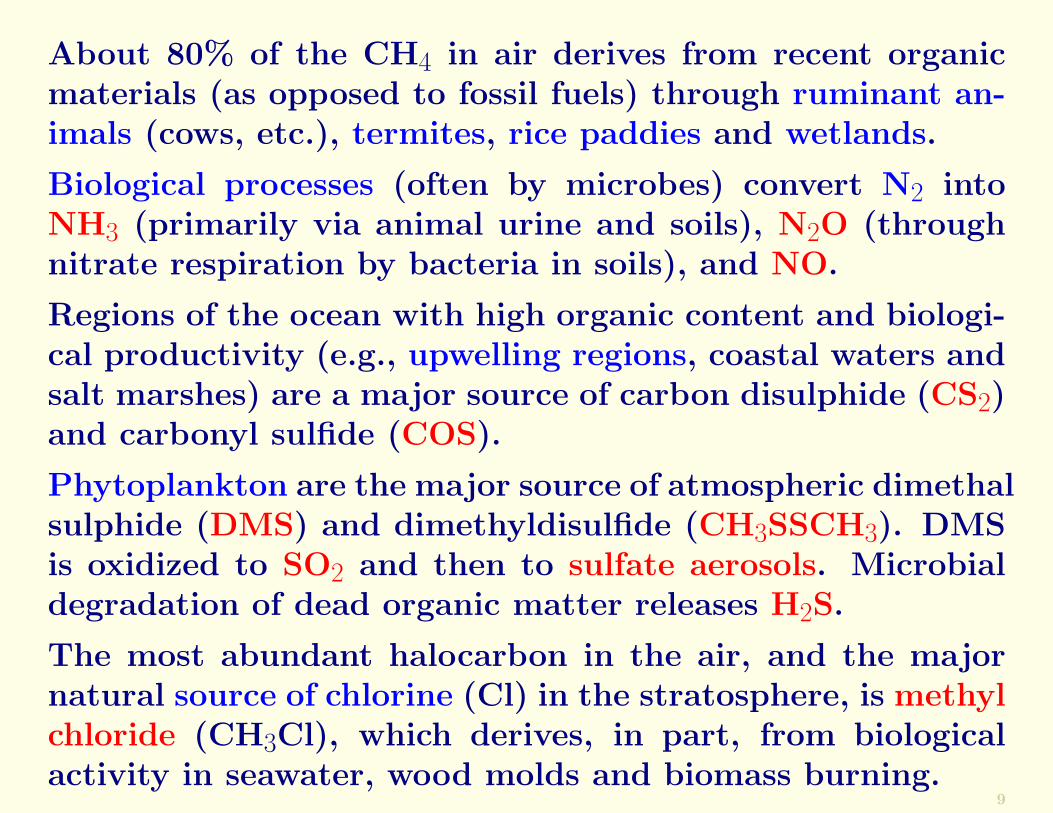
About 80% of the CH4 in air derives from recent organicmaterials (as opposed to fossil fuels) through ruminant an-imals (cows, etc.), termites, rice paddies and wetlands.
Biological processes (often by microbes) convert N2 intoNH3 (primarily via animal urine and soils), N2O (throughnitrate respiration by bacteria in soils), and NO.
Regions of the ocean with high organic content and biologi-cal productivity (e.g., upwelling regions, coastal waters andsalt marshes) are a major source of carbon disulphide (CS2)and carbonyl sulfide (COS).
Phytoplankton are the major source of atmospheric dimethalsulphide (DMS) and dimethyldisulfide (CH3SSCH3). DMSis oxidized to SO2 and then to sulfate aerosols. Microbialdegradation of dead organic matter releases H2S.
The most abundant halocarbon in the air, and the majornatural source of chlorine (Cl) in the stratosphere, is methylchloride (CH3Cl), which derives, in part, from biologicalactivity in seawater, wood molds and biomass burning.
9
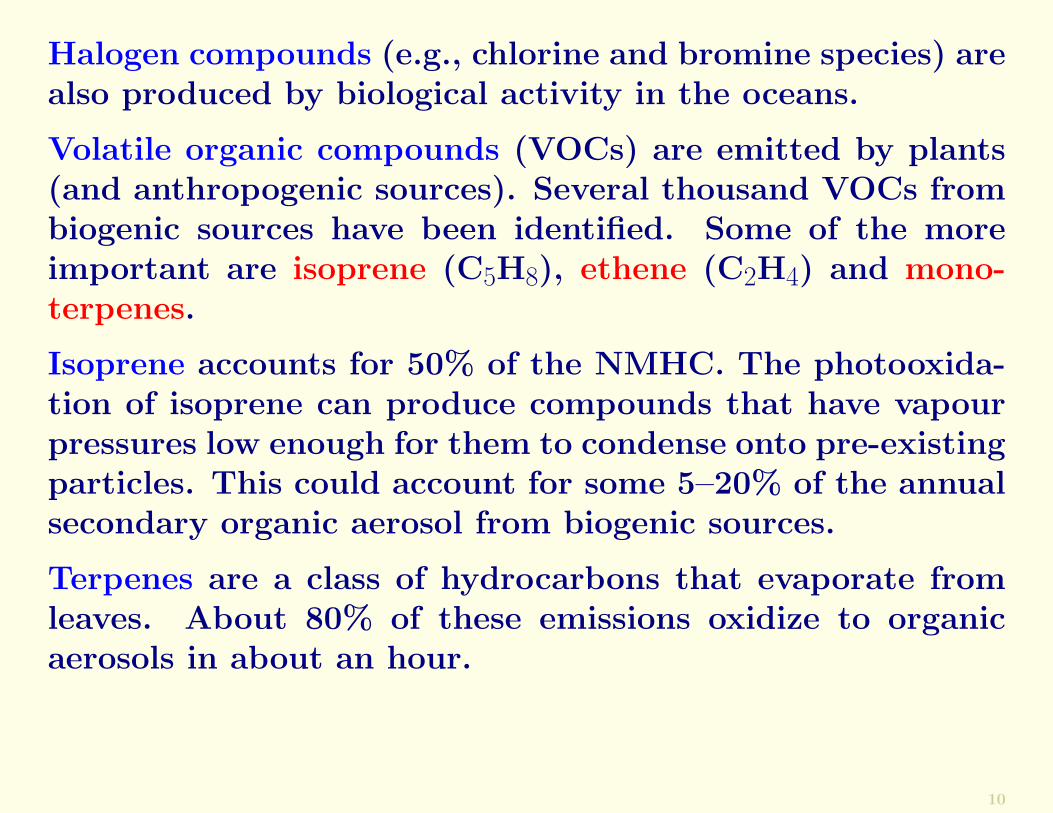
Halogen compounds (e.g., chlorine and bromine species) arealso produced by biological activity in the oceans.
Volatile organic compounds (VOCs) are emitted by plants(and anthropogenic sources). Several thousand VOCs frombiogenic sources have been identified. Some of the moreimportant are isoprene (C5H8), ethene (C2H4) and mono-terpenes.
Isoprene accounts for 50% of the NMHC. The photooxida-tion of isoprene can produce compounds that have vapourpressures low enough for them to condense onto pre-existingparticles. This could account for some 5–20% of the annualsecondary organic aerosol from biogenic sources.
Terpenes are a class of hydrocarbons that evaporate fromleaves. About 80% of these emissions oxidize to organicaerosols in about an hour.
10
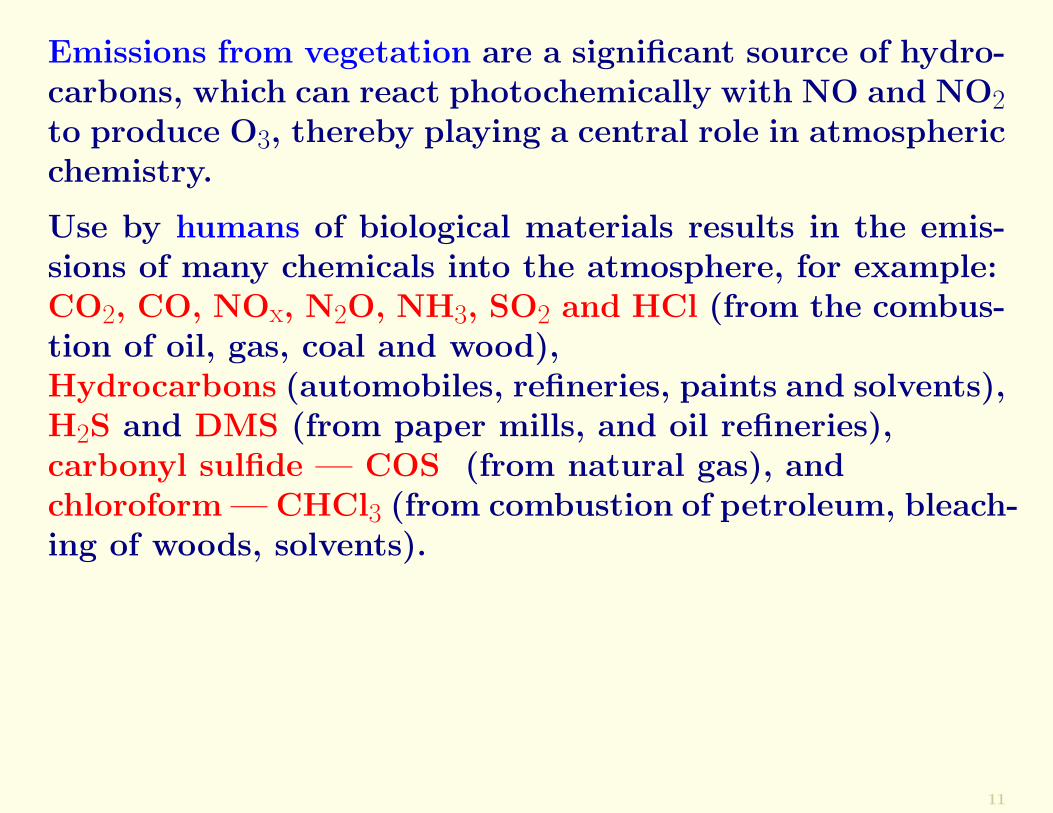
Emissions from vegetation are a significant source of hydro-carbons, which can react photochemically with NO and NO2to produce O3, thereby playing a central role in atmosphericchemistry.
Use by humans of biological materials results in the emis-sions of many chemicals into the atmosphere, for example:CO2, CO, NOx, N2O, NH3, SO2 and HCl (from the combus-tion of oil, gas, coal and wood),Hydrocarbons (automobiles, refineries, paints and solvents),H2S and DMS (from paper mills, and oil refineries),carbonyl sulfide — COS (from natural gas), andchloroform — CHCl3 (from combustion of petroleum, bleach-ing of woods, solvents).
11
Emissions from Biomass BurningAbout half a billion hectares (about half the area of Europe)of vegetation are burned globally each year, and the amountof burning is increasing.
Most biomass burning is associated with deforestation (e.g.,in the Amazon Basin), refertilization of soils and grazing(e.g., in the savannas of southern Africa), and with the useof wood for heating and cooking (e.g., in Africa, India, andSE Asia).
It has been estimated that on an annual basis biomass burn-ing produces ∼38% of the O3, ∼32% of the CO, ∼39% of theparticulate carbon, and more than 20% of the H2, NMHC,methyl chloride (CH3Cl) and NOx in the troposphere.
Biomass burning also produces ∼40% of the world’s annualproduction of CO2, but this is largely offset by the uptakeof CO2 by young vegetation that sprouts quickly on burnedareas.
12
Ozone is produced in the troposphere by photochemical re-actions involving oxidation by OH of CO, CH4 and NMHCin the presence of NOx.
Since all of these precursors are present in smoke frombiomass burning, elevated O3 concentrations are producedin biomass smoke as it disperses in the troposphere.
Many of the emissions from biomass burning are carcino-gens, they cause significant degradation to air quality onlocal and regional scales, and they have global effects onatmospheric chemistry and climate.
Biomass smoke, which contains high concentrations of CO,CH4 and O3, can be dispersed over large distances in theatmosphere.
Not even the most remote regions of Earth are immune topollution. For example, under appropriate wind conditionsbiomass smoke from Africa is dispersed across the SouthAtlantic Ocean and even to Australia (Figure below).
13
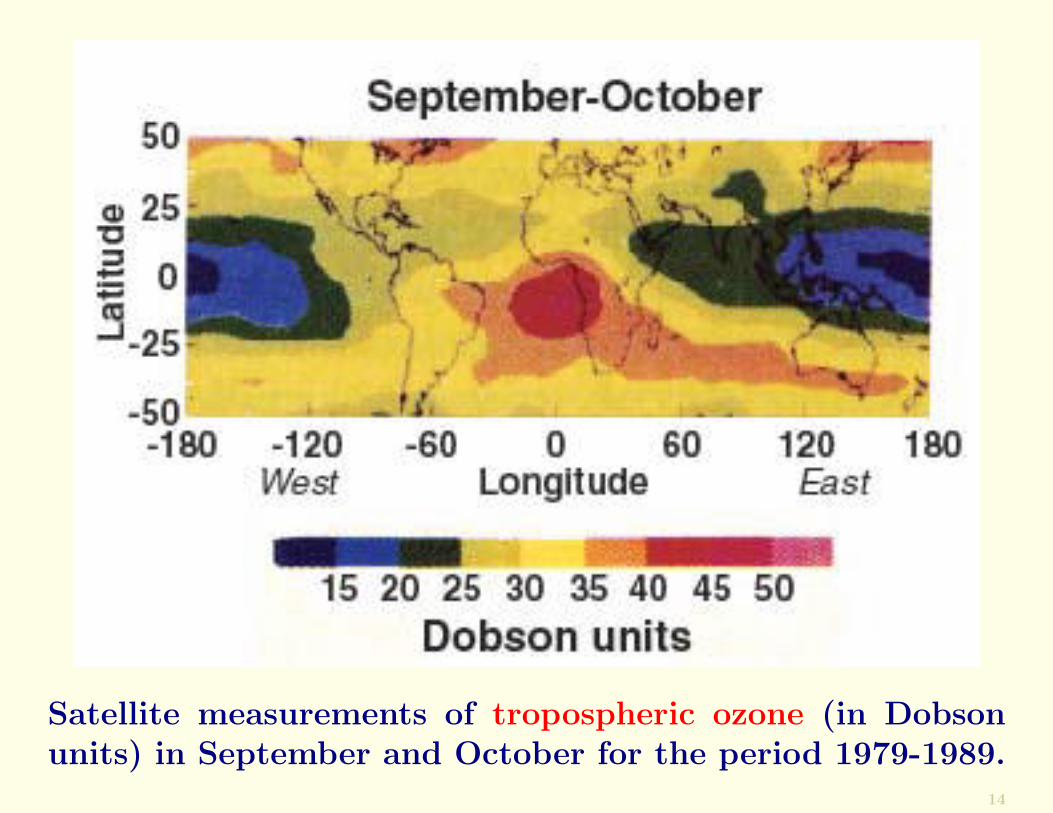
Satellite measurements of tropospheric ozone (in Dobsonunits) in September and October for the period 1979-1989.
14
The high column amounts of ozone (indicated by high Dob-son units) over tropical and southern Africa (see Figure)are due to smoke from biomass burning. Depending on thewinds, this smoke can be carried to the west or east.
Biomass smoke can also be lofted into the middle and uppertroposphere, where it can become a dominant source of HOx
(where x = 0, 1, or 2) and NOx and result in the productionof O3.
15
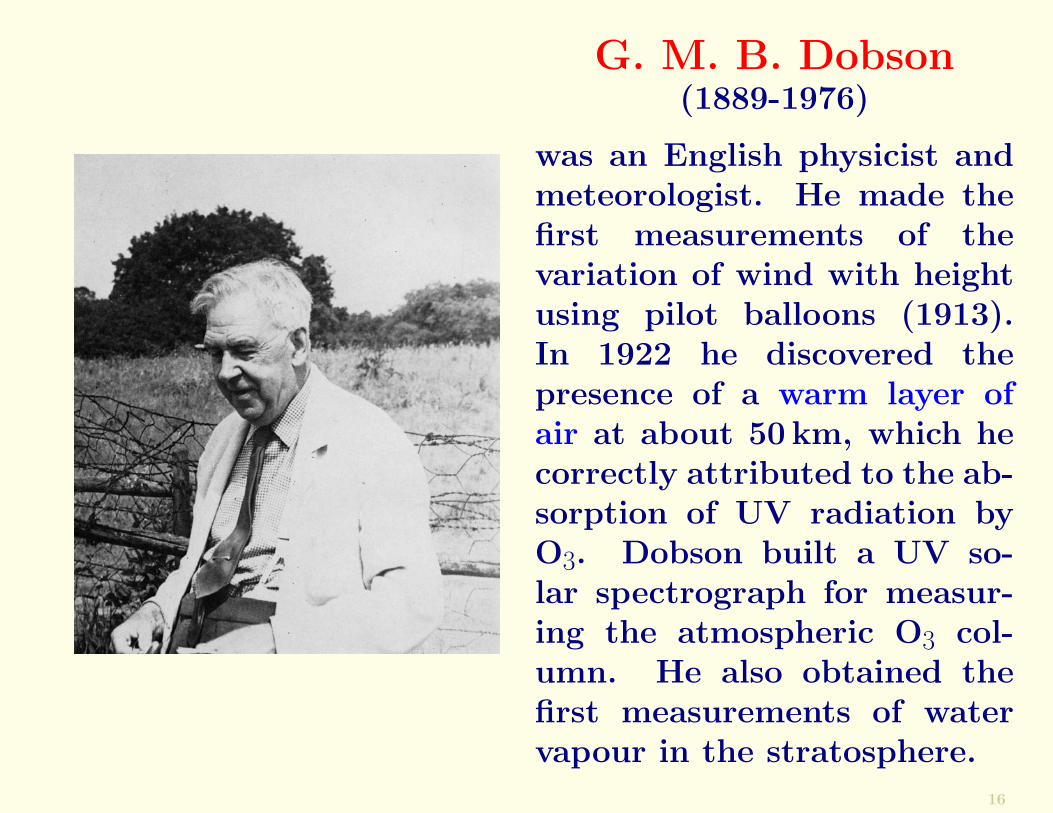
G. M. B. Dobson(1889-1976)
was an English physicist andmeteorologist. He made thefirst measurements of thevariation of wind with heightusing pilot balloons (1913).In 1922 he discovered thepresence of a warm layer ofair at about 50 km, which hecorrectly attributed to the ab-sorption of UV radiation byO3. Dobson built a UV so-lar spectrograph for measur-ing the atmospheric O3 col-umn. He also obtained thefirst measurements of watervapour in the stratosphere.
16
The Dobson UnitOne Dobson Unit (DU) is the thickness, inhundredths of a millimeter, that the total O3column would occupy at 0◦C and 1 atm.
The Earth’s total atmospheric O3 column is ∼300 DU (i.e.,if all the O3 in the atmosphere were brought to 0◦C and 1atm, it would form a layer just about 3mm deep).
It is a remarkable fact that in the absence of such a smallamount of O3 life on Earth would have been impossible.
Exercise: Calculate the partial pressure due to ozone,assuming the total column ozone to be 300 DU.
17
Sources: Solid EarthVolcanoes are the most important geochemical source oftrace gases in the atmosphere. In addition to ash and co-pious small particles, volcanoes emit H2O, CO2, SO2, H2S,COS, HCl, HF (hydrogen fluoride), HBr (hydrogen bro-mide), CH4, CH3Cl, H2, CO and heavy metals.
Emissions from violent volcanic eruptions can be blastedinto the stratosphere, where they have long residence timesand can therefore be dispersed around the globe.
The violent eruption in 1883 of the Indonesian volcano ofKrakatau caused remarkable sunsets and lowered global tem-peratures at the Earth’s surface by ∼0.5◦C.
The largest volcanic eruption in the 20th century, in termsof its atmospheric effects, was Pinatubo in the Philippinesin 1991. The emissions from this eruption produced a globalaverage cooling of ∼0.5◦C for two years and lowered ozoneconcentrations in the stratosphere.
18
Rocks are the major sources of He, Ar and Rn (radon) inthe atmosphere.
Helium is produced by the radioactive decay of uranium-238 and thorium-232. It does not accumulate in the at-mosphere because it is so light that it escapes from theexosphere.
Argon has accumulated in air over aeons from the radio-active decay of potassium-40 in rocks.
Radon-222 is a decay product of uranium in rocks; it has ahalf-life of only 3.8 days.
Carbonate rocks, such as limestone (e.g., CaCO3), containabout 20,000 times more carbon than the atmosphere, butmost of this is sequestered. However, carbonate rocks andmarine sediments are involved in a long-period cycle withatmospheric CO2.
19
Sources: OceanicThe oceans are a huge reservoir of those gases in the atmo-sphere that are soluble in water.
Thus, the oceans may serve as either a sink or a source forsoluble gases.
The oceans are an atmospheric source for many gases pro-duced by biological activity, particularly sulfur-containinggases.
20
Other SourcesIn situ formation
Trace gases emitted from the biosphere, solid Earth andoceans are generally in a reduced (low) oxidation state (e.g.,carbon, nitrogen and sulfur).
They are oxidized (i.e., raised to a higher oxidation state)by in situ reactions in the atmosphere.
Anthropogenic sourcesAnthropogenic sources play significant roles in the budgetsof many important trace gases in the atmosphere.
As a result of increasing populations, anthropogenic emis-sions of a number of important trace gases have increasedsignificantly over the past century.
The extent and effects of human influences on the atmo-sphere is one of the main themes of current research.
21
TransportIn the planetary boundary layer (PBL) the atmosphere in-teracts directly with the Earth’s surface through turbulentmixing.
Consequently, during the day over land, chemicals in thePBL are generally well mixed up to a height of ∼1 km.
Turbulent mixing, and therefore the dilution of chemicalcompounds, is less efficient at night when the PBL mayextend up to only a few hundred meters.
Over the oceans, the diurnal cycle is much less apparent.
22
If a chemical that originates from the Earth’s surface is notreturned to the surface or transformed by in situ reactionsin the PBL, it will eventually pass into the free troposphere.
Once in the free troposphere, and if the chemical has a longresidence time, it will follow the global circulation pattern.
For example, in midlatitudes, where the winds are generallyfrom west to east and have speeds of ∼10–30m s−1, a chem-ical will be distributed fairly uniformly in longitude aroundthe globe within a few months.
However, in the north-south direction, where wind speedsare much less, the distribution of chemicals will reflect morethe latitudinal distribution of their sources.
Since the transport of tropospheric air across the equatoris relatively restricted, so is the transport of chemicals.
23
The main effect of this is that the chemistry of the tropo-sphere in the northern hemisphere is affected by emissionsfrom the use of fossil fuels much more than the southernhemisphere.
The chemistry of the southern hemisphere reflects more theeffects of emissions from the oceans and from biomass burn-ing.
Transport is also restricted from the free troposphere intothe stratosphere. Most of the upward transport is in thetropics, and the downward transport is in higher latitudes.
Nevertheless, certain long-lived chemicals of anthropogenicorigin can accumulate in the stratosphere, where they canhave major effects.
24
Satellite observations provide strong evidence for the trans-port of tropospheric gases and particles.
For example, satellite observations reveal large plumes ofparticles off the east coasts of the U.S.A. and Asia, enor-mous dust plumes carried westward from the Sahara Desertover the Atlantic Ocean, and large smoke plumes from re-gions of biomass burning (above Figure).
During the winter monsoon (December through April), aplume of pollutants extends from the southwest coast ofIndia over the Indian Ocean.
In spring and summer, pollutants are transported from Eu-rope to the North Atlantic Ocean.
Reference website:http://earthobservatory.nasa.gov/
25
Sinks of Trace GasesThe final stage in the life history of a chemical in the at-mosphere is its removal. Sinks include transformations intoother chemical species and gas-to-particle conversion.
The other important removal process for both gases andaerosols is deposition onto the Earth’s surface.
Deposition is of two types, wet and dry:
Wet deposition: This involves the scavenging of gases andparticles in the air by clouds and precipitation, and isone of the major mechanisms by which the atmosphere iscleansed.
Dry deposition: This involves the direct collection of gasesand particles in the air by vegetation and the Earth’s solidand liquid surfaces.
Dry deposition is much slower than wet deposition, but itis continuous rather than episodic.
26
The oceans are important sinks for many trace gases.
The flux of a gas to the ocean depends on how undersatu-rated the ocean is with respect to the gas.
If the surface layers of the ocean are supersaturated with agas, then the flux is from the ocean to the atmosphere
For example, the estimated global flux of DMS from theocean to the atmosphere is ∼25 Tg of sulfur per year.
27
3. Some Trace Tropospheric GasesPrior to the 1970s, photochemical reactions, and the oxida-tion of most trace gases, were thought to take place primar-ily in the stratosphere where the intensity of UV radiationis much greater than in the troposphere.
However, in the 1960s and 70s, it came to be realized thatthe very reactive hydroxyl radical OH can be produced byphotochemistry in the troposphere.
At about the same time, studies of photochemical smogs(such as those that occur in Los Angeles) began to revealthe roles of OH, nitrogen oxides and hydrocarbons in theformation of O3 and other pollutants.
28
The Hydroxyl RadicalBecause of its high reactivity with both inorganic and or-ganic compounds, OH is one of the most important chemicalspecies in the atmosphere.
This is despite the fact that it is present in the tropospherein globally and diurnally averaged concentrations of just afew tenths of a pptv (∼1012 OH molecules m−3, or about 3OH molecules per 1014 molecules in the air).
Reaction with OH is the major sink for most atmospherictrace gases. Because it is so reactive, the average lifetime ofan OH molecule in the atmosphere is only about 1 second.
29
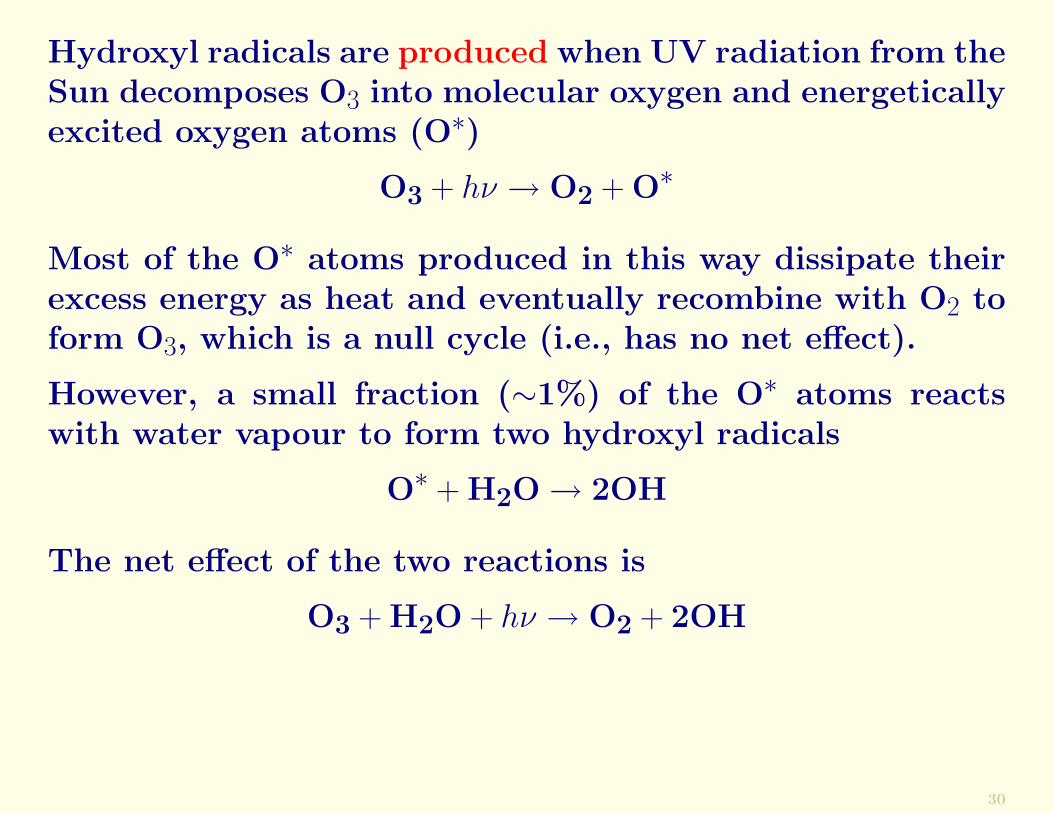
Hydroxyl radicals are produced when UV radiation from theSun decomposes O3 into molecular oxygen and energeticallyexcited oxygen atoms (O∗)
O3 + hν → O2 + O∗
Most of the O∗ atoms produced in this way dissipate theirexcess energy as heat and eventually recombine with O2 toform O3, which is a null cycle (i.e., has no net effect).
However, a small fraction (∼1%) of the O∗ atoms reactswith water vapour to form two hydroxyl radicals
O∗ + H2O → 2OH
The net effect of the two reactions is
O3 + H2O + hν → O2 + 2OH
30
Once formed, the OH radical is a powerful oxidant that re-acts quickly with almost all trace gases containing H, C, N,O and S and the halogens (except N2O and the chlorofluo-rocarbons (CFC)).
For example, OH reacts with CO to form CO2, NO2 to formHNO3, H2S to form SO2, SO2 to form H2SO4, etc. (Figurebelow).
Because of its role in removing many pollutants, OH hasbeen called the atmosphere’s detergent.
? ? ?
The dominant sinks for OH in the global troposphere are ox-idation by CO and CH4, while reactions with NMHC dom-inate as a sink of OH over the continents.
In forests, the dominant reactant with OH is often isoprene(C5H8), which is emitted by deciduous trees.
31
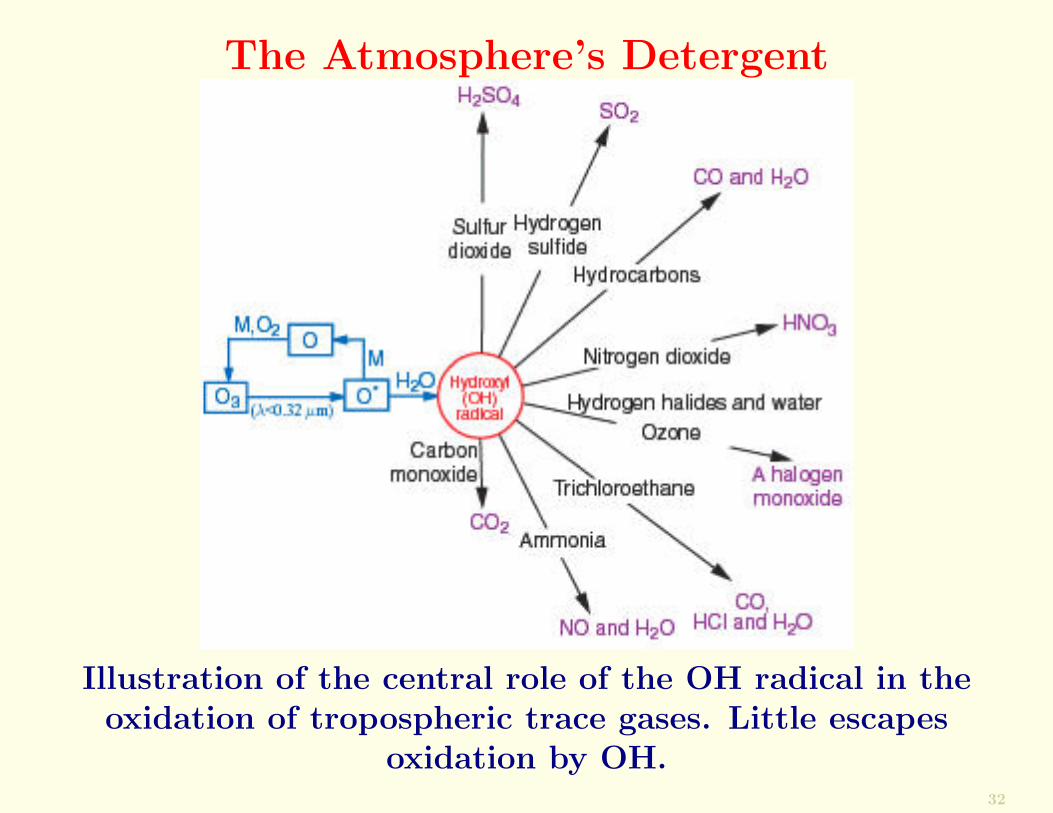
The Atmosphere’s Detergent
Illustration of the central role of the OH radical in theoxidation of tropospheric trace gases. Little escapes
oxidation by OH.32
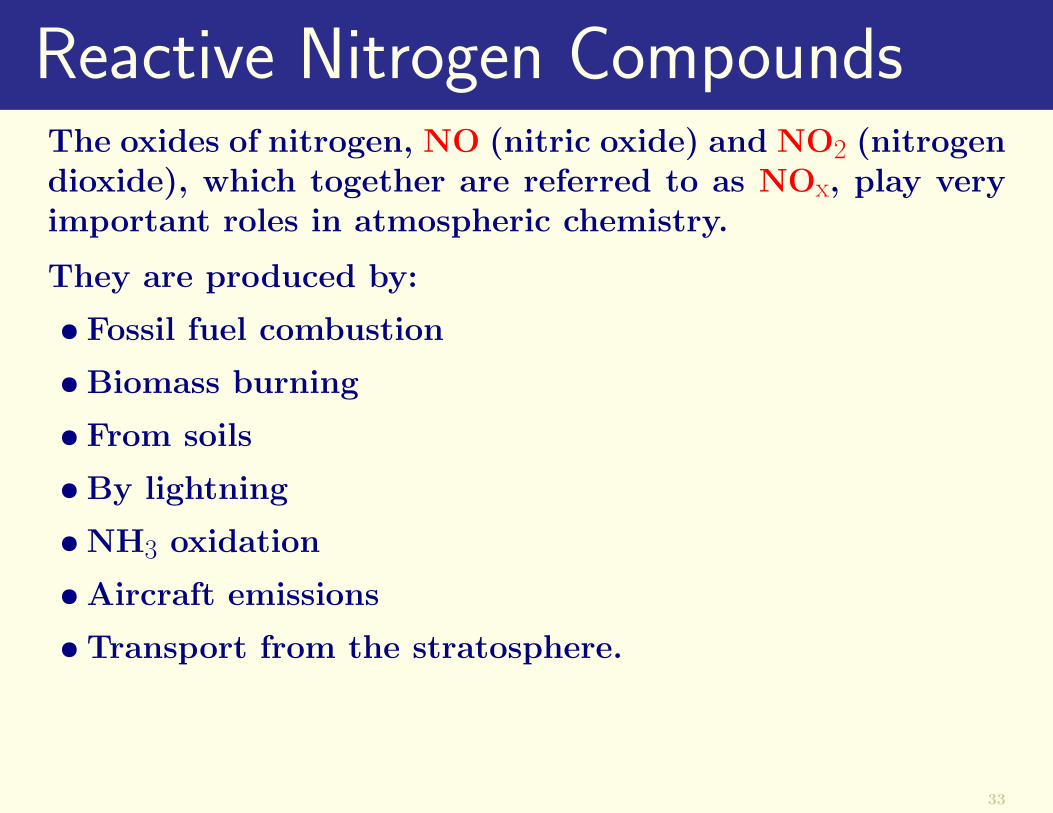
Reactive Nitrogen CompoundsThe oxides of nitrogen, NO (nitric oxide) and NO2 (nitrogendioxide), which together are referred to as NOx, play veryimportant roles in atmospheric chemistry.
They are produced by:
• Fossil fuel combustion
• Biomass burning
• From soils
• By lightning
• NH3 oxidation
• Aircraft emissions
• Transport from the stratosphere.
33
NOx is emitted into the troposphere primarily as NO, butduring the day NO establishes a rapid equilibrium withNO2.
At night, NO2 is oxidized by O3 to NO3, the NO3 then reactswith NO2 to produce N2O5, and the N2O5 reacts with wateron particles to produce HNO3.
The nitric acid is removed in about 1 week by dry and wetdeposition. The resulting residence time of NO2 is ∼1 day.
Since OH is produced primarily by photochemical reactionsand has a very short lifetime, it is present in the atmosphereonly during the day.
At night, the nitrate radical NO3 takes over from OH as themajor reactive oxidant in the troposphere.
34
The nitrate radical is formed by
NO2 + O3 → NO3 + O2
Although NO3 is much less reactive than OH, it is presentin much higher mean concentrations than OH.
? ? ?
Ammonia (NH3) originates from soils, animal waste, fertil-izers and industrial emissions. It is the principal basic gasin the atmosphere.
Ammonia neutralizes acid species by reactions of the form
2NH3 + H2SO4 → (NH4)2SO4
The primary removal mechanisms for NH3 is its conver-sion to ammonium-containing aerosols which are then trans-ported to the ground by wet and dry deposition.
The residence time of NH3 in the troposphere is ∼10 days.
35
Organic CompoundsOrganic compounds contain carbon atoms.
The four electrons in the outer orbital of the carbon atomcan form bonds with up to four other elements: hydrogen,oxygen, nitrogen, sulfur, halogens, etc. [HONC-link]
Hydrocarbons are organics composed of carbon and hydro-gen. There are large natural and anthropogenic sources ofatmospheric hydrocarbons, and they play key roles in manyaspects of the chemistry of the troposphere.
Methane (CH4) is the most abundant hydrocarbon in the at-mosphere, and it plays a central role in tropospheric chem-istry. The present concentration of CH4 in the NorthernHemisphere is ∼1.7 ppmv.
Methane has a residence time in the atmosphere of about 9years.
36
Sources of CH4 include wetlands, landfills, domestic ani-mals, termites, biomass burning, leakages from natural gaslines, and coal mines.
The primary sink for tropospheric CH4 is its oxidation byOH to form formaldehyde (HCHO); HCHO then photodis-sociates into CO. Also, in air with sufficient NOx, OH oxi-dizes CO to produce O3.
Following water vapour and CO2, CH4 is the third mostabundant greenhouse gas in the atmosphere.
37
NMHCsHydrocarbons other than CH4 are referred to as non-methanehydrocarbons (NMHCs). They originate from fossil fuelcombustion, biomass burning, forest vegetation, etc.
The primary sink for most NMHC is oxidation by OH. SinceNMHC are more reactive than CH4, their atmospheric res-idence times are much shorter (hours to months).
There are numerous NMHC, and many of them play impor-tant roles in tropospheric chemistry. Based on the molecu-lar structures of NMHC they can be grouped into severalclasses.
For example, alkanes (CnH2n+2), which include ethane(CH3−CH3) and propane (CH3−CH2−CH3); alkenes, whichhave a double bond, such as ethene (CH2=CH2) and propene(CH3−CH=CH2); and aromatics, such as benzene (C6H6)and toluene (C7H8).
38
Oxygenated HydrocarbonsOxygenated hydrocarbons, which contain one or more oxy-gen atoms, such as acetone (CH3COCH3), may provide animportant source of HOx in the upper troposphere and thusinfluence O3 chemistry in this region.
? ? ?
Exercise: How much CH3–CH2–OH is in the atmosphere?What is it? It it toxic or beneficial to humans?
39
Volatile Organic CompoundsVolatile organic compounds, which play a central role inatmospheric chemistry, refer to the entire set of vapour-phase organics in the atmosphere (except for CO and CO2).
Motor vehicles are the main source of VOCs in the USA;they are mainly in a form of hydrocarbons produced by theincomplete combustion of fuel and from the vapourizationof fuel.
The evaporation of solvents is the second largest source ofVOCs worldwide. Biological processes are also importantsources of VOCs.
? ? ?
40
Carbon Monoxide (CO)Carbon monoxide (CO) is produced by the oxidation of CH4or a NMHC, such as isoprene.
Other important sources of CO are biomass burning andthe combustion of fossil fuels.
The dominant sink of CO is oxidation by OH:
2CO + 2OH → H2 + 2CO2
An important feature of CO is its seasonal cycle: it accu-mulates in the atmosphere during winter when OH concen-trations are low, but in spring CO is rapidly depleted dueto the reaction above.
41
Ozone (O3)Since about 90% of the O3 in the Earth’s atmosphere isin the stratosphere, it was suggested in the middle of the20th century that the stratosphere was a primary source fortropospheric O3, and that a balance existed between thissource and surface sinks.
Subsequently, it was realized that trace gases, such as NO,CO and organic compounds, which are emitted by humanactivities, lead to the formation of O3 through photochemi-cal reactions.
In addition, natural processes produce O3 precursors (e.g.,hydrocarbons from vegetation and NO from lightning). Muchof the O3 in the troposphere is produced by in situ homo-geneous gas-phase reactions involving the oxidation of CO,CH4 and NMHC by OH in the presence of NOx.
Ozone plays a controlling role in the oxidation capacity ofthe troposphere.
42
Good Ozone and Bad OzoneThe German chemist Schonbein discovered ozone by itsodour following an electrical discharge. He called it ozone,after the Greek word ozein, meaning to smell.
Ozone is an irritating, pale blue gas that is toxic and explo-sive.
Because of its high reactivity ozone is an extremely powerfuloxidizing agent that damages rubber and plastics, and isharmful to humans and plants even at low concentrations(∼several tens of ppbv).
The Dutch scientist Haagen-Smit suggested that the forma-tion of O3 in cities is due to photochemical reactions involv-ing nitrogen oxides and hydrocarbons released by cars andoil refineries.
Ozone reacts with hydrocarbons from automobile exhaustsand evaporated gasoline to form secondary organic pollu-tants such as aldehydes and ketones.
43
Ozone produced in urban areas can be transported into ru-ral areas far removed from industrial regions.
For example, during a summer heat wave in 1988 the Aca-dia National Park in Maine had dangerously high concen-trations of O3, which originated in New York City.
Ozone alone, or in combination with SO2 and NO2, causesabout 90% of the annual loss of crops due to air pollutionin the United States.
? ? ?
In contrast to the bad effects of O3 in the troposphere, themuch greater concentrations of O3 in the stratosphere re-duces the intensity of dangerous UV radiation from the Sun,which has allowed the development of life on Earth.
44
An increase in tropospheric O3 has occurred globally overthe past century, from ∼10–15 ppbv in the pre-industrialera to ∼30–40 ppbv in 2000 in remote regions of the world.
The increase is attributable to the increase in NOx emissionsassociated with the rapid increase in the use of fossil fuelssince the Industrial Revolution.
? ? ?
The following Figure shows the global distribution of O3 inthe troposphere obtained by subtracting satellite measure-ments of O3 in the stratosphere from those in the strato-sphere and troposphere.
It can be seen that O3 is generally low over the tropicaloceans. At midlatitudes it increases in spring in both hemi-spheres, and O3 is high in the summer months over theindustrialized regions of the northern hemisphere.
45
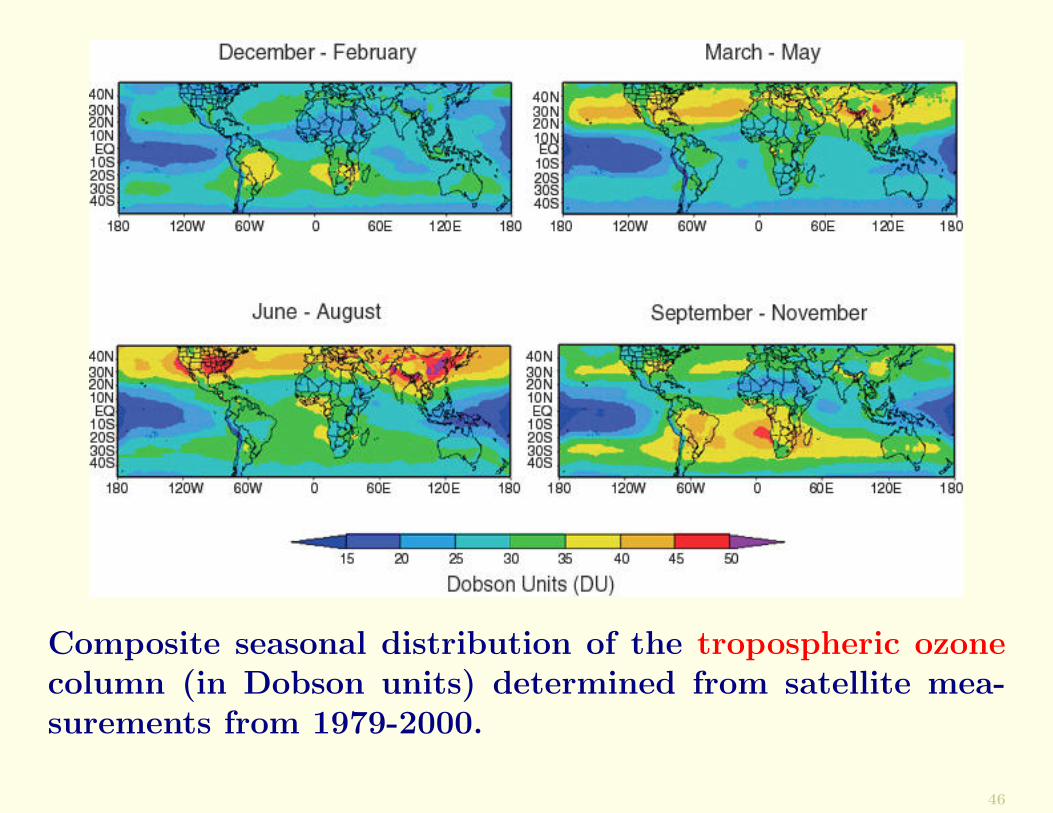
Composite seasonal distribution of the tropospheric ozonecolumn (in Dobson units) determined from satellite mea-surements from 1979-2000.
46
Hydrogen CompoundsHydrogen compounds are the most important oxidants formany chemicals in the atmosphere, and are involved in thecycles of many chemical families. They include:
atomic hydrogen (H), which quickly combines with O2 toform the hydroperoxyl radical (HO2)
molecular hydrogen (H2), which, next to CH4, is the mostabundant reactive trace gas in the troposphere
the hydroxyl radical, (OH)
the hydroperoxyl radical, (HO2)
hydrogen peroxide (H2O2), which is formed by the reactionof HO2 radicals and is an important oxidant for SO2
water (H2O), which, in addition to its central role in thehydrological cycle and the radiative balance of the Earth,reacts with excited atomic oxygen to form OH.
47
Sulfur GasesSulfur is important to life on Earth. It is assimilated by liv-ing organisms, and released as an end-product of metabolism.
The most important sulfur gases in the atmosphere are SO2,H2S, dimethyl sulfide (CH3SCH3 or DMS for short), car-bonyl sulfide (COS) and carbon disulfide (CS2).
Volcanoes and biomass burning are also sources of atmo-spheric SO2. However, the largest source of SO2 is fossilfuel combustion.
The main sources of H2S are emissions from soils, marsh-lands, oceans and volcanoes.
The only significant sink for H2S is oxidation to SO2.
48
Biological reactions in the oceans involving phytoplanktonemit several sulfur gases, of which DMS has the largestemission rate.
DMS is removed from the atmosphere primarily by its re-action with OH to produce SO2.
The sulfur gas with the largest concentration in the unpol-luted atmosphere is carbonyl sulphide (COS) (∼0.5 ppbv).
The major sources of COS are biogenic and the oxidationof CS2 by OH; the source of CS2 is also biogenic.
Because COS is very stable in the troposphere, it is eventu-ally transported into the stratosphere where it is the domi-nant source of sulfate particles during volcanically quiescentperiods.
? ? ?
49
4. Tropospheric AerosolsAtmospheric aerosols are suspensions of small solid and/orliquid particles in air that have negligible terminal fall speeds.
Molecular aggregates that carry an electric charge are calledions.
The number density and type of ions in the air determinesthe electrical conductivity of the air which, in turn, affectsthe magnitude of the fair weather atmospheric electric field.
Ions in the lower atmosphere are produced primarily bycosmic rays, although very close to the Earth’s surface ion-ization due to radioactive materials in the Earth and atmo-sphere also plays a role.
Ions are removed by combining with ions of opposite sign.
The following Figure shows the size ranges of particles thatplay a role in the atmosphere.
50
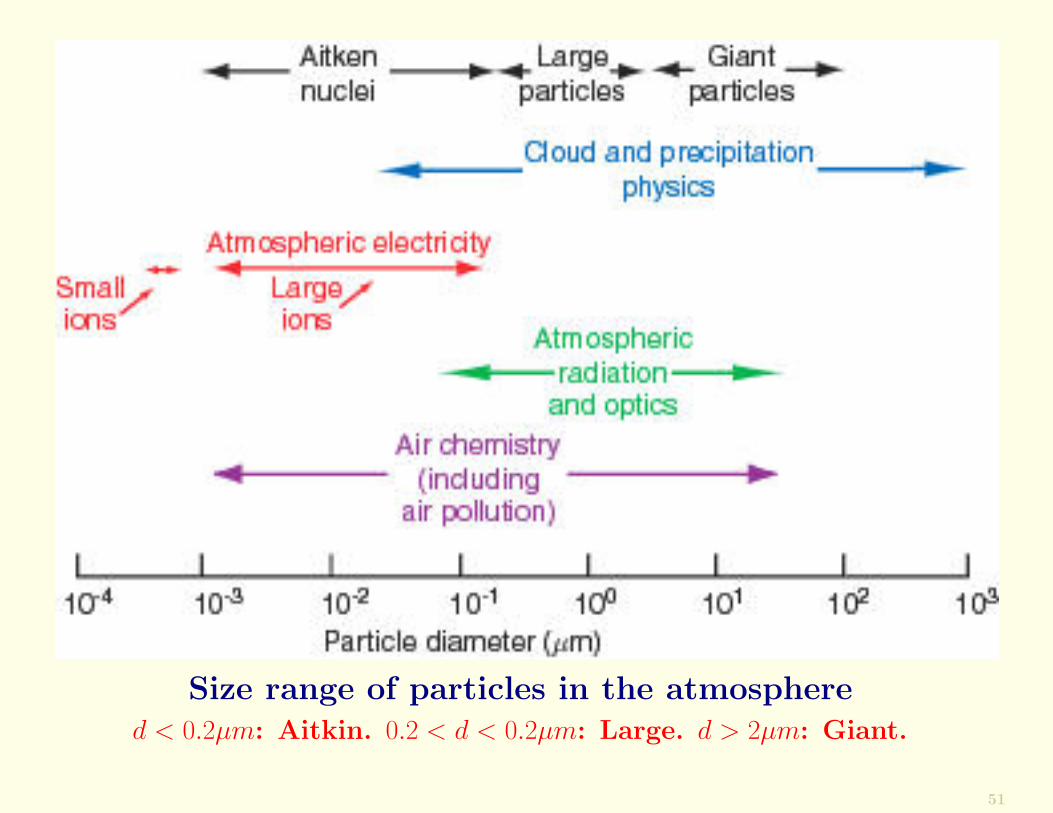
Size range of particles in the atmosphered < 0.2µm: Aitkin. 0.2 < d < 0.2µm: Large. d > 2µm: Giant.
51
Concentrations of small ions vary from about 40 to 1500cm−3 at sea level, while concentrations of large ions varyfrom about 200 cm−3 in marine air to a maximum value ofabout 8× 105 cm−3 in some cities.
The electrical conductivity of the air is generally dominatedby small ions. However, when the concentrations of largeions and uncharged aerosols are large, as they are in cities,the concentration of small ions tends to be low due to theircapture by both large ions and uncharged aerosols.
Consequently, the electrical conductivity of air is a mini-mum when the concentration of large ions is a maximum.
The observed decrease of at least 20% in the electrical con-ductivity of the air over the North Atlantic Ocean duringthe 20th century is attributed to a doubling in the concen-tration of particles with diameters between 0.02 and 0.2 µm,probably due to pollution.
52
Sourcesa. Biological
Solid and liquid particles are released into the atmospherefrom plants and animals. These emissions, which includeseeds, pollen, spores, and fragments of animals and plants,are usually 1-250 µm in diameter. Bacteria, algae, protozoa,fungi, and viruses are generally <1 µm in diameter.
Microorganisms live on skin: when you change your clothes,you can propel ∼ 104 bacteria per minute into the air, withdiameters from 1–5 µm.
The oceans are an important source of biogenic aerosols.They are injected into the atmosphere by the bursting ofair bubbles and by sea foam.
53
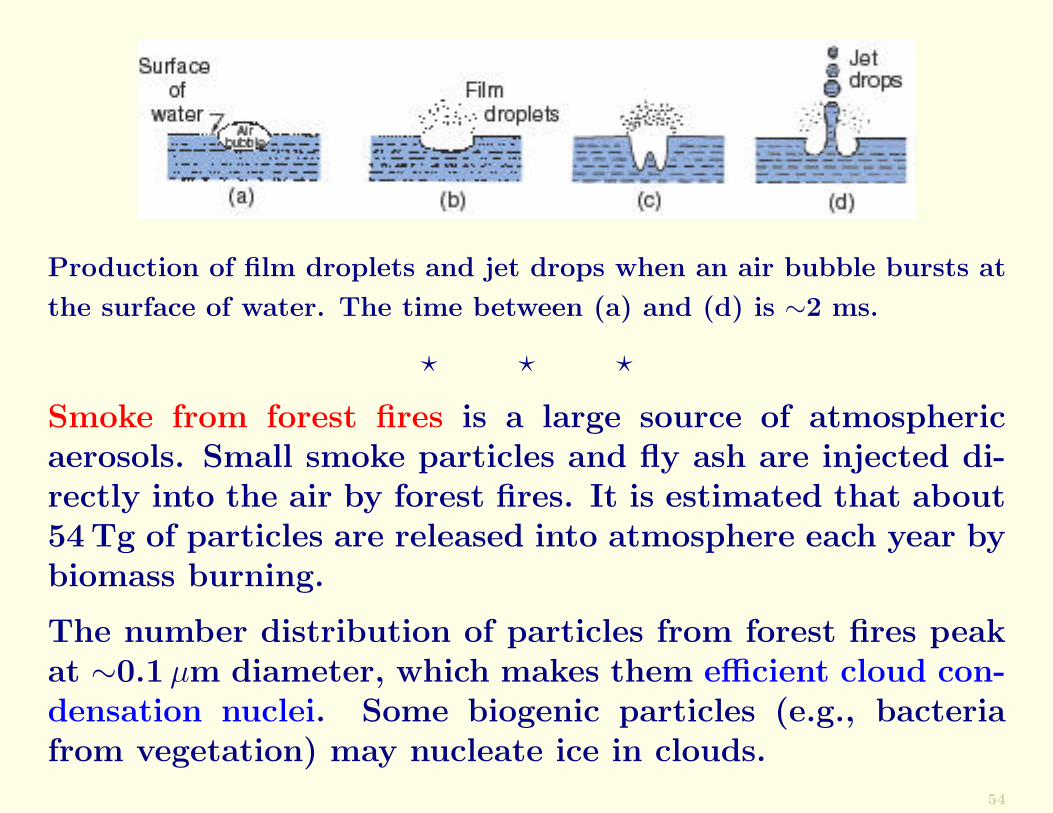
Production of film droplets and jet drops when an air bubble bursts at
the surface of water. The time between (a) and (d) is ∼2 ms.
? ? ?
Smoke from forest fires is a large source of atmosphericaerosols. Small smoke particles and fly ash are injected di-rectly into the air by forest fires. It is estimated that about54 Tg of particles are released into atmosphere each year bybiomass burning.
The number distribution of particles from forest fires peakat ∼0.1 µm diameter, which makes them efficient cloud con-densation nuclei. Some biogenic particles (e.g., bacteriafrom vegetation) may nucleate ice in clouds.
54
b. Solid EarthThe transfer of particles to the atmosphere from the Earth’ssurface is caused by winds and atmospheric turbulence.
On the global scale, semi-arid regions and deserts (whichcover about one-third of the land surface) are the mainsource of particles from the Earth’s surface. They provide∼2,000Tg per year of mineral particles.
Volcanoes inject gases and particles into the atmosphere.The large particles have short residence times, but the smallparticles can be transported globally, particularly if they areblasted to high altitudes.
55
c. AnthropogenicThe global input of particles into the atmosphere from an-thropogenic activities is ∼20% (by mass) of that from nat-ural sources.
The main anthropogenic sources of aerosols are dust fromroads, wind erosion of tilled land, biomass burning, fuelcombustion, and industrial processes.
In 1997 the worldwide direct emission into the atmosphereof particles <10 µm diameter from anthropogenic sourceswas estimated to be ∼350Tg per year. Particle emissionsworldwide were dominated by fossil fuel combustion (pri-marily coal) and biomass burning.
These emissions are projected to double by the year 2040,due largely to anticipated increases in fossil fuel combustion,with the greatest growth in emissions from China and India.
It is projected that by 2040, anthropogenic sources of par-ticles could be comparable to those from natural processes.
56
d. In situ formationIn situ condensation of gases (i.e., g-to-p conversion) is im-portant in the atmosphere. Gases may condense onto ex-isting particles, thereby increasing the mass (but not thenumber) of particles, or gases may condense to form newparticles.
The quantities of aerosols produced by g-to-p conversion ex-ceed those from direct emissions for anthropogenically de-rived aerosols, and they are comparable to direct emissionin the case of naturally derived aerosols.
Organic and carbonaceous aerosols are produced by g-to-p conversion from gases released from the biosphere, andfrom volatile compounds such as crude oil that leak to theEarth’s surface. Carbonaceous particles emitted directlyinto the atmosphere derive mainly from biomass fires.
Summary: Table 5.3 in Wallace & Hobbs summarizes the magnitudes of
the principal sources of direct emission of particles into the atmosphere
and in situ sources.57
Chemical CompositionExcept for marine aerosols, the masses of which are domi-nated by sodium chloride, sulfate is one of the prime con-tributors to the mass of atmospheric aerosols.
Ammonium (NH+4 ) is the main cation associated with SO2−
4in continental aerosol. It is produced by gaseous ammonianeutralizing sulfuric acid to produce ammonium sulfate.
In marine air the main contributors to the mass of inorganicaerosols are the ions Na+, Cl−, Mg2+, SO2+
4 , K+ and Ca2+.Such particles are particularly effective in scattering light(reducing visibility) and as cloud condensation nuclei.
Nitrate (NO−3 ) occurs in larger sized particles than sulfatein marine air. Since seawater contains negligible nitrate, thenitrate in these particles must derive from the condensationof gaseous HNO3 by g-to-p conversion.
58
Many of the particles in urban smog are by-products of pho-tochemical reactions involving hydrocarbons and nitrogenoxides, which derive from combustion.
Polycyclic aromatic hydrocarbons (PAHs) are of particularconcern because they are carcinogens. In the U.S.A. car-bonaceous materials can account for some 50% or more ofthe total dry aerosol mass.
Elemental carbon (commonly referred to as “soot”) is acommon component of organic aerosols in the atmosphere,and is a strong absorber of solar radiation.
For example, in polluted air masses from India, elementalcarbon contributes about 10% to the mass of submicrometersized particles.
59
TransportAerosols are transported by the airflows they encounter dur-ing the time they spend in the atmosphere. The transportcan be over inter-continental or even global scales.
Thus, Saharan dust is transported to the Americas, anddust from the Gobi Desert can reach the west coast of NorthAmerica.
Sulpher dioxide (SO2) emitted from power plants in theUnited Kingdom can be deposited as sulfate far inland incontinental Europe.
60
SinksOn average, particles are removed from the atmosphere atabout the same rate as they enter it.
Small particles can be converted into larger particles by co-agulation. Although coagulation does not remove particlesfrom the atmosphere, it modifies their size spectra and shiftssmall particles into size ranges where they can be removedby other mechanisms.
Improvements in visibility that frequently follow periods ofprecipitation are due, in large part, to the removal (i.e.,scavenging) of particles by precipitation. It is estimatedthat, on the global scale, precipitation processes accountfor about 80–90% of the mass of particles removed from theatmosphere.
61
The terminal fall speeds of particles >1 µm diameter aresufficiently large that gravitational settling (i.e., dry depo-sition) is important as a removal process.
For example, the fall speeds of particles 1 and 10 µm indiameter are ∼ 3× 10⁻⁵ and ∼ 3× 10⁻³ ms−1, respectively.
Some 10–20% of the mass of particles removed from theatmosphere is by dry fallout.
62
Concentrations.One of the oldest and most convenient techniques (which invarious forms is still in widespread use) for measuring theconcentrations of particles in the air is the Aitken nucleuscounter. For details, see Wallace & Hobbs.
The concentration of particles measured with this instru-ment is referred to as the Condensation Nucleus (CN) count.
Condensation nucleus counts near the Earth’s surface varywidely from one location to another, and they can also fluc-tuate by more than an order of magnitude with time at anyone site.
Generally, they range from average values of ∼103 cm−3 overthe oceans, to ∼104 cm−3 over rural land areas, to ∼105 cm−3
or greater in urban polluted air.
63
Size DistributionsAtmospheric aerosol particles range in size from ∼10−4 µmto tens of micrometers. The averages of numerous measure-ments of aerosol size spectra in continental, marine, andurban polluted air are shown in the following Figure.
The measurements are plotted in the form of a number dis-tribution in which the ordinate dN/d(log N) and the abscissa(D) are plotted on logarithmic scales, where dN is the num-ber concentration of particles with diameters between D andD + dD.
64
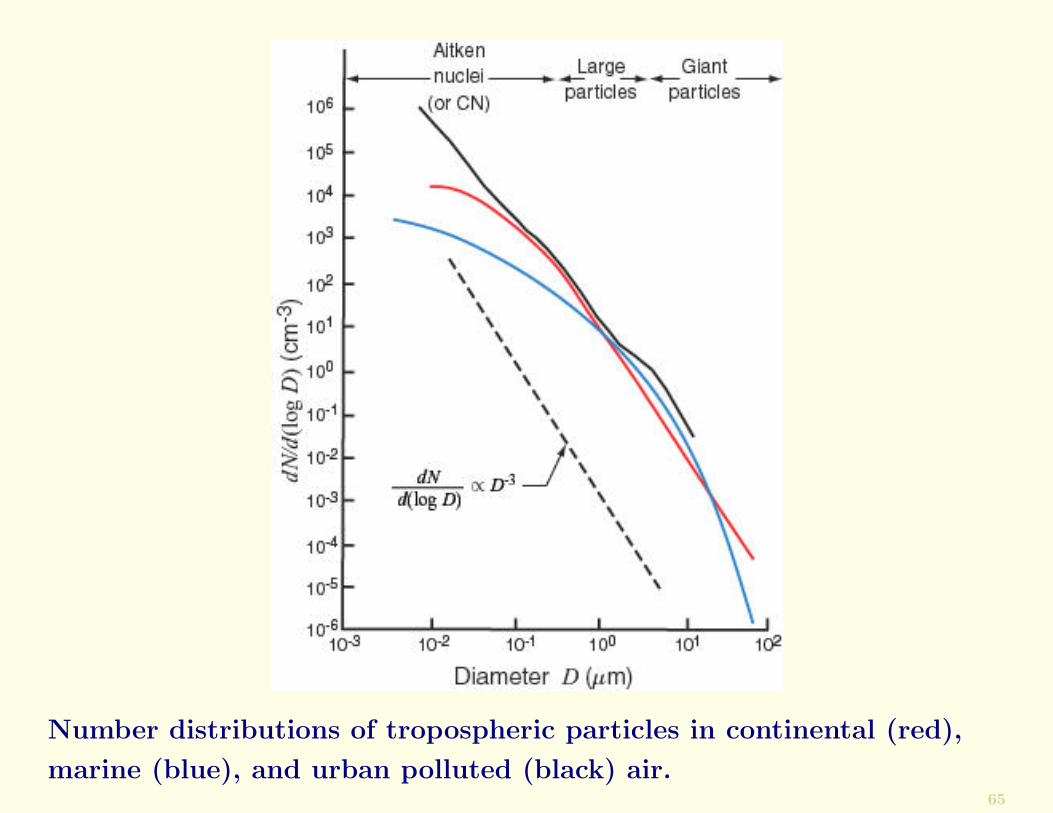
Number distributions of tropospheric particles in continental (red),
marine (blue), and urban polluted (black) air.65
Conclusions from results shown in Figure.
• The concentrations of particles fall off rapidly as theyincrease in size. The total number concentration is domi-nated by particles with diameters <0.2 µm, called Aitkennuclei or condensation nuclei.
• Those portions of the number distribution curves thatare straight lines in the Figure can be represented by anexpression of the form
logdN
d(log D)= const− β log D
or, taking antilogs,
dN
d(log D)= CD−β
66
• The number distributions of particles shown confirm CNmeasurements, which indicate that the total concentra-tions of particles are, on average, greatest in urban pol-luted air and least in marine air.
• The concentrations of particles with diameters >2 µm (gi-ant particles) are, on average, rather similar in continen-tal, marine, and urban polluted air.
67
5. Air PollutionIn urban and industrialized locations anthropogenic emis-sions can become so large that the concentrations of vari-ous undesirable chemical species (pollutants) cause signifi-cant deterioration in air quality and visibility, and can posethreats to human health.
Severe air pollution episodes, and associated visibility re-duction, occur when the rates of emissions or formationof pollutants greatly exceed the rates at which the pollu-tants are dispersed by winds and vertical transport or areremoved from the atmosphere by chemical reactions or de-position.
Dispersion in the vertical is particularly restricted understable conditions.
68
Sources of PollutantsCombustion (in power plants, smelters, automobiles, and ofwood, vegetation, etc.) is the largest source of air pollu-tants.
On a global scale fossil-fuel combustion is the major sourceof CO, CO2, NOx, and SO2. Many other pollutants arereleased into the air by combustion.
The most common fuels are hydrocarbon compounds (oil,natural gas, coal, and wood). About 15% of the total emis-sions of hydrocarbons are from anthropogenic sources.
Ideal (or complete) combustion of a hydrocarbon fuel yieldsonly CO2 and H2O. However, for a given quantity of fuel, aprecise amount of oxygen is required for complete combus-tion, and this ideal combination of fuel and oxygen is rarelyachieved.
69
Modern internal combustion engines with catalytic convert-ers that reduce the emissions of particularly undesirableemissions, have quite small emissions.
Older automobiles tended to run with a fuel-rich mixtureand these emit considerable pollutants.
Even modern automobiles operate in a “fuel-rich mode” foralmost 1 minute after the engine is started, and for severalseconds when driven at full throttle, and they produce asignificant fraction of the CO.
Emissions of NOx from automobiles play a key role in theformation of photochemical smog.
There are also lower temperature sources of air pollutants;for example, leakages of hydrocarbons from natural gas lines,organics from the evaporation of solvents, and nitrogen gasesfrom fertilizers.
70
Anthropogenic activities also emit large numbers of parti-cles into the atmosphere, both directly and through g-to-pconversion.
For particles >5µm diameter, human activities worldwideare estimated to produce ∼15% of natural emissions, withindustrial processes, fuel combustion, and g-to-p conversionaccounting for ∼80% of the anthropogenic emissions.
However, in urban areas anthropogenic sources are muchmore important.
For particles <5 µm diameter, human activities produce∼20% of natural emissions, with g-to-p conversion account-ing for ∼90% of the human emissions.
71
SmogsThe term smog derives from smoke and fog. The term isnow applied to all forms of severe air pollution, particularlyin urban areas, that restrict visibility.
a. “London smog”Prior to the introduction of air pollution abatement laws inthe latter part of the twentieth century, many large cities inEurope and North America regularly suffered from severesmogs.
In the London (or classical) type of smog, particles swell insize under high relative humidity and some of the particlesserve as nuclei on which fog droplets form.
Sulfur dioxide gas absorbs into the fog droplets where it isoxidized to form sulfuric acid.
72
In December 1952, cold air moved from the English Chan-nel and settled over London. This produced a pollution-trapping inversion fog. Over the next five days London ex-perienced its worst air pollution episode.
The smog was so thick that people had to grope their wayalong the streets, buses crawled along at a walking paceled by pedestrians with flashlights, and indoor events werecancelled because the stage could not be seen.
4,000 people had died of respiratory problems, and the smogwas implicated in an additional 8,000 deaths in the monthsthat followed.
In the Great Smog, as it was called, SO2 reached peak mix-ing ratios of about 0.7 ppmv (compared to typical annualmean mixing ratios of about 0.1 ppmv in polluted citieswith large coal usage), and the peak particle concentrationswere 1.7mgm −3.
73
After the Great Smog, laws were passed in Britain and else-where banning the use of coal on open fires for domesticheating and the emissions of black smoke, and requiring in-dustries to switch to cleaner-burning fuels.
In particular, bituminous coal has been banned in Dublinfor about twenty years.
Thank you, Mary Harney!
Nevertheless, pollution is still prevalent in significant quan-tities in many cities in Europe and the United States. Also,many large cities, particularly in developing countries (e.g.,China, India), still suffer from London-type smogs due tothe burning of coal and wood and to the lack of strict airpollution controls.
74
b. Photochemical (or Los Angeles) smogDuring the second half of the 20th century emissions fromautomobiles became increasingly a source of pollutants inmany urban areas.
When subjected to sunlight, and stagnant meteorologicalconditions, the combination of chemical species in stronglypolluted urban air can lead to photochemical (or Los Angeles-type) smog.
These smogs are characterized by high concentrations of alarge variety of pollutants, such as nitrogen oxides, O3, CO,hydrocarbons, aldehydes (and other materials that are eyeirritants), and sometimes sulfuric acid.
The chemical reactions that lead to photochemical smogare complex, and still not completely understood. For anoutline, see Wallace & Hobbs.
75
Regional and Global PollutionThe effects of anthropogenic pollution now extend to re-gional and global scales.
Europe, Russia, the northeastern United States, India, andlarge areas of southeastern Asia, are regularly covered byenormous palls of polluted air that reduce visibility signif-icantly, produce acid deposition, soil and erode buildingsand other materials, and have deleterious effects on humanhealth, animals and plants.
The fact that pollutants can be transported over large dis-tances is well illustrated by air pollution episodes in the Arc-tic, known as arctic haze, which can be as severe as those incities. The pollutants originate from fossil-fuel combustion,smelting, and other industrial processes in northern Europeand Russia.
76
The pollutants are transported to the Arctic by synoptic-scale airflow patterns, primarily from December to April.Since the arctic atmosphere is generally stably stratifiedduring this time of the year, vertical mixing is limited; also,precipitation is rare so that wet removal processes are weak.
Consequently, the pollutants can be transported over largedistances with relatively little dilution. A major contributorto arctic haze is SO2, which is converted to sulfate particlesover the long transport distances.
Glacial records show that air pollution in the Arctic hasincreased markedly since the 1950s, paralleling the increasesin SO2 and NOx emissions in Europe.
77
Ice cores from Greenland show unusually high lead con-centrations from ∼500 B.C. to 300 A.D. This is attributedto Greek and Roman lead and silver mining and smeltingactivities, which apparently polluted large regions of theNorthern Hemisphere.
Anthropogenic influences are now apparent on a global scale,as illustrated by the world-wide increase in CO2 concen-trations since the Industrial Revolution (following Figure).Other trace gases (e.g., CH4 and N2O) also show increasingconcentrations worldwide over the past 150 years or so.
78
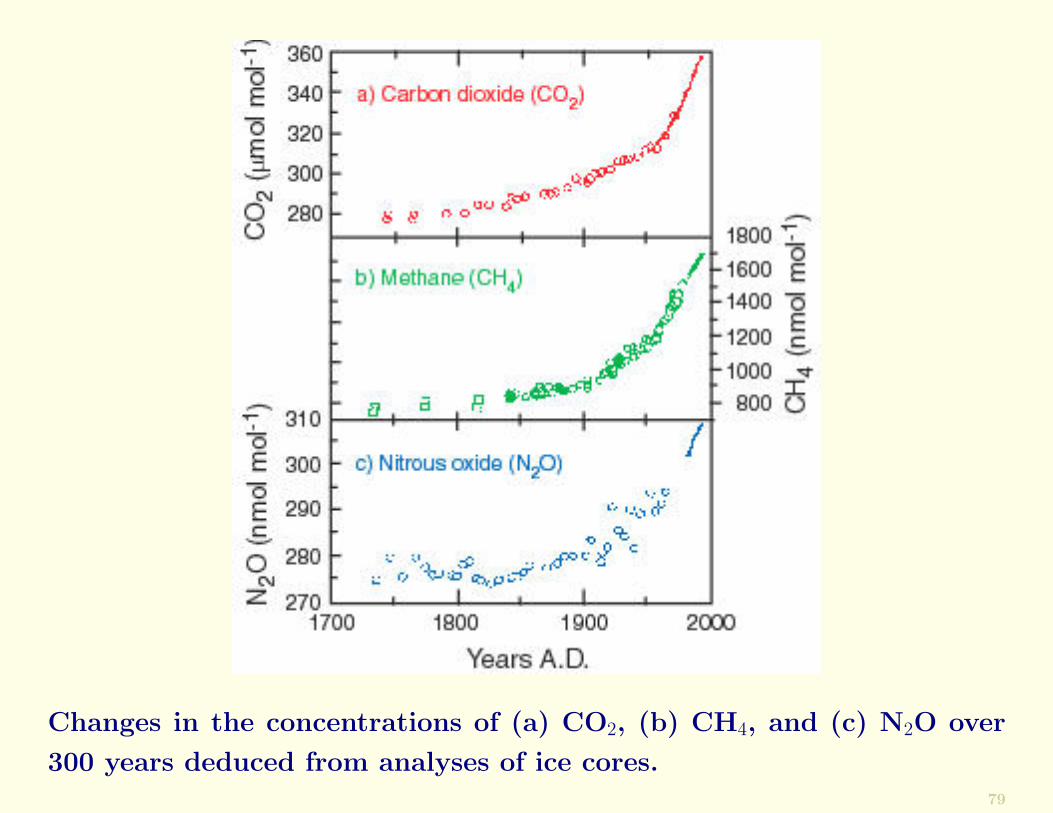
Changes in the concentrations of (a) CO2, (b) CH4, and (c) N2O over
300 years deduced from analyses of ice cores.79
6. Tropospheric Chemical CyclesThe reservoirs of chemical species in the Earth system arethe solid Earth, the hydrosphere, the cryosphere, the bio-sphere and the atmosphere. Chemical species can be trans-ferred between these reservoirs.
Since, under steady-state conditions, a chemical species can-not accumulate indefinitely in any of the reservoirs, theremust be continual cycling of species through the variousreservoirs. This is termed biogeochemical cycling.
Here we will consider the tropospheric portions of the bio-geochemical cycles of nitrogen and sulfur. We will be con-cerned with relatively rapid interchanges involving the at-mosphere and other reservoirs (generally the oceans and thebiosphere).
80
Many aspects of global chemical cycles are not well un-derstood, therefore, in many cases, the magnitudes of thesources and sinks given are estimates.
Also, the magnitudes of the various emission fluxes are notnecessarily equivalent to the importance of the species, sinceatmospheric residence times must also be taken into ac-count.
81
The Nitrogen CycleNitrogen gas (N2) constitutes more than 99.99% of the ni-trogen present in the atmosphere, and N2O makes up morethan 99% of the rest of the nitrogen.
The other nitrogen species in the atmosphere are thereforepresent in very low concentrations, but they are of crucialimportance in atmospheric chemistry.
For example, NH3 is the only basic gas in the atmosphere.Therefore, it is solely responsible for neutralizing acids pro-duced by the oxidation of SO2 and NO2.
Nitric oxide and NO2 play important roles in both tropo-spheric and stratospheric chemistry.
82
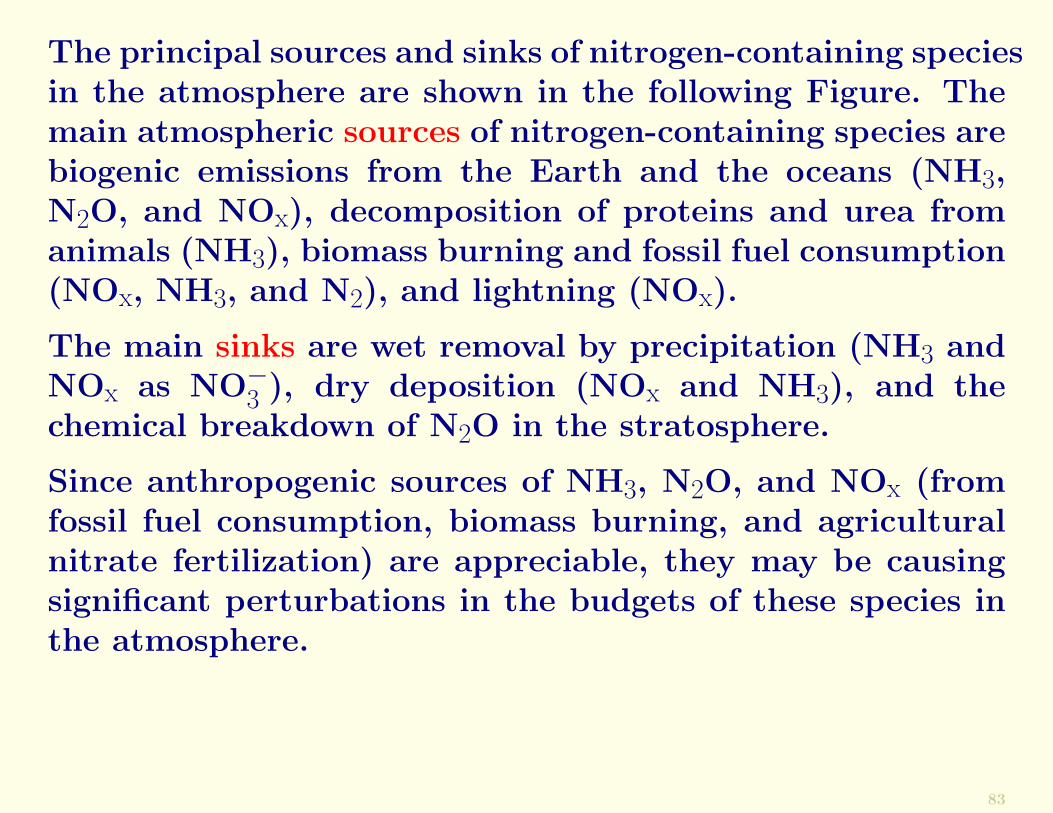
The principal sources and sinks of nitrogen-containing speciesin the atmosphere are shown in the following Figure. Themain atmospheric sources of nitrogen-containing species arebiogenic emissions from the Earth and the oceans (NH3,N2O, and NOx), decomposition of proteins and urea fromanimals (NH3), biomass burning and fossil fuel consumption(NOx, NH3, and N2), and lightning (NOx).
The main sinks are wet removal by precipitation (NH3 andNOx as NO−3 ), dry deposition (NOx and NH3), and thechemical breakdown of N2O in the stratosphere.
Since anthropogenic sources of NH3, N2O, and NOx (fromfossil fuel consumption, biomass burning, and agriculturalnitrate fertilization) are appreciable, they may be causingsignificant perturbations in the budgets of these species inthe atmosphere.
83
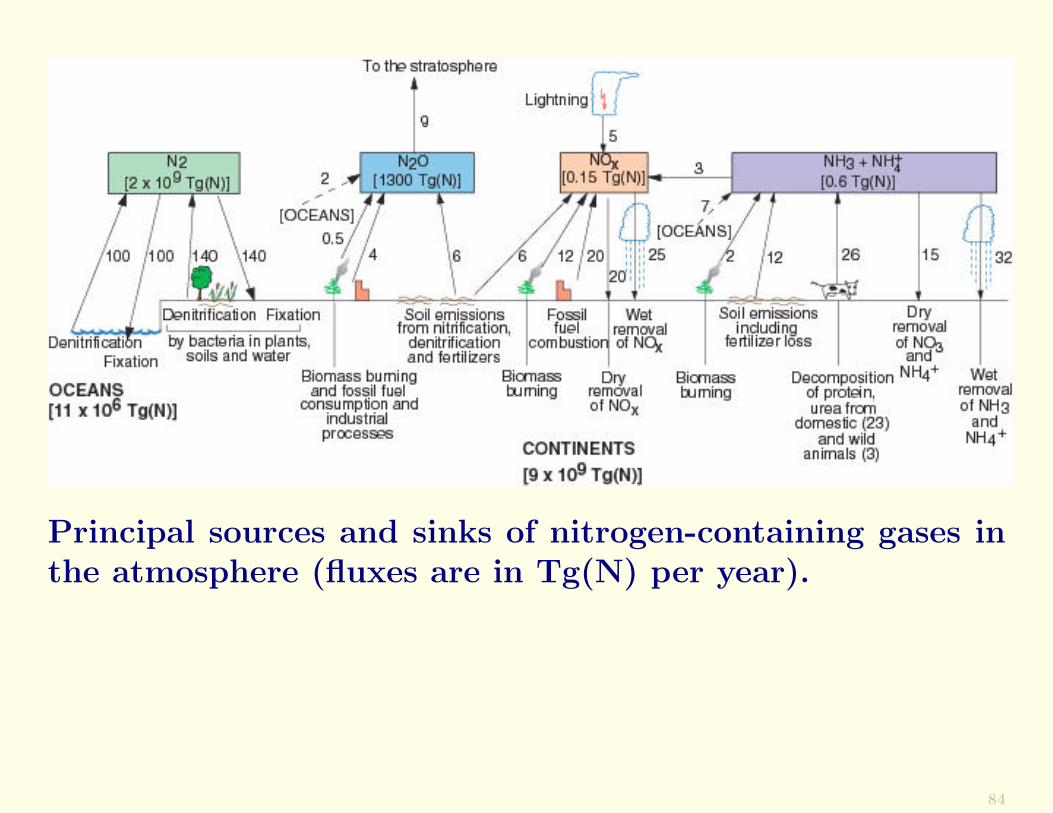
Principal sources and sinks of nitrogen-containing gases inthe atmosphere (fluxes are in Tg(N) per year).
84
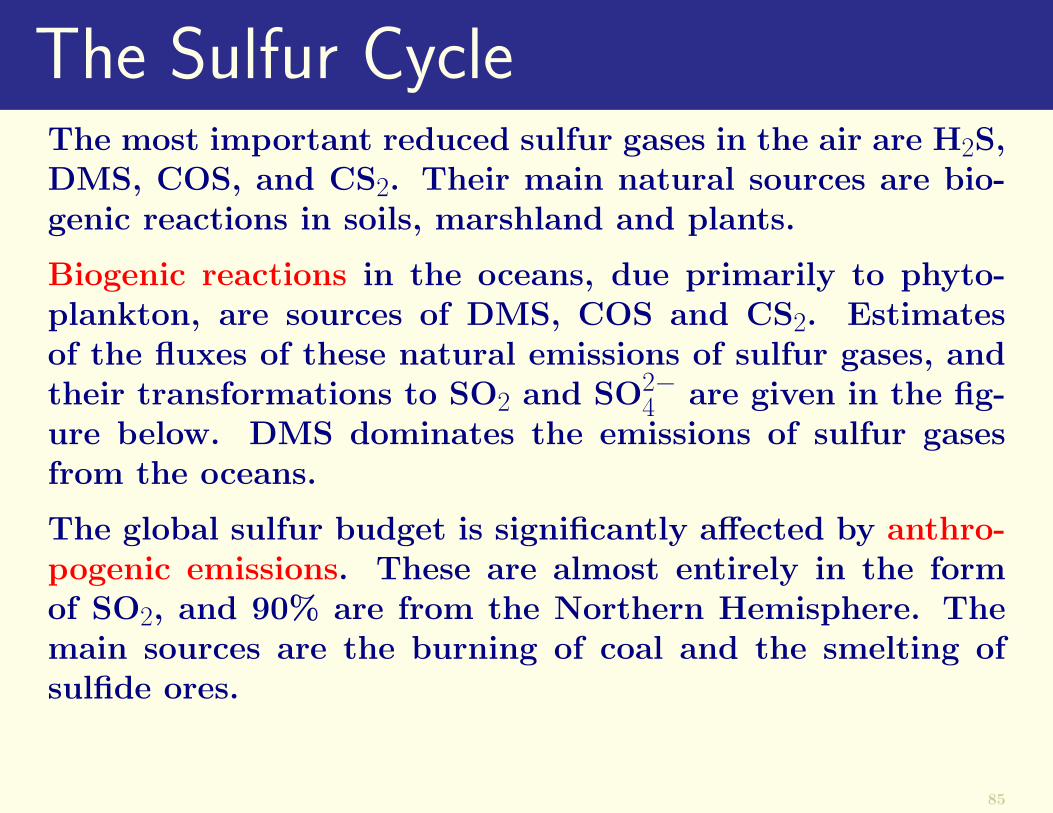
The Sulfur CycleThe most important reduced sulfur gases in the air are H2S,DMS, COS, and CS2. Their main natural sources are bio-genic reactions in soils, marshland and plants.
Biogenic reactions in the oceans, due primarily to phyto-plankton, are sources of DMS, COS and CS2. Estimatesof the fluxes of these natural emissions of sulfur gases, andtheir transformations to SO2 and SO2−
4 are given in the fig-ure below. DMS dominates the emissions of sulfur gasesfrom the oceans.
The global sulfur budget is significantly affected by anthro-pogenic emissions. These are almost entirely in the formof SO2, and 90% are from the Northern Hemisphere. Themain sources are the burning of coal and the smelting ofsulfide ores.
85
The main mechanisms for removing sulfur from the atmo-sphere are wet and dry deposition.
For example, of the 80 Tg(S) per year of SO2 that are ox-idized to SO2−
4 , about 70 Tg(S) per year occurs in clouds,which is subsequently wet deposited.
86
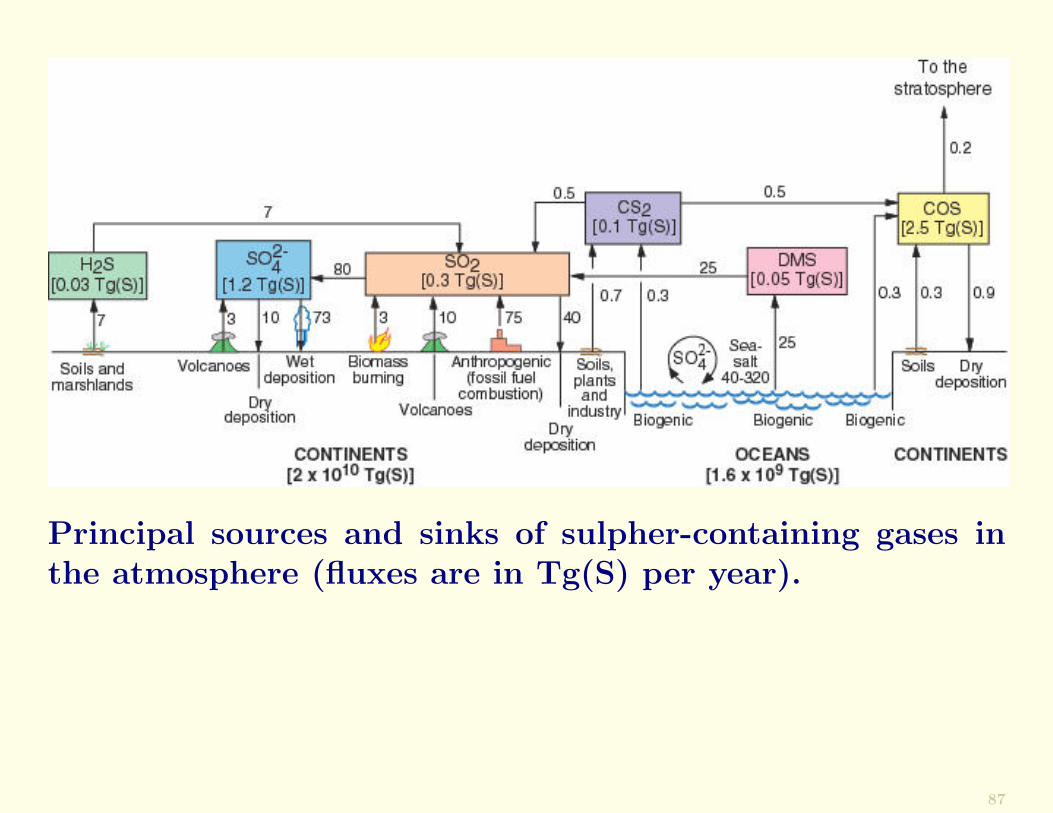
Principal sources and sinks of sulpher-containing gases inthe atmosphere (fluxes are in Tg(S) per year).
87
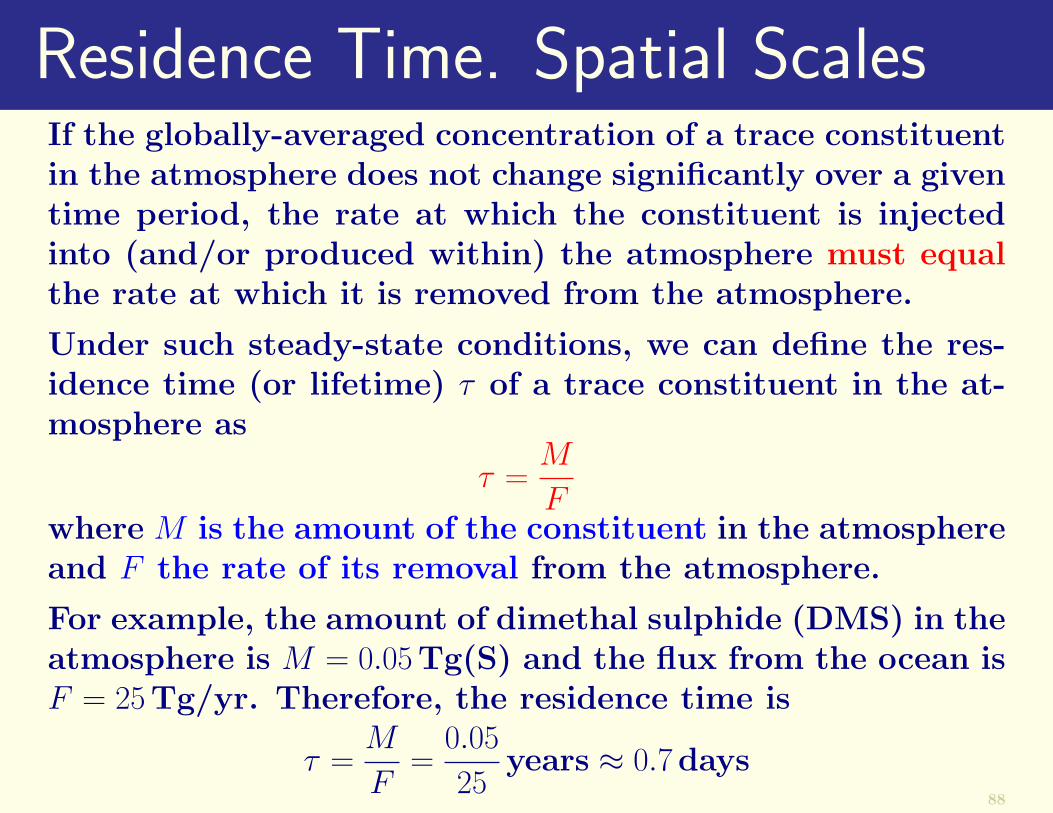
Residence Time. Spatial ScalesIf the globally-averaged concentration of a trace constituentin the atmosphere does not change significantly over a giventime period, the rate at which the constituent is injectedinto (and/or produced within) the atmosphere must equalthe rate at which it is removed from the atmosphere.
Under such steady-state conditions, we can define the res-idence time (or lifetime) τ of a trace constituent in the at-mosphere as
τ =M
Fwhere M is the amount of the constituent in the atmosphereand F the rate of its removal from the atmosphere.
For example, the amount of dimethal sulphide (DMS) in theatmosphere is M = 0.05Tg(S) and the flux from the ocean isF = 25Tg/yr. Therefore, the residence time is
τ =M
F=
0.05
25years ≈ 0.7days
88
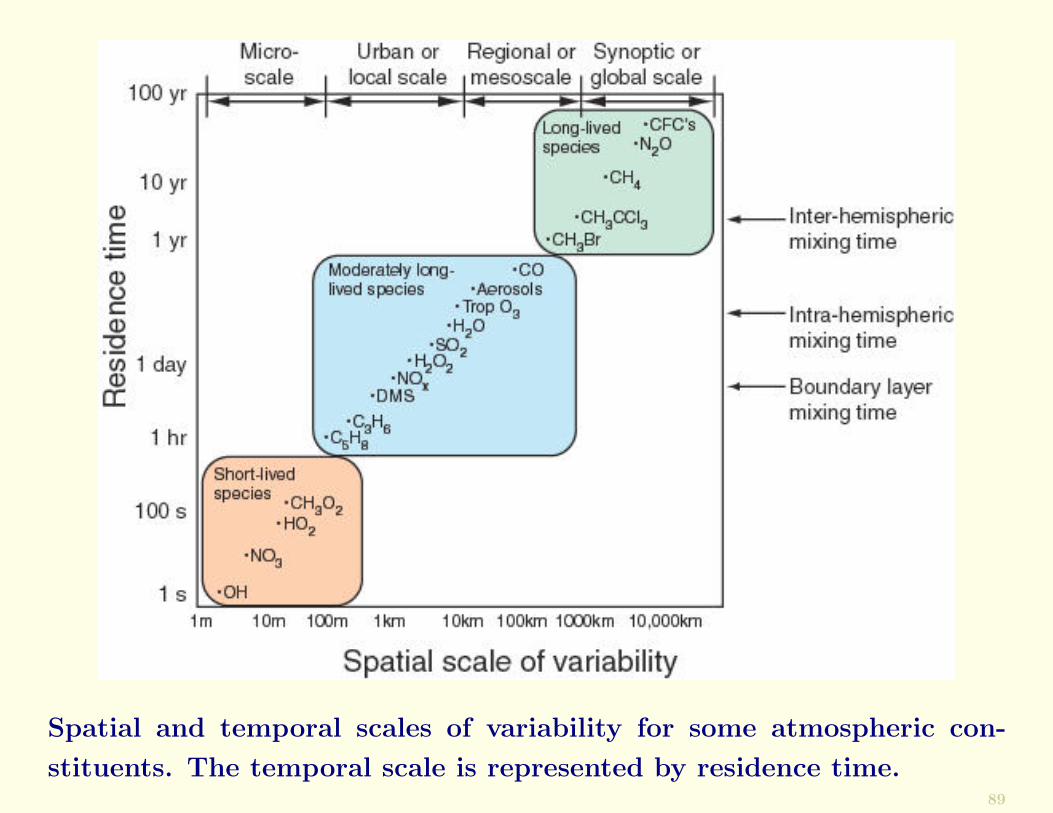
Spatial and temporal scales of variability for some atmospheric con-
stituents. The temporal scale is represented by residence time.89
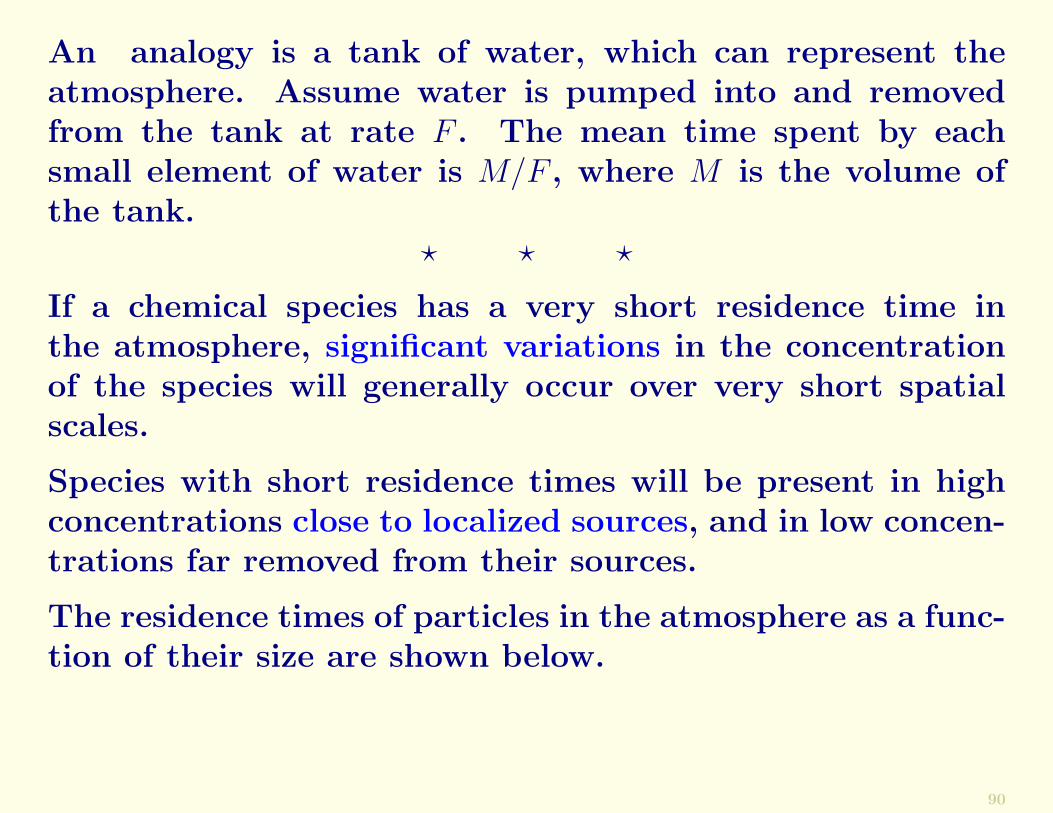
An analogy is a tank of water, which can represent theatmosphere. Assume water is pumped into and removedfrom the tank at rate F . The mean time spent by eachsmall element of water is M/F , where M is the volume ofthe tank.
? ? ?
If a chemical species has a very short residence time inthe atmosphere, significant variations in the concentrationof the species will generally occur over very short spatialscales.
Species with short residence times will be present in highconcentrations close to localized sources, and in low concen-trations far removed from their sources.
The residence times of particles in the atmosphere as a func-tion of their size are shown below.
90
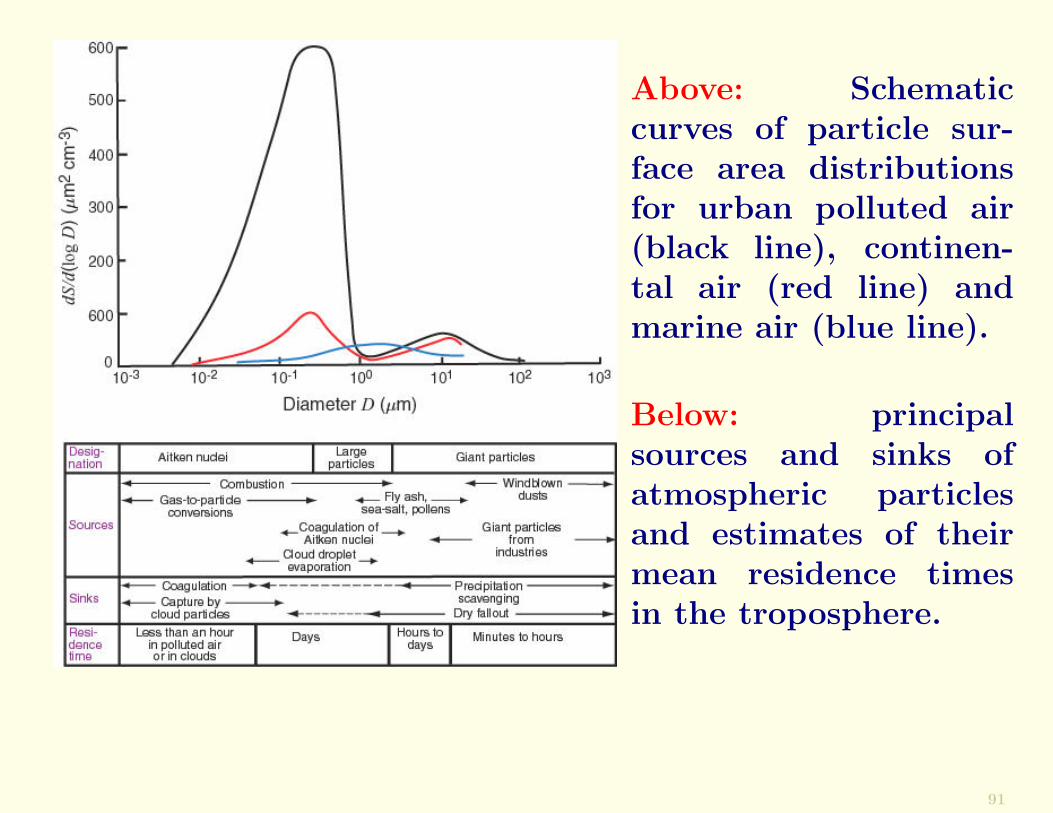
Above: Schematiccurves of particle sur-face area distributionsfor urban polluted air(black line), continen-tal air (red line) andmarine air (blue line).
Below: principalsources and sinks ofatmospheric particlesand estimates of theirmean residence timesin the troposphere.
91
7. Stratospheric ChemistryThere is an abrupt change in concentrations of severalimportant trace constituents between the troposphereand stratosphere.
For example, water vapour decreases substantially andO3 increases by up to an order of magnitude.
This is because there is very little vertical mixing betweenthe relatively moist, ozone-poor troposphere and the dry,ozone-rich stratosphere.
Within the stratosphere the air is generally neutral or stablewith respect to vertical motions.
Also, the removal of aerosols and trace gases by precipita-tion (wash-out or wet deposition) is absent in the strato-sphere.
Materials that enter the stratosphere can remain there forlong periods of time, often as stratified layers.
92
Unperturbed Stratospheric OzoneDistribution
Ozone in the stratosphere is of great importance:
• It forms a protective shield that reduces the intensityof UV radiation from the Sun that reaches the Earth’ssurface.
• Due to the absorption of UV radiation, O3 determinesthe vertical profile of temperature in the stratosphere.
• It is involved in many stratospheric chemical reactions.
93
W. N. HartleyW. N. Hartley (1846-1913) was a renowned spectroscopistwho spent his working life in Ireland.
He was Professor of chemistry at Royal College of Science,Dublin.
In 1881 Hartley measured the UV radiation reaching theEarth’s surface and found a sharp cut-off at λ = 0.30 µm.
He correctly attributed this to absorption by O3 in thestratosphere.
Subsequent ground-based UV measurements, and the firstmeasurements of the concentrations of stratospheric O3 byballoons in the 1930s, placed the maximum O3 concentrationin the lower part of the stratosphere.
Shown in the figure below are the results of more recentmeasurements of O3. The presence of an ozone layer be-tween heights of ∼15–30 km is very clear.
94
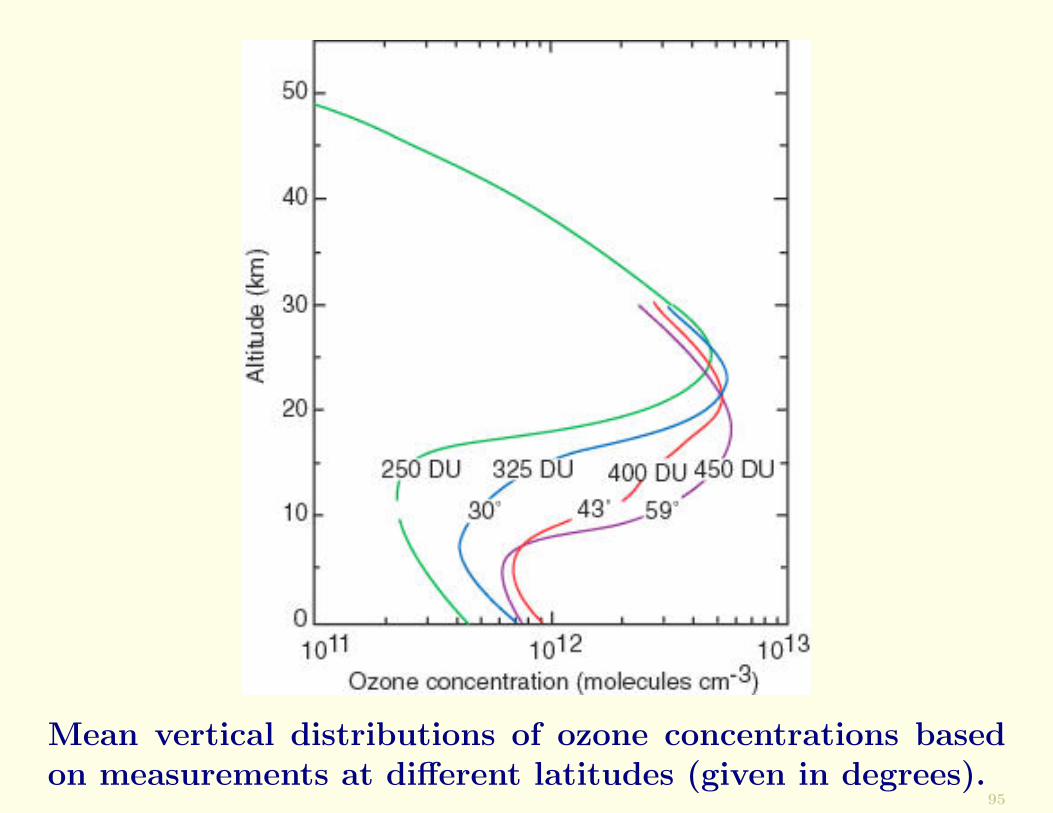
Mean vertical distributions of ozone concentrations basedon measurements at different latitudes (given in degrees).
95
The O3 layer is highly variable. Its height and intensitychange with latitude, season, and meteorological conditions.The total ozone column abundance [in Dobson units (DU)]is indicated in the figure.
The largest column densities of O3 in the northern hemi-sphere occur in polar latitudes in spring.
In the SHS the spring maximum is at midlatitudes.
Since O3 is produced by photochemical reactions, the pro-duction is a maximum in the stratosphere over the tropics.
At any given point in the atmosphere, the balance betweenthe production and loss of O3 and its flux divergence deter-mines the O3 concentration.
The high concentration at polar and midlatitudes is at-tributed to meridional transport of O3 from the equator
Much of the change in the total column abundance of O3 isdue to differences in the profiles below 20 km.
96
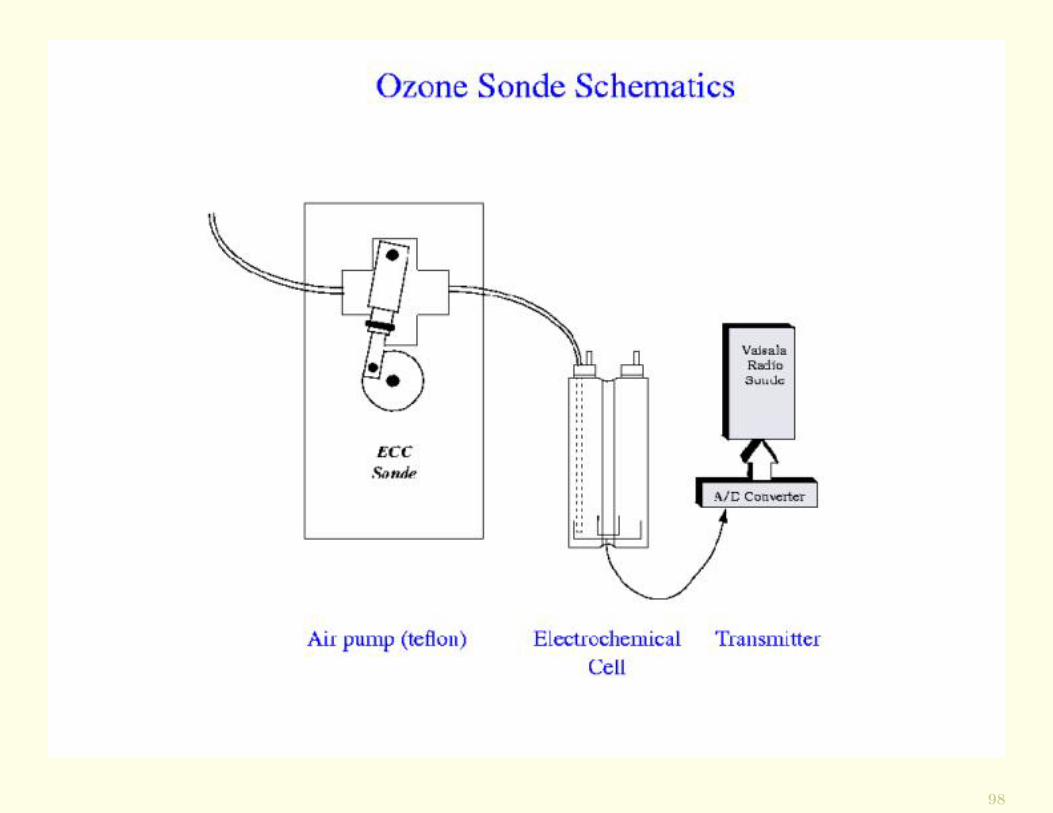
Techniques for Measuring O3In situ measurements of vertical profiles of O3 may be ob-tained from ozonesondes, which can be carried on radiosondeballoons.
The O3 sensor is comprised of two electrolytic cells, eachcontaining a solution of potassium iodide (KI). The cellsare initially in chemical and electrical equilibrium.
However, when an air sample containing O3 is drawn throughone of the cells, the equilibrium is perturbed and an electriccurrent flows between the cells.
The amount of electric charge, which is proportional to thepartial pressure of the O3 in the ambient air, is continu-ously transmitted to a ground station along with the ambi-ent pressure and temperature.
In this way, a vertical profile of O3 is obtained, the integra-tion of which provides the O3 column from ground level upto the height of the balloon.
97
98
Brewer SpectrophotometerThe O3 column from the ground to the top of the atmo-sphere can be measured by passive remote sensing using aninstrument called a Brewer spectrophotometer.
This is done by measuring the amount of UV sunlight thatreaches the ground, and deducing from this how much UVabsorption occurred due to O3. Absorption by O3 occurs inthe UV-B region (λ = 0.29− 0.32 µm).
However, clouds and some aerosol particles also absorb inthis wavelength band. Therefore, a region of the electro-magnetic spectrum where O3 absorbs only weakly, but cloudsand aerosol absorb similarly to the UV-B region, is alsomonitored [to provide a reference].
By taking the ratio of the two measured values, absorptionby O3 in the total vertical column can be obtained.
99
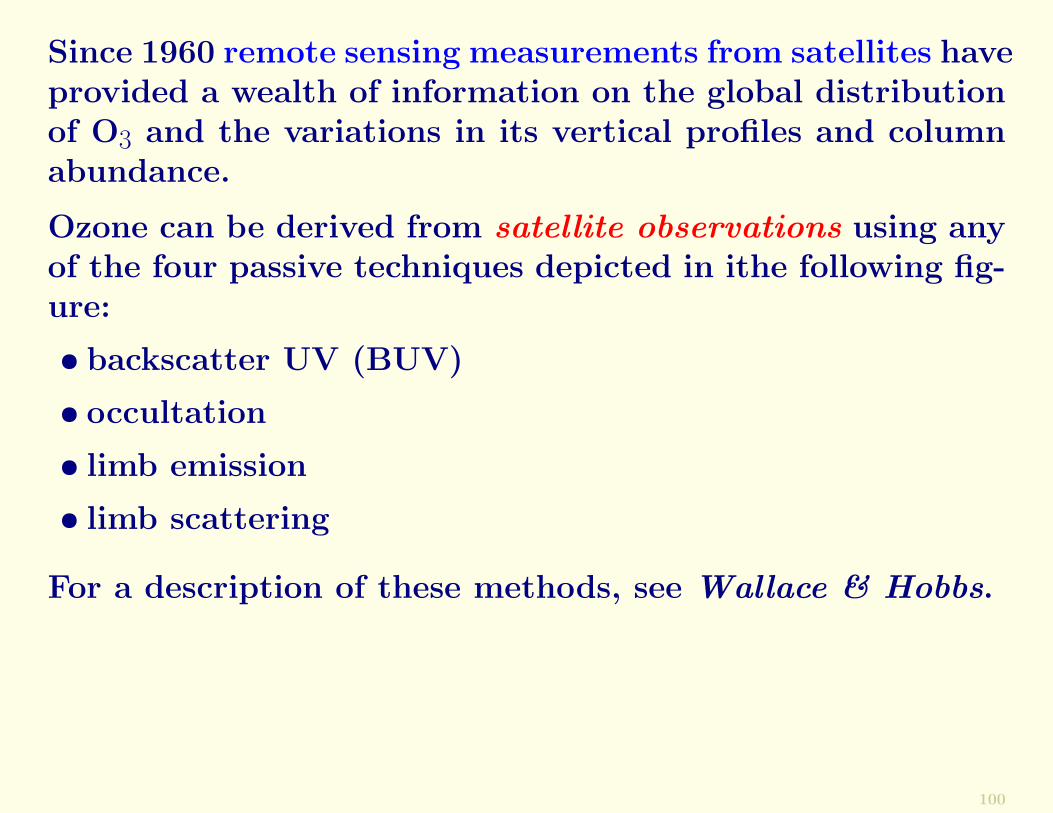
Since 1960 remote sensing measurements from satellites haveprovided a wealth of information on the global distributionof O3 and the variations in its vertical profiles and columnabundance.
Ozone can be derived from satellite observations using anyof the four passive techniques depicted in ithe following fig-ure:
• backscatter UV (BUV)
• occultation
• limb emission
• limb scattering
For a description of these methods, see Wallace & Hobbs.
100
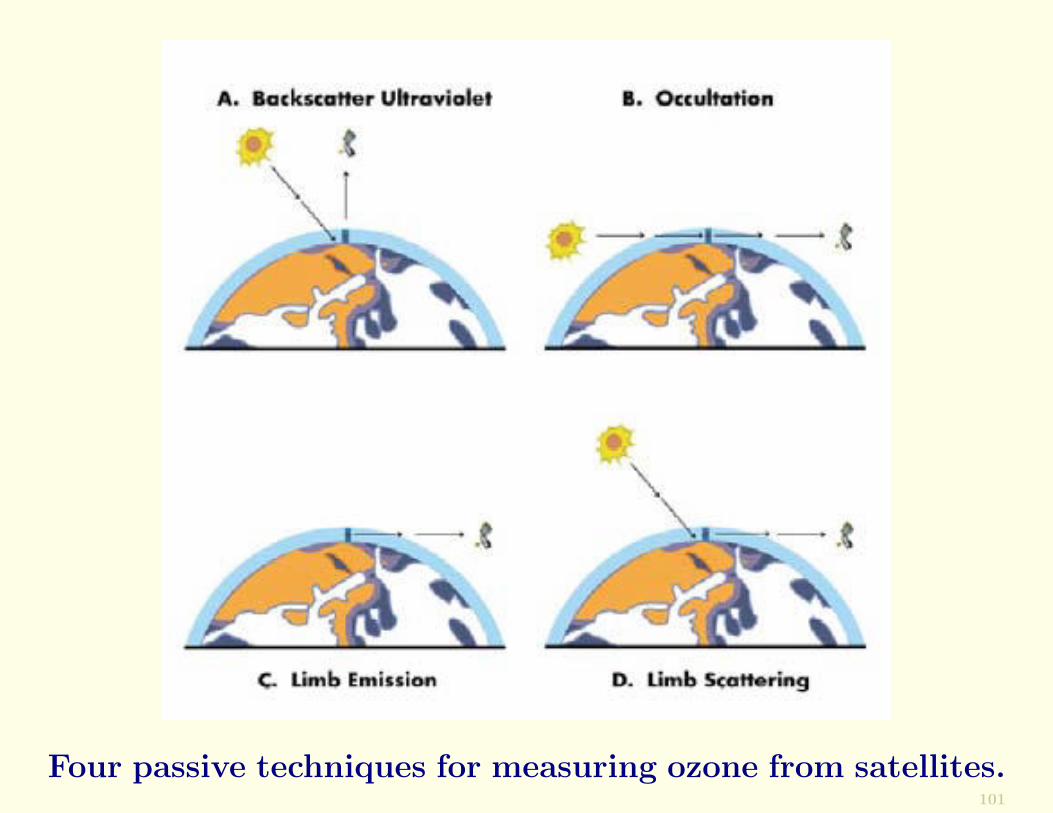
Four passive techniques for measuring ozone from satellites.101
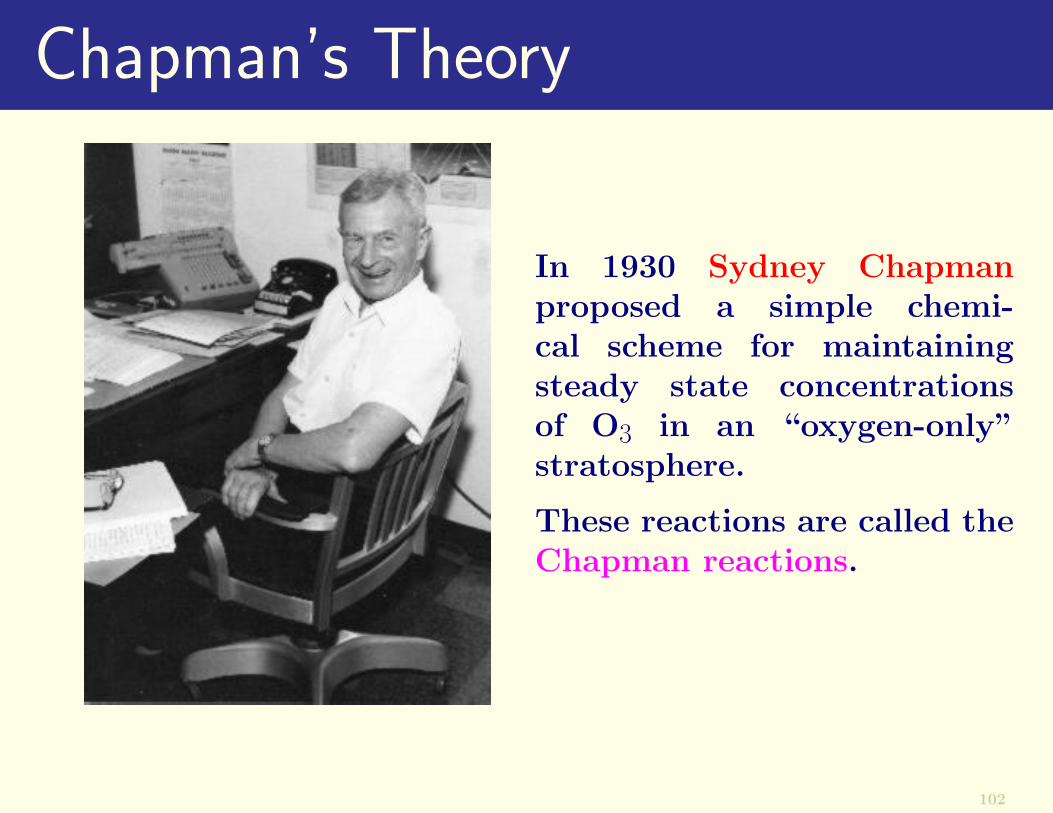
Chapman’s Theory
In 1930 Sydney Chapmanproposed a simple chemi-cal scheme for maintainingsteady state concentrationsof O3 in an “oxygen-only”stratosphere.
These reactions are called theChapman reactions.
102
The Chapman reactions are as follows:
• The dissociation of O2 by solar UV radiation
O2 + hν → 2O
• The reaction of atomic oxygen and molecular oxygen toform O3
O + O2 + M → O3 + M
• The photodissociation of O3
O3 + hν → O2 + O
• The combination of atomic oxygen and O3 to form O2
O + O3 → 2O2
103
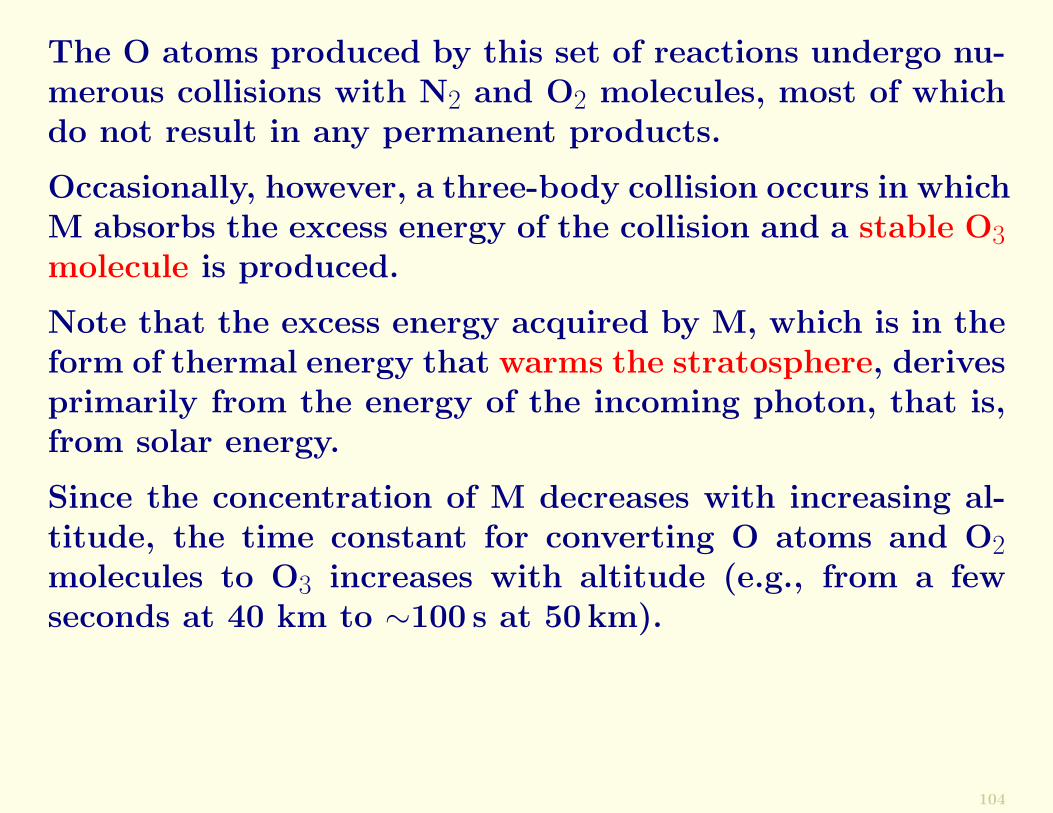
The O atoms produced by this set of reactions undergo nu-merous collisions with N2 and O2 molecules, most of whichdo not result in any permanent products.
Occasionally, however, a three-body collision occurs in whichM absorbs the excess energy of the collision and a stable O3molecule is produced.
Note that the excess energy acquired by M, which is in theform of thermal energy that warms the stratosphere, derivesprimarily from the energy of the incoming photon, that is,from solar energy.
Since the concentration of M decreases with increasing al-titude, the time constant for converting O atoms and O2molecules to O3 increases with altitude (e.g., from a fewseconds at 40 km to ∼100 s at 50 km).
104
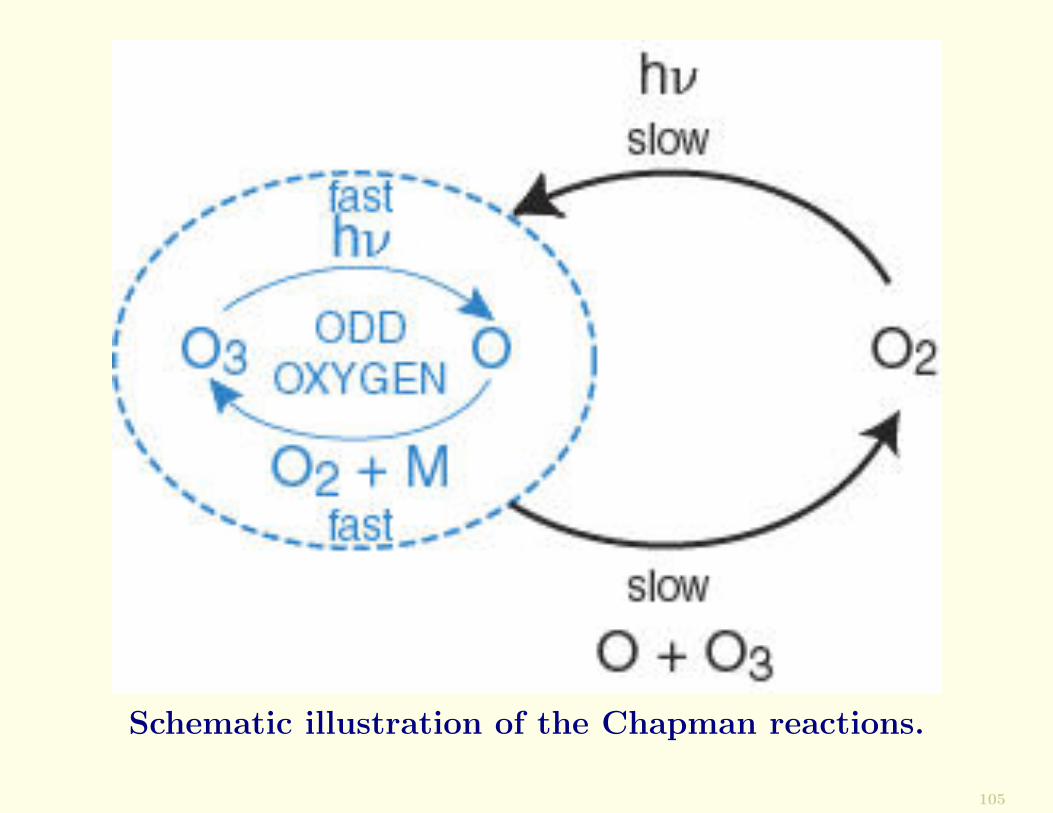
Schematic illustration of the Chapman reactions.
105
Stratospheric O3 concentrations exhibit minor diurnal vari-ations (analogous to the day-to-day variations in weather inthe troposphere).
After sunset, both the source and sink of O3 are switchedoff, the remaining O atoms are then converted to O3 withina minute or so.
The Chapman reactions reproduce some of the broad fea-tures of the vertical distribution of O3 in the stratosphere.For example, they predict that O3 concentrations shouldreach maximum values at an altitude of ∼25 km.
However, the Chapman reactions overpredict the concen-trations of stratospheric O3 by about a factor of two in thetropics and they underpredict O3 concentration in middleto high latitudes.
There is an equator-to-pole circulation in the stratosphere,known as the Brewer-Dobson Circulation, which transportsO3 from its primary source in the tropical stratosphere tohigher latitudes.
106
The Ozone HoleIn the 1970s it was suggested that catalytic cycles involvingreactive chlorine (Cl) and bromine (Br) could be importantin the destruction of O3.
The natural sources of Cl and Br in the stratosphere are thedestruction of methyl chloride (CH3Cl) and methyl bromide(CH3Br).
The destruction of stratospheric O3 by the various chemi-cal mechanisms discussed above, and many other possiblemechanisms not discussed here, are not simply additive be-cause the species in one cycle can react with those in an-other.
Therefore, advanced numerical models that consider all theknown suspects must be used to unravel the relative impor-tance of the various mechanisms for destroying O3 in thestratosphere.
107
This task is complicated further by the fact that concentra-tions of many of the prime suspects are changing with timedue to anthropogenic emissions.
? ? ?
Most of the catalytic reactions that have been proposed forthe removal of stratospheric odd oxygen are of the form
X + O3 → XO + O2
XO + O → X + O2
−−−−−− − −−−−−−Net: O + O3 → 2O2
If the concentration of catalyst X is increased significantlyby anthropogenic activities, the balance between the sourcesand sinks of atmospheric O3 will be disturbed and strato-spheric O3 concentrations can be expected to decrease.
108
One of the first concerns in this respect was a proposal inthe 1970s to create a fleet of supersonic aircraft flying in thestratosphere. This is because aircraft engines emit nitricoxide (NO), which can decrease odd oxygen.
However, the proposed fleet of supersonic aircraft was re-jected on both environmental (?) and economic grounds.
Of much greater concern, with documented impacts, is thecatalytic action of chlorine, from industrially manufacturedchlorofluorocarbons (CFCs), in depleting stratospheric ozone.
109
Chlorofluorocarbons (CFCs)Chlorofluorocarbons (CFCs) are compounds containing chlo-rine fluorine and carbon.
Halons are compounds that contain, in addition, bromine.
Compounds containing H, F and C are called hydrofluoro-carbons (HFCs)
Compounds containing H, Cl, F, and C are called hydrochlo-rofluorocarbons (HCFCs).
HFCs and HCFCs are considered to be more “environmen-tally friendly” than CFCs because they are partially de-stroyed by OH in the troposphere.
110
CFC-11 (CFCl3) and CFC-12 (CF2Cl2) are the most com-mon CFCs. CFCs were first synthesized in 1928, as theresult of a search for a nontoxic, nonflammable refrigerant.
During the 20th century CFCs were marketed under thetrade name Freon and became widely used as
• refrigerants
• propellants in aerosol cans
• inflating agents in foam materials
• solvents
• cleansing agents
111
Concern about the effects of CFCs on the atmosphere be-gan in 1973 when it was found that they were spreadingglobally and, because of their inertness, were expected tohave residence times of up to several hundred years in thetroposphere.
Such long-lived compounds eventually find their way intothe stratosphere where, near an altitude of ∼20 km, they ab-sorb UV radiation in the wavelength interval 0.19–0.22 µmand photodissociate:
CFCl3 + hν → CFCl2 + Cl
andCF2Cl2 + hν → CF2Cl + Cl
112
The chlorine atom released by these reactions can serve asthe catalyst X and destroy odd oxygen in the cycle
Cl + O3 → ClO + O2
ClO + O → Cl + O2
−−−−−− − −−−−−−Net: O + O3 → 2O2
In 1990, ∼85% of the chlorine in the stratosphere originatedfrom anthropogenic sources. Because CFCs absorb stronglyin the infrared, they are also significant greenhouse gases.
113
The first evidence of a significant depletion in stratosphericO3 produced by anthropogenic chemicals in the stratospherecame, surprisingly, from measurements in the Antarctic.
In 1985, British scientists, who had been making ground-based, remote sensing measurements of O3 at Halley Bay(76◦S) in the Antarctic for many years, reported that therehad been about a 30% decrease in total O3 column abun-dance each October (i.e., in the austral spring) since 1977.
These observations were subsequently confirmed by remotesensing measurements from satellite and by airborne in situmeasurements.
Shown in the next Figure are a series of satellite measure-ments of the total O3 column in the southern hemisphere.
114
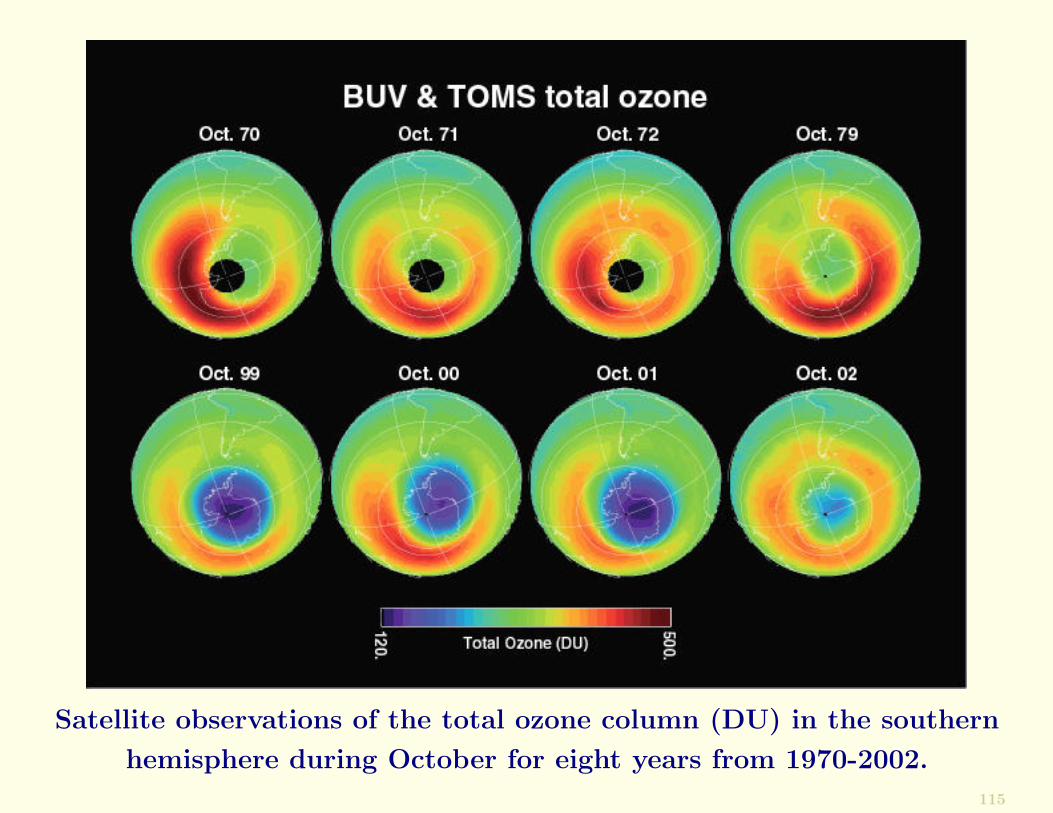
Satellite observations of the total ozone column (DU) in the southern
hemisphere during October for eight years from 1970-2002.
115
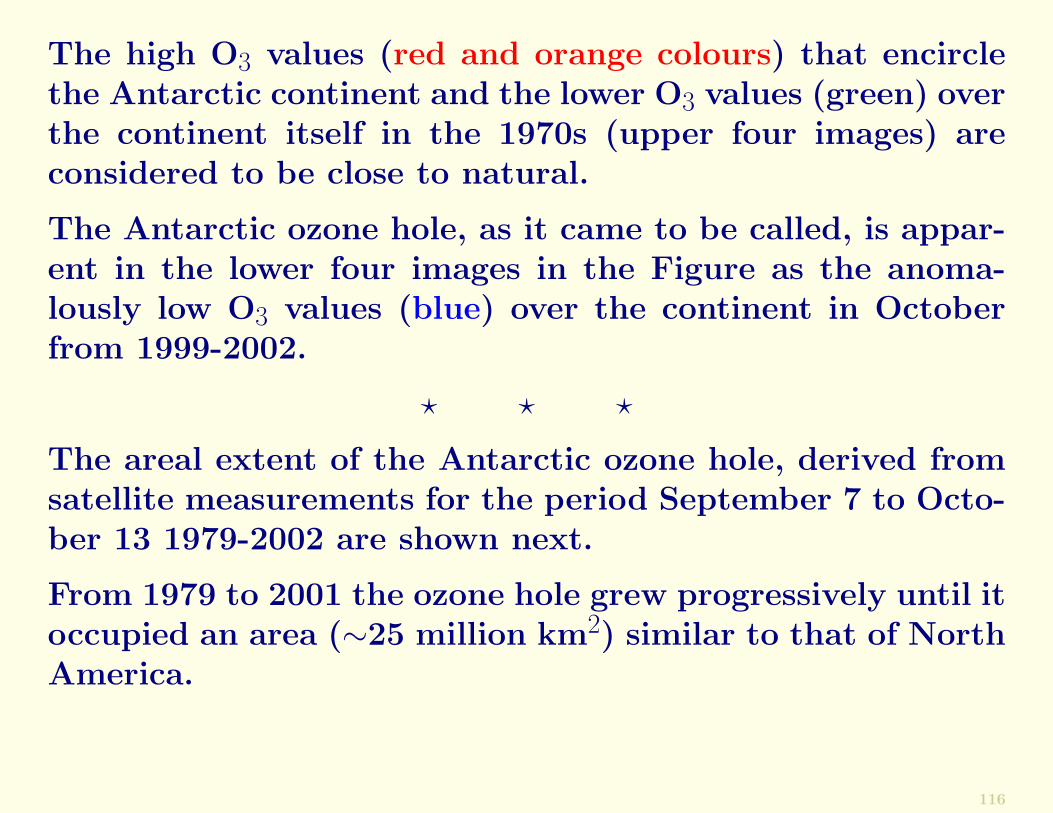
The high O3 values (red and orange colours) that encirclethe Antarctic continent and the lower O3 values (green) overthe continent itself in the 1970s (upper four images) areconsidered to be close to natural.
The Antarctic ozone hole, as it came to be called, is appar-ent in the lower four images in the Figure as the anoma-lously low O3 values (blue) over the continent in Octoberfrom 1999-2002.
? ? ?
The areal extent of the Antarctic ozone hole, derived fromsatellite measurements for the period September 7 to Octo-ber 13 1979-2002 are shown next.
From 1979 to 2001 the ozone hole grew progressively until itoccupied an area (∼25 million km2) similar to that of NorthAmerica.
116
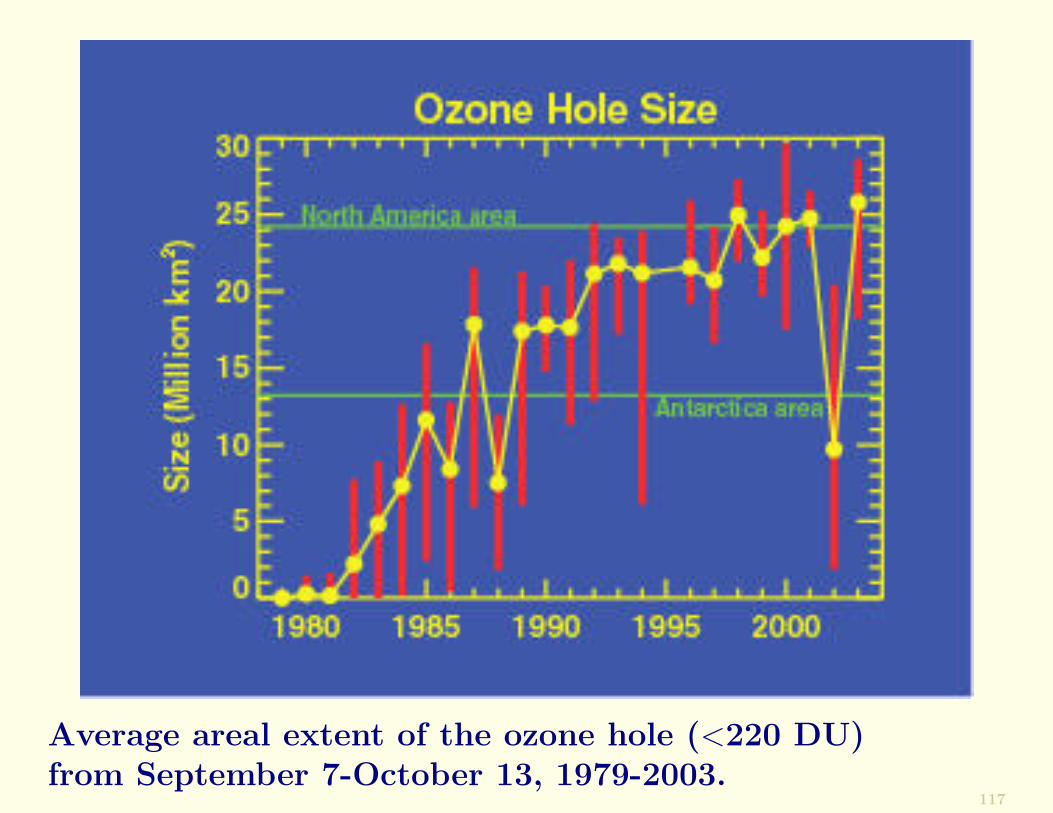
Average areal extent of the ozone hole (<220 DU)from September 7-October 13, 1979-2003.
117
The presence of an ozone hole over the Antarctic raisedseveral intriguing questions.
• Why over the Antarctic?
• Why during spring?
• The magnitude of the measured decreases in O3 weremuch greater than predictions based solely on gas-phasechemistry of the type outlined above. Why?
• Why did the size of the ozone hole decrease sharply in2002?
The research that led to the answers to these questions,which is outlined below, was one of the triumphs of 20th
century science.
Paul Crutzen, Mario Molina, and Sherwood Rowland wereawarded the Nobel Prize in Chemistry in 1995 for theirexplanation of stratospheric O3 loss by CFCs and nitrogen-containing gases.
118
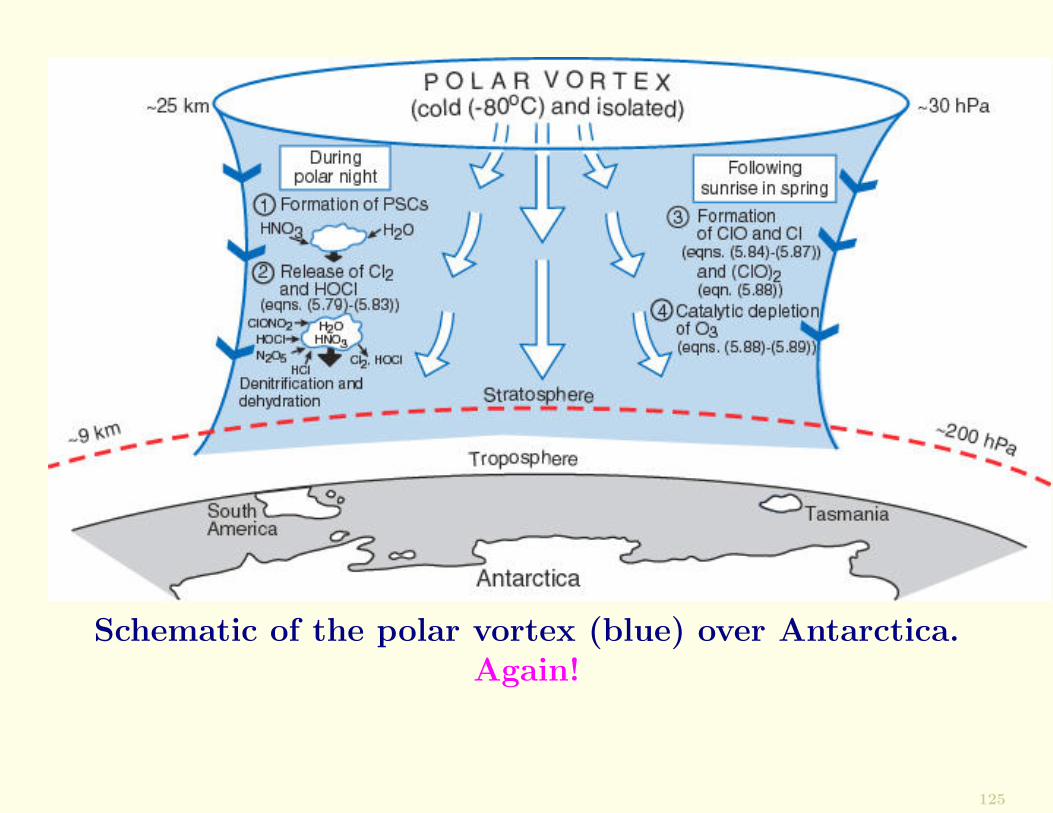
Mechanism of O3 HoleDuring the austral winter (June-September) stratosphericair over the Antarctic continent is restricted from interact-ing with air from lower latitudes by a large-scale vortexcirculation, which is bounded by strongly circulating winds.
Because of the lack of solar heating in the austral winter,the air within the vortex is extremely cold and thereforeslowly sinks.
High-level clouds, called polar stratospheric clouds (PSCs),form in the cold core of the vortex, where temperatures canfall below −80◦C.
In the austral spring, as temperatures rise, the winds aroundthe vortex weaken, and by November the vortex disappears.
119
The vortex serves as a giant and relatively isolated chemicalreactor in which unique chemistry can occur.
For example, although the concentrations of O3 in the vor-tex are normal in August, the concentrations of ClO in thevortex are ten times greater than just outside the vortex col-lar and, by September, O3 concentrations within the vortexdecrease dramatically.
There are also sharp decreases in the oxides of nitrogen andwater vapour when passing from the outside to the insideof the vortex collar.
These decreases are due, respectively, to the formation ofnitric acid (HNO3), and to the condensation of water at thevery low temperatures inside the vortex.
120
Polar Stratospheric CloudsType I PSCs. These probably consist of a mixture of liquid
and solid particles of nitric acid trihydrate [HNO3(H2O)3– NAT for short], water and sulfuric acid, which condenseat about −78◦C. These particles are ∼1 µm in diameter,so they sediment very slowly (∼10 m per day).
Type II PSCs. These consist of a mixture of ice and watertogether with some dissolved HNO3, form near ∼ 85◦C.Since these particles are > 10 µm in diameter, they settleout with appreciable speeds (∼1.5 km per day).
Type III PSCs. These “mother-of-pearl” clouds are producedby the rapid freezing of condensed water in air flow overtopography. However, they are of limited extent and du-ration and do not form over the South Pole.
121

Schematic of the polar vortex (blue) over Antarctica.
122
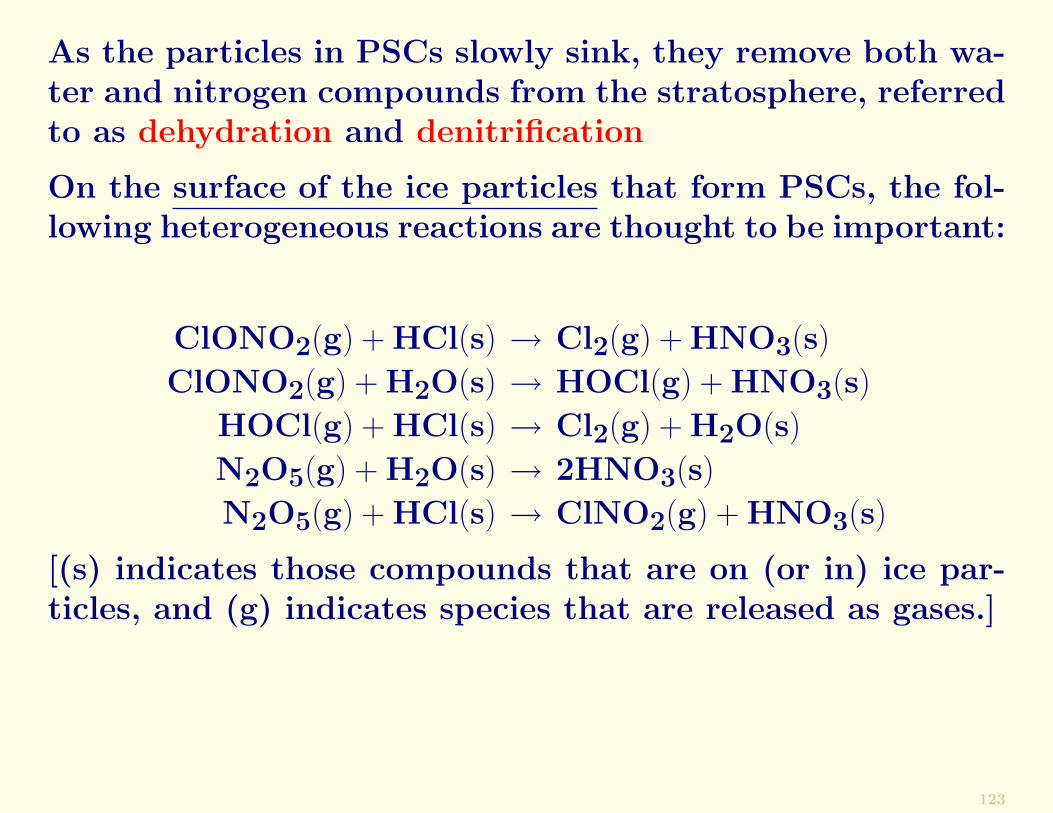
As the particles in PSCs slowly sink, they remove both wa-ter and nitrogen compounds from the stratosphere, referredto as dehydration and denitrification
On the surface of the ice particles that form PSCs, the fol-lowing heterogeneous reactions are thought to be important:
ClONO2(g) + HCl(s) → Cl2(g) + HNO3(s)
ClONO2(g) + H2O(s) → HOCl(g) + HNO3(s)
HOCl(g) + HCl(s) → Cl2(g) + H2O(s)
N2O5(g) + H2O(s) → 2HNO3(s)
N2O5(g) + HCl(s) → ClNO2(g) + HNO3(s)
[(s) indicates those compounds that are on (or in) ice par-ticles, and (g) indicates species that are released as gases.]
123
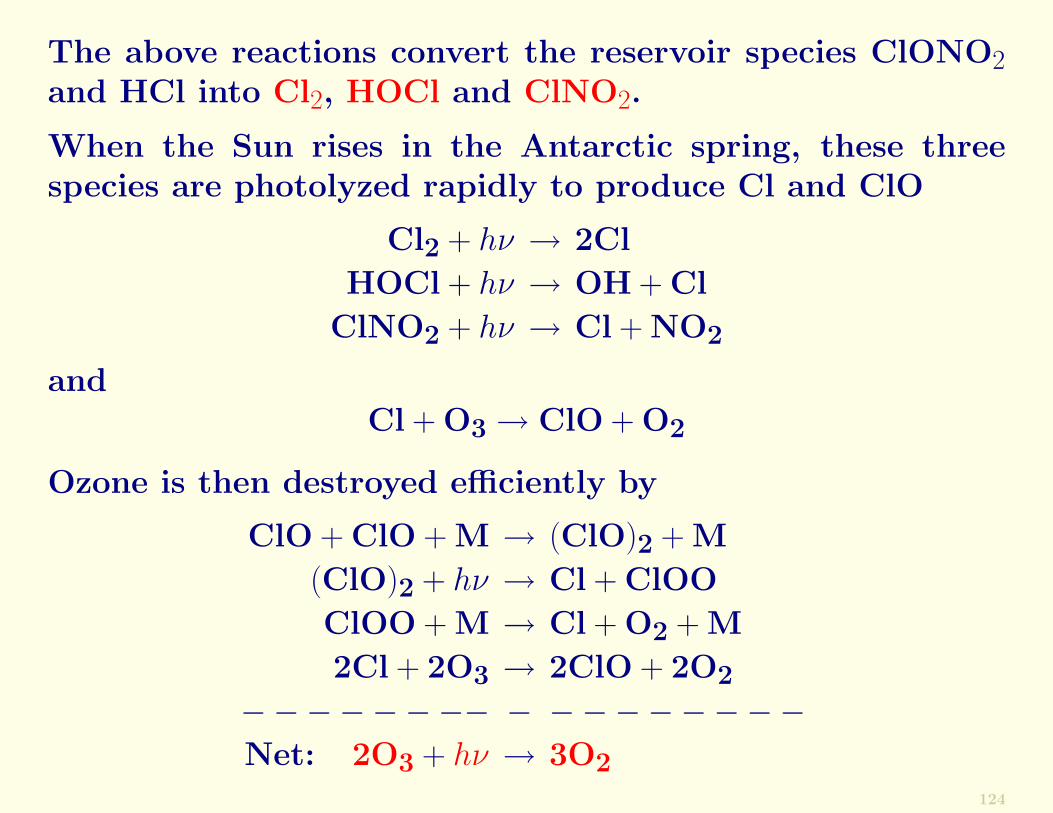
The above reactions convert the reservoir species ClONO2and HCl into Cl2, HOCl and ClNO2.
When the Sun rises in the Antarctic spring, these threespecies are photolyzed rapidly to produce Cl and ClO
Cl2 + hν → 2Cl
HOCl + hν → OH + Cl
ClNO2 + hν → Cl + NO2
andCl + O3 → ClO + O2
Ozone is then destroyed efficiently by
ClO + ClO + M → (ClO)2 + M
(ClO)2 + hν → Cl + ClOO
ClOO + M → Cl + O2 + M
2Cl + 2O3 → 2ClO + 2O2
−−−−−−−− − −−−−−−−−Net: 2O3 + hν → 3O2
124
Schematic of the polar vortex (blue) over Antarctica.Again!
125
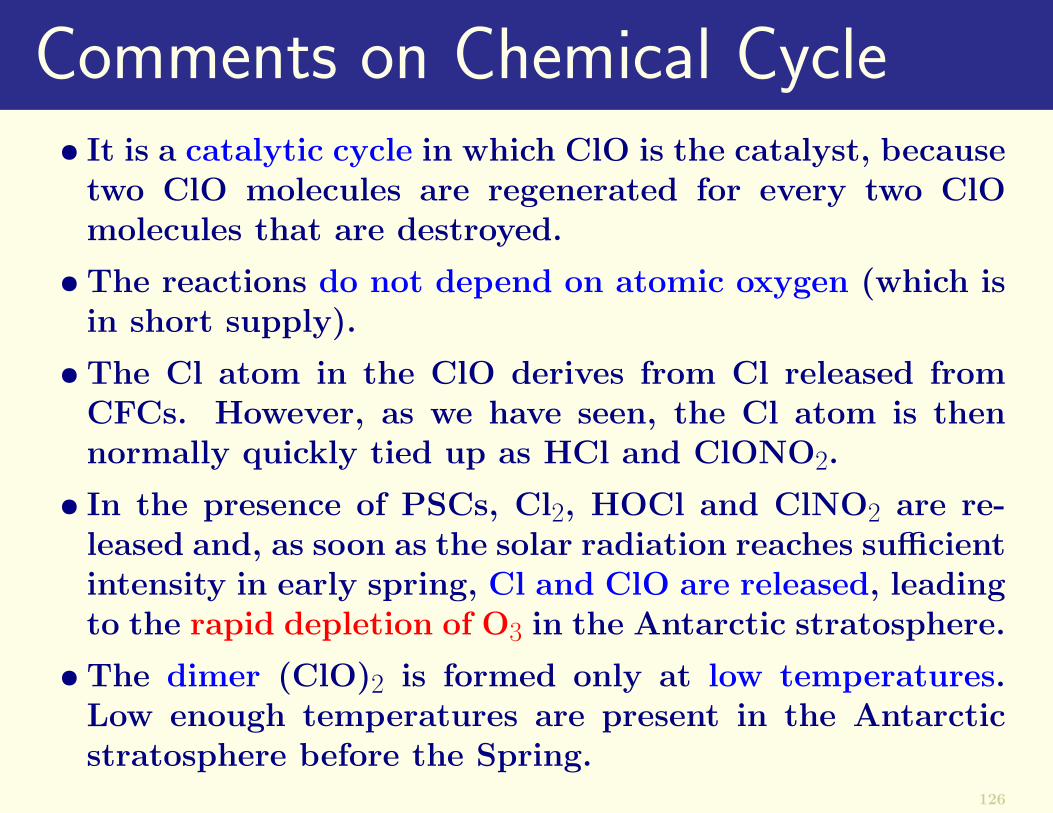
Comments on Chemical Cycle• It is a catalytic cycle in which ClO is the catalyst, because
two ClO molecules are regenerated for every two ClOmolecules that are destroyed.
• The reactions do not depend on atomic oxygen (which isin short supply).
• The Cl atom in the ClO derives from Cl released fromCFCs. However, as we have seen, the Cl atom is thennormally quickly tied up as HCl and ClONO2.
• In the presence of PSCs, Cl2, HOCl and ClNO2 are re-leased and, as soon as the solar radiation reaches sufficientintensity in early spring, Cl and ClO are released, leadingto the rapid depletion of O3 in the Antarctic stratosphere.
• The dimer (ClO)2 is formed only at low temperatures.Low enough temperatures are present in the Antarcticstratosphere before the Spring.
126
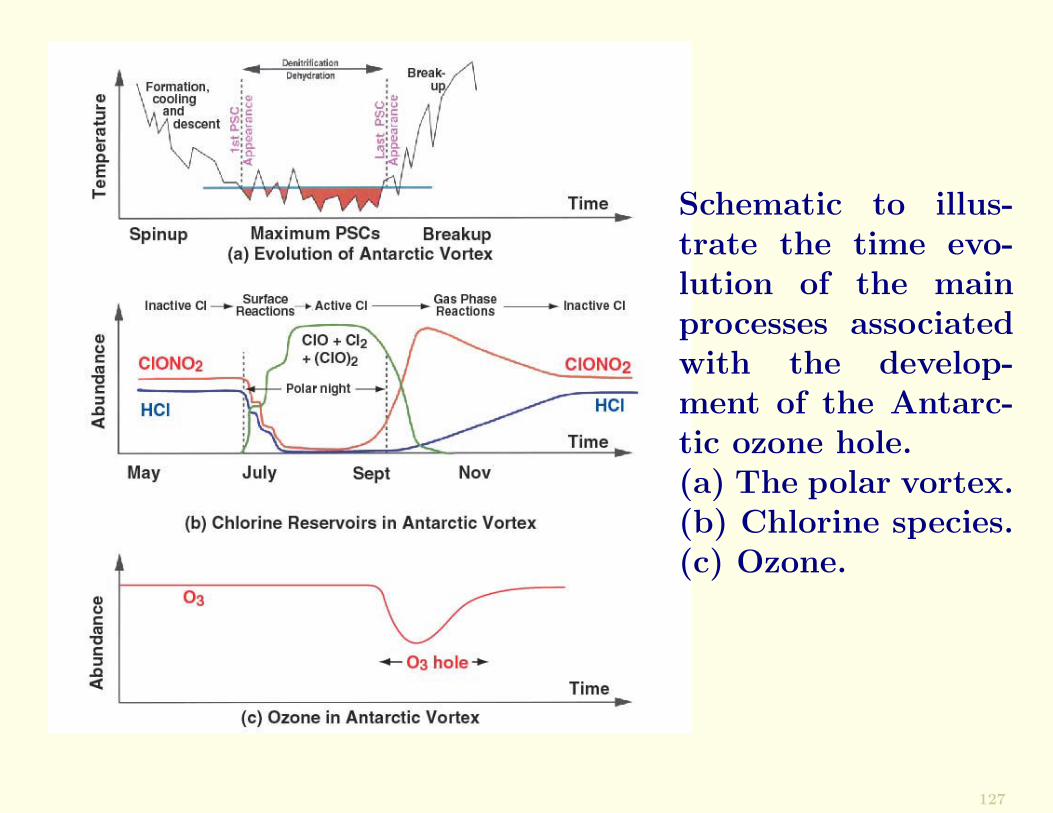
Schematic to illus-trate the time evo-lution of the mainprocesses associatedwith the develop-ment of the Antarc-tic ozone hole.(a) The polar vortex.(b) Chlorine species.(c) Ozone.
127
Spring of 2002The sharp decrease in the area covered by the Antarcticozone hole in 2002, and the decrease in the severity of thehole in that year is due to a series of unusual stratosphericwarmings that occurred during the winter in the southernhemisphere in 2002.
This warmed the polar vortex collar region, which cut offthe formation of PSCs, and turned off O3 loss in September2002, and transported O3-rich air over Antarctica.
In 2003, which was a cold year, the ozone hole returned toits earlier extent of ∼25 million square kilometers.
128
What about the Arctic?Does an ozone hole, similar to that in the Antarctic, developin the Arctic stratosphere during winter in the northernhemisphere?
Although a vortex can develop over the Arctic in the north-ern winter, it is generally not as well developed as theAntarctic vortex.
Also, temperatures in the Arctic stratosphere are not as lowas those in the Antarctic stratosphere.
Although the conditions that produce severe loss of ozonein the Antarctic are not as common in the Arctic, the to-tal ozone column in the Arctic spring has, on average, de-creased over the past two decades.
However, prior to the winter of 1995–96 there was not astratospheric ozone hole in the Arctic comparable to thatin the Antarctic.
129
During the northern winter of 1996–97, the longest lastingpolar vortex on record developed over the Arctic, and inMarch 1997 the average ozone column over the Arctic (354DU) was the lowest in 20 prior years of observations.
During 1998 a major stratospheric warming event erodedthe polar vortex, raised temperatures above that requiredfor the formation of PSCs, and transported ozone into thelower Arctic stratosphere. Consequently, in March 1998the ozone column over the Arctic returned to its pre-1990svalue.
In the winter of 1999–2000 the average total ozone columnin March poleward of 63◦N was lower by ∼75 DU than theaverage climatological value, and these low values continuedthrough 2003.
130
It appears therefore that while concentrations of CFCs re-main high in the atmosphere, the Arctic stratosphere hasthe potential to cause the same dramatic losses in O3 as theAntarctic stratosphere.
However, the combination of chemical and meteorologicalconditions that lead to such reductions are not as commonin the Arctic as they are in the Antarctic.
Global mean total column ozone for the period 1997–2001was ∼3% below the 1964–1980 average value.
No trends in total column ozone were observed in the tropics(25◦N–25◦S) during the period 1980–2000.
131
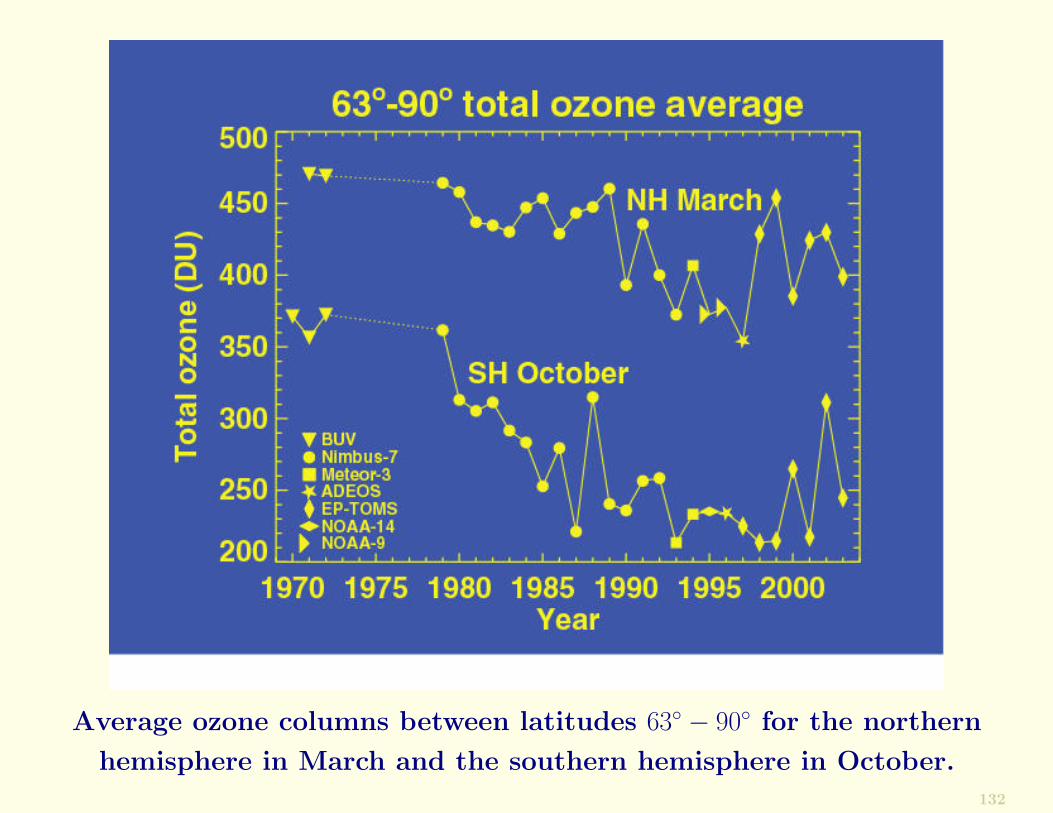
Average ozone columns between latitudes 63◦ − 90◦ for the northern
hemisphere in March and the southern hemisphere in October.
132
The International ResponseConcerns about the health and environmental hazards ofincreased UV radiation at the Earth’s surface led to inter-national agreements to eliminate the production and use ofcompounds known to deplete stratospheric O3 by the year2000.
Consequently, CFCs in the lower atmosphere are no longerincreasing. An analysis (in 2003) of 20 years of satellitedata showed a slowing in the reduction of O3 at an altitudeof ∼33 km starting in 1997, and simultaneous slowing in thebuildup of harmful Cl.
However, due to the long lifetimes of CFCs, the concentra-tions of Cl in the stratosphere are expected to continue torise for some time.
Therefore, it is predicted that the O3 layer will not com-pletely recover until about the middle of the 21st century.
133
The Montreal ProtocolThe Montreal Protocol on Substances that Deplete the OzoneLayer was a landmark international agreement originallysigned in 1987, with substantial subsequent amendments.
Since it takes several decades for all of the air in the tro-posphere to cycle through the upper stratosphere, whereCFCs are broken down, it will take a similar period of timeto remove all of the CFCs from the atmosphere from thetime their production is brought completely to a halt.
The Copenhagen Amendment (1992) called for the com-plete elimination of CFCs by 1996, and the Vienna Amend-ment (1995) called for the complete elimination of HCFCsby 2020.
134
An Interesting Historical Review
For an interesting review of the emergence of evidence onthe ozone hole in the Antarctic, see the article:
Data Collection and the Ozone Hole:Too much of a Good Thing?
Maureen Christie, Proc. ICHM, 1.1 (2004).On course website.
135