MS Proteomics Toolbox - Baylor College of Medicine · MS Proteomics Toolbox: Multiproteomic...
44
MS Proteomics Toolbox: Multiproteomic Approaches to Decipher Cellular Signaling Anna Malovannaya Mass Spectrometry Proteomics Core Baylor College of Medicine, Houston, TX April 18, 2017
Transcript of MS Proteomics Toolbox - Baylor College of Medicine · MS Proteomics Toolbox: Multiproteomic...
MS Proteomics Toolbox:
Multiproteomic Approachesto Decipher Cellular Signaling
Anna Malovannaya
Mass Spectrometry Proteomics CoreBaylor College of Medicine, Houston, TX
April 18, 2017
Mas
s Sp
ectro
met
ryPh
ysic
al C
hem
istry
Inst
rum
enta
tion
Info
rmat
ics
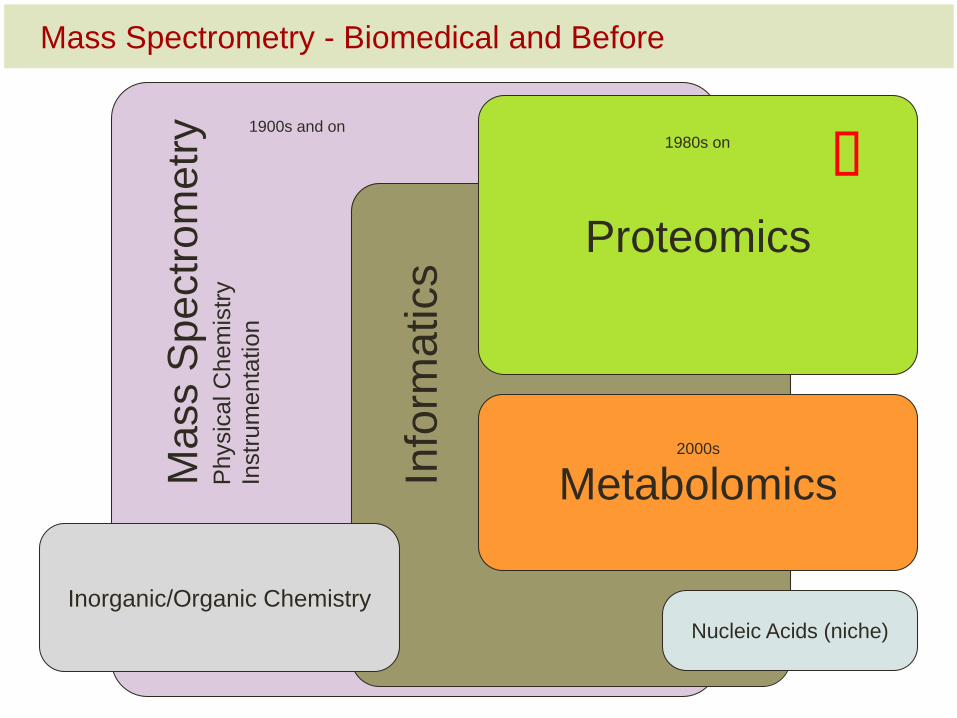
Mass Spectrometry - Biomedical and Before
Proteomics
Metabolomics
Nucleic Acids (niche)
1900s and on1980s on
2000s
Inorganic/Organic Chemistry
�
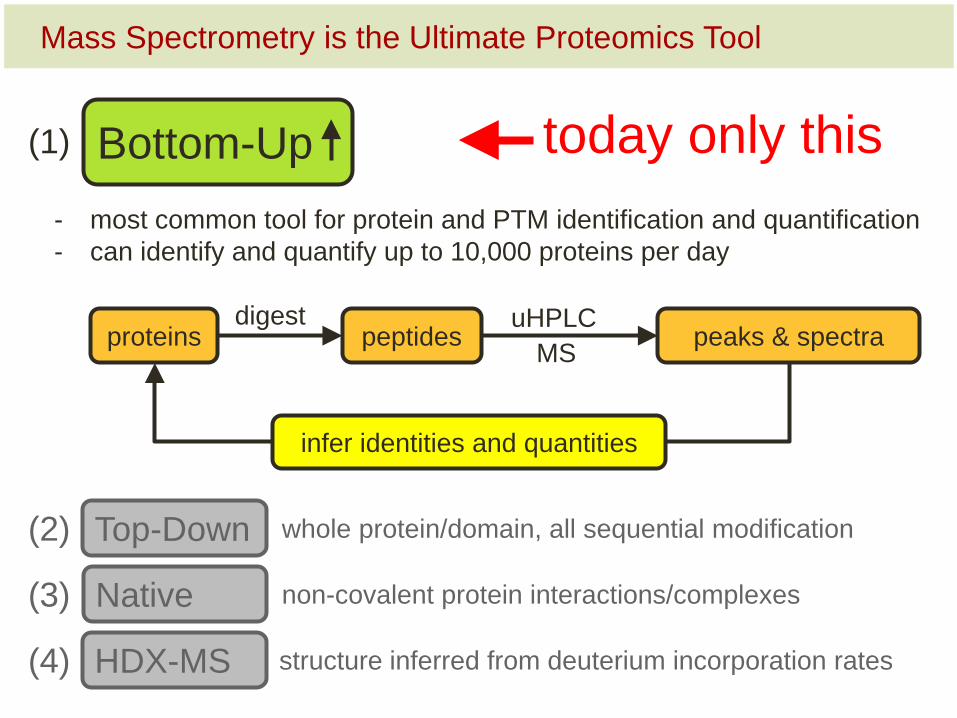
Mass Spectrometry is the Ultimate Proteomics Tool
- most common tool for protein and PTM identification and quantification- can identify and quantify up to 10,000 proteins per day
Bottom-Up
proteins peptides peaks & spectradigest uHPLC
MS
(1)
Top-Down whole protein/domain, all sequential modification(2)
Native non-covalent protein interactions/complexes(3)
HDX-MS structure inferred from deuterium incorporation rates(4)
infer identities and quantities
today only this
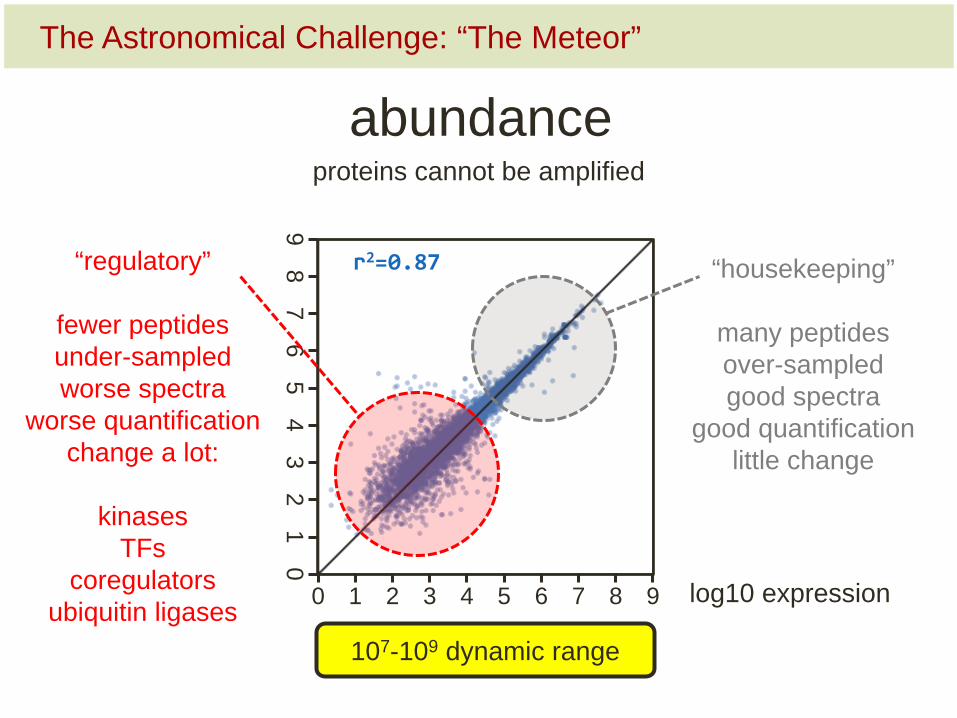
The Astronomical Challenge: “The Meteor”
abundanceproteins cannot be amplified
r2=0.87
0 1 2 3 4 5 6 7 8 9
01
23
45
67
89
log10 expression
“housekeeping”
many peptidesover-sampledgood spectra
good quantificationlittle change
107-109 dynamic range
“regulatory”
fewer peptidesunder-sampledworse spectra
worse quantificationchange a lot:
kinasesTFs
coregulatorsubiquitin ligases
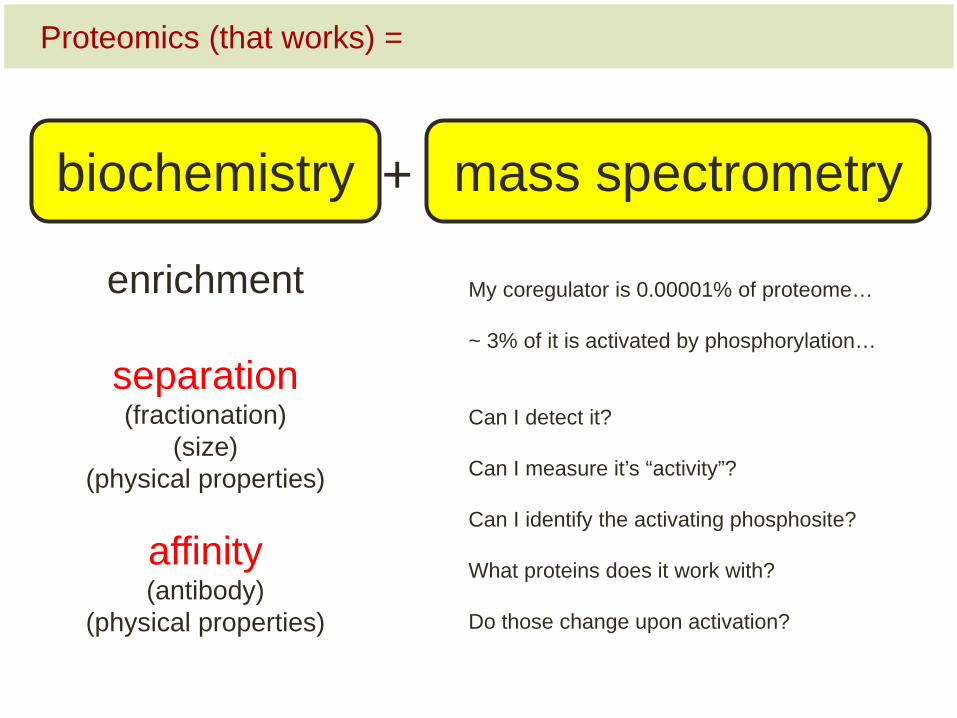
Proteomics (that works) =
My coregulator is 0.00001% of proteome…
~ 3% of it is activated by phosphorylation…
Can I detect it?
Can I measure it’s “activity”?
Can I identify the activating phosphosite?
What proteins does it work with?
Do those change upon activation?
mass spectrometry
enrichment
separation(fractionation)
(size)(physical properties)
affinity(antibody)
(physical properties)
+ biochemistry

Applications of Bottom-Up Proteomics in Biology
(1) Proteomic Profiling: “protein-seq”up to 10,000 proteins per day6,500-7,500 proteins in ½ day from ~5µg of tissue
(2) Post-Translational Modification (PTM) Profiling:targeting a class of PTMs, e.g. phospho-profiling10,000-20,000 sites per experiment
(3) Broad Affinities:targeting a whole class of interesting proteins300 DNA-bound transcription factors per sample300 inhibitor-bound kinases per sample
(4) Protein Interactions (AP/MS):targeting a specific protein
none
a lot
spec
ific
affin
ity /
enric
hmen
tcore SOP
core SOP
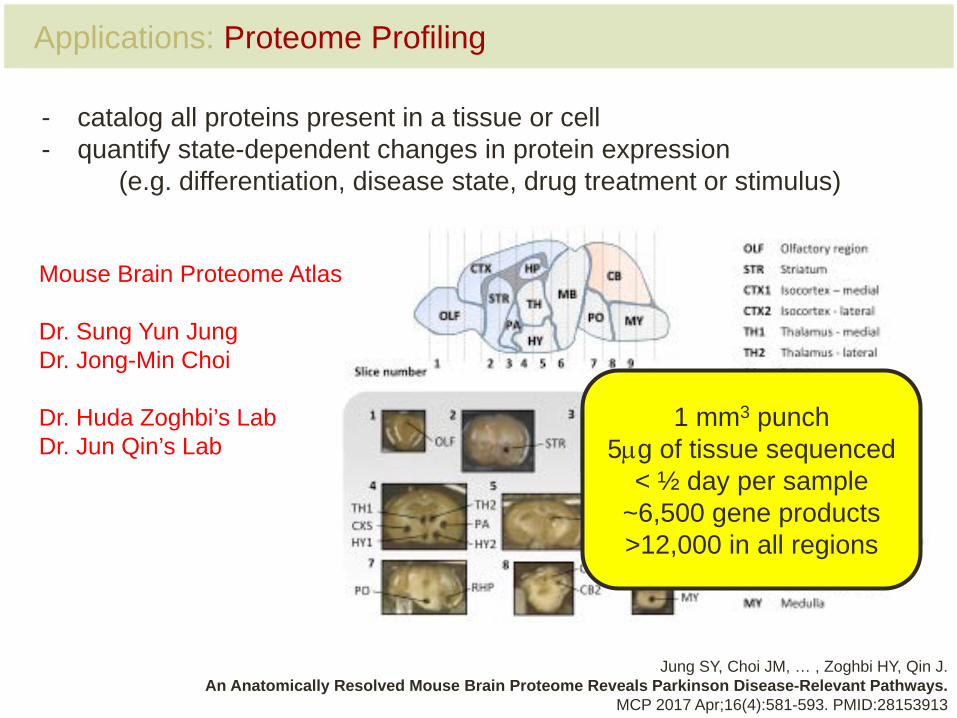
Applications: Proteome Profiling
- catalog all proteins present in a tissue or cell- quantify state-dependent changes in protein expression
(e.g. differentiation, disease state, drug treatment or stimulus)
Mouse Brain Proteome Atlas
Dr. Sung Yun JungDr. Jong-Min Choi
Dr. Huda Zoghbi’s LabDr. Jun Qin’s Lab
Jung SY, Choi JM, … , Zoghbi HY, Qin J. An Anatomically Resolved Mouse Brain Proteome Reveals Parkinson Disease-Relevant Pathways.
MCP 2017 Apr;16(4):581-593. PMID:28153913
1 mm3 punch5µg of tissue sequenced
< ½ day per sample~6,500 gene products>12,000 in all regions
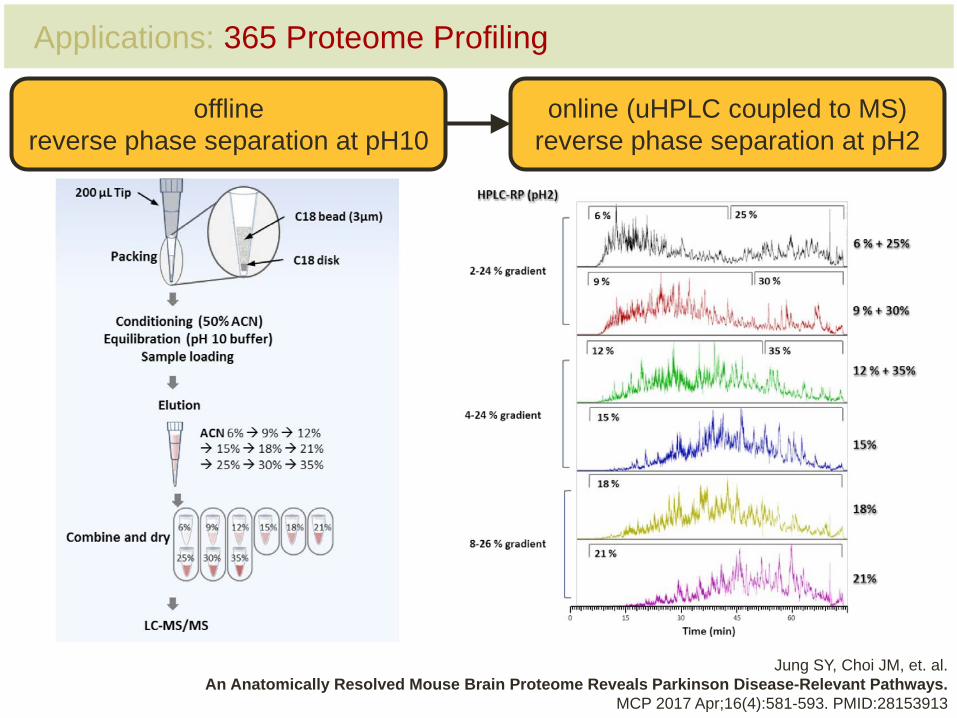
Applications: 365 Proteome Profiling
Jung SY, Choi JM, et. al. An Anatomically Resolved Mouse Brain Proteome Reveals Parkinson Disease-Relevant Pathways.
MCP 2017 Apr;16(4):581-593. PMID:28153913
offlinereverse phase separation at pH10
online (uHPLC coupled to MS)reverse phase separation at pH2
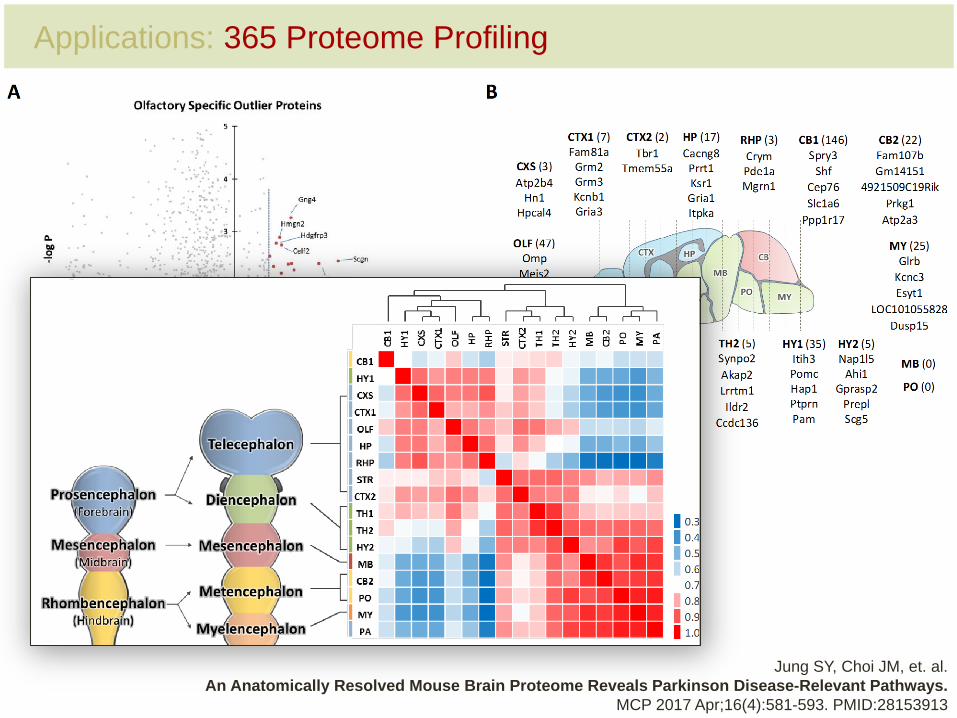
Applications: 365 Proteome Profiling
Jung SY, Choi JM, et. al. An Anatomically Resolved Mouse Brain Proteome Reveals Parkinson Disease-Relevant Pathways.
MCP 2017 Apr;16(4):581-593. PMID:28153913
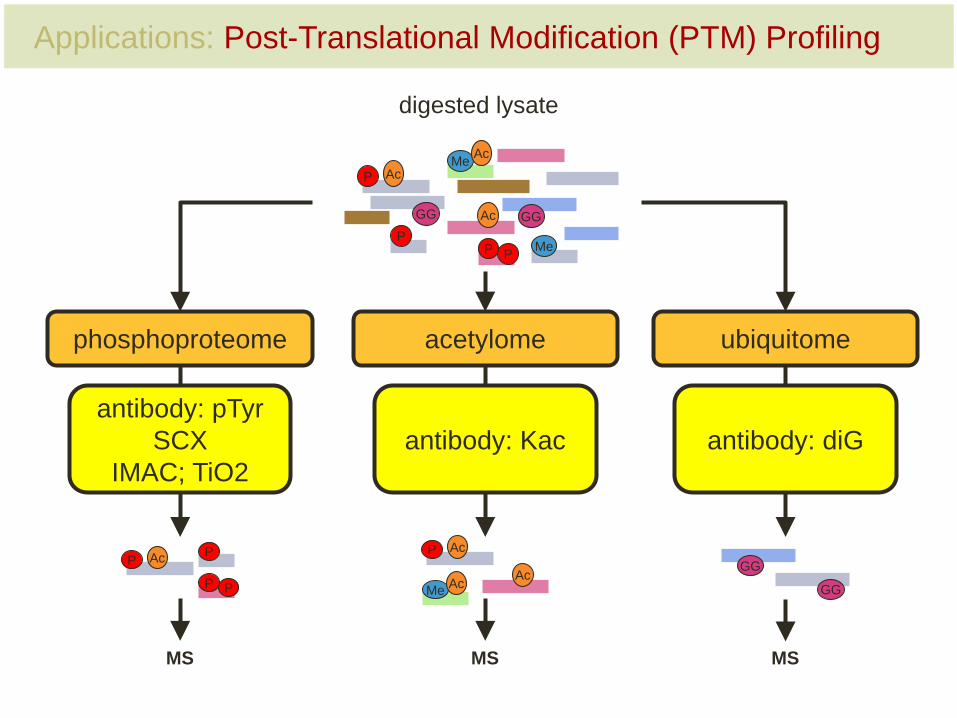
Applications: Post-Translational Modification (PTM) Profiling
digested lysate
GG
P Ac
MeP
GG
P
Ac
Me
P
Ac
MS
P Ac P
PP
phosphoproteome
antibody: pTyrSCX
IMAC; TiO2
AcMe Ac
P Ac
acetylome
antibody: Kac
MS
GG
GG
ubiquitome
antibody: diG
MS
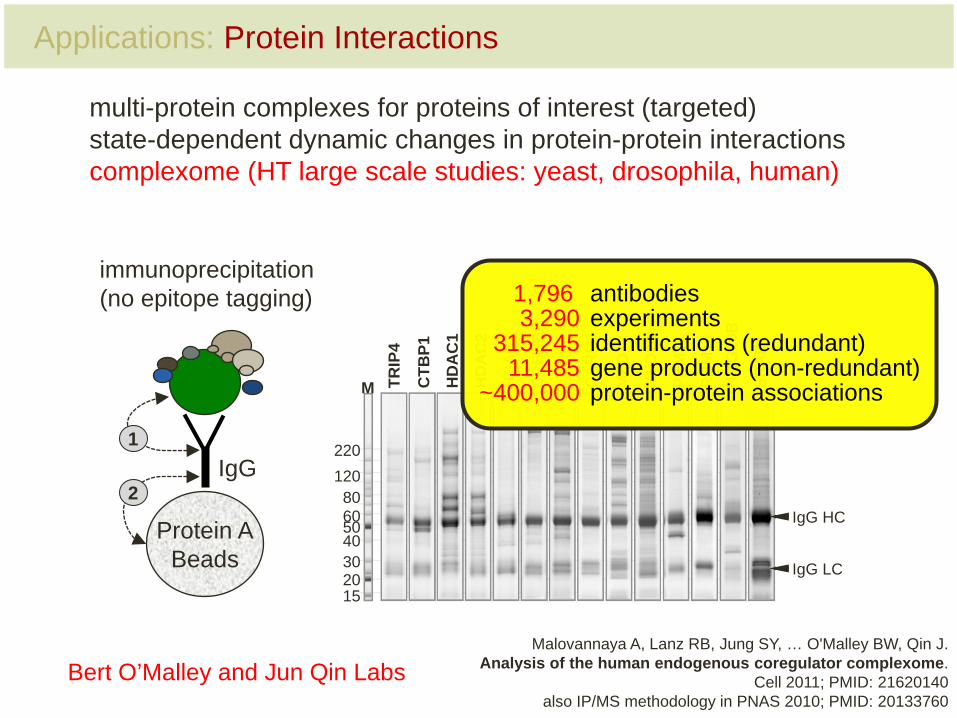
Applications: Protein Interactions
multi-protein complexes for proteins of interest (targeted)state-dependent dynamic changes in protein-protein interactionscomplexome (HT large scale studies: yeast, drosophila, human)
immunoprecipitation(no epitope tagging)
IgG
Protein ABeads
2
1
CA
RM
1
HM
G20
B
IgG HC
IgG LC
22012080605040302015
M TRIP
4
CTB
P1H
DA
C1
HD
AC
2H
DA
C3
CR
EBB
PEP
300
MED
12M
ED28
PRM
T1R
BM
14
SRA
P1
Malovannaya A, Lanz RB, Jung SY, … O'Malley BW, Qin J.Analysis of the human endogenous coregulator complexome.
Cell 2011; PMID: 21620140also IP/MS methodology in PNAS 2010; PMID: 20133760
Bert O’Malley and Jun Qin Labs
antibodies1,796 experiments3,290identifications (redundant)315,245gene products (non-redundant)11,485protein-protein associations~400,000
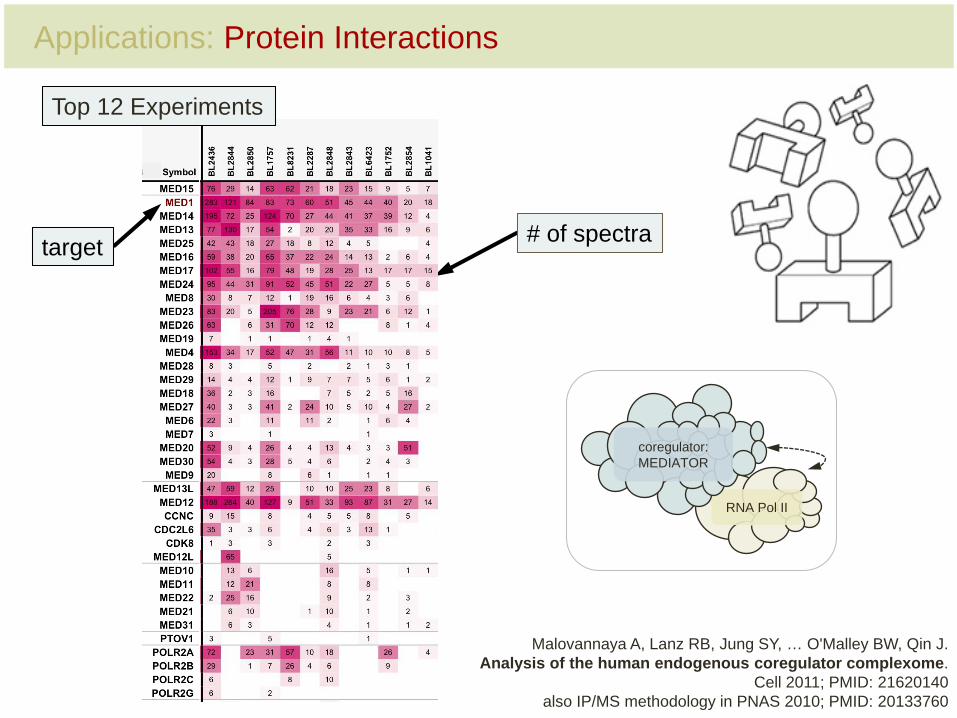
# of spectratarget
Top 12 Experiments
POLR2BPOLR2A
POLR2GPOLR2J
2L2D
2ERNA Pol II
coregulator:MEDIATOR
Malovannaya A, Lanz RB, Jung SY, … O'Malley BW, Qin J.Analysis of the human endogenous coregulator complexome.
Cell 2011; PMID: 21620140also IP/MS methodology in PNAS 2010; PMID: 20133760
Applications: Protein Interactions

what’s the magic?
Basic Principle:
MS measures ionsmasses and charges
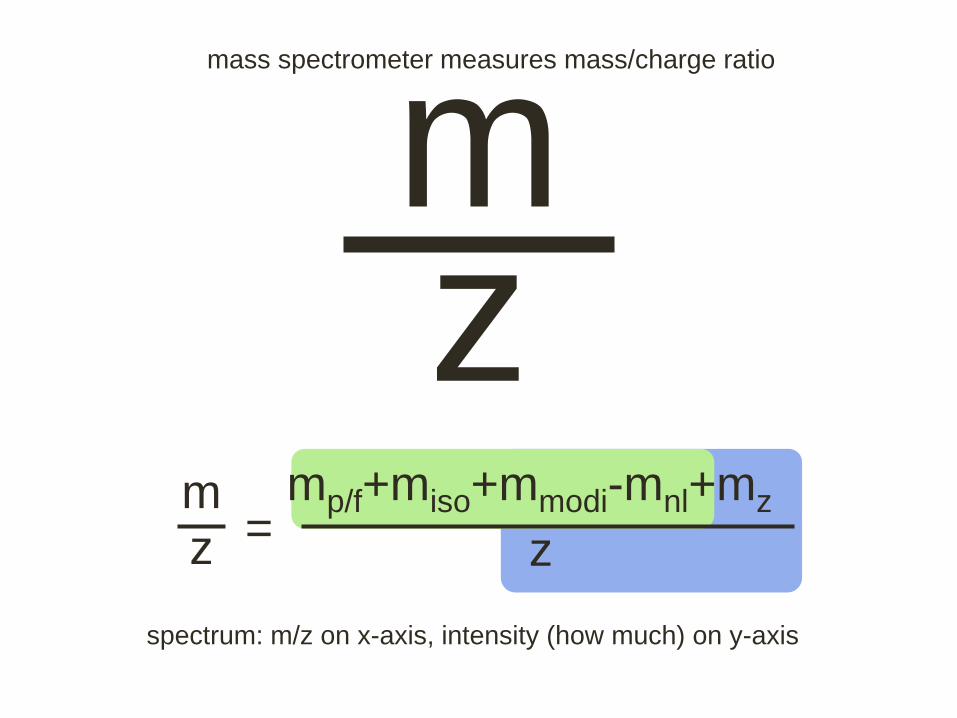
mz
mass spectrometer measures mass/charge ratio
spectrum: m/z on x-axis, intensity (how much) on y-axis
mp/f+miso+mmodi-mnl+mzzm
z=
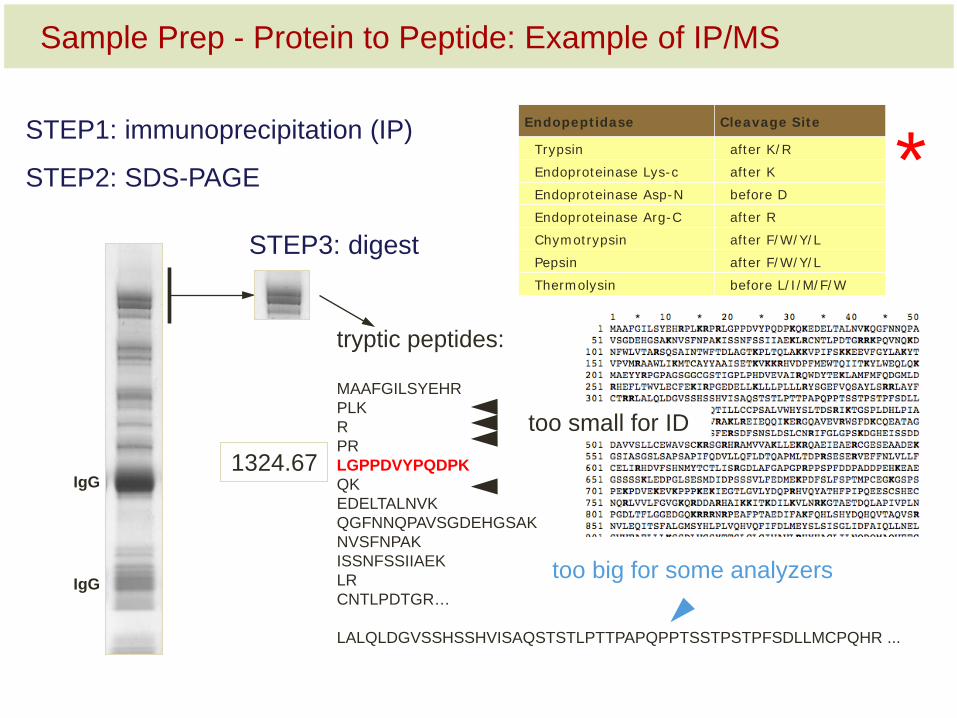
Sample Prep - Protein to Peptide: Example of IP/MS
IgG
IgG
STEP1: immunoprecipitation (IP)
STEP2: SDS-PAGE
STEP3: digest
Endopeptidase Cleavage Site
Trypsin after K/R
Endoproteinase Lys-c after K
Endoproteinase Asp-N before D
Endoproteinase Arg-C after R
Chymotrypsin after F/W/Y/L
Pepsin after F/W/Y/L
Thermolysin before L/I/M/F/W
*
MAAFGILSYEHR PLK R PR LGPPDVYPQDPKQK EDELTALNVK QGFNNQPAVSGDEHGSAK NVSFNPAK ISSNFSSIIAEK LR CNTLPDTGR…
LALQLDGVSSHSSHVISAQSTSTLPTTPAPQPPTSSTPSTPFSDLLMCPQHR ...
tryptic peptides:
too small for ID
too big for some analyzers
1324.67
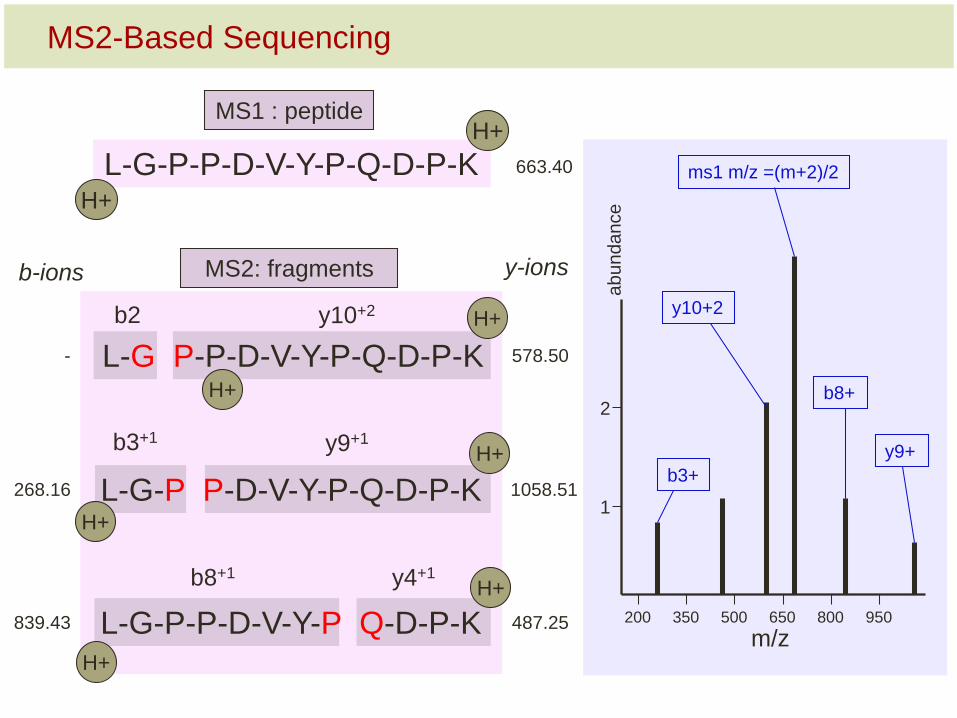
L-G-P-P-D-V-Y-P-Q-D-P-KH+
H+
b-ions y-ionsMS2: fragments
MS2-Based Sequencing
m/z200 350 500 650 800 950
1
2
abun
danc
e
b3+
b8+
y9+
y10+2
ms1 m/z =(m+2)/2663.40
MS1 : peptide
- 578.50L-G P-P-D-V-Y-P-Q-D-P-K H+
H+b2 y10+2
268.16 1058.51L-G-P P-D-V-Y-P-Q-D-P-KH+
H+b3+1 y9+1
839.43 487.25L-G-P-P-D-V-Y-P Q-D-P-KH+
H+b8+1 y4+1
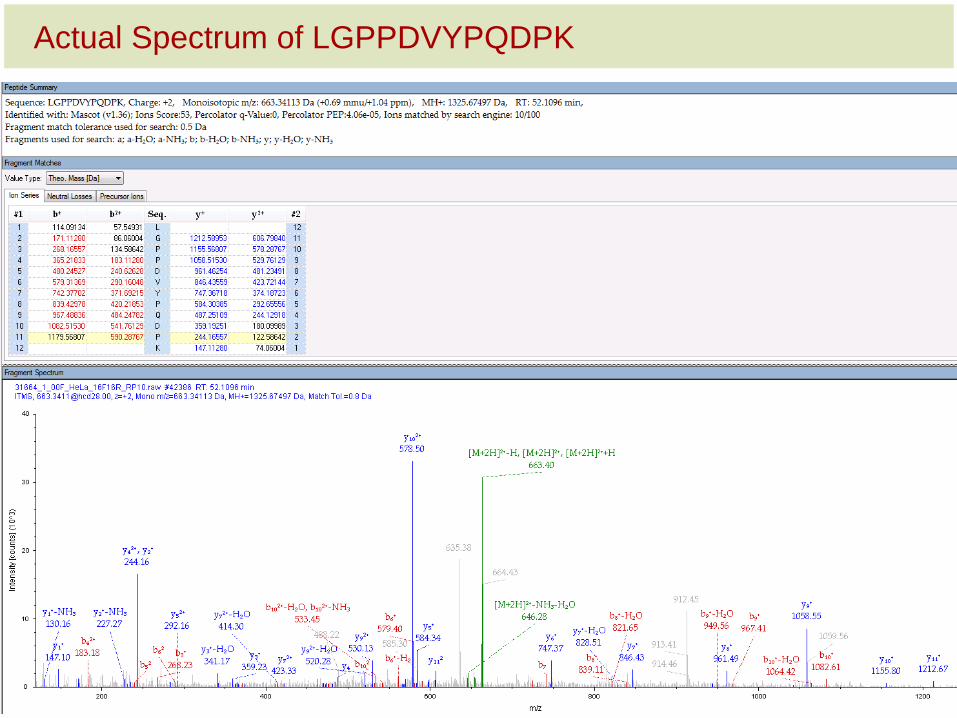
Actual Spectrum of LGPPDVYPQDPK
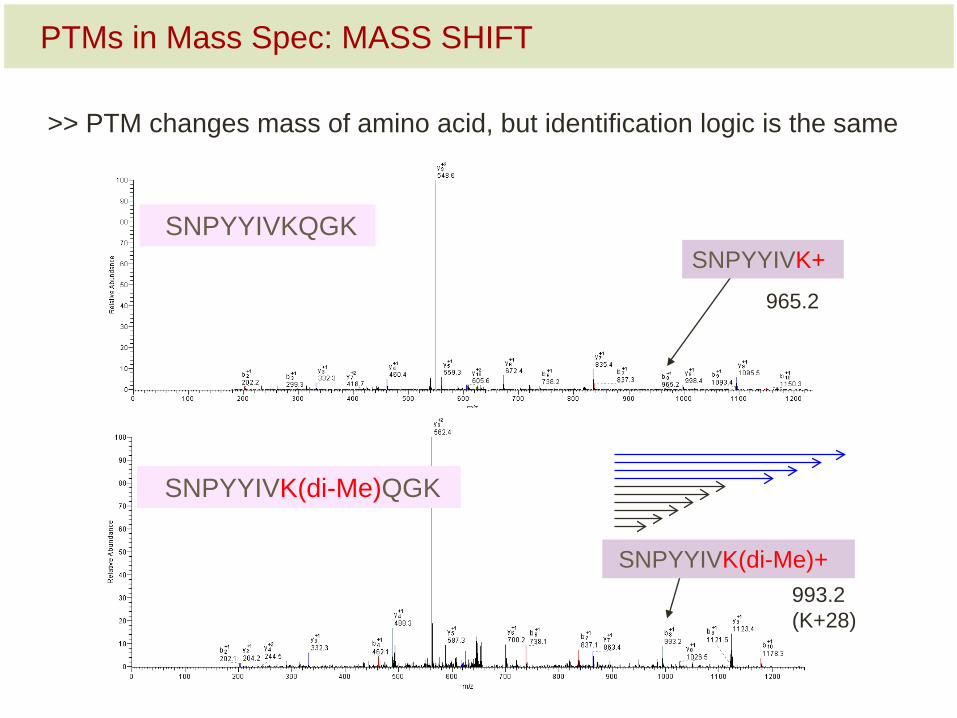
PTMs in Mass Spec: MASS SHIFT
>> PTM changes mass of amino acid, but identification logic is the same
965.2
993.2(K+28)
SNPYYIVKQGK
SNPYYIVK(di-Me)QGK
SNPYYIVK(di-Me)+
SNPYYIVK+

Peptide Peaks?
Quantification
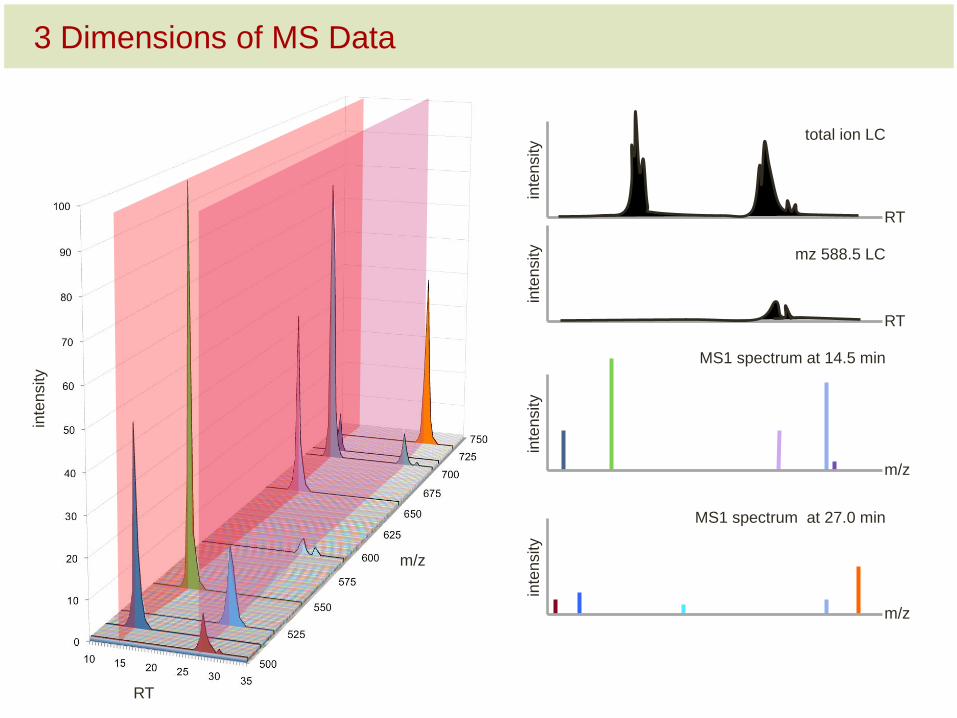
3 Dimensions of MS Data
m/z
RT
inte
nsity
RT
RT
inte
nsity
inte
nsity
total ion LC
mz 588.5 LC
m/z
inte
nsity
MS1 spectrum at 14.5 min
m/z
inte
nsity
MS1 spectrum at 27.0 min
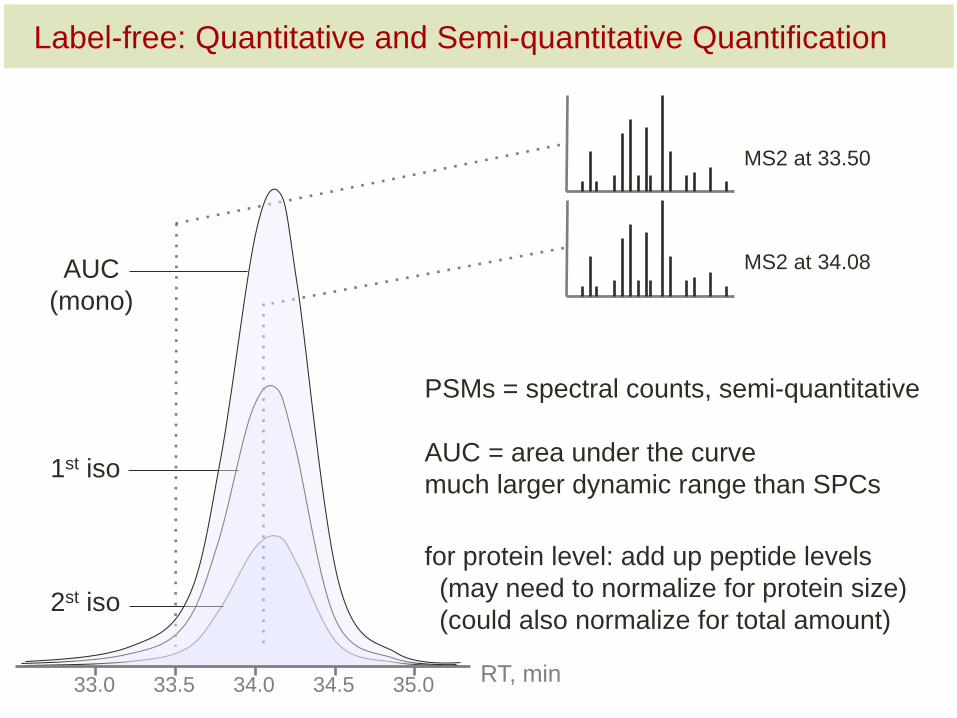
Label-free: Quantitative and Semi-quantitative Quantification
AUC = area under the curvemuch larger dynamic range than SPCs
RT, min33.0 33.5 34.0 34.5 35.0
MS2 at 33.50
MS2 at 34.08
PSMs = spectral counts, semi-quantitative
for protein level: add up peptide levels(may need to normalize for protein size)(could also normalize for total amount)
AUC(mono)
1st iso
2st iso
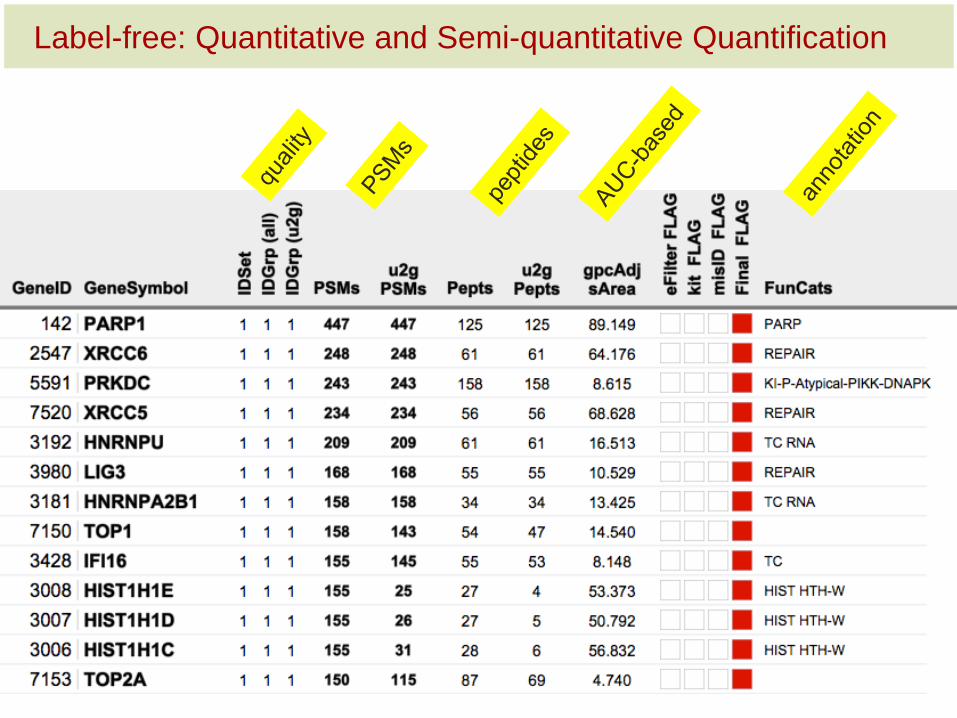
Label-free: Quantitative and Semi-quantitative Quantification
Scientific Example:
Differential Interactomesof Estrogen Receptor Mutants
Leah Gates, Charles Foulds (also for slides)
Bert O’Malley LabJun Qin Lab
Proteomics Core
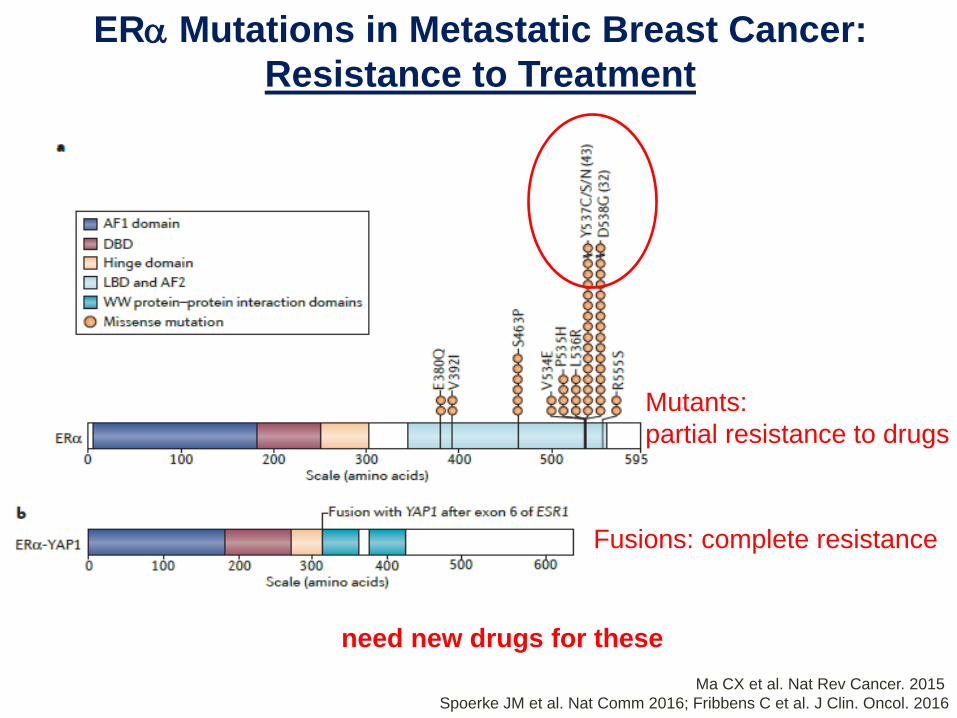
ERα Mutations in Metastatic Breast Cancer: Resistance to Treatment
Fusions: complete resistance
Ma CX et al. Nat Rev Cancer. 2015 Spoerke JM et al. Nat Comm 2016; Fribbens C et al. J Clin. Oncol. 2016
Mutants:partial resistance to drugs
need new drugs for these
Rel
ativ
e Li
ght U
nits
(RLU
)
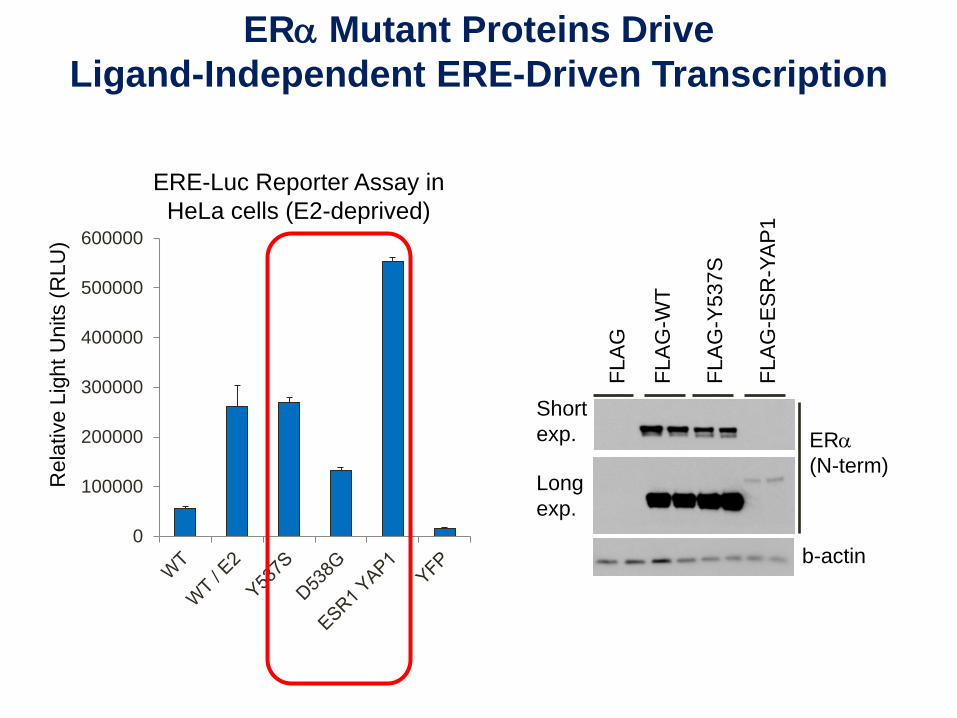
ERE-Luc Reporter Assay in HeLa cells (E2-deprived)
0
100000
200000
300000
400000
500000
600000
ERα Mutant Proteins Drive Ligand-Independent ERE-Driven Transcription
ERα(N-term)
FLAG
FLAG
-WT
FLAG
-Y53
7S
FLAG
-ESR
-YAP
1
b-actin
Short exp.
Long exp.
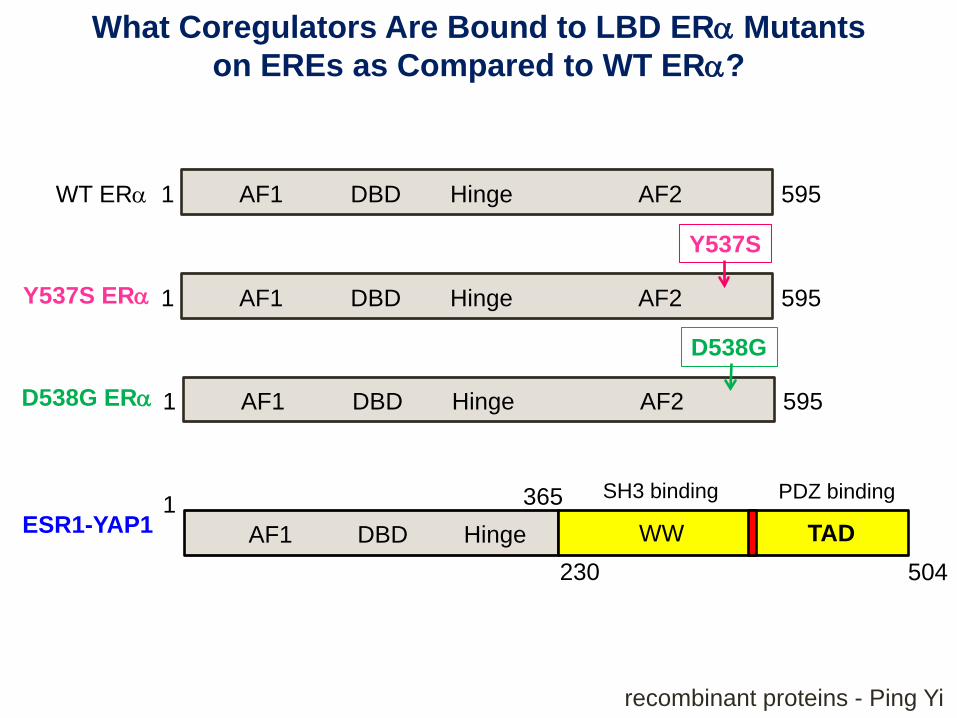
WT ERα 1 595AF1 DBD Hinge AF2
Y537S ERα 1 595AF1 DBD Hinge AF2
Y537S
D538G ERα 1 595AF1 DBD Hinge AF2
D538G
What Coregulators Are Bound to LBD ERα Mutantson EREs as Compared to WT ERα?
3651
504AF1 DBD Hinge WW TAD
230
PDZ bindingSH3 bindingESR1-YAP1
recombinant proteins - Ping Yi
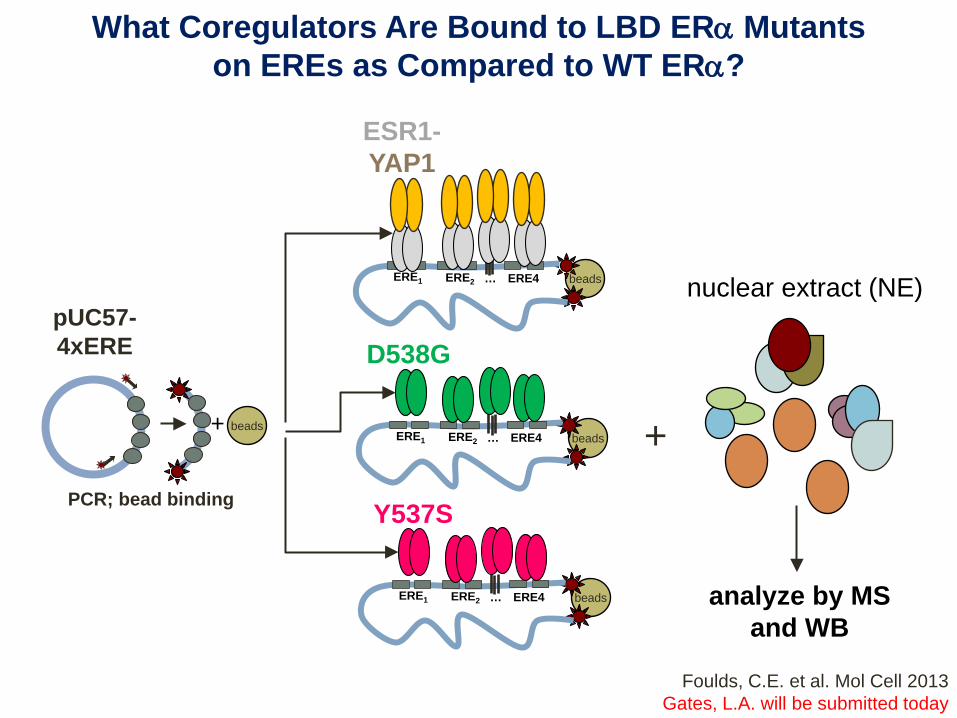
What Coregulators Are Bound to LBD ERα Mutantson EREs as Compared to WT ERα?
beads
PCR; bead binding
+
pUC57-4xERE
beadsERE1 ERE2 ERE4…
Y537S
beadsERE1 ERE2 ERE4…
beadsERE1 ERE2 ERE4…
D538G
ESR1-YAP1
+
analyze by MSand WB
nuclear extract (NE)
Foulds, C.E. et al. Mol Cell 2013Gates, L.A. will be submitted today
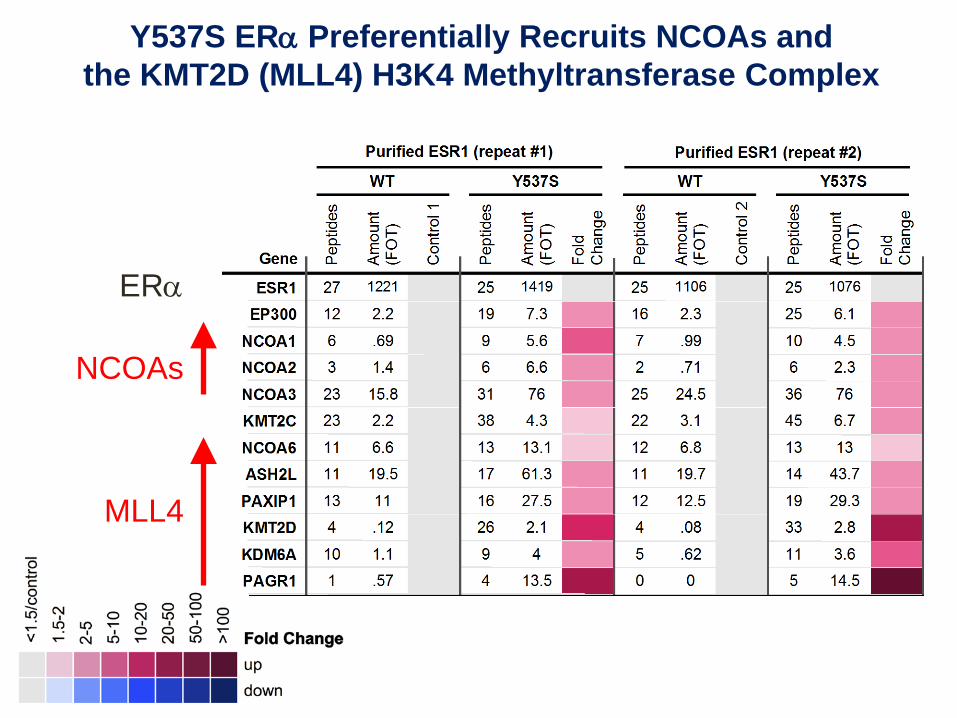
Y537S ERα Preferentially Recruits NCOAs andthe KMT2D (MLL4) H3K4 Methyltransferase Complex
ERα
NCOAs
MLL4
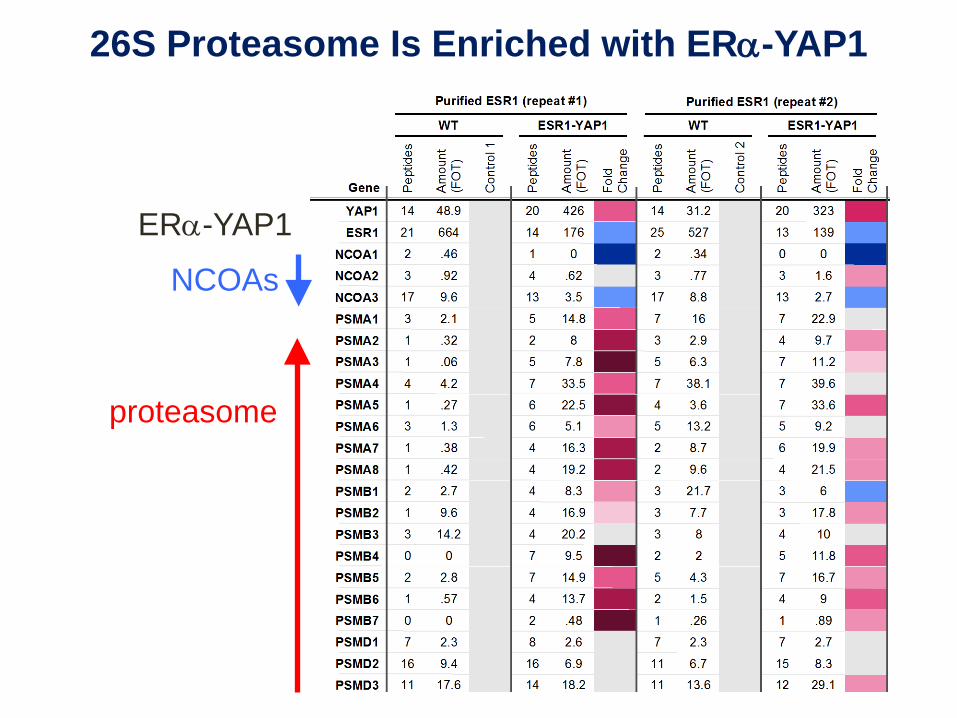
26S Proteasome Is Enriched with ERα-YAP1
ERα-YAP1
NCOAs
proteasome
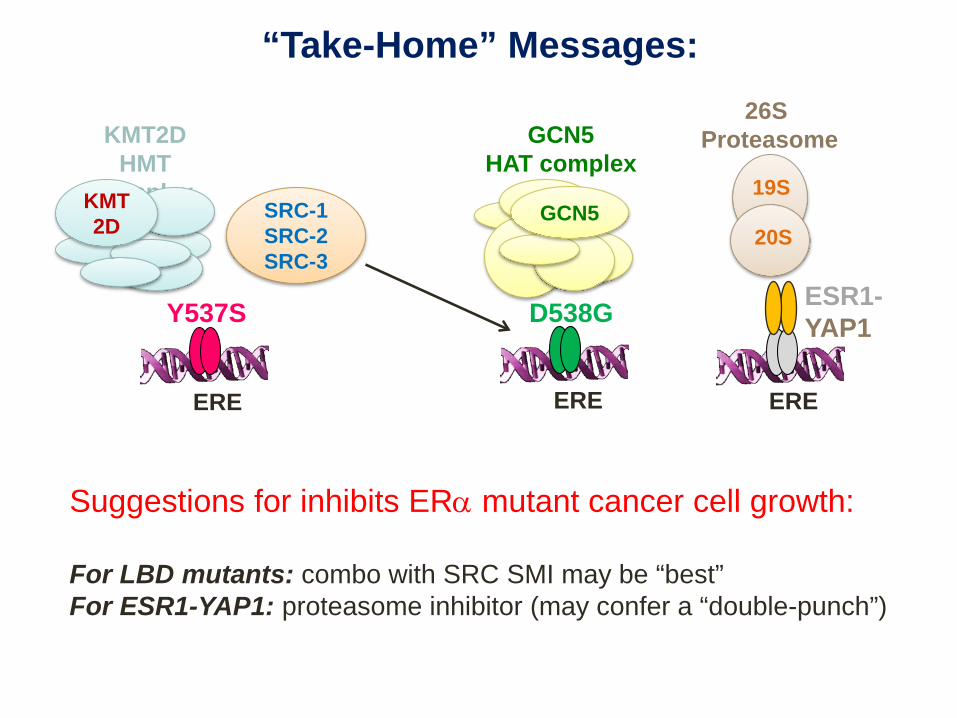
“Take-Home” Messages:
Suggestions for inhibits ERα mutant cancer cell growth:
For LBD mutants: combo with SRC SMI may be “best”For ESR1-YAP1: proteasome inhibitor (may confer a “double-punch”)
ERE
Y537S D538G
ERE ERE
ESR1-YAP1
KMT2D HMT
complexKMT2D
GCN5HAT complex
GCN5
26S Proteasome
20S
19SSRC-1SRC-2 SRC-3
Multiproteomics with Broad Affinities:
Systems Biology of Pathway Discovery
Mei Leng, Alex Saltzman, Bhoomi BhattMalovannaya Lab
Andrew Rice Lab (HIV collaborators)
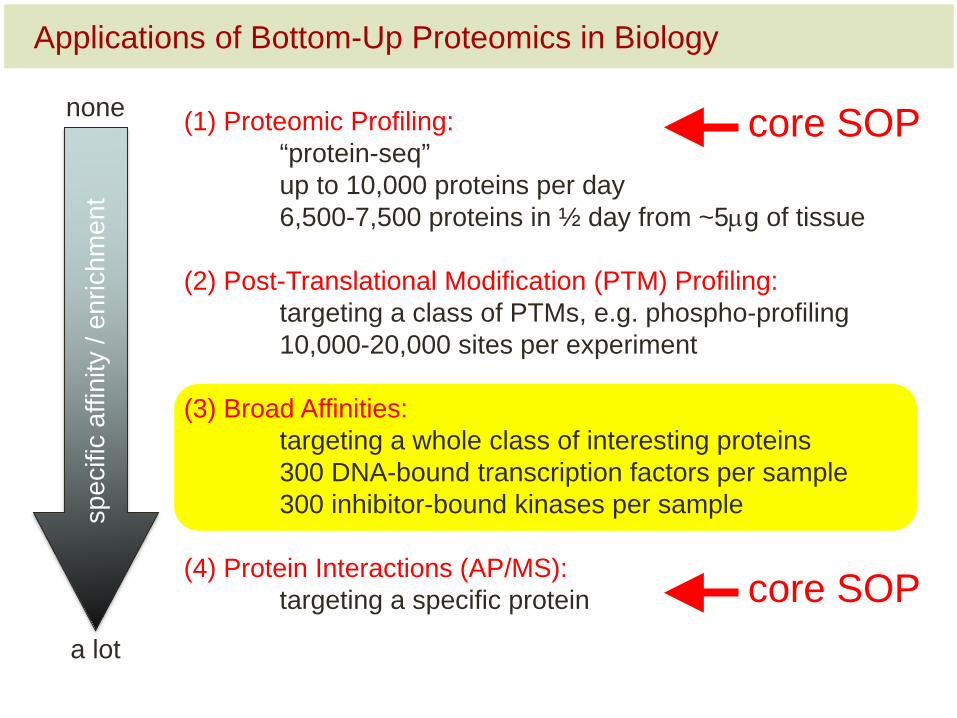
Applications of Bottom-Up Proteomics in Biology
(1) Proteomic Profiling: “protein-seq”up to 10,000 proteins per day6,500-7,500 proteins in ½ day from ~5µg of tissue
(2) Post-Translational Modification (PTM) Profiling:targeting a class of PTMs, e.g. phospho-profiling10,000-20,000 sites per experiment
(3) Broad Affinities:targeting a whole class of interesting proteins300 DNA-bound transcription factors per sample300 inhibitor-bound kinases per sample
(4) Protein Interactions (AP/MS):targeting a specific protein
none
a lot
spec
ific
affin
ity /
enric
hmen
tcore SOP
core SOP
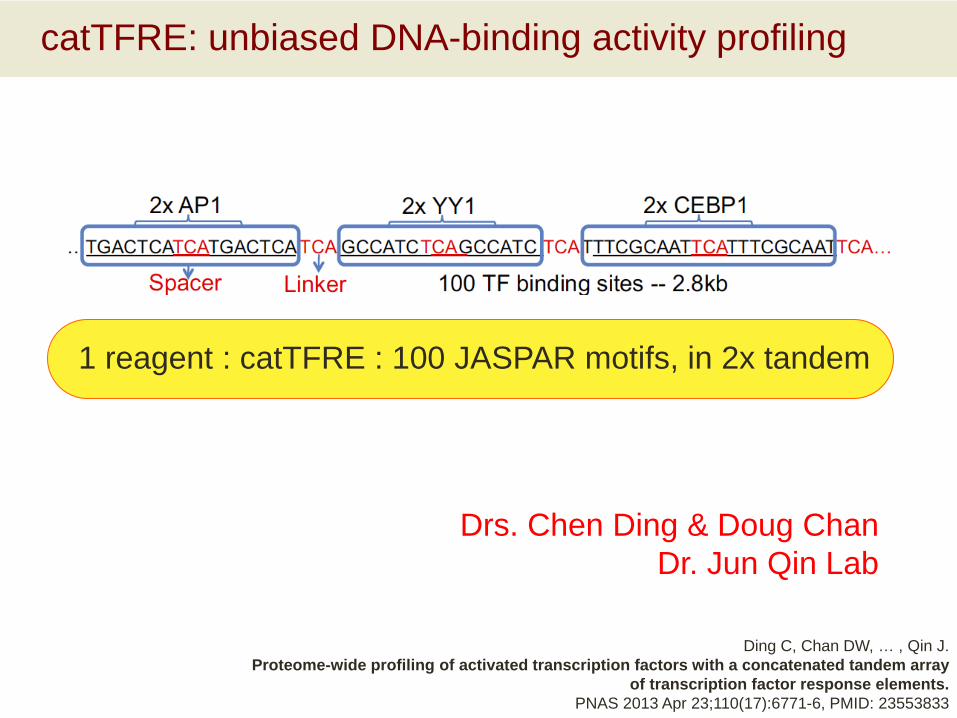
catTFRE: unbiased DNA-binding activity profiling
1 reagent : catTFRE : 100 JASPAR motifs, in 2x tandem
Drs. Chen Ding & Doug ChanDr. Jun Qin Lab
Ding C, Chan DW, … , Qin J. Proteome-wide profiling of activated transcription factors with a concatenated tandem array
of transcription factor response elements.PNAS 2013 Apr 23;110(17):6771-6, PMID: 23553833
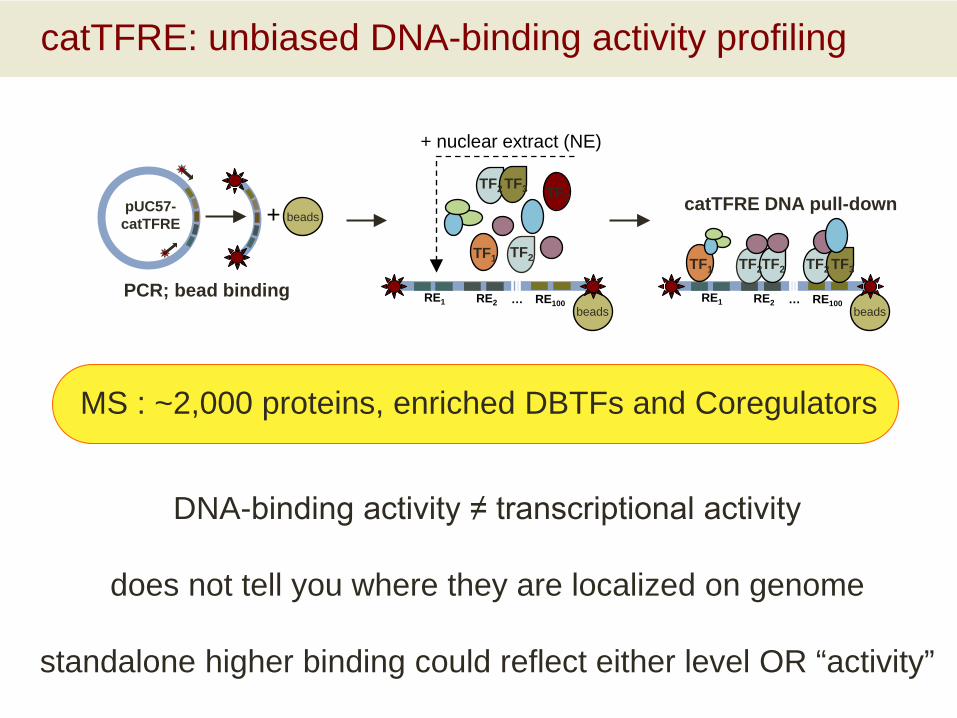
catTFRE: unbiased DNA-binding activity profiling
catTFRE DNA pull-down
beadsRE1 RE2 RE100…
TF1 TF2TF2 TF2 TF3
+ nuclear extract (NE)
TF1 TF2
TF2 TF3 TF5
beadsRE1 RE2 RE100…
beads
PCR; bead binding
+ pUC57-catTFRE
MS : ~2,000 proteins, enriched DBTFs and Coregulators
DNA-binding activity ≠ transcriptional activity
does not tell you where they are localized on genome
standalone higher binding could reflect either level OR “activity”
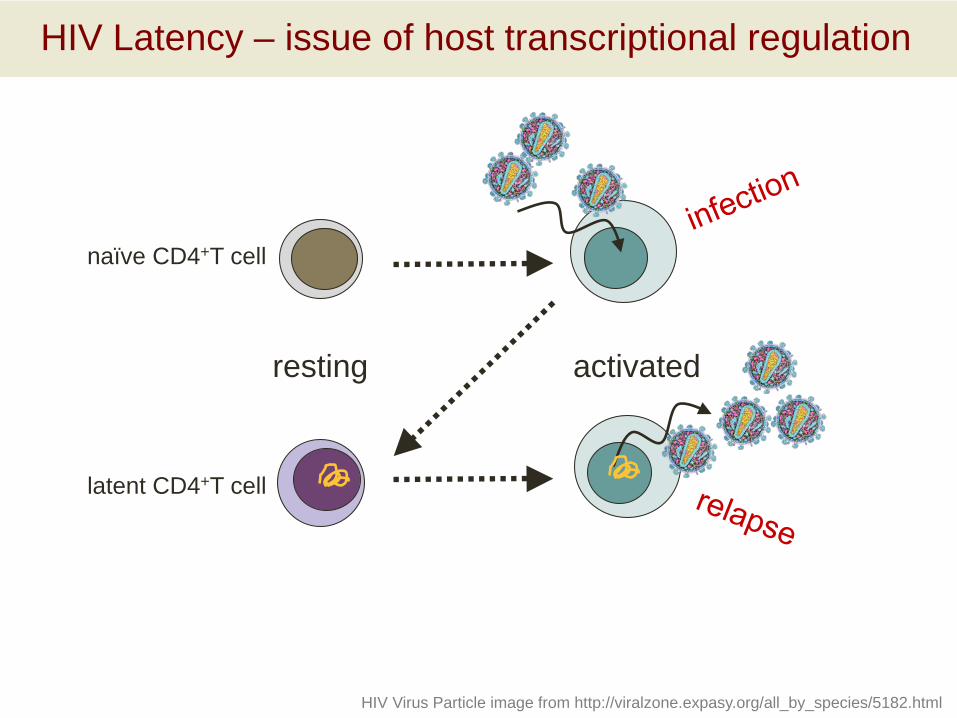
HIV Latency – issue of host transcriptional regulation
HIV Virus Particle image from http://viralzone.expasy.org/all_by_species/5182.html
naïve CD4+T cell
activatedresting
latent CD4+T cell
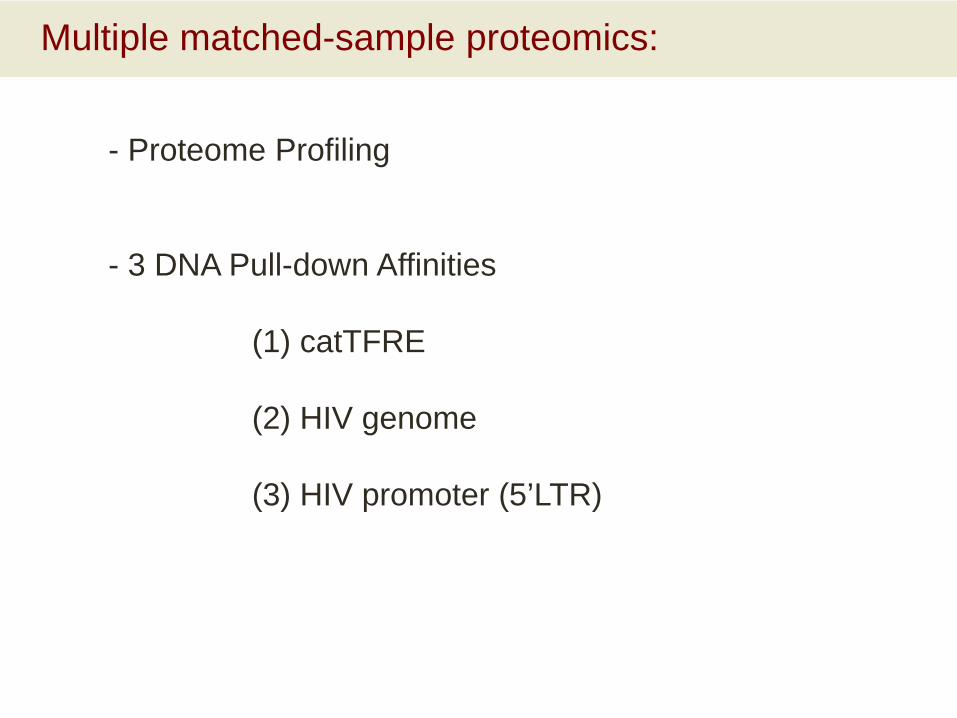
Multiple matched-sample proteomics:
- Proteome Profiling
- 3 DNA Pull-down Affinities
(1) catTFRE
(2) HIV genome
(3) HIV promoter (5’LTR)
rest
ing
CD
4+T
cells
(from
1 d
onor
)
activ
ated
rest
ing
+ PM
A/io
nom
ycin
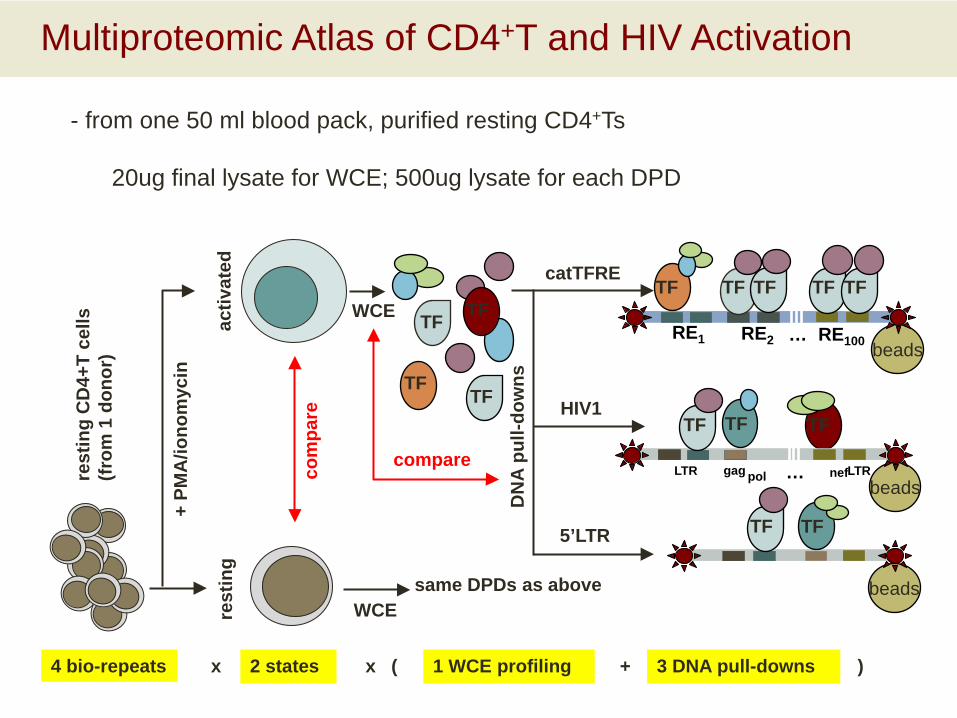
4 bio-repeats 2 states 1 WCE profiling 3 DNA pull-downs
WCE
x x ( + )
same DPDs as above
com
pare
TF
TF
TF
TFWCE
compare
beads
TF TF
beadsLTR nef…
TF TF
gag pol
beadsRE1 RE2 RE100…
TF TF TF TF TFcatTFRE
HIV1
5’LTRD
NA
pull-
dow
ns
LTR
TF
Multiproteomic Atlas of CD4+T and HIV Activation
- from one 50 ml blood pack, purified resting CD4+Ts
20ug final lysate for WCE; 500ug lysate for each DPD
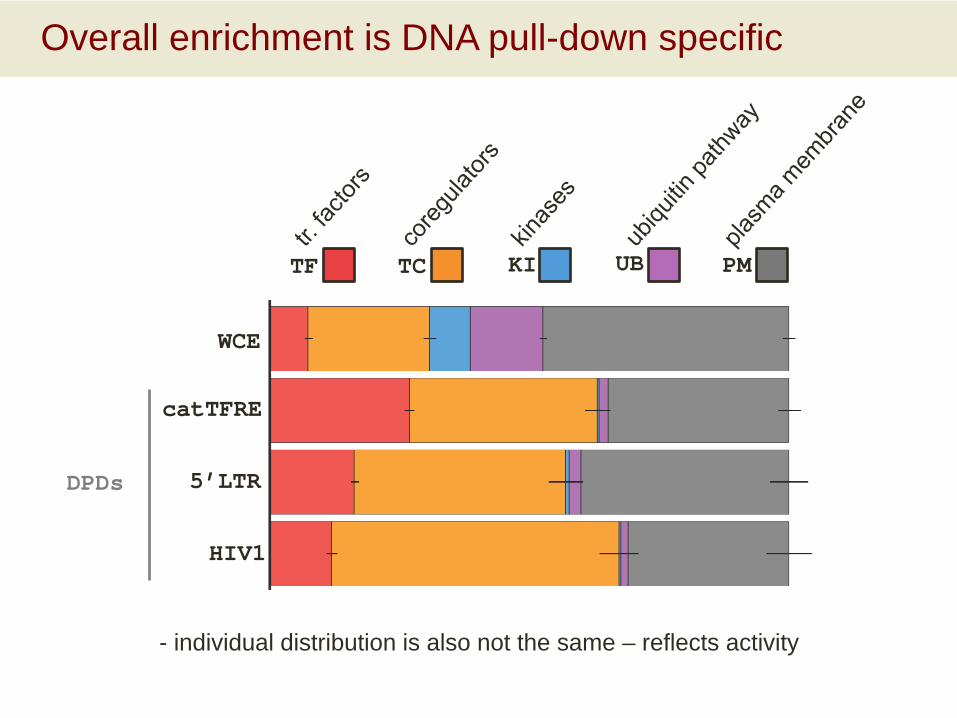
Overall enrichment is DNA pull-down specific
WCE
catTFRE
5’LTR
HIV1
TF TC KI UB PM
DPDs
- individual distribution is also not the same – reflects activity
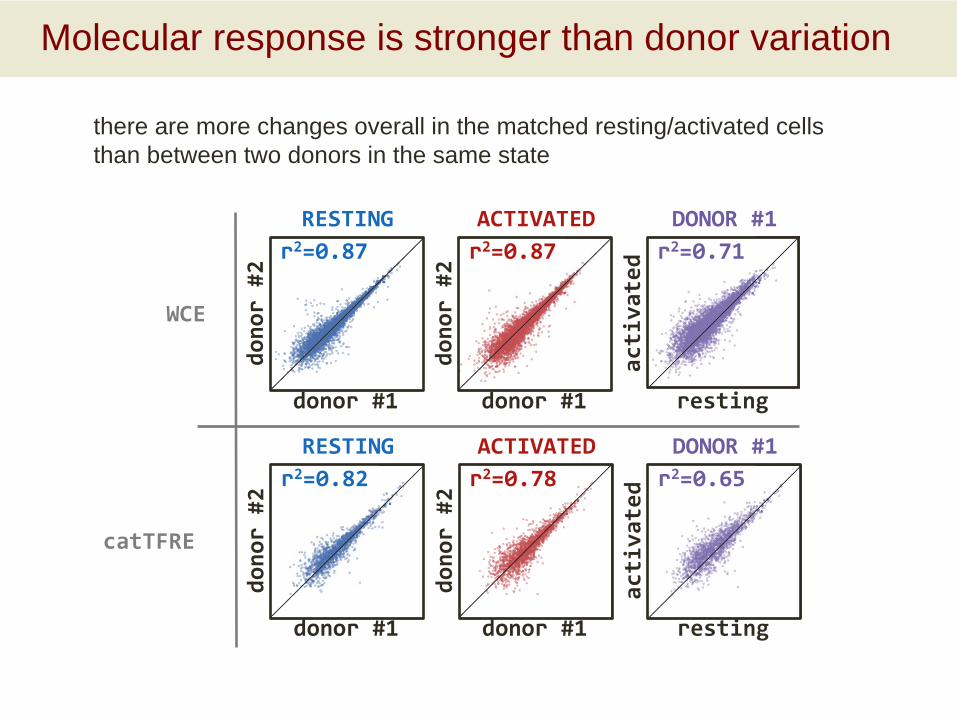
donor #2
donor #1
RESTINGr2=0.87
donor #2
donor #1
ACTIVATEDr2=0.87
activated
resting
DONOR #1r2=0.71
WCE
donor #2
donor #1
RESTINGr2=0.82
donor #2
donor #1
ACTIVATEDr2=0.78
activated
resting
DONOR #1r2=0.65
catTFRE
Molecular response is stronger than donor variation
there are more changes overall in the matched resting/activated cellsthan between two donors in the same state
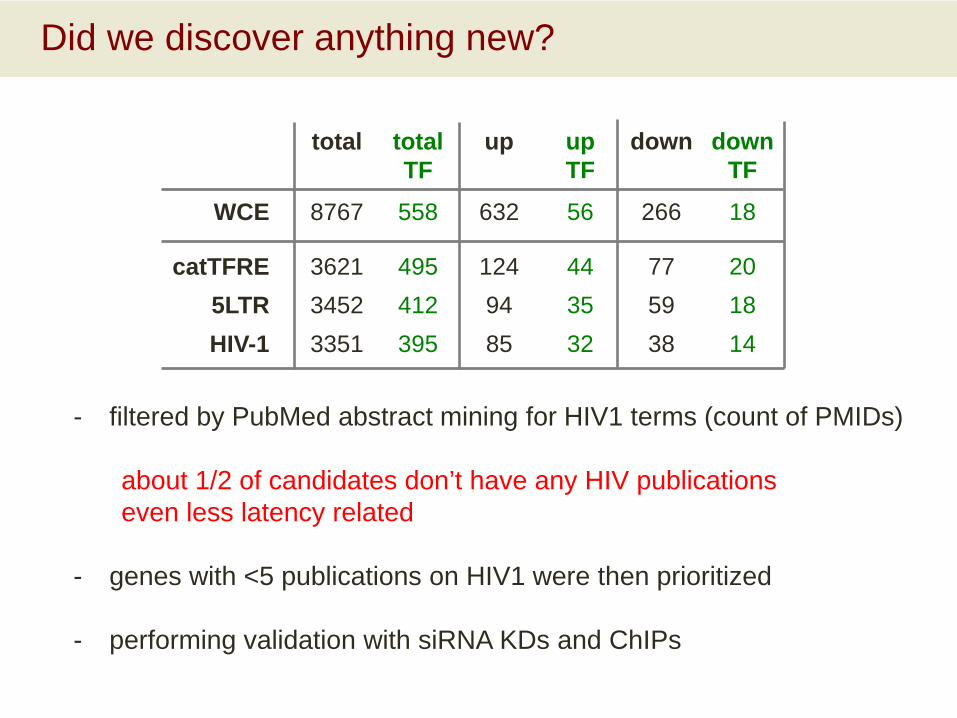
Did we discover anything new?
- filtered by PubMed abstract mining for HIV1 terms (count of PMIDs)
about 1/2 of candidates don’t have any HIV publicationseven less latency related
- genes with <5 publications on HIV1 were then prioritized
- performing validation with siRNA KDs and ChIPs
WCE
catTFRE5LTRHIV-1
8767
362134523351
total
558
495412395
totalTF
632
1249485
up
56
443532
upTF
266
775938
down
18
201814
downTF
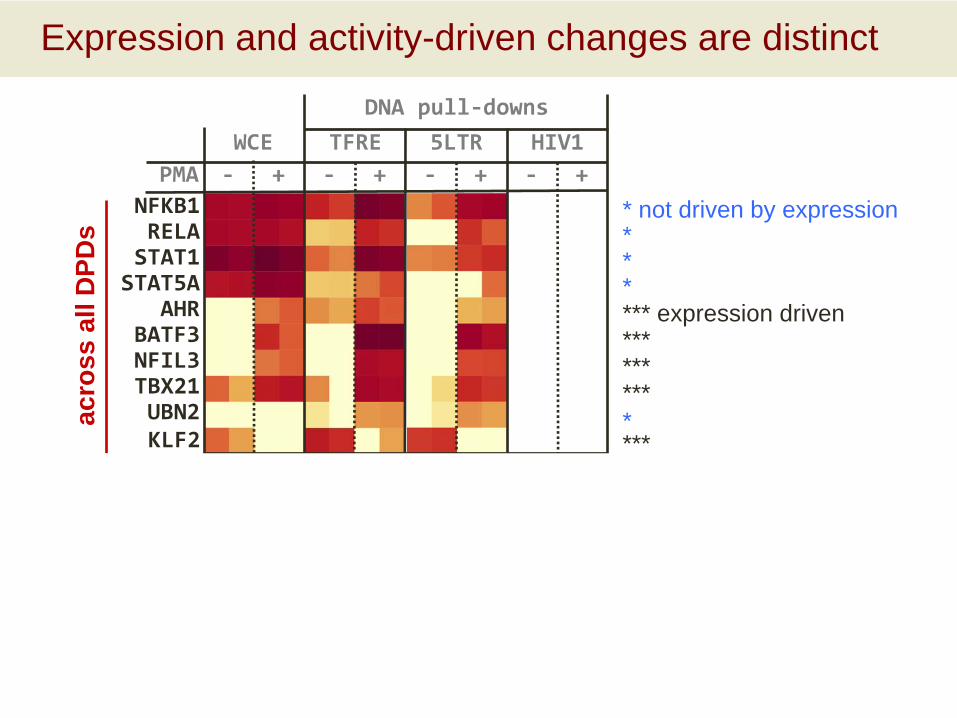
NFKB1RELASTAT1
STAT5AAHR
BATF3NFIL3TBX21UBN2
WCE TFRE-
#1donors #2
+ - +PMA
#1 #2
KLF2BACH2KANSL3
ATF6ZNF398ZNF454ZBED2ZNF444
acro
ss a
ll D
PDs
spec
ific
5LTR- +
#1 #2
HIV1- +
#1 #2
DNA pull-downs
Expression and activity-driven changes are distinct
* not driven by expression***
*
****
*
*** expression driven*********
******
***
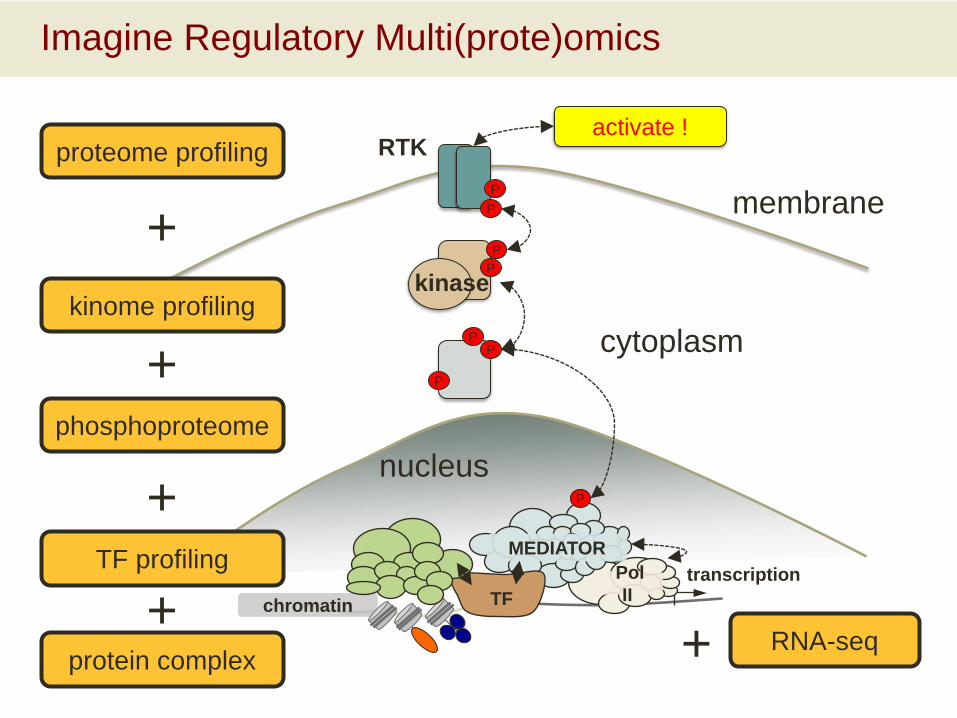
Imagine Regulatory Multi(prote)omics
P
PP
P
PP
P
cytoplasm
nucleus
transcriptionPOLR2B
POLR2A
POLR2CPOLR2G
POLR2J2L2D
2I
2EPOLR2HPol
II
MEDIATOR
chromatin TF
ERCC6/PGBD3
CHD4
CHD3
MTA1 MTA2
GATAD2A
MTA3
MBD2 MBD3
GATAD2B HDAC1
HDAC2
RBBP4
RBBP7CDK2AP1/2
membrane
RTK
kinase
P
activate !proteome profiling
kinome profiling
phosphoproteome
TF profiling
+
+
+
protein complex+
RNA-seq+
Acknowledgements
Funding and Support
Present:Alkek Center for Molecular Discovery at BCMVerna and Marrs McLean Foundation at BCMNIH P30 CA125123 DLDCCC Proteomics CoreCPRIT RP170005 CPRIT Proteomics CoreNIH U24 CA210954 PGDAC, CPTAC ConsortiumNIH U01 (pending) PTRC, CPTAC ConsortiumNIH U01 MH105026 IDG Consortium
Past:
NIH P30 AI036211 CFAR Developmental Award PINIH U19 DK62434 NURSA ConsortiumNIH T32 HD007165NIH R01 HD08188, DK059820, CA84199, M080703
Collaborators on HIV ProjectDr. Andrew Rice + Lab
Collaborators and ColleaguesDr. Jun Qin, Dr. Yi Wang + LabsDr. Bert O’Malley + LabDr. Charles Foulds + LabDr. Rainer LanzDr. Matthew Ellis + LabDr. Doug ChanDr. Beom-Jun Kim
Proteomics CoreDr. Sung Yun JungDr. Jong Min ChoiAntrix JainHamssika Chandrasekaran
LabDr. Mei LengAlexander SaltzmanBhoomi Bhatt