MRSD Team B Arcus: A UAV for Planetary Exploration
22
MRSD Team B Arcus: A UAV for Planetary Exploration 9/30/2016 Clare Cui Maitreya Naik Angad Sidhu Logan Wan
Transcript of MRSD Team B Arcus: A UAV for Planetary Exploration

MRSD Team B Arcus: A UAV for Planetary Exploration
9/30/2016
Clare Cui Maitreya Naik Angad Sidhu Logan Wan

1. Table Of Contents
1. Table Of Contents 2. Project Description 3. Use Case 4. System-level Requirements
4.1 Mandatory Performance 4.2 Mandatory Non-Functional 4.3 Desirable Performance 4.4 Desirable Non-Functional
5. Functional Architecture 6. System-level Trade Studies
6.1 RGB Imaging 6.2 Hyperspectral Imaging 6.3 Vehicle Type
7. Cyberphysical Architecture 8. Subsystem Descriptions
8.1 Ground Control Station 8.1.1 Telemetry 8.1.2 Remote Control 8.1.3 Display Unit
8.2 Aerial Vehicle 8.2.1 Flight Control 8.2.2 Power Distribution
8.3 Perception 8.4 Localization and Map Generation
9. Project Management 9.1 Work Plan and Tasks 9.2 Schedule 9.3 System Validation Experiments 9.3.1 Fall Validation
9.3.1.1 Hardware Flight Test 9.3.1.1 Odometry Test
9.4 Team Responsibilities 9.5 Parts and Budget 9.6 Risk Management
10. References
2

2. Project Description NASA is planning an exploratory mission on Mars to probe cave networks for
information on their structures and the mineral composition on the surface layers of rock and sediment. These findings can further inform our scientific understanding of Mars and its suitability as a location for human inhabitation. However, it is extremely costly to send humans to scout and look for desirable landing locations and areas of interest for future scientific missions. Arcus is a UAV (unmanned aerial vehicle) that will generate real-time map data to give scientists and users the critical information necessary to make informed decisions on how to allocate precious resources when on Mars. Arcus will combine LiDAR (light detection and ranging), RGB (red green blue), along with hyperspectral (non-visible light) imaging sensors to create data-rich maps that will highlight specific objects of interest fused with spatial geographic information. The final vehicle will be designed to fly inside of, discover, and autonomously map fully enclosed, non-uniform environments.
In the scope of the MRSD project, Arcus will be a remotely piloted UAV that will
generate this map information in real-time. It is intended to be used as a rapid prototyping platform for developing navigation and planning algorithms, as well as provide software and hardware modularity to accommodate different types of imaging sensors. The platform and the software provided allows researchers to easily hook into ROS to retrieve point clouds describing the environment containing various sensor measurements. Researchers would then develop algorithms which analyze the map and make decisions regarding future behavior. For example, if a branch of a cave seems to tighten in diameter the robot might make the decision to ignore that route to explore because it might be too tight to examine. However, if the entrance to that branch is coated in rich minerals that haven’t been observed before, the robot might make the decision to traverse down that branch to gather more information.
3. Use Case
Prior to a fully manned mission to Mars, NASA will send out robotic scouting missions to determine both the planet’s suitability of habitation, and a potential landing spot for a human habitat. Similar missions are planned for the Moon, where scientists are trying to uncover the actual quantity and location of water around unique geographic landmarks. A mapping UAV will be prepared for the unique requirements of each mission. A moon UAV will likely be propelled by rocket-powered thrusters, whereas the Martian atmosphere would accommodate propeller-driven flight. Sensors such as spectrometers, hyperspectral imagers, and distance ranging equipment would be loaded for the detection of various molecules, water, or precious resources. Mission parameters will be loaded onto the vehicle, such as general location of interest coordinates, and specific features to search for.
3

Upon delivery as a rocket payload to the terrestrial surface, the UAV will deploy from its
base station, and plan a path to its first waypoint. While en route, due to communication latency, the UAV will have to make decisions that will optimize its battery life to focus on successfully completing mission objectives. As seen in Figure 1 below, real-time fusion of map structural data with hyperspectral imaging data will allow for the drone to quickly identify specific features to follow up with higher resolution data capture. After a predetermined amount of battery consumption, the UAV will return back to the landing site for high-bandwidth data communication back to Earth. Using this high-fidelity data, scientists will then be able to better inform their hypotheses about the characteristics of the celestial body, and much more quickly determine its suitability for human habitation or resource acquisition.
Figure 1: Site operation mock-up
4
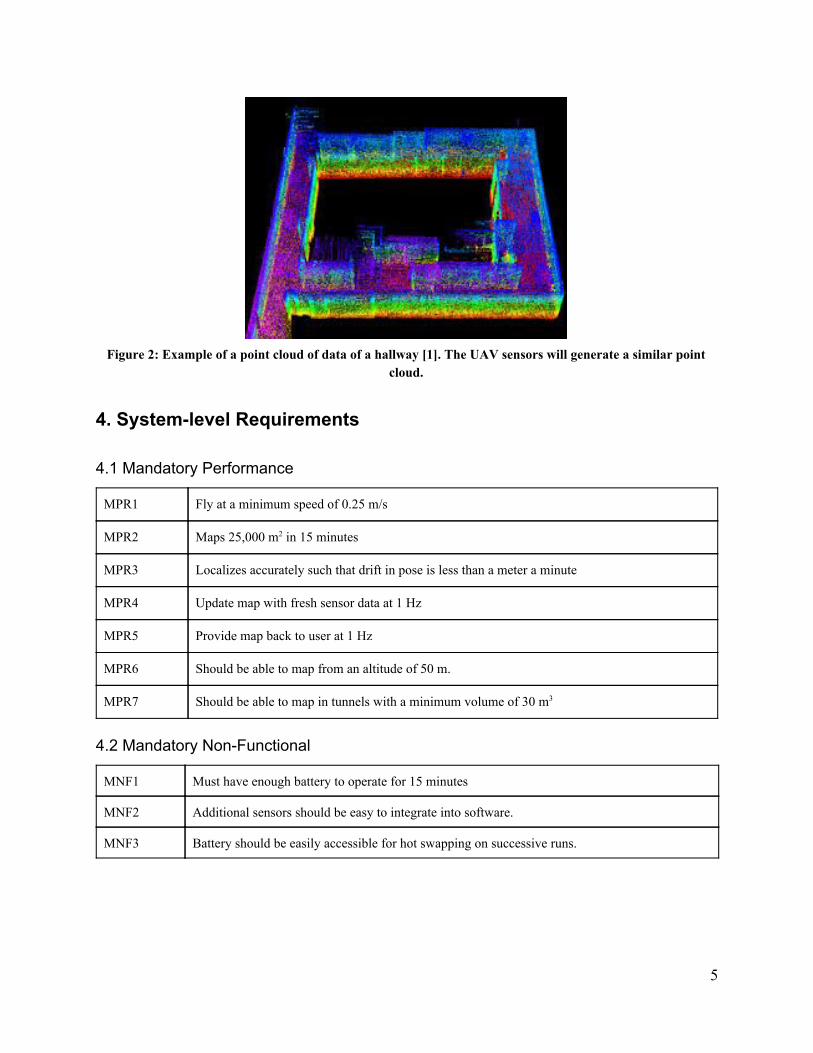
Figure 2: Example of a point cloud of data of a hallway [1]. The UAV sensors will generate a similar point
cloud.
4. System-level Requirements
4.1 Mandatory Performance
MPR1 Fly at a minimum speed of 0.25 m/s
MPR2 Maps 25,000 m2 in 15 minutes
MPR3 Localizes accurately such that drift in pose is less than a meter a minute
MPR4 Update map with fresh sensor data at 1 Hz
MPR5 Provide map back to user at 1 Hz
MPR6 Should be able to map from an altitude of 50 m.
MPR7 Should be able to map in tunnels with a minimum volume of 30 m3
4.2 Mandatory Non-Functional
MNF1 Must have enough battery to operate for 15 minutes
MNF2 Additional sensors should be easy to integrate into software.
MNF3 Battery should be easily accessible for hot swapping on successive runs.
5

4.3 Desirable Performance
DPR1 Safely land and takeoff at 0.3 m/s
DPR2 Wirelessly controllable up to 200m distance from user
DPR3 Wirelessly transmit maps and video data up to 100m distance from user
DPR4 Data point position resolution of at least 15 cm
DPR5 Should be able to fly up to 100 m
4.4 Desirable Non-Functional
DNF1 Additional perception sensors can be easily mounted.
DNF2 User base station can be easily transported
5. Functional Architecture
Figure 3: Functional architecture diagram
The functional architecture for this project is visualized in Figure 3. Because the aerial
vehicle will be controlled through tele-operation, its sole input will be from the user, who utilizes a physical interface to direct the vehicle. The expected output will be a real-time mapping of the environment that the vehicle is traversing through.
6

Once the vehicle receives remote input from the user, it processes the commands, adjusting the speed of the motors to travel at the specified velocity. Simultaneously, the robot conducts state estimation, keeping itself stable in the air from positional data acquired from a sensor. After knowing its approximate state, the robot is then able to take in imaging data from different sensors to perceive its environment and update its state estimate. At a minimum, there will be two mounted sensors whose data will be fused together to provide a 3D map. Additionally, images from one of the RGB cameras will be sent directly to the ground control station to aid the user in manual flight of the UAV. This map will be sent back to the user, updating frequently such that the user is always able to see where the robot is in space.
6. System-level Trade Studies Three trade studies were conducted to evaluate three separate components of our system.
These were selected based on our requirements to have both an aerial vehicle and multiple sensor modalities for enhancing the point cloud generated by the LIDAR. Each category was selected based on our own unique system requirements, and the weights assigned to each category reflect their relative importance towards meeting our system objectives.
6.1 RGB Imaging
A study was conducted to evaluate and compare various RGB cameras used in UAVs and other mapping and surveying UAVs. The RGB cameras below were selected based on their previous use in small form-factor aerial vehicles both in research and industry. As per our requirements, the cameras below were evaluated for their ease of integration into an aerial system, namely: size, weight, interfaces, cost and sensed image quality for generating map texture data. The trade study for this can be seen in Table 1.
Image quality was evaluated based on the camera resolution, lens distortion, global
shutter ability, as well as dynamic range necessary for high quality texturing of point clouds. Volumetric size and weight were evaluated relative to other components already integrated into UAVs. RGB sensors are typically lower-cost than other imaging modalities; thus cost was considered, but not weighted as greatly as the other categories. Lastly, ease of integration was considered critical to their inclusion in the system. If the camera had unique power, signal, mechanical, or software requirements that made integration less straightforward, they received a lower score. Likewise, higher scores were correlated with their successful documented use in commercial and hobby UAVs.
7
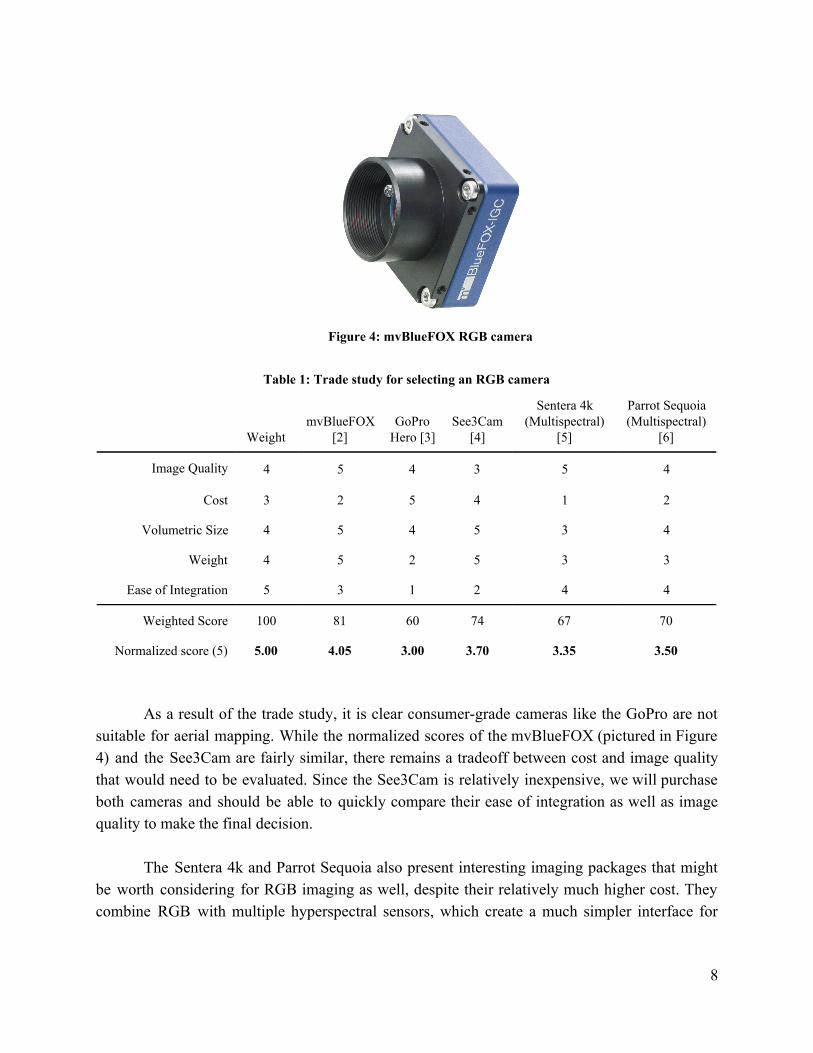
Figure 4: mvBlueFOX RGB camera
Table 1: Trade study for selecting an RGB camera
Weight
mvBlueFOX
[2] GoPro
Hero [3] See3Cam
[4]
Sentera 4k (Multispectral)
[5]
Parrot Sequoia (Multispectral)
[6]
Image Quality 4 5 4 3 5 4
Cost 3 2 5 4 1 2
Volumetric Size 4 5 4 5 3 4
Weight 4 5 2 5 3 3
Ease of Integration 5 3 1 2 4 4
Weighted Score 100 81 60 74 67 70
Normalized score (5) 5.00 4.05 3.00 3.70 3.35 3.50
As a result of the trade study, it is clear consumer-grade cameras like the GoPro are not
suitable for aerial mapping. While the normalized scores of the mvBlueFOX (pictured in Figure 4) and the See3Cam are fairly similar, there remains a tradeoff between cost and image quality that would need to be evaluated. Since the See3Cam is relatively inexpensive, we will purchase both cameras and should be able to quickly compare their ease of integration as well as image quality to make the final decision.
The Sentera 4k and Parrot Sequoia also present interesting imaging packages that might
be worth considering for RGB imaging as well, despite their relatively much higher cost. They combine RGB with multiple hyperspectral sensors, which create a much simpler interface for
8

collecting data from all sources at once. However, the tradeoff is sacrificing RGB image quality for more versatility.
6.2 Hyperspectral Imaging
As the title and main objectives note, in addition to LiDAR and RGB mapping, we are also to consider other imaging modalities to augment our map data. The lowest-cost and most widely available sensors are typically those used in agricultural imaging (IR, Near-IR, Red-Edge, Green, and Blue), or thermal imaging. These represent hyperspectral light wavelengths that are unable to be seen by the naked eye.
However, as the price of such sensors can quickly reach the five or six digit price range, cost is an important factor in selecting sensors that can provide data which generate valuable insights to end users. Seen in Table 2 is a trade study for determining the best hyperspectral camera for our UAV application. In general, these sensors are larger than typical RGB sensors, so size was slightly deprioritized for an increased price sensitivity. Otherwise, the previous factors in selecting an RGB camera (weight, image quality, ease of integration) all have the same weight when selecting a hyperspectral camera.
Figure 5: Parrot Sequoia Multispectral Camera
9

Table 2: Trade study for selecting a multispectral camera
Weight
FLIR Tau 320 [7]
MicaSense Red Edge [8]
Sentera 4k (Multispectral)
Parrot Sequoia (Multispectral)
Image Quality 4 3 4 5 3
Cost 4 3 2 1 3
Volumetric Size 3 4 3 3 4
Weight 4 4 4 4 5
Ease of Integration 5 2 4 4 4
Total Score 100 58 69 69 76
Normalized score (5)
5.00 3.10 3.45 3.45 3.8
The MicaSense, Sentera, and Sequoia cameras all provide multiple imaging sources from
different parts of the light spectrum. These allow for greater flexibility when imaging various points of interest while maintaining a compact package. However, these sensors are typically constrained to the IR, near-IR, and red, blue, green sections of the electromagnetic spectrum. Due to cost, we are limited to evaluating sensors that operate in the visible light through infrared spectrum. Thermal sensors operate at similar wavelengths in the IR range, but are optimized for sensing heat, with or without infrared. The Sequoia camera currently presents the greatest value for its price, and we will most likely purchase this camera to augment our RGB camera.
6.3 Vehicle Type
There are multiple vehicle designs and propulsion technologies that are currently used in mapping and surveying UAVs. These include quadrotors, hexrotors, fixed wing aircraft, and helicopters. Each vehicle type has been successfully deployed in research and industry for their respective use cases, and we can perform another trade study to determine the best approach for our vehicle. Because of our limited budget and time, we are forced to consider the simplicity of the vehicle and its control in addition to physical attributes, including payload, weight, and flight duration. Since the main objective of this project is to generate real-time multi-modal maps, we prioritize the simplicity of the vehicle, as well as its ability to carry the necessary sensor payload to generate the map. Shown in Table 3 is a trade study comparison of several different aerial vehicle designs to select one that best suits our application of planetary exploration.
10

Figure 6: Sensefly fixed-wing surveying UAV
Table 3: Trade study for selecting vehicle type
Weight Quadrotor Hexrotor Fixed Wing Helicopter
Mechanical Simplicity
3 4 5 3 2
Control Simplicity 5 4 4 2 1
Cost 2 3 2 2 3
Weight 2 3 2 5 4
Flight Duration 4 3 2 5 3
Payload Capacity 4 3 5 1 2
Weighted Score 100 68 71 57 45
Normalized score (5)
5.00 3.40 3.55 2.85 2.25
After an initial evaluation of these vehicle designs, it is clear that fixed wing aircraft and
helicopters are ill-suited for this task. While flight duration is important, fixed wing aircraft have a minimum airspeed that may be too fast for our mapping software to keep up with. In addition,
11

precision control of fixed wing aircraft is still very much an ongoing research topic, and certainly out of scope of this project. Helicopter control is also relatively complex compared to quadrotor and hexrotor control, and helicopters don’t immediately present any significant advantages over quadrotors and hexrotor vehicles. Quadrotors and hexrotors both have relatively cheaper components due to their commoditization and prevalent use in hobby, industrial, and research areas.
Our team has decided to go forward with developing on a hexrotor platform, which reaps the advantages of sharing components with quadrotor platforms while providing greater payload capacity for more sensor payload flexibility.
7. Cyberphysical Architecture
Figure 7: Cyberphysical architecture diagram
Shown in Figure 7 is the cyberphysical architecture diagram for the project. A 2.4 GHz
remote controller sends commands to the receiver, which communicates with the flight controller. The flight controller processes these commands and sends them to electronic speed controllers (ESCs), which engage and control the motors and connected propellers, enabling flight. At the same time, the onboard computer is performing state estimations to determine the pose and orientation of the robot, which is informed by an inertial measurement unit (IMU) and RTK (real time kinematic) GPS for ground truth. The state is updated with information from point clouds generated from the LiDAR (light detection and ranging), which localize the robot in its surroundings. As the robot traverses through the air, it will generate a map, which is a
12

composite of the LiDAR and RGB sensor data. The images from the RGB cameras along with maps that are generated by the onboard computer will be sent through the radio transmitter over 5 GHz radio back to the receiver and displayed to the user at the ground control station.
8. Subsystem Descriptions The systems is comprised of the following main 4 subsystems:
8.1 Ground Control Station
The Ground Control Station(GCS) provides the user with a method to control the robot’s flight and includes a display for the user to view the map constructed by the robot.
8.1.1 Telemetry
The GCS will be connected to the flying robot using a telemetry radio to receive the constructed map from the robot. This data will then be processed and the map will be displayed on a display unit at the ground control station. An RTK GPS will be used as a ground truth comparison for our localization estimates. This will require both a GPS radio on the GCS as well as the vehicle itself, coupled with a 915MHz telemetry radio.
8.1.2 Remote Control
The RC controller in the GCS is used to manipulate the robot’s speed as well as the robot’s orientation (3DOF) using 2 joysticks on the controller. A dedicated switch on the RC controller allows the user to switch the robot flight mode between “Stabilize” and “Landing.” The remote control uses the 2.4GHz spectrum of radio waves for robot control and assumes that the robot is in the user’s line-of-sight. When out of line-of-sight, the user may utilize the display unit of the GCS for robot navigation.
8.1.3 Display Unit
The display unit at the GCS will be used to update and display the constructed map received from the robot. This will include the structural information from the LiDAR, as well as multiple layers of RGB and hyperspectral data. Additional information, such as robot orientation, flight speed, and other telemetry data can also be overlaid on this map.
8.2 Aerial Vehicle
The aerial vehicle will be the platform that helps us realise the mapping requirement for the system by carrying the imaging sensors and keeping track of its movement through the unknown environment.
13

8.2.1 Flight Control
The flight control subsystem resides on the robot to enable stable robot flight. It consists of the PixHawk flight controller, the GPS module, the telemetry transmitter, electronic speed controllers, and the propulsion motors. This subsystem is responsible for receiving the RC commands from the GCS, and sending respective commands to the propellor motors to ensure robot movement as per user requirement.
8.2.2 Power Distribution
Power distribution is an important part of the aerial vehicle subsystem. It will ensure that motors, flight controller, sensors, and computer have a stable power supply as the battery discharges. It is important to mitigate any possible drop in voltage when the motors are starting and drawing large amounts of current. It is also important that the flight controller and computers never lose power. Battery charge state as well as battery health will be necessary feedback for the user while operating the vehicle.
8.3 Perception
The perception subsystem enables processing and forwarding of relevant imaging and positional data to the respective subsystems on the aerial vehicle. The perception subsystem is composed of the LiDAR, RGB cameras, hyperspectral imaging sensors, and will accommodate alternate sensor payloads if necessary. The perception system is used for sensor calibration, processing sensor data, and forwarding it to the localization and the map generation subsystems.
8.4 Localization and Map Generation
The Localization and Map Generation subsystems are responsible for keeping track of the robot’s movement and forming the map of the unknown environment. In order to localize itself we will use the LOAM algorithm [1] to simultaneously localize and map our environment. The algorithm will primarily use the point cloud produced by the LiDAR. It performs odometry measurements by finding planar and edge features in the point cloud, finding as many correspondences of previously found features in succeeding laser scans, and picking a correspondence which minimizes distance of all points in the cloud. It performs odometry measurements at a higher frequency compared to its mapping frequency and uses its odometry methods to do motion distortion removal on succeeding laser scans. This can be further augmented by an IMU which can remove motion distortion at an even higher frequency compared to the LiDAR odometry. An RTK GPS Module with centimeter-level accuracy will be used as a ground-truth comparison for odometry performance.
14

The map generation subsystem uses the odometry data as well as the imaging data received from the imaging sensors to generate a map of the environment. The imaging data will be projected onto the point clouds received by the LiDAR allowing us to obtain RGB color and hyperspectral imaging data for our point cloud. It is important to store points and data in the map as efficiently as possible as multiple modalities may be stored in the data point. It is also possible that there may be no information from an imaging modality for a specific point, which will need to be considered when storing map data. This map is then transmitted to the GCS for user inspection using a 5.0GHz Wi-Fi module. Similarly this transaction should be executed as efficiently as possible, only sending data that is needed to update the map on the GCS so as not to eat up bandwidth on the link between the UAV and GCS.
9. Project Management
9.1 Work Plan and Tasks
Our team work plan is to tactfully and efficiently build the UAV by working on separate sections in parallel. For example, because the UAV operation is weather-dependant, outdoor testing must occur in fall and spring. Therefore, much of the software development will be done during the winter months. A breakdown of each stage is detailed below. Stage 1: RC Flight
This stage is meant to get the UAV up and flying with a remote controller. The transmitter and receiver has to be paired, and the battery, flight controller, and receiver must be mounted to the UAV chassis. Once the flight controller is configured, a static test will be conducted followed by an outdoor free flight test. Stage 2: Sensor Calibration and Data Capture
In this stage, the sensors will be prepared for use on the UAV. The initial steps in this stage are to select the imaging sensors to be used on the UAV and to collect a bag of data from the LiDAR sensor from the Lafarge quarry. Eventually, the LiDAR, flight controller, IMU, and imaging sensors must all be calibrated for the UAV. Stage 3: System Hardware Integration
Stage 3 will compile all of the physical hardware components onto the UAV chassis. To do this, the electrical power system will be designed, which necessitates board fabrication and a short design review. The sensor mounts must be designed and fabricated, and there will be a static, no flight test to complete the stage.
15

Stage 4: Ground Mapping Successful ground mapping will entail the UAV mapping in real-time with a human
operator holding the system and carrying it at a level height while walking around. In order to achieve ground mapping, this stage will consist of developing and integrating the mapping and pose estimation algorithms and, subsequently, testing and minimizing the error. Stage 5: Air Mapping
Successful air mapping will consist of a tele-operable UAV that is SLAM-capable and returns its mapping online and in real-time. First, reliable, accurate data must be collected aerially at Lafarge. Localization and map generation will take place offline initially. Then, the team will further test and revise the relevant algorithms. Finally, localization and map generation will be optimized to take place online, thus completing the last stage.
9.2 Schedule
Shown in Table 4 is a list of milestones. Progress Reviews 1 and 2 are explained in detail below due to their impending nature. Progress Review 1: For the first progress review, our team will be showing our UAV is capable of radio-controlled flight. We will have configured and calibrated the flight controller and IMU sensor. Also, we will have an initial bag of data collected via LiDAR of the Lafarge Bay. Progress Review 2: For the second progress review, we will have the LiDAR calibrated and have designed and fabricated the sensor mounts. We will also have selected and purchased the imaging sensors whose data will eventually be fused with the LiDAR system.
Table 4: Timeline of milestones to reach for both Fall and Spring semesters
Date Milestone Tasks to be Completed
10/20/16 Progress Review 1 - Radio controlled flight - Configure and calibrate existing sensors
10/27/16 Progress Review 2 - CAD and fabricate sensor mounts - Electrical power system design - Select and purchase imaging sensors
11/10/16 Progress Review 3 - CAD full system - Hardware should be installed and mounted on the platform - Should be able to collect data from mounted platform
16

11/22/16 Progress Review 4 - Demonstrate ability to map point cloud and localize
12/01/16 Progress Review 5 - Continue to improve odometry methods
12/08/16 Progress Review 6 - Continue to improve odometry methods - Demonstrate ability to map and localize and measure performance for validation experiments
1/31/17 January Milestone - Sensor Data Fusion (RGB integrated into map) should be mostly done - Demonstrate flight of UAV and capture data while flying
2/28/17 February Milestone - Test and show odometry algorithms functioning offline on recorded data
3/31/17 March Milestone - Demonstrate online mapping and localization while flying
4/30/17 April Milestone - Perform full systems test and continue to optimize and reduce error in odometry
9.3 System Validation Experiments
9.3.1 Fall Validation
The fall validation experiment will demonstrate various capabilities across all of our subsystems. There are two main goals we would like to accomplish. The first is to have a fully constructed platform with all components mounted and capable of maintaining flight under manual operation for a certain duration of time. The second is to have a not-flying platform that can generate a 3D point cloud and localize itself in it while moving over a set distance with some bounds on the drift.
9.3.1.1 Hardware Flight Test
Test Conditions: The test will take place in a large, and open area so there is enough space to maneuver
without harming anyone. The test will require the UAV to be fully built with all hardware and electronics mounted and powered. The UAV will demonstrate a very short flight and will operate in a small space. Procedure:
1. Power on robot.
17

2. Connect RC Controller and base station to robot. 3. Start software on base station which will monitor flight status. 4. Arm and perform lift-off maneuver. 5. Fly for 3 minutes at a maximum height of 10 m and a maximum speed of .5 m/s. 6. Monitor the status of sensors from the base station. 7. Land the robot.
9.3.1.1 Odometry Test
Test Conditions: The test will take place in both a large open area (i.e. the Mall or the Cut) and an
enclosed environment. A rig containing the perception sensors on the UAV (i.e. RGB Camera, Lidar), a RTK GPS system to measure performance and the base station will be needed to perform this experiment. The experiment will take place as the operator moves the rig through the space and the sensor rig attempts to localize itself. Procedure:
1. Power on rig. 2. Connect base station to rig. 3. Ensure rig is collecting sensor data. 4. Launch odometry program from base station. 5. Move rig through the space no more than 100m from starting position and record position
estimate data. a. System requirement validated: MPR5
6. Ensure error of odometry algorithm is less than 20% by comparing it to GPS data. a. System requirement validated: MPR3
7. Repeat steps 1-6 for a enclosed environment. a. System requirement validated: MPR7
9.3.2 Spring Validation: Full System Experiment
The full system experiment will attempt to combine the various subsystems and have them run concurrently. The test will occur in LaFarge Quarry, a large open space where we can test our UAV. The completed UAV, base station, and GPS will be needed to complete this experiment. The UAV will navigate manually through the quarry and map its environment in multiple modalities.
18

Procedure: 1. Power on robot and connect base station and controller to robot. 2. Lift-off the robot and begin capturing data. 3. The operator should fly the robot through the quarry to collect data for 10 minutes no
faster than 1 m/s. a. System requirement validated: MPR1, MPR2
4. The robot should generate a dense structural map of the world fused with RGB data for texture and transmit it to base station.
a. System requirement validated: MPR4, MPR6 5. The robot should also update it’s position as it flies through the Quarry transmitting it to
the base station. a. System requirement validated: MPR5
6. After the test is complete the final position estimate versus the GPS estimate should be less than 15%.
a. System requirement validated: MPR3
9.4 Team Responsibilities
Angad Sidhu will lead the software system design focusing specifically on localization and mapping software. These responsibilities include making sure the UAV can collect and store data in a map while simultaneously localizing itself and computing odometry. In addition, he will also work on API and overall software architecture to ensure that the software package is in a modular and componentized state ready for modification and reuse.
Clare Cui will lead the mechanical design of the mounting hardware necessary for the
electrical system onboard the UAV chassis. She will also have a secondary role in software, developing the localization and mapping algorithms.
Maitreya Naik will lead the firmware development, embedded system design, and sensor
integration. He will play a secondary role in the localization and mapping subsystem, the network programming, and mechanical CAD of minor system components.
Logan Wan will lead the overall system integration and electrical system design, as well as a secondary role in software development and mechanical design. These tasks include designing the power system of the vehicle, aiding in sensor integration tasks, and developing mapping software.
19

9.5 Parts and Budget
Below is a list of equipment that has either already been acquired by the project sponsor or will require purchase. The items that remain to be purchased are the RGB camera and the multispectral camera, which have a total cost of $4,050.00.
Table 5: Bill of Materials. Items without a subtotal were provided by the project sponsor
Type Part Cost Quantity Subtotal
GPS Piksi 1 Telemetry Radio 915 MHz SiK Radio 1 LIDAR Velodyne VLP-16 1 Computer GB-BSi7-6500 2 RAM Corsair 2x8GB 1
SSD SAMSUNG 850 EVO M.2 250GB 1
Computer Power Supply DCDC-NUC 1 Camera Lens Holder CMT821 2 Camera Lens DSL219D-650-F2.0 2 Autopilot Pixhawk 1 Flow Sensor PX4Flow 2 Frame Tarot 680Pro 1 Motors 700kv U3 8 ESCs Air 40A 8 Propeller CF 13x4.4 5 12v Regulator RMRC 5V/12V BEC 1 Battery 6600mAh 4-Cell/4S 2 RGB Camera mvBlueFox-MLC200wG $275.00 2 $550.00 Multispectral Camera Parrot Sequoia $3,500.00 1 $3,500.00
Expected
Expenditure $4,050.00
9.6 Risk Management
The risks for the project are covered in Table 6 below.
Table 6: Risk Management
ID Risk Description Probability Impact Mitigating Actions
1 Aerial Vehicle (UAV) Failure
The UAV may crash or fail during flight Low High
A “Pre-Flight Safety Check” worksheet will be created and referred to for checking failure points before initiating the system.
2 Imaging Sensor Failure
The Imaging sensors may fail due to over-current or short-circuiting during flight
Low High Create a current isolation, and stable power distribution board for safe operation of individual high-current requirements
20
http://www.readymaderc.com/store/index.php?main_page=product_info&cPath=505_507_518&products_id=3832
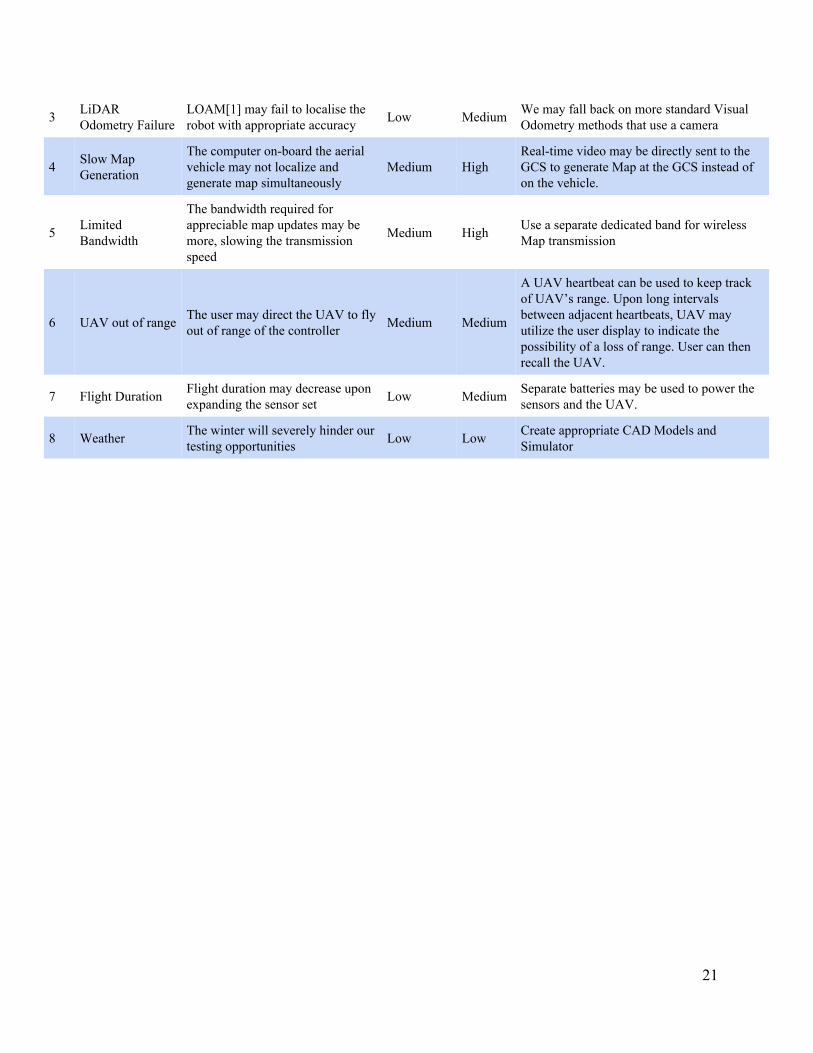
3 LiDAR Odometry Failure
LOAM[1] may fail to localise the robot with appropriate accuracy Low Medium We may fall back on more standard Visual
Odometry methods that use a camera
4 Slow Map Generation
The computer on-board the aerial vehicle may not localize and generate map simultaneously
Medium High Real-time video may be directly sent to the GCS to generate Map at the GCS instead of on the vehicle.
5 Limited Bandwidth
The bandwidth required for appreciable map updates may be more, slowing the transmission speed
Medium High Use a separate dedicated band for wireless Map transmission
6 UAV out of range The user may direct the UAV to fly out of range of the controller Medium Medium
A UAV heartbeat can be used to keep track of UAV’s range. Upon long intervals between adjacent heartbeats, UAV may utilize the user display to indicate the possibility of a loss of range. User can then recall the UAV.
7 Flight Duration Flight duration may decrease upon expanding the sensor set Low Medium Separate batteries may be used to power the
sensors and the UAV.
8 Weather The winter will severely hinder our testing opportunities Low Low Create appropriate CAD Models and
Simulator
21

10. References
[1] J. Zhang, Z. Ji, and S. Sanjiv, “LOAM: Lidar Odometry and Mapping in Real-time,” in Robotics: Science and Systems X , 2014.
[2] mvBlueFOX Camera Datasheet, https://www.matrix-vision.com/USB2.0-industrial-camera-mvbluefox.html
[3] GoPro Hero Session Camera Datasheet, http://shop.gopro.com/cameras/hero-session/CHDHS-102-master.html
[4] See3Cam Camera Datasheet, https://www.e-consystems.com/See3CAM-USB-3-Camera.asp
[5] Sentera 4k Camera Datasheet, https://sentera.com/product/sentera-double-4k-sensor/
[6] Parrot Sequoia Camera Datasheet, https://www.parrot.com/us/Business-solutions/parrot-sequoia#parrot-sequoia-details
[7] Micasense Red Edge Camera Datasheet, http://www.micasense.com/rededge [8] FLIR Tau 320, http://www.flir.com/cores/display/?id=54717
22