mRNA NGS Data Analysis Report - Exiqon XploreRNA · mRNA NGS Data Analysis Report Project:...
34
mRNA NGS Data Analysis Report Project: Differential expression analysis of hoxa1 Customer: Test Company/Institute: Test Date: Monday, October 12, 2015 Performed by: XploreRNA Exiqon A/S Company Reg. No. (CVR) 18 98 44 31 Skelstedet 16 DK-2950 Vedbæk Denmark Contact information: exiqon.com/contact
Transcript of mRNA NGS Data Analysis Report - Exiqon XploreRNA · mRNA NGS Data Analysis Report Project:...
mRNA NGSData Analysis Report
Project: Differential expression analysis of hoxa1
Customer: Test
Company/Institute: Test
Date: Monday, October 12, 2015
Performed by:XploreRNAExiqon A/SCompany Reg. No. (CVR) 18 98 44 31Skelstedet 16DK-2950 VedbækDenmarkContact information: exiqon.com/contact
EXIQON | mRNA NGS Data Analysis Report | Ref code: 00059-00108
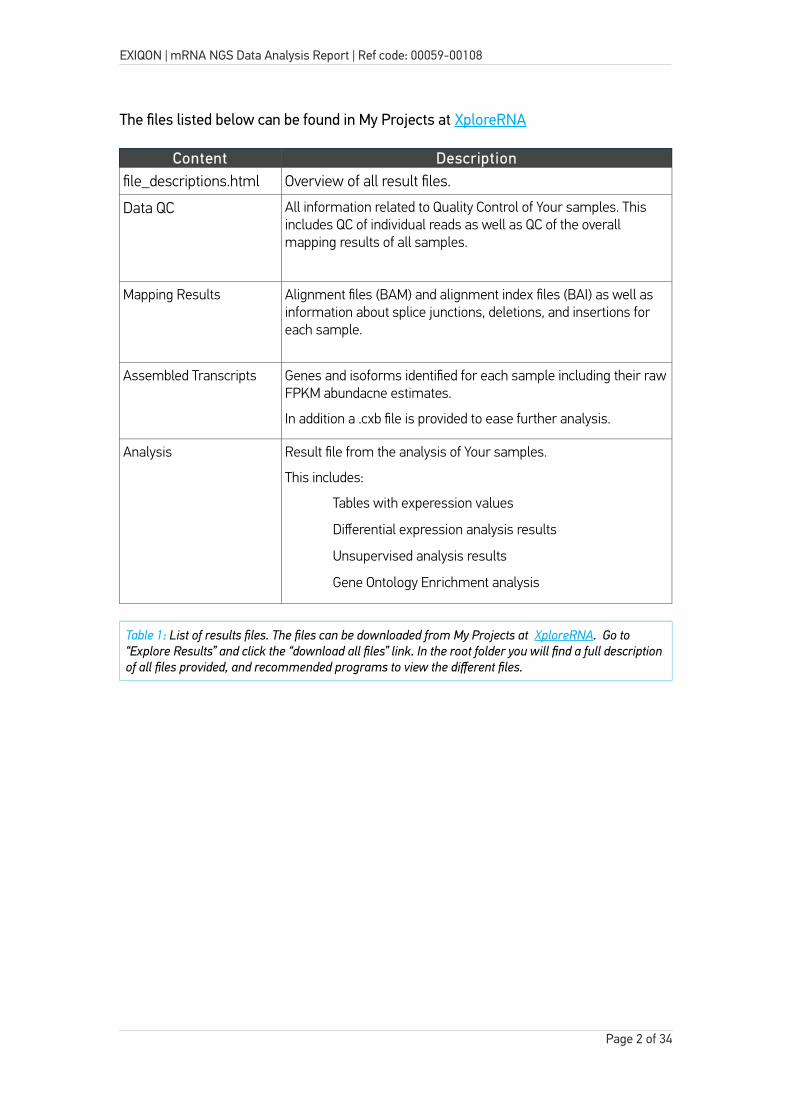
The files listed below can be found in My Projects at XploreRNA
Content Descriptionfile_descriptions.html Overview of all result files.
Data QC All information related to Quality Control of Your samples. This includes QC of individual reads as well as QC of the overall mapping results of all samples.
Mapping Results Alignment files (BAM) and alignment index files (BAI) as well as information about splice junctions, deletions, and insertions for each sample.
Assembled Transcripts Genes and isoforms identified for each sample including their rawFPKM abundacne estimates.
In addition a .cxb file is provided to ease further analysis.
Analysis Result file from the analysis of Your samples.
This includes:
– Tables with experession values
– Differential expression analysis results
– Unsupervised analysis results
– Gene Ontology Enrichment analysis
Table 1: List of results files. The files can be downloaded from My Projects at XploreRNA. Go to “Explore Results” and click the “download all files” link. In the root folder you will find a full descriptionof all files provided, and recommended programs to view the different files.
Page 2 of 34
EXIQON | mRNA NGS Data Analysis Report | Ref code: 00059-00108
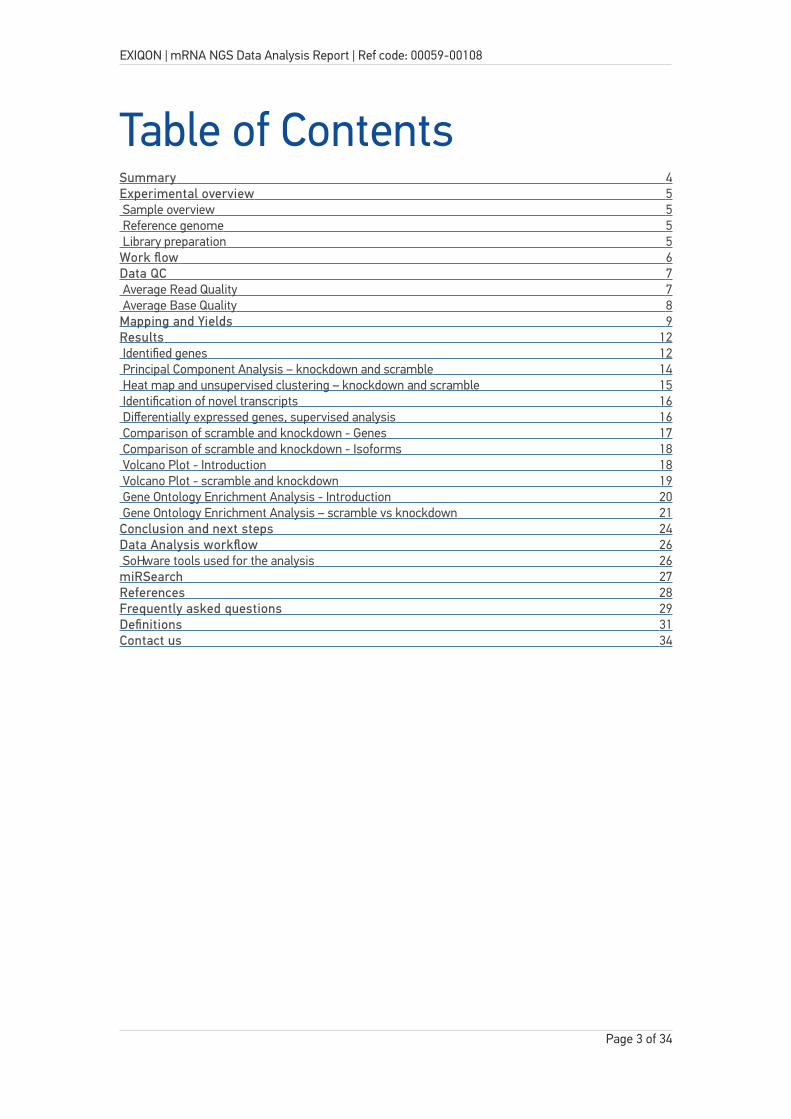
Table of ContentsSummary 4 Experimental overview 5 Sample overview 5 Reference genome 5 Library preparation 5 Work flow 6 Data QC 7 Average Read Quality 7 Average Base Quality 8 Mapping and Yields 9 Results 12 Identified genes 12 Principal Component Analysis – knockdown and scramble 14 Heat map and unsupervised clustering – knockdown and scramble 15 Identification of novel transcripts 16 Differentially expressed genes, supervised analysis 16 Comparison of scramble and knockdown - Genes 17 Comparison of scramble and knockdown - Isoforms 18 Volcano Plot - Introduction 18 Volcano Plot - scramble and knockdown 19 Gene Ontology Enrichment Analysis - Introduction 20 Gene Ontology Enrichment Analysis – scramble vs knockdown 21 Conclusion and next steps 24 Data Analysis workflow 26 Software tools used for the analysis 26 miRSearch 27 References 28 Frequently asked questions 29 Definitions 31 Contact us 34
Page 3 of 34
Summary
Dear Dr. test
We have now finalized the Next Generation Sequencing analysis of the transcripts identified inthe fastq files you have uploaded to XploreRNA.
The principal findings are summarized in this document, including the results of the unsupervised analysis, supervised differential expression analysis and GO enrichment analysis. Additional information, graphs and plots can be found in the files available in My Projects at XploreRNA.
The easiest way to identify relevant targets for downstream validation and further study, is touse the Gene Sorting Wizard in My Projects at XploreRNA. With the wizard you can explore each group comparison and sort the full list of differentially expressed transcripts using all relevant criteria, including expression level, fold change, and statistical significance.
Once you have selected your candidate genes using the Gene Sorting Wizard, you can with just one click order LNA™-enhanced primer sets for qPCR validation, or LNA™ GapmeRs for efficient antisense inhibition of your mRNA or ncRNA targets. The designs are done automatically for the sequences identified in Your sample, so there is no need to upload any additional sequences. LNA™ probes are also available for detection of any mRNA or ncRNA target by In Situ Hybridization or Northern Blotting.
For more information about Exiqon's products for validation and functional analysis of your mRNAs or ncRNAs of interest, please go to: exiqon.com/rna
If you have any questions, please review the Help page XploreRNA.exiqon.com/FAQ
Kind regards,Exiqon A/S
EXIQON | mRNA NGS Data Analysis Report | Ref code: 00059-00108
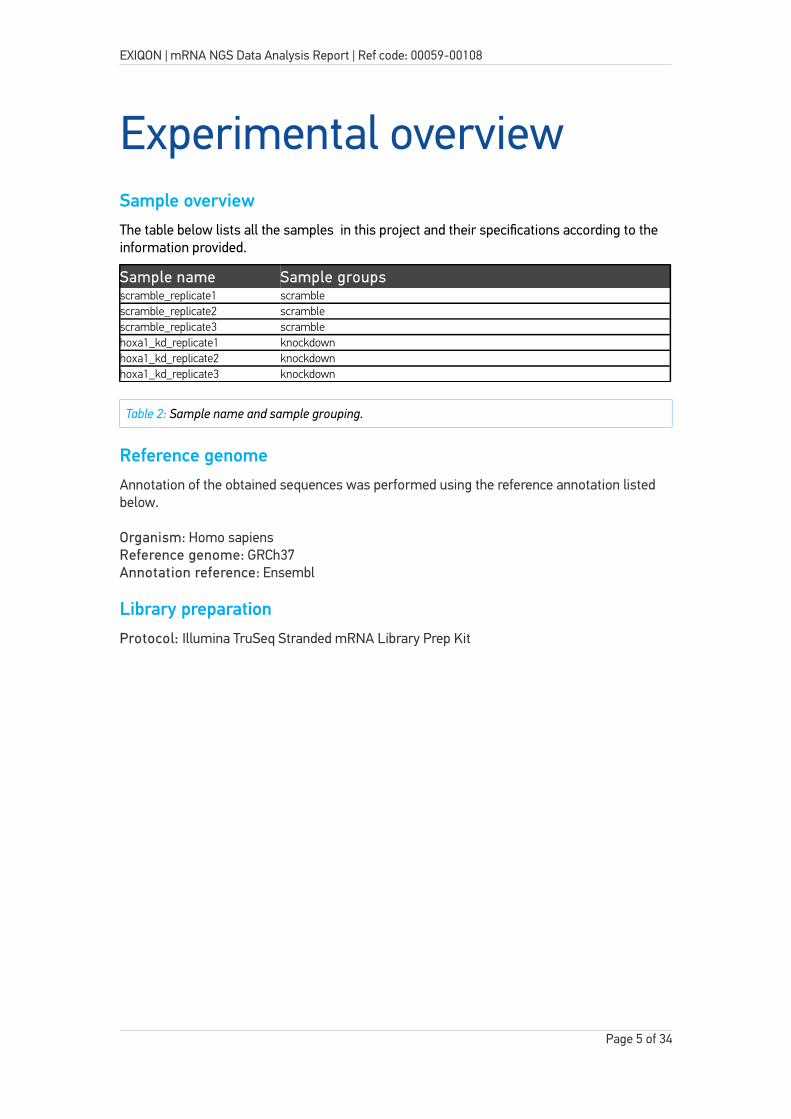
Experimental overviewSample overviewThe table below lists all the samples in this project and their specifications according to the information provided.
Sample name Sample groupsscramble_replicate1 scramblescramble_replicate2 scramblescramble_replicate3 scramblehoxa1_kd_replicate1 knockdownhoxa1_kd_replicate2 knockdownhoxa1_kd_replicate3 knockdown
Table 2: Sample name and sample grouping.
Reference genomeAnnotation of the obtained sequences was performed using the reference annotation listed below. Organism: Homo sapiensReference genome: GRCh37Annotation reference: Ensembl
Library preparationProtocol: Illumina TruSeq Stranded mRNA Library Prep Kit
Page 5 of 34
EXIQON | mRNA NGS Data Analysis Report | Ref code: 00059-00108
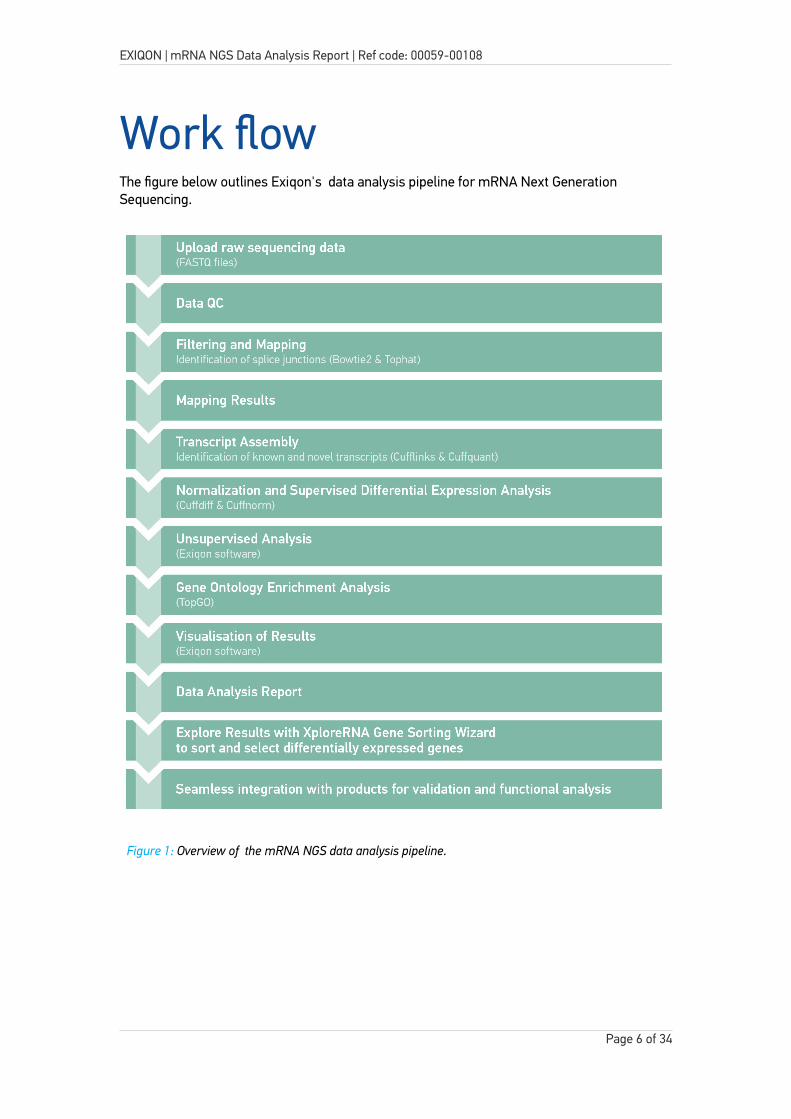
Work flowThe figure below outlines Exiqon's data analysis pipeline for mRNA Next Generation Sequencing.
Page 6 of 34
Figure 1: Overview of the mRNA NGS data analysis pipeline.
EXIQON | mRNA NGS Data Analysis Report | Ref code: 00059-00108
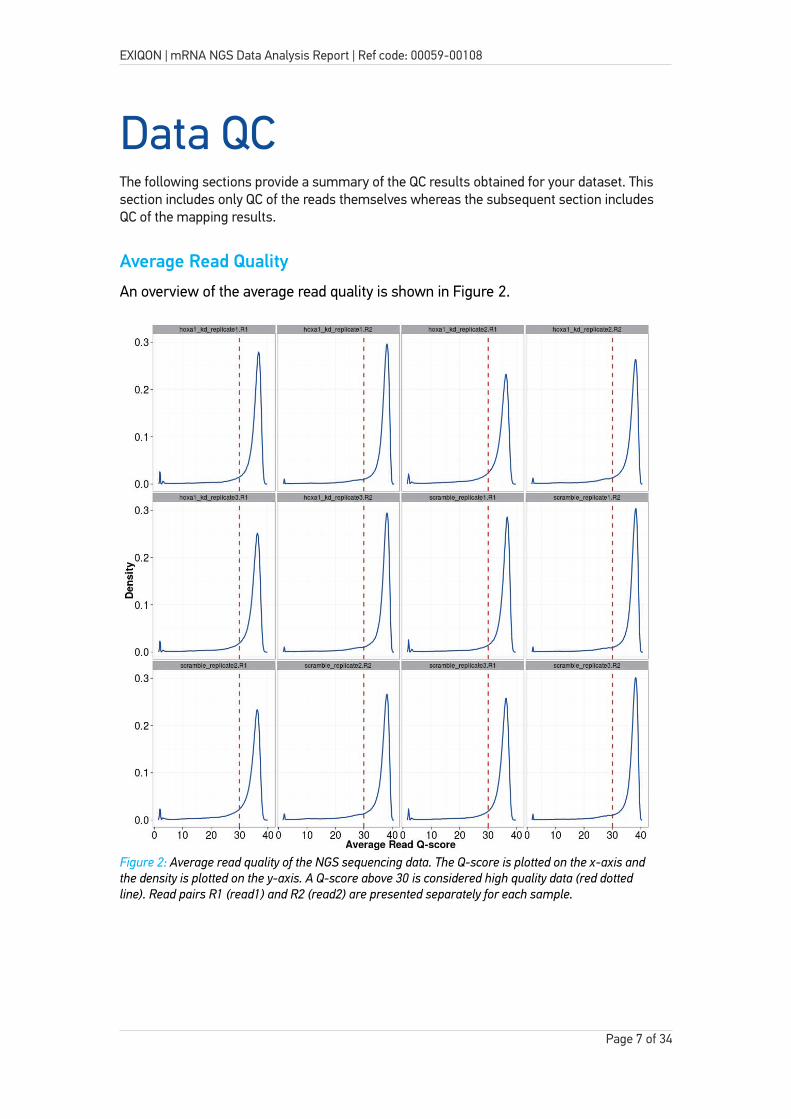
Data QCThe following sections provide a summary of the QC results obtained for your dataset. This section includes only QC of the reads themselves whereas the subsequent section includes QC of the mapping results.
Average Read Quality
An overview of the average read quality is shown in Figure 2.
Page 7 of 34
Figure 2: Average read quality of the NGS sequencing data. The Q-score is plotted on the x-axis and the density is plotted on the y-axis. A Q-score above 30 is considered high quality data (red dotted line). Read pairs R1 (read1) and R2 (read2) are presented separately for each sample.
EXIQON | mRNA NGS Data Analysis Report | Ref code: 00059-00108
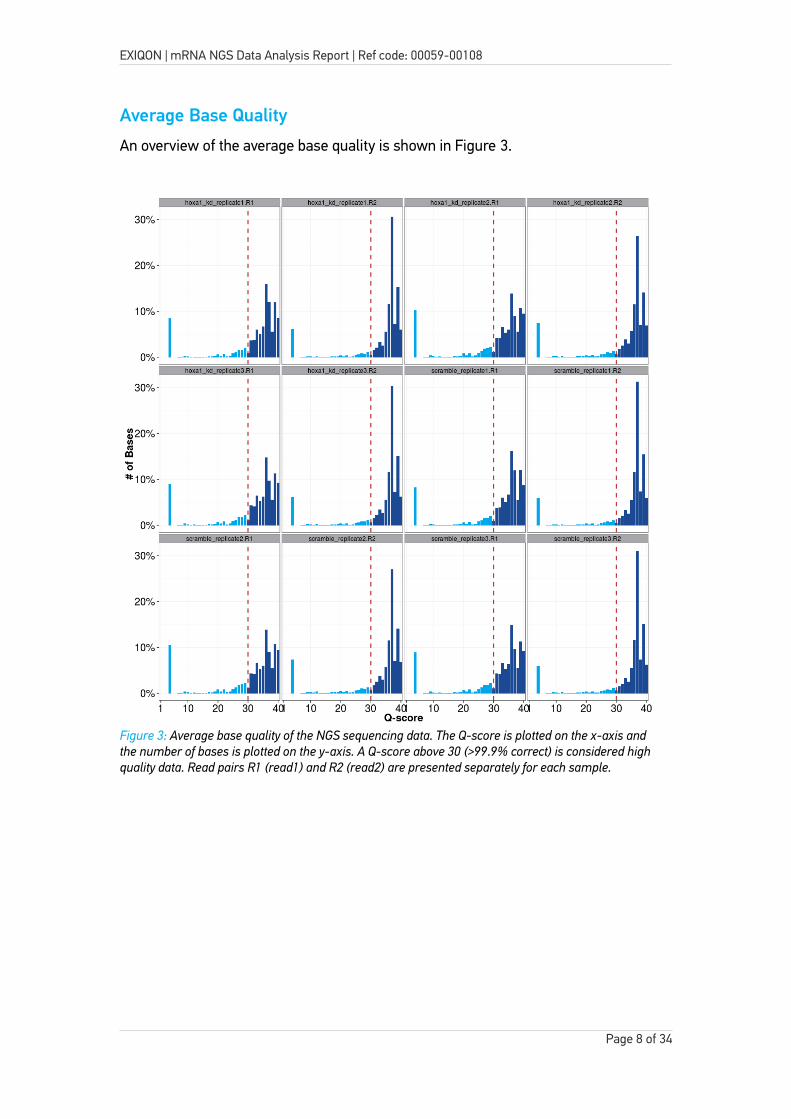
Average Base Quality
An overview of the average base quality is shown in Figure 3.
Page 8 of 34
Figure 3: Average base quality of the NGS sequencing data. The Q-score is plotted on the x-axis and the number of bases is plotted on the y-axis. A Q-score above 30 (>99.9% correct) is considered high quality data. Read pairs R1 (read1) and R2 (read2) are presented separately for each sample.
EXIQON | mRNA NGS Data Analysis Report | Ref code: 00059-00108
Mapping and YieldsMapping of the sequencing data is a useful quality control step in the NGS data analysis pipeline as it can help to evaluate the quality of the samples.
Reads are classified into the following classes:
Mappable reads: aligning to reference genome (including mRNA, pre-mRNA, poly-A tailed lncRNA and pri-miRNA)
Outmapped reads or high abundance reads: For example; rRNA, mtRNA, polyA and PolyChomopolymers
Unmapped reads: no alignment possible
In a typical experiment it is possible to align 60-90% of the reads to the reference genome, However, this number depends upon multiple factors, including the quality of the sample and the coverage of the relevant reference genome; if the sample RNA was degraded, fewer readswill be mRNA or lncRNA specific and more material will be degraded rRNA.
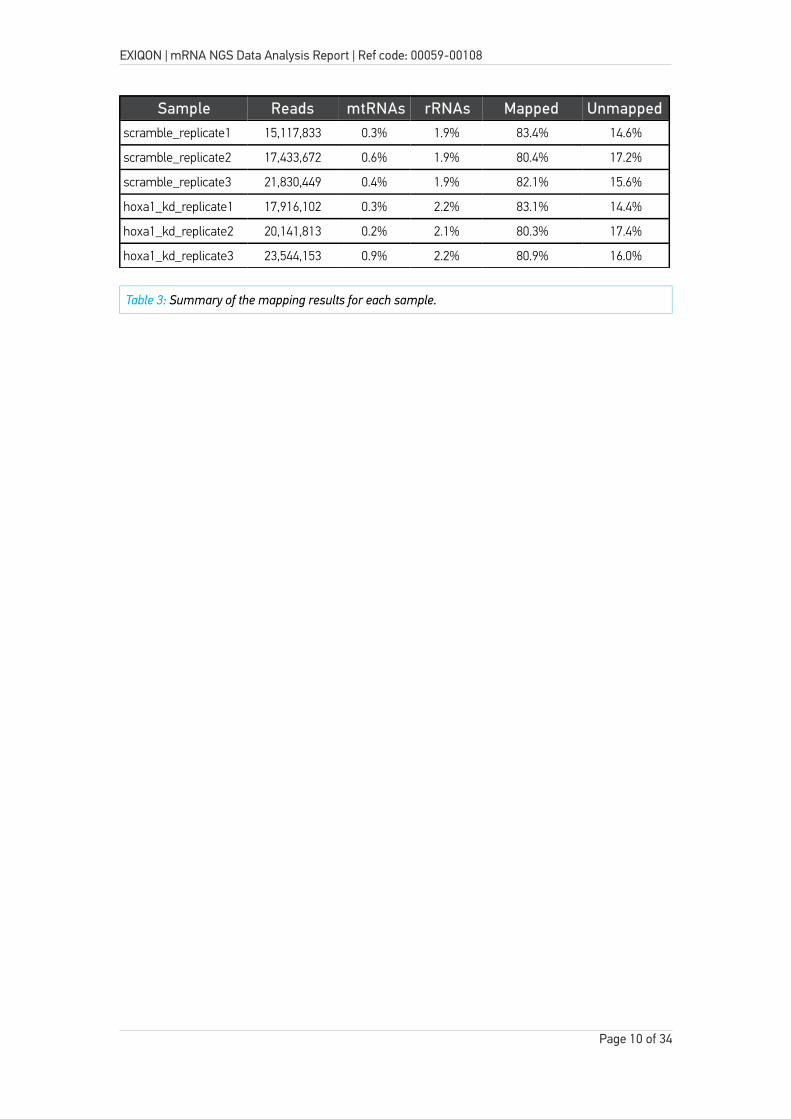
Table 3 and Figure 4 below summarizes the mapping results. In addition to the mapping results, the table below also shows the total number of reads obtained for each sample.
On average 19.3 million reads were obtained for each sample and the average genome mapping rate was 84%.
Page 9 of 34
EXIQON | mRNA NGS Data Analysis Report | Ref code: 00059-00108
Sample Reads mtRNAs rRNAs Mapped Unmappedscramble_replicate1 15,117,833 0.3% 1.9% 83.4% 14.6%
scramble_replicate2 17,433,672 0.6% 1.9% 80.4% 17.2%
scramble_replicate3 21,830,449 0.4% 1.9% 82.1% 15.6%
hoxa1_kd_replicate1 17,916,102 0.3% 2.2% 83.1% 14.4%
hoxa1_kd_replicate2 20,141,813 0.2% 2.1% 80.3% 17.4%
hoxa1_kd_replicate3 23,544,153 0.9% 2.2% 80.9% 16.0%
Table 3: Summary of the mapping results for each sample.
Page 10 of 34
EXIQON | mRNA NGS Data Analysis Report | Ref code: 00059-00108
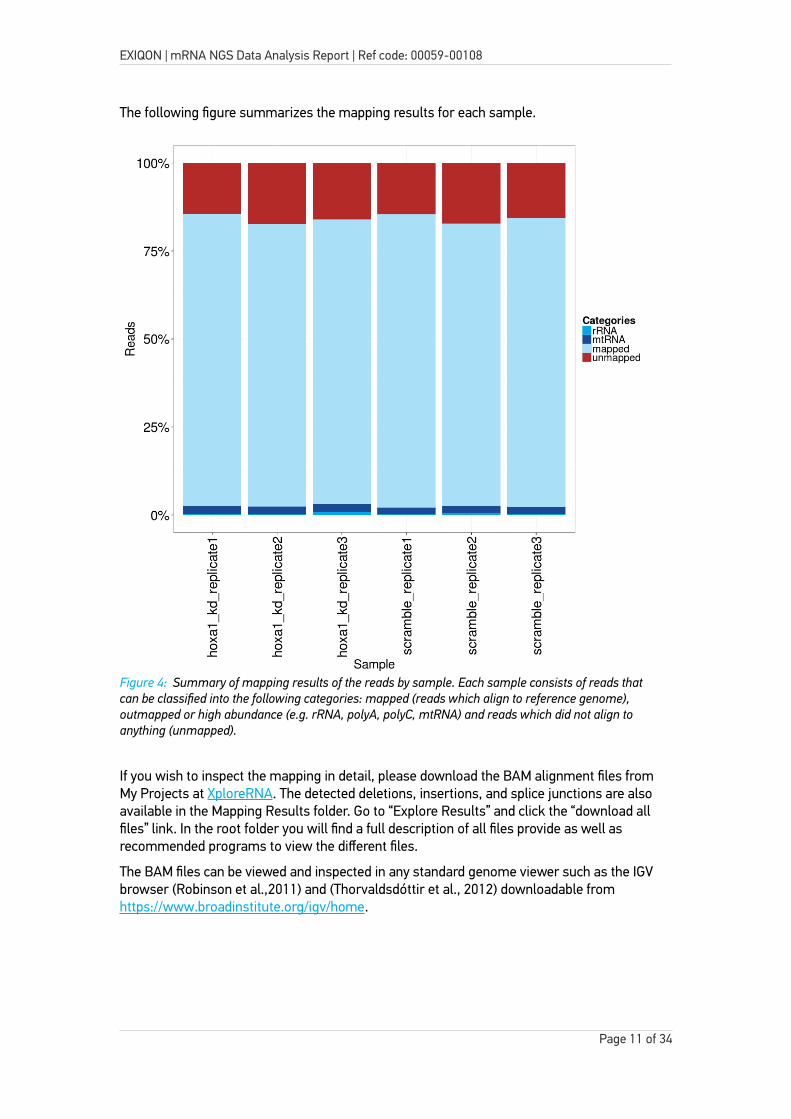
The following figure summarizes the mapping results for each sample.
If you wish to inspect the mapping in detail, please download the BAM alignment files from My Projects at XploreRNA. The detected deletions, insertions, and splice junctions are also available in the Mapping Results folder. Go to “Explore Results” and click the “download all files” link. In the root folder you will find a full description of all files provide as well as recommended programs to view the different files.
The BAM files can be viewed and inspected in any standard genome viewer such as the IGV browser (Robinson et al.,2011) and (Thorvaldsdóttir et al., 2012) downloadable from https://www.broadinstitute.org/igv/home.
Page 11 of 34
Figure 4: Summary of mapping results of the reads by sample. Each sample consists of reads that can be classified into the following categories: mapped (reads which align to reference genome), outmapped or high abundance (e.g. rRNA, polyA, polyC, mtRNA) and reads which did not align to anything (unmapped).
EXIQON | mRNA NGS Data Analysis Report | Ref code: 00059-00108
ResultsBelow you will find a summary of the principal findings for this project. The complete analysismay be found in the associated files listed in Table 1 on page 2. For a detailed description of the data analysis process see the Work flow section in this report (page 6).
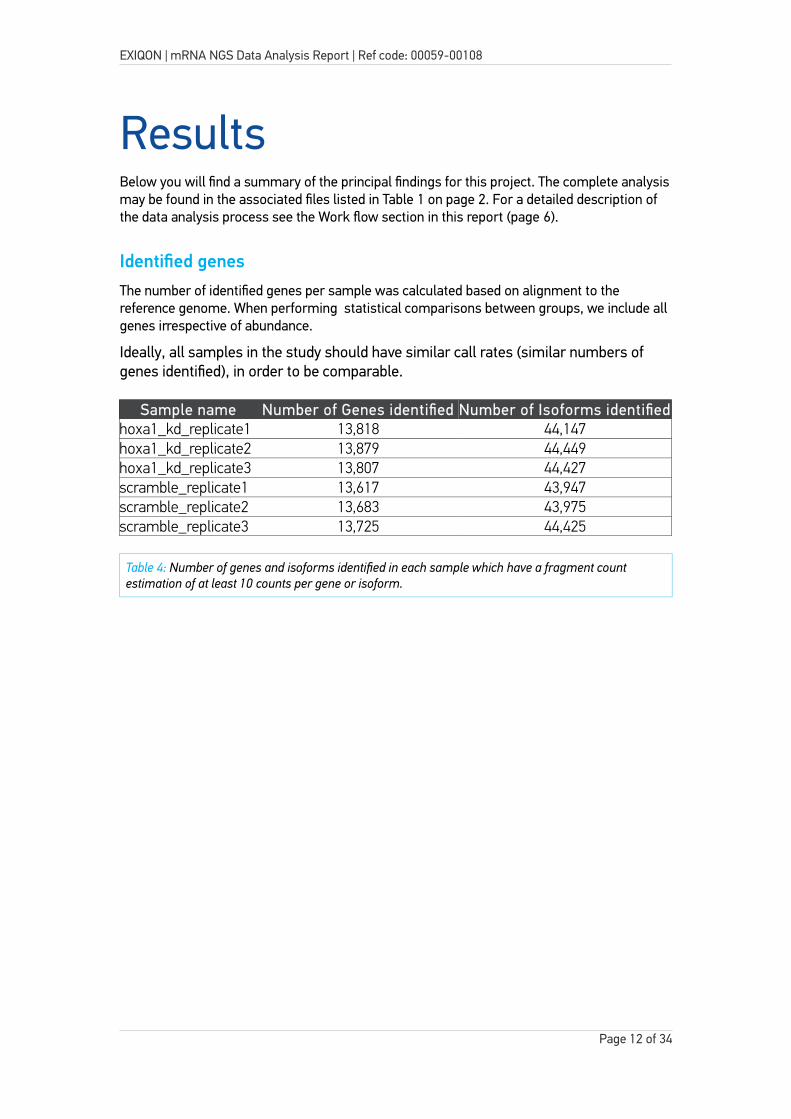
Identified genesThe number of identified genes per sample was calculated based on alignment to the reference genome. When performing statistical comparisons between groups, we include all genes irrespective of abundance.
Ideally, all samples in the study should have similar call rates (similar numbers of genes identified), in order to be comparable.
Sample name Number of Genes identified Number of Isoforms identifiedhoxa1_kd_replicate1 13,818 44,147hoxa1_kd_replicate2 13,879 44,449hoxa1_kd_replicate3 13,807 44,427scramble_replicate1 13,617 43,947scramble_replicate2 13,683 43,975scramble_replicate3 13,725 44,425
Table 4: Number of genes and isoforms identified in each sample which have a fragment count estimation of at least 10 counts per gene or isoform.
Page 12 of 34
EXIQON | mRNA NGS Data Analysis Report | Ref code: 00059-00108
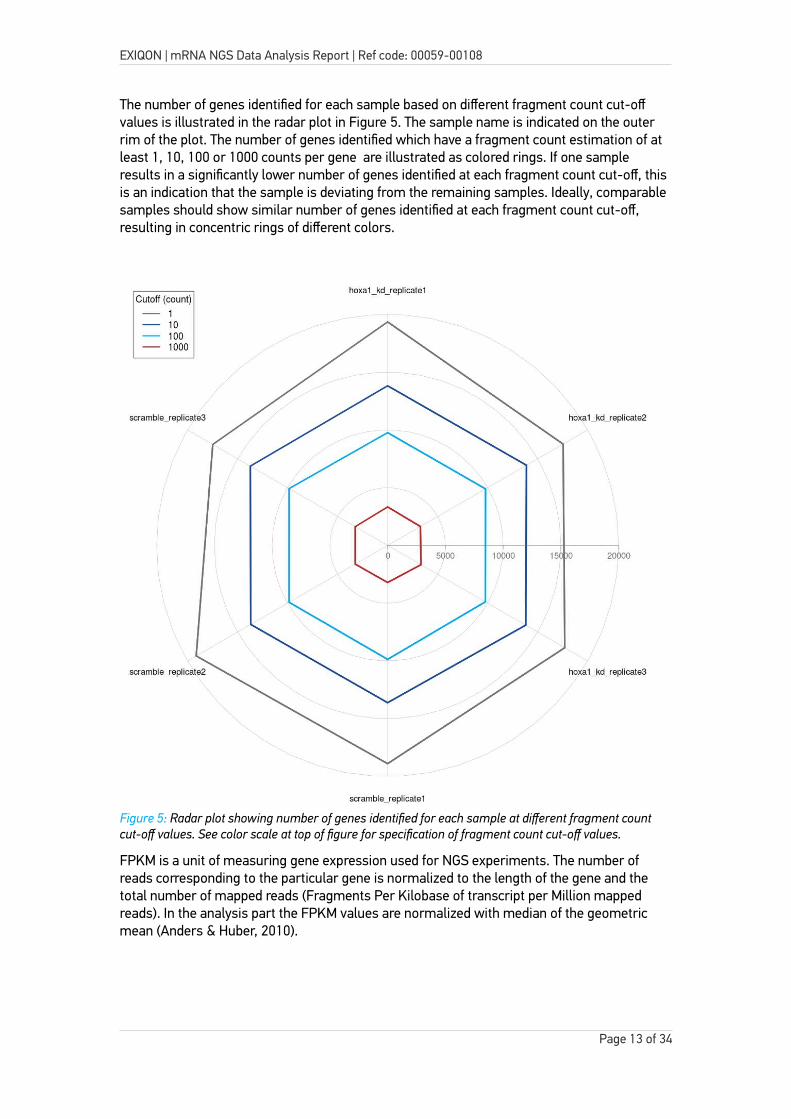
The number of genes identified for each sample based on different fragment count cut-off values is illustrated in the radar plot in Figure 5. The sample name is indicated on the outer rim of the plot. The number of genes identified which have a fragment count estimation of at least 1, 10, 100 or 1000 counts per gene are illustrated as colored rings. If one sample results in a significantly lower number of genes identified at each fragment count cut-off, this is an indication that the sample is deviating from the remaining samples. Ideally, comparable samples should show similar number of genes identified at each fragment count cut-off, resulting in concentric rings of different colors.
FPKM is a unit of measuring gene expression used for NGS experiments. The number of reads corresponding to the particular gene is normalized to the length of the gene and the total number of mapped reads (Fragments Per Kilobase of transcript per Million mapped reads). In the analysis part the FPKM values are normalized with median of the geometric mean (Anders & Huber, 2010).
Page 13 of 34
Figure 5: Radar plot showing number of genes identified for each sample at different fragment countcut-off values. See color scale at top of figure for specification of fragment count cut-off values.
EXIQON | mRNA NGS Data Analysis Report | Ref code: 00059-00108
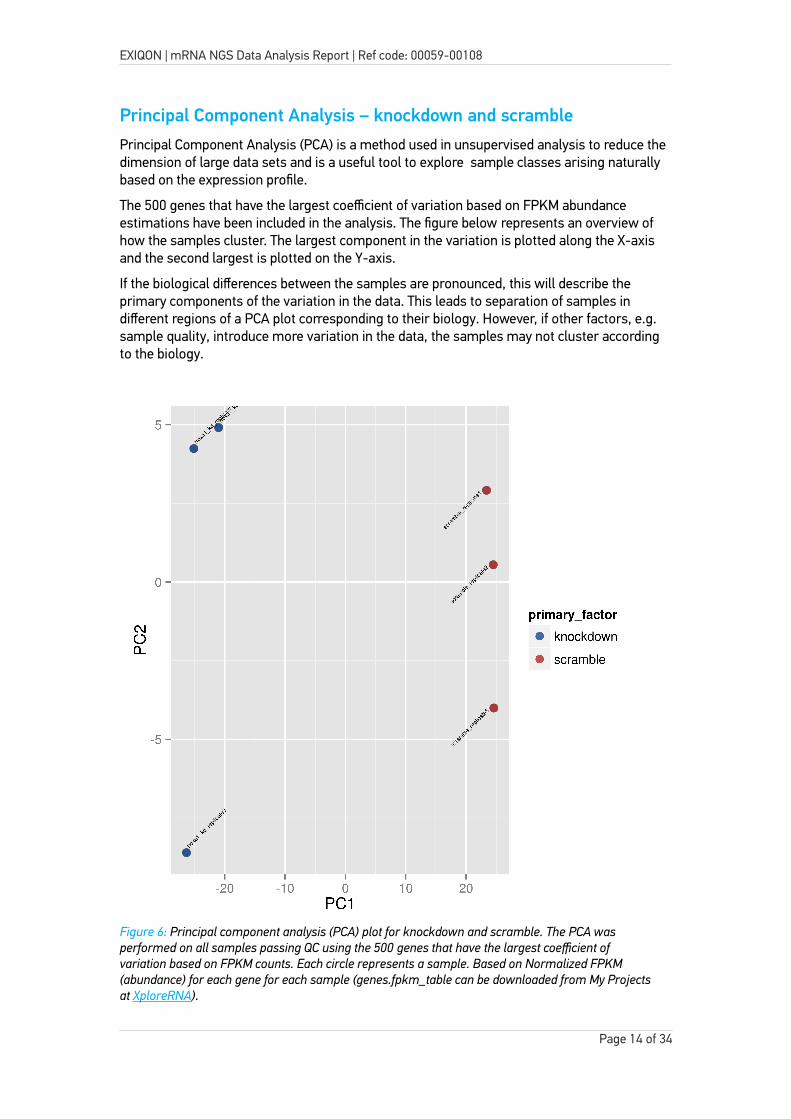
Principal Component Analysis – knockdown and scramblePrincipal Component Analysis (PCA) is a method used in unsupervised analysis to reduce the dimension of large data sets and is a useful tool to explore sample classes arising naturally based on the expression profile.
The 500 genes that have the largest coefficient of variation based on FPKM abundance estimations have been included in the analysis. The figure below represents an overview of how the samples cluster. The largest component in the variation is plotted along the X-axis and the second largest is plotted on the Y-axis.
If the biological differences between the samples are pronounced, this will describe the primary components of the variation in the data. This leads to separation of samples in different regions of a PCA plot corresponding to their biology. However, if other factors, e.g. sample quality, introduce more variation in the data, the samples may not cluster according to the biology.
Page 14 of 34
Figure 6: Principal component analysis (PCA) plot for knockdown and scramble. The PCA was performed on all samples passing QC using the 500 genes that have the largest coefficient of variation based on FPKM counts. Each circle represents a sample. Based on Normalized FPKM (abundance) for each gene for each sample (genes.fpkm_table can be downloaded from My Projects at XploreRNA).
EXIQON | mRNA NGS Data Analysis Report | Ref code: 00059-00108
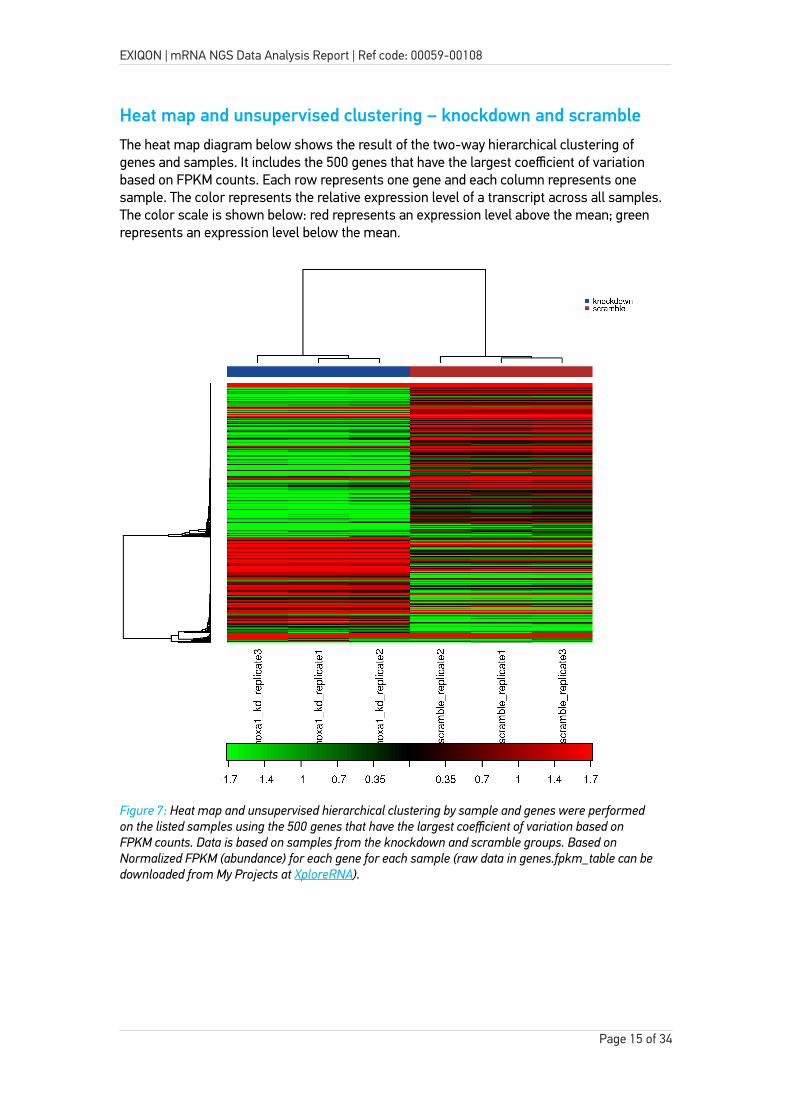
Heat map and unsupervised clustering – knockdown and scrambleThe heat map diagram below shows the result of the two-way hierarchical clustering of genes and samples. It includes the 500 genes that have the largest coefficient of variation based on FPKM counts. Each row represents one gene and each column represents one sample. The color represents the relative expression level of a transcript across all samples. The color scale is shown below: red represents an expression level above the mean; green represents an expression level below the mean.
Page 15 of 34
Figure 7: Heat map and unsupervised hierarchical clustering by sample and genes were performed on the listed samples using the 500 genes that have the largest coefficient of variation based on FPKM counts. Data is based on samples from the knockdown and scramble groups. Based on Normalized FPKM (abundance) for each gene for each sample (raw data in genes.fpkm_table can bedownloaded from My Projects at XploreRNA).
EXIQON | mRNA NGS Data Analysis Report | Ref code: 00059-00108
Identification of novel transcriptsDuring the transcriptome assembly process, both known and novel transcripts are identified. A novel transcript is characterized as a transcript which contains features not present in the reference annotation. Thus, a novel transcript can be both a new isoform of a known gene or a transcript without any known features. For example, a novel transcript could be the result of a previously unknown splicing event for a known gene or a previously unknown long non-coding RNA.
Identification of novel transcripts depends upon the reference annotation. Transcripts not partof the reference genome used for annotation will be classified as novel. In the results files we classify novel transcripts with known features by listing the known transcripts most closely resembling the novel transcript. For novel transcripts without any known features we provide a locally unique name as transcript identifier. In addition, we provide the genomic positions for the features of the novel transcript, e.g. the location and number of exons.
lncRNA identification and annotation is at a preliminary stage (Mattick et al., 2015). Therefore we recommend referring to RNACentral (http://rnacentral.org) or GENCODE (http://www.gencodegenes.org) to investigate potentially novel lncRNAs identified in your study.
A list of differntially expressed novel isoforms can be found in this report, and the full list of differentially expressed isoforms are available in My Projects at XploreRNA. Go to “Explore Results” and click the “download all files” link. In the root folder you will find a full description of all files provide, and recommended programs to view the different files.
The table annotations are complex but a good reference is presented in the Cufflinks manual accessible at http://cole-trapnell-lab.github.io/cufflinks/manual/ .
Differentially expressed genes, supervised analysisTo identify differentially expressed genes, it is assumed that the number of reads produced byeach transcript is proportional to both its size and abundance. Exiqon Services has customized the analysis pipeline based on the Tuxedo suite, including the Cufflinks, Cuffmerge and Cuffdiff steps of the Tuxedo pipeline. For more details see Data Analysis work flow on page 6.
Page 16 of 34
EXIQON | mRNA NGS Data Analysis Report | Ref code: 00059-00108
Comparison of scramble and knockdown - GenesThe table below shows the individual results for the top 20 most significantly differentially expressed genes. A full list of the differentially expressed genes is available as a .tsv file in MyProjects at XploreRNA.
Gene ID Gene Locus scrambleFPKM
knockdownFPKM
Log2 Foldchange
q_value
XLOC_037055 AREG 4:75310850-75320726 0.43 63.12 7.21 0.000189906XLOC_027733 U6 2:128601137-128615731 171.06 2.63 -6.02 0.000189906XLOC_019256 AC137934.1 16:90252404-90289086 0.18 10.1 5.84 0.000189906XLOC_004524 PTGS2 1:186640922-186649559 0.77 43.78 5.83 0.000189906XLOC_030606 BMP2 20:6748310-6760910 0.87 40.34 5.54 0.000189906XLOC_041849 RP1-67M12.2 6:22113562-22196366 0.02 0.84 5.41 0.0119968XLOC_048200 ANGPT2 8:6261071-6565730 0.03 1.25 5.21 0.000189906XLOC_007698 C11orf96 11:43942608-44022707 0.58 15.23 4.72 0.000189906XLOC_013906 DACH1 13:72012097-72441330 0.25 6.49 4.67 0.000189906XLOC_045333 KCND2 7:119913721-120392568 0.1 2.35 4.53 0.000189906XLOC_012489 SLC6A15 12:85253491-85307394 3.59 82.28 4.52 0.000189906XLOC_013938 EDNRB 13:78469615-78493903 0.15 3.31 4.46 0.000189906XLOC_013755 VWA8 13:42140960-42535256 5.37 112.99 4.39 0.000189906XLOC_029562 IL1B 2:113587327-113594480 1.09 22.76 4.39 0.000189906XLOC_029829 NR4A2 2:157180943-157198860 1.23 23.86 4.27 0.000189906XLOC_008455 GRIA4 11:105480720-105852819 0.65 12.53 4.27 0.000189906XLOC_024561 GDF15 19:18485540-18499987 26.61 512.04 4.27 0.000189906XLOC_007501 INSC 11:15133969-15268754 0.95 17.92 4.23 0.000189906XLOC_017466 BMF 15:40380090-40401093 1.36 24.84 4.19 0.000189906XLOC_008642 VWA5A 11:123986068-124018428 2.02 36.14 4.16 0.000189906
Table 5: Genes: Table of the 20 most significantly differentially expressed genes. scramble and knockdown columns are group average FPKM values. FPKM is a unit of measuring gene expression (Fragments Per Kilobase of transcript per Million mapped reads). Transcripts with the highest fold change between groups are shown at the top of the table. Fold change is the log2 fold change of the FPKM between groups scramble and knockdown. q-values shown are p-values that have been adjusted using the Benjamini-Hochberg False Discovery Rate (FDR) approach to correct for multiple testing. As a general guide, fold changes with q-values below 0.05 may be considered significant. Thefull list of differentially expressed isoforms is available as a .tsv file in My Projects at XploreRNA.
Page 17 of 34
EXIQON | mRNA NGS Data Analysis Report | Ref code: 00059-00108
Comparison of scramble and knockdown - IsoformsThe table below shows the individual results for the top 20 most significantly differentially expressed isoforms (both known and novel). A full list of differentially expressed isoforms is available as a .tsv file in My Projects at XploreRNA.
Isoform ID Gene Locus scrambleFPKM
knockdownFPKM
Log2 FoldChange
q_value
XLOC_037055 AREG 4:75310850-75320726 0.43 62.98 7.2 0.000668626XLOC_029829 NR4A2 2:157180943-157198860 0.17 17.22 6.69 0.0265621XLOC_004524 PTGS2 1:186640922-186649559 0.38 34.44 6.52 0.000668626XLOC_008455 GRIA4 11:105480720-105852819 0.04 3.13 6.31 0.00184051XLOC_012489 SLC6A15 12:85253491-85307394 0.17 12.06 6.15 0.000668626XLOC_031658 FAM65C 20:49202644-49308083 0.15 9.22 5.9 0.00442161XLOC_012489 SLC6A15 12:85253491-85307394 0.85 43.31 5.67 0.000668626XLOC_030606 BMP2 20:6748310-6760910 0.87 40.34 5.54 0.000668626XLOC_007698 C11orf96 11:43942608-44022707 0.37 15.1 5.35 0.000668626XLOC_019146 HSD17B2 16:82068608-82173236 0.28 10.88 5.28 0.000668626XLOC_017466 BMF 15:40380090-40401093 0.32 12.13 5.24 0.000668626XLOC_013906 DACH1 13:72012097-72441330 0.11 4.22 5.22 0.000668626XLOC_013938 EDNRB 13:78469615-78493903 0.08 2.57 5.04 0.000668626XLOC_045333 KCND2 7:119913721-120392568 0.06 1.83 4.99 0.000668626XLOC_008642 VWA5A 11:123986068-124018428 0.81 25.29 4.96 0.000668626XLOC_029562 IL1B 2:113587327-113594480 0.91 22.28 4.61 0.000668626XLOC_012489 SLC6A15 12:85253491-85307394 0.95 22.26 4.56 0.000668626XLOC_000665 CDC20 1:43824625-43828874 4.96 0.21 -4.54 0.0465958XLOC_019301 UNKL 16:1401923-1464752 0.11 2.46 4.51 0.0113419XLOC_027787 AC093838.4 2:132250385-132279145 0.03 0.75 4.44 0.049455
Table 6: Isoforms: Table of the 20 most significantly differentially expressed isoforms (known and novel). scramble and knockdown columns are group average FPKM values. FPKM is a unit of measuring gene expression (Fragments Per Kilobase of transcript per Million mapped reads). Isoforms with the highest fold change between groups are shown at the top of the table. Fold change is the log2 fold change of the FPKM between groups scramble and knockdown. q-values shown are p-values that have been adjusted using the Benjamini-Hochberg False Discovery Rate (FDR) approach to correct for multiple testing. As a general guide, fold changes with q-values below 0.05 may be considered significant. The full list of differentially expressed isoforms is available as a .tsv filein My Projects at XploreRNA.
Volcano Plot - Introduction
The Volcano plot provides a way to perform a quick visual identification of the genes displaying large-magnitude changes which are also statistically significant. The plot is constructed by plotting -log10(p-value) on the y-axis, and the expression fold change between the two experimental groups on the x-axis. There are two regions of interest in the plot: those points that are found towards the top of the plot (high statistical significance) and at the extreme left or right (strongly down and up-regulated respectively).
Page 18 of 34
EXIQON | mRNA NGS Data Analysis Report | Ref code: 00059-00108
Volcano Plot - scramble and knockdown
Genes that pass the filtering of q-value <0.05 are indicated on the plot (red). For the present study, 6,710 genes pass this filtering.
Page 19 of 34
Figure 8: Volcano plot showing the relationship between the p-values and the log2 fold change in normalized expression (FPKM) between scramble and knockdown. Data is based on Normalized FPKM (abundance) for each gene for each sample (gene_exp.diff available in My Projects at XploreRNA).
EXIQON | mRNA NGS Data Analysis Report | Ref code: 00059-00108
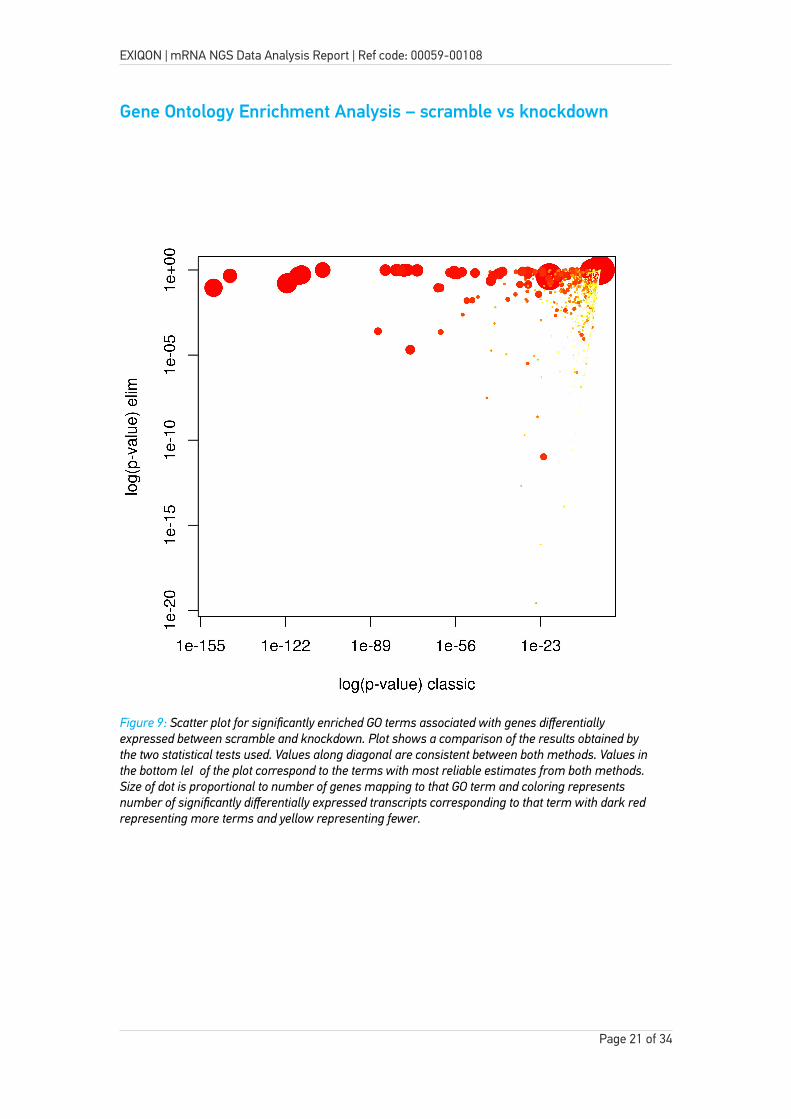
Gene Ontology Enrichment Analysis - IntroductionGene Ontology (GO - Gene Ontology Consortium, 2000) is an initiative to describe genes, geneproducts and their attributes using vocabulary (GO terms) which is unified and controlled across all species. This enables functional interpretation of experimental data using GO terms, for example via enrichment analysis. We use Gene Ontology enrichment analysis to investigate whether specific GO terms are more likely to be associated with the differentially expressed transcripts. Two different statistical tests are used and compared. Firstly, a standard Fisher’s test is used to investigate enrichment of terms between the two groups. Secondly, the ‘Elim’ method takes a more conservative approach by incorporating the topology of the GO network to compensate for local dependencies between GO which can mask significant GO terms. Comparisons of the predictions from these two methods can highlight truly relevant GO terms.
The figure below shows a comparison of the results for the GO (Biological process) terms associated with the significantly differentially expressed transcripts that were identified between the two groups. Complete GO enrichment analysis for all of the comparisons, including Cellular component (CC) and Molecular functions (MF) analysis, is available in My Projects at XploreRNA.
Page 20 of 34
EXIQON | mRNA NGS Data Analysis Report | Ref code: 00059-00108
Gene Ontology Enrichment Analysis – scramble vs knockdown
Page 21 of 34
Figure 9: Scatter plot for significantly enriched GO terms associated with genes differentially expressed between scramble and knockdown. Plot shows a comparison of the results obtained by the two statistical tests used. Values along diagonal are consistent between both methods. Values in the bottom left of the plot correspond to the terms with most reliable estimates from both methods. Size of dot is proportional to number of genes mapping to that GO term and coloring represents number of significantly differentially expressed transcripts corresponding to that term with dark red representing more terms and yellow representing fewer.
EXIQON | mRNA NGS Data Analysis Report | Ref code: 00059-00108
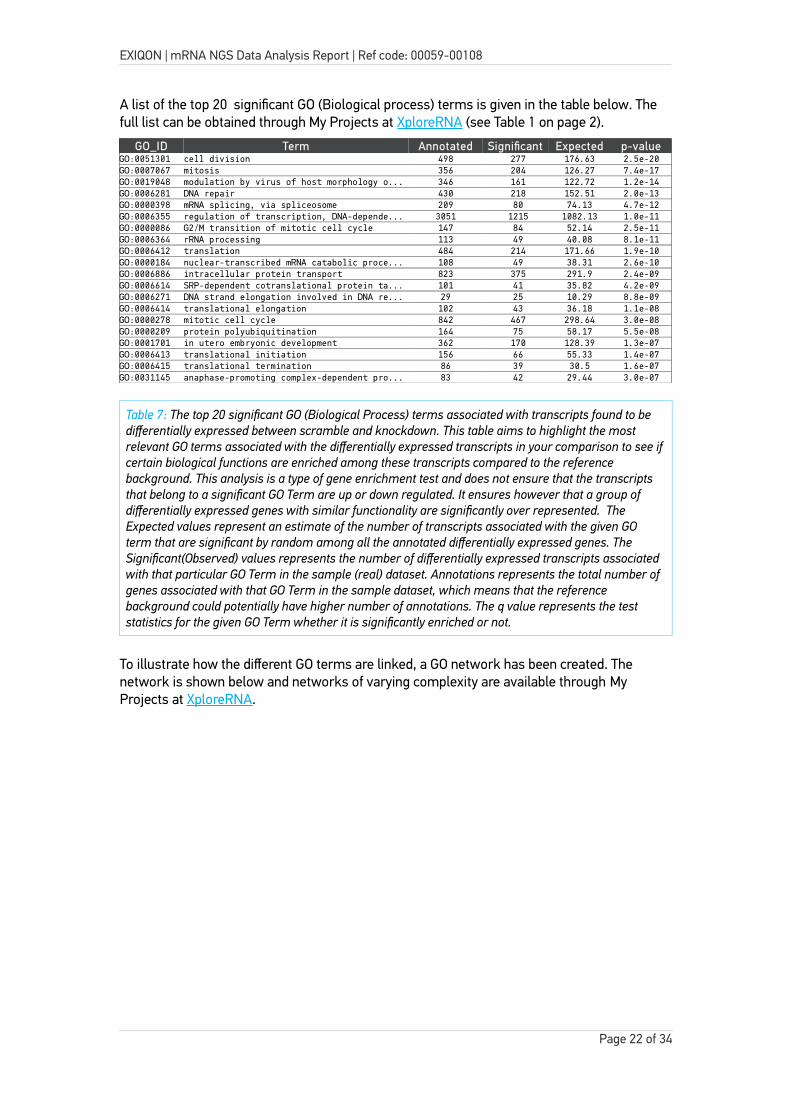
A list of the top 20 significant GO (Biological process) terms is given in the table below. The full list can be obtained through My Projects at XploreRNA (see Table 1 on page 2).
GO_ID Term Annotated Significant Expected p-valueGO:0051301 cell division 498 277 176.63 2.5e-20GO:0007067 mitosis 356 204 126.27 7.4e-17GO:0019048 modulation by virus of host morphology o... 346 161 122.72 1.2e-14GO:0006281 DNA repair 430 218 152.51 2.0e-13GO:0000398 mRNA splicing, via spliceosome 209 80 74.13 4.7e-12GO:0006355 regulation of transcription, DNA-depende... 3051 1215 1082.13 1.0e-11GO:0000086 G2/M transition of mitotic cell cycle 147 84 52.14 2.5e-11GO:0006364 rRNA processing 113 49 40.08 8.1e-11GO:0006412 translation 484 214 171.66 1.9e-10GO:0000184 nuclear-transcribed mRNA catabolic proce... 108 49 38.31 2.6e-10GO:0006886 intracellular protein transport 823 375 291.9 2.4e-09GO:0006614 SRP-dependent cotranslational protein ta... 101 41 35.82 4.2e-09GO:0006271 DNA strand elongation involved in DNA re... 29 25 10.29 8.8e-09GO:0006414 translational elongation 102 43 36.18 1.1e-08GO:0000278 mitotic cell cycle 842 467 298.64 3.0e-08GO:0000209 protein polyubiquitination 164 75 58.17 5.5e-08GO:0001701 in utero embryonic development 362 170 128.39 1.3e-07GO:0006413 translational initiation 156 66 55.33 1.4e-07GO:0006415 translational termination 86 39 30.5 1.6e-07GO:0031145 anaphase-promoting complex-dependent pro... 83 42 29.44 3.0e-07
Table 7: The top 20 significant GO (Biological Process) terms associated with transcripts found to be differentially expressed between scramble and knockdown. This table aims to highlight the most relevant GO terms associated with the differentially expressed transcripts in your comparison to see ifcertain biological functions are enriched among these transcripts compared to the reference background. This analysis is a type of gene enrichment test and does not ensure that the transcripts that belong to a significant GO Term are up or down regulated. It ensures however that a group of differentially expressed genes with similar functionality are significantly over represented. The Expected values represent an estimate of the number of transcripts associated with the given GO term that are significant by random among all the annotated differentially expressed genes. The Significant(Observed) values represents the number of differentially expressed transcripts associated with that particular GO Term in the sample (real) dataset. Annotations represents the total number of genes associated with that GO Term in the sample dataset, which means that the reference background could potentially have higher number of annotations. The q value represents the test statistics for the given GO Term whether it is significantly enriched or not.
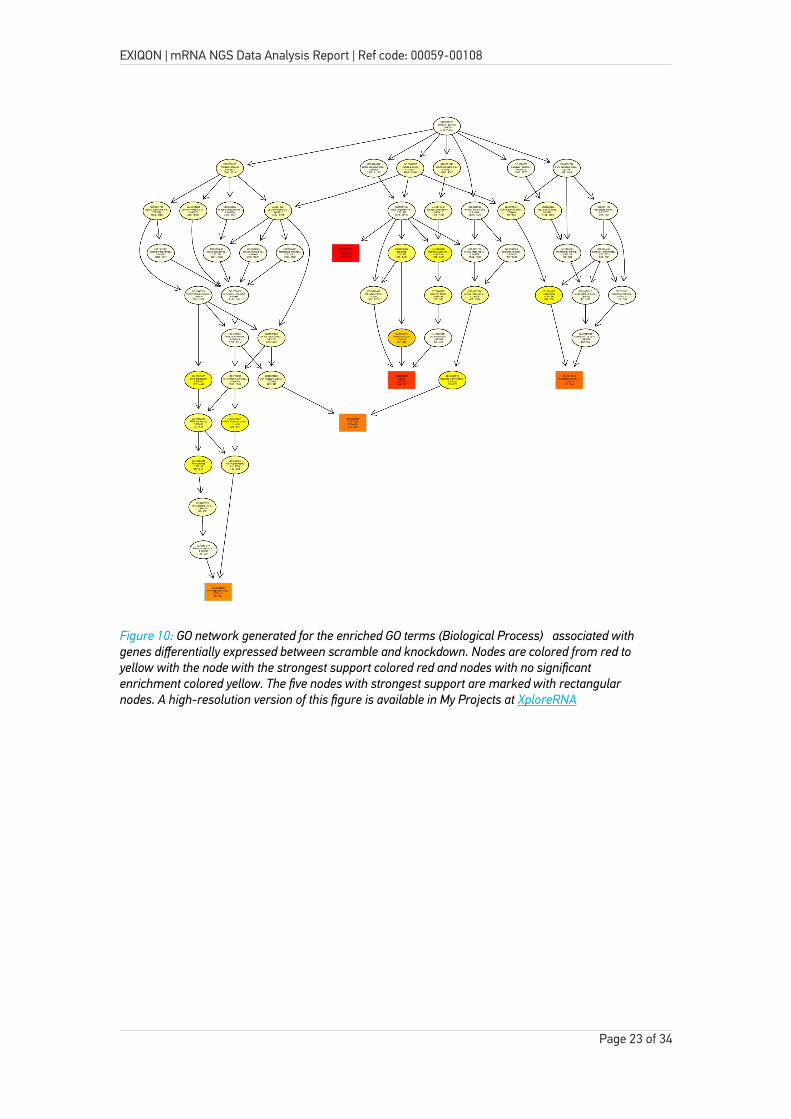
To illustrate how the different GO terms are linked, a GO network has been created. The network is shown below and networks of varying complexity are available through My Projects at XploreRNA.
Page 22 of 34
EXIQON | mRNA NGS Data Analysis Report | Ref code: 00059-00108
Page 23 of 34
Figure 10: GO network generated for the enriched GO terms (Biological Process) associated with genes differentially expressed between scramble and knockdown. Nodes are colored from red to yellow with the node with the strongest support colored red and nodes with no significant enrichment colored yellow. The five nodes with strongest support are marked with rectangular nodes. A high-resolution version of this figure is available in My Projects at XploreRNA
Conclusion and next stepsThe analysis of your RNA Next Generation Sequencing data has been completed.
There are many considerations when deciding which of the differentially expressed transcripts to validate and study further. First of all it is important to be sure that the NGS dataset is of good quality, and that there are no sources of experimental or technical variation that may confound the results.
Data quality• Ensure that the data for all samples passed all of the QC metrics, with a high Q-score,
indicating good technical performance of the NGS experiment.
• A high percentage of the reads should be mappable to the reference genome, indicating high quality samples.
Do samples cluster according to biological groups?
• The unsupervised analysis will reveal if the samples cluster according to their biological groups, indicating that the sample groups are responsible for the largest variation on the samples.
• If the samples do not cluster according to biological groups, consider any other possible sources of experimental or technical variation in the experiment.
Use the Gene Sorting Wizard at XploreRNA to select candidates for downstream validationThe easiest way to select your candidates for validation and further study is using the Gene Sorting Wizard in My Projects at XploreRNA. There you can explore each group comparison and sort the full list of differentially expressed genes using all relevant criteria, including expression level, fold change, and statistical significance. Below are some general considerations when selecting candidates for validation and further study.
• Fold change. Smaller fold changes tend to be more affected by technical variance, and hence may be at greater risk of false-positive signals. To study transcripts with small fold changes, considerably more technical or biological replicates should be included in the validation.
• Expression level. When navigating through these data, counts lower than 1-5 FPKM (on average) per group might be difficult to validate in a qPCR experiment.
• Statistical significance. Fold changes with adjusted p-values (q-values) below 0.05 may be considered significant, and have a greater chance of being validated by qPCR.
• Novel transcripts. Many of the novel transcripts identified may be novel isoforms of known transcripts, or alternative start sites of known transcripts. Potentially novel lncRNAs identified may be further investigated using specialised lncRNA resources e.g. RNACentral (http://rnacentral.org) or GENCODE (http://www.gencodegenes.org).
• Reference genes. NGS data can also be used to identify stably expressed transcripts that may be used as reference genes for normalization in qPCR validation experiments. Genes that are stably expressed across all samples can be identified using e.g. NormFinder (www.mdl.dk) or geNorm (Vandesompele et al., 2002).
Validating your NGS results by qPCR and ISH • qPCR. Ordering qPCR primers for your candidate genes could not be easier. Simply select
your shortlist of genes for validation using the Gene Sorting Wizard at XploreRNA, click “design qPCR primers” and use Exiqon's web tool to design LNA™-enhanced primer sets for your mRNAs or ncRNAs of interest. The design is done automatically, so there is no need to upload any sequences. For more information about Exiqon's LNA™ qPCR system,please go to Exiqon custom LNA qPCR:
• ISH and Northern blotting. LNA™ detection probes are available for any mRNA or ncRNA. For more information please go to Exiqon mRNA ISH
Functional Analysis • Silencing your candidate genes. You can easily order Antisense LNA™ GapmeRs for
potent and specific knockdown of your candidate genes. Simply select your shortlist of genes using the Gene Sorting Wizard at XploreRNA, click “design GapmeRs” and use Exiqon's online tool to design LNA™ GapmeRs for your mRNAs or ncRNAs of interest. Thedesign is done automatically, so there is no need to upload any sequences. For more information about Exiqon's LNA™ GapmeRs, please go to Exiqon GapmeRs
• microRNA regulation. Find out which microRNAs are known or predicted to regulate your candidate genes. Simply search using the gene name at miRSearch. For more information about miRSearch, please see page 27.
EXIQON | mRNA NGS Data Analysis Report | Ref code: 00059-00108
Data Analysis workflowSoftware tools used for the analysisOur NGS data analysis pipeline is based on the Tuxedo software package, which is a combination of open-source software, and implements peer-reviewed statistical methods. In addition we employ specialized software developed internally at Exiqon to interpret and improve the readability of the final results.
The components of our NGS data analysis pipeline for RNA-seq include Bowtie2 (v. 2.2.2, see Langmead B and Salzberg S. (2012) ), Tophat (v2.0.11, see Trapnell, C., et al. (2009) ) and Cufflinks (v2.2.1, see Trapnell, C., et al. (2010) and Trapnell, C., et al. (2012)), and are described in detail below.
Tophat is a fast splice junction mapper for RNA-seq reads. It aligns the sequencing reads to the reference genome using the sequence aligner Bowtie2. Tophat also uses the sequence alignments to identify splice junctions for both known and novel transcripts as well as identification of insertions and deletions.
Cufflinks takes the alignment results from Tophat and assembles the aligned sequences into transcripts, thereby constructing a map or a snapshot of the transcriptome. To guide the assembly process, an existing transcript annotation is used (RABT assembly). In addition, we perform fragment bias correction which seeks to correct for sequence bias during library preparation (see Kasper et al., 2010 and Adam et al., 2011). The Cufflinks assembles aligned reads into different transcript isoforms based on exon usage and also determines the transcriptional start sites (TSSs).
When comparing groups, Cuffdiff is used to calculate the FPKM (number of fragments per kilobase of transcript per million mapped fragments) and test for differential expression and regulation among the assembled transcripts across the submitted samples using the Cufflinks output. Cuffdiff can be used to test differential expression at different levels, from CDS and gene specific, down to the isoform and TSS transcript level. For more information onthe Cuffdiff module, see Trapnell et al., (2013).
As a final step custom software is used for post processing of Cuffnorm and Cuffdiff results. We use these tools to generate a visual representation of your sequencing results to aid the interpretation of the sequencing data and the analysis results.
Page 26 of 34
EXIQON | mRNA NGS Data Analysis Report | Ref code: 00059-00108
miRSearchIf you are interested in finding out which microRNAs are regulating your transcripts, Exiqon offers two options:
miRSearch 3.0
An interactive miRSearch database, offering you up-to-date information on microRNAs, their target genes as well as expression and disease associations, supported by references with integrated access to PubMed. miRSearch includes a built-in report feature which allows you to easily collect and store all the relevant information gathered.
Search using a gene name or keyword and find:microRNAs that regulate specific genes(validated and predicted interactions)
Search using a microRNA name and find:Regulated genes (validated and predicted interactions)Potentially co-transcribed microRNAsDiseases in which the microRNA has been shown to be regulatedTissues/samples in which the microRNA has been found
Page 27 of 34
EXIQON | mRNA NGS Data Analysis Report | Ref code: 00059-00108
ReferencesAnders S. and Huber W. (2010) Differential expression analysis for sequence count data. Genome Biology 11: R106
Benjamini and Hochberg (1995). Journal of the Royal Statistical Society Series B, *57*, 289-300.
Kasper D., et al., (2010) Biases in Illumina transcriptome sequencing caused by random hexamer priming Nucleic Acids Research, Volume 38, Issue 12.
Kellis, M., et al., (2013) Defining functional DNA elements in the human genome. PNAS, Vol. 111:6131-6138.
Langmead B, Salzberg S. (2012) Fast gapped-read alignment with Bowtie 2. Nature Methods. 9:357-359.
Marinov, G. K., et al., (2014) From single-cell to cell-pool transcriptomes: Stochasticity in gene expression and RNA splicing. Genome Res. 24: 496-510.
Roberts, A., et al., (2011) Identification of novel transcripts in annotated genomes using RNA-Seq. Bioinformatics, 27(17): 2325-2329.
Roberts, A., et al., (2011) Improving RNA-Seq expression estimates by correcting for fragment bias Genome Biology, Volume 12, R22.
Robinson, J.T., et al., (2011) Integrative Genomics Viewer. Nature Biotechnology 29,24–26.
Thorvaldsdóttir, H., et al., (2012) Integrative Genomics Viewer (IGV): high-performance genomics data visualization and exploration. Briefings in Bioinformatics.
Trapnell, C., et al., (2010) Transcript assembly and quantification by RNA-Seq reveals unannotated transcripts and isoform switching during cell differentiation. Nature Biotechnology, 28(5): 511-515.
Trapnell,C., et al., (2012) Differential gene and transcript expression analysis of RNA-seq experiments with TopHat and Cufflinks. Nature Protocols 7,562–578
Trapnell, C., et al., (2009) TopHat: discovering splice junctions with RNA-Seq. Bioinformatics (Oxford, England), 25(9):1105-1111
Vandesompele et al., (2002) Accurate normalization of real-time quantitative RT-PCR data by geometric averaging of multiple internal control genes. Genome Biology, 3(7):research0034.1–0034.11
Page 28 of 34
EXIQON | mRNA NGS Data Analysis Report | Ref code: 00059-00108
Frequently asked questionsWhat is Q-score?
Answer: A quality score (or Q-score) is an estimation of the probability of an incorrect base call. Q-score = -10 log10(p) where p is the estimated probability of the base call being wrong. A quality score of 10 indicates an error probability of 0.1, a quality score of 20 indicates an error probability of 0.01, a quality score of 30 indicates an error probability of 0.001, and so on. A Q-score above 30 (>99.9% correct) is considered high data quality. In order to pass the Data QC, all samples must have an average Q-score across both the first halv and the second half of the reads of at least 16 (>97.5% correct).
Question: What is the difference between FPKM and RPKM?
Answer: RPKM stands for Reads per Kilobase of transcript per Million mapped reads.
FPKM stands for Fragments per Kilobase of transcript per Million mapped fragments. The term “fragments” refers to the cDNA fragments present during library preparation.
Both RPKM and FPKM are normalized numbers which tell you something about the relative abundance of, for example, an assembled transcript.
In paired-end sequencing, two reads are produced per cDNA fragment during library preparation, whereas only one read is produced per cDNA fragment in single-end sequencing. Thus, single-end versus paired-end sequencing will affect the value of RPKM but not FPKM. Consequently, FPKM is preferred over RPKM as it will provide values comparable between single-end sequencing and paired-end sequencing
Question: What does 1 FPKM mean in terms of abundance?Answer: This is difficult to estimate and highly variable according to cell type and the total number of mRNAs in a given cell. For example, It was estimated that in a single cell analysis of the cell line GM12878, that one transcript copy corresponds to 10 FPKM (Marinov 2014). Others find that “FPKMs are not directly comparable among different subcellular fractions, as they reflect relative abundances within a fraction rather than average absolute transcript copynumbers per cell (Kellis 2013). Depending on the total amount of RNA in a cell, one transcriptcopy per cell corresponds to between 0.5 and 5 FPKM in PolyA+ whole-cell samples according to current estimates with the upper end of that range corresponding to small cells with little RNA and vice versa”.
Question: What is a “novel” RNA transcript?Answer: A novel transcript is characterized as a transcript which contains features not present in the reference annotation. Thus, a novel transcript can be both a new isoform of a known gene or a transcript without any known features. For example, a novel transcript could be the result of a previously unknown splicing event for a known gene or a previously unknown long noncoding RNA.
Question: A novel transcript identified seems to be a known gene when I look it up in the gene browser, why is that?Answer: Most novel transcripts are not new “genes” but different isoforms of previously
Page 29 of 34
EXIQON | mRNA NGS Data Analysis Report | Ref code: 00059-00108annotated genes. A novel transcript is most commonly a novel combination of exons or a different start site.
Question: Where can I find the most up to date information on lncRNA annotations?Answer: lncRNA identification and annotation is at a preliminary stage (Mattick et al., 2015). RNACentral (http://rnacentral.org) or GENCODE (http://www.gencodegenes.org) are recommended lncRNA resources to investigate potentially novel lncRNAs identified in your study.
Question: Where do I find the result files?Answer: The result files are located in XploreRNA on the results page. Go to MyProjects and click on the relevant project and analysis. For a description of the result files please open the file “file_descriptions.html” (using an internet browser) located in the result folder in XploreRNA.
Page 30 of 34
EXIQON | mRNA NGS Data Analysis Report | Ref code: 00059-00108
DefinitionsGene
The standard definition of a gene is a high level feature on the genome that codes for a protein or RNA with a function in the organism The same gene may encode multiple different RNA transcripts (or isoforms) through alternative splicing or different transcriptional start sites. In the context of RNA-seq, the term “gene” is used to refer to all RNA transcripts (or isoforms) encoded by the same gene. For example, when analyzing differentially expressed genes, the reads from all transcripts derived from the same gene are included.
Gene_ID
Gene identifier. For known genes this will be the gene id from the annotation source, e.g. an Ensembl gene ID. For novel genes, this will be a unique generic identifier, e.g. “CUFF.2”
Transcript
RNA sequence (e.g. mRNA, ncRNA, tRNA or rRNA) transcribed from DNA.Transcriptsmay also be referred to as isoforms.
Transcript ID
Transcript identifier. For known genes this will be the transcript id from the annotation source, e.g. an Ensembl gene ID. For novel transcripts, this will be a generic identifier, e.g. “CUFF.2.1”
Primary transcript (pre-mRNA)
RNA sequence transcribed from DNA. The primary transcript is then processed (e.g. by addition of 5' cap, 3'-polyadenylation, alternative splicing) to yield various mature RNA products such as mRNAs, ncRNAs, tRNAs, and rRNAs. Multiple primary transcripts may be transcribed from the same gene by use of different transcriptional start sites.
Isoforms
Different closely related transcripts arising from the same primary transcript (and same gene or DNA sequence) by alternative splicing of exons for example. Isoforms may also be referred to as transcripts.
Novel transcript
A transcript which contains features not present in the reference annotation. A novel transcript can be both a new isoform of a known gene or a transcript without any known features. A novel transcript is most commonly a novel combination of exons or a different start site.
TSS
Transcriptional Start Site
TSS_ID
A unique identifier for the inferred Transcriptional Start Site (TSS). Note: this identifieris unique only within a single analysis.
Page 31 of 34
EXIQON | mRNA NGS Data Analysis Report | Ref code: 00059-00108CDS
Coding DNA Sequence
Promoter
A region of DNA that initiates transcription of a particular gene. Promoters are located near the transcriptional start sites of genes.
P_ID
Promoter ID. This value is extracted from reference annotations, which containCDS information.
GO
Gene Ontology (GO - Gene Ontology Consortium, 2000) is an initiative to describe genes, gene products and their attributes using vocabulary (GO terms) which is unified and controlled across all species. The GO terms are categorized into three GO domains: molecular function, biological process and cellular component.
GO_ID
Unique identifier for a Gene Ontology (GO) term.
Exon
Sequence that remains present within the final mature RNA product of that gene afterintrons have been removed by splicing
Intron
A sequence within a gene that is removed by splicing during maturation of the final RNA product.
Outmapped reads or high abundance reads
For example; rRNA, mtRNA, polyA and PolyC homopolymers
Unmapped reads
No alignment to the reference genome is possible. Explanations for this include the read being too short, low read quality or contaminations.
Mappable reads
Sequences which can be aligned to the reference genome
lncRNA
long non-coding RNA
tRNA
Transfer RNA
rRNA
ribosomal RNA
pri-miRNA
primary microRNA transcript
mtRNA
mitochondrial RNA
phiX
Libraries generated from the PhiX virus used as a control in sequencing runs
Page 32 of 34

EXIQON | mRNA NGS Data Analysis Report | Ref code: 00059-00108Q-score
Quality score used to assess the quality of the bases or reads in NGS data. See FAQs for further explanation.
q-value
p-values that have been adjusted to correct for multiple testing
FPKM
Fragments per Kilobase of transcript per Million mapped fragments
Reads
DNA Sequence generated by the sequencing machine (for paired end sequencing the same strand is sequenced in both directions – forward and reverse)
Fragment Count
The number of fragments originating from a feature
Page 33 of 34

Contact usOutside North America North America
Business hours Business hours8:30 a.m. - 4:30 p.m. 8:30 a.m. - 4:30 p.m.Central European Time (GMT +1) Eastern Standard Time
Mailing address Mailing addressExiqon A/S Exiqon, Inc.Skelstedet 16 12 Gill Street, Suite 16502950 Vedbaek Woburn, MA 01801Denmark United States
Phone: +45 45 65 09 29 Phone: +1 781 376 4150Fax: +45 45 65 04 59 Fax: +1 781 376 4152Email (form): exiqon.com/contact Toll free (US & Canada):
+1 888 miRCURYEmail (form): exiqon.com/contact