MRMA of Bank
16
FACTA UNIVERSITATIS Series: Economics and Organization Vol. 7, No 4, 2010, pp. 395 - 410 MARKET RISK MANAGEMENT IN BANKS – MODELS FOR ANALYSIS AND ASSESSMENT UDC 330.131.7:005]:336.7 Emilia Milanova University of National and World Economy Sofia, Bulgaria [email protected] Abstract . Ma rket risk i s con nec ted w ith th e pri ce fl uct uat ion s on fo ur of t he most i mpo rtant economic markets: market of debt securities sensitive to interest rates changes; stock market; currency market, and commodity market. With regard to this, market risk is the risk that the fin anc ial ins tru me nt's v alu e will flu ctu ate as a r esu lt fro m mar ket p ric e ch ang es, r ega rdl ess of whether these changes are caused by factors typical for individual instruments or their issuer, or by factors pertaining to all the instruments traded on the market. This article presents the main components of market risk – interest rate risk, currency risk, and price risk. The methods for interest rate risk measurement include imbalance analysis, duration analysis and simulation model. The Value at Risk (VaR) model is pres ente d as a basic metho d for market risk analysi s. Special place is devoted to stre ss tests as a technique for reliable risk management used in the potential impact assessment of individual factors or changes in many financial parameters of the bank's income, capital and economic value. Key Words: interest rate risk (including revaluation risk, basic risk, option risk), currency risk, price risk, gap analysis, VaR analysis I NTRODUCTI ON Market risk is the risk that the financial instrument's value will fluctuate as a result from market price changes, regardless of whether these changes are caused by factors typical for individual instruments or their issuer (counterparty), or by factors pertaining to all the instruments traded on the market 1 . The four most common factors connected with market risk are interest rates, currency exchange rates, costs of investments in trade port- folio (regardless of the instruments' character – debt or capital), prices of exchange com- modities and other market variables related to the bank's activity. The market risk per- taining to both individual financial instruments and portfolio instruments can be a func- Received December 21, 2010 1 IFRS 7 "Financial instruments – disclosure"
Transcript of MRMA of Bank
8/10/2019 MRMA of Bank
http://slidepdf.com/reader/full/mrma-of-bank 1/16
FACTA UNIVERSITATIS Series: Economics and Organization Vol. 7, No 4, 2010, pp. 395 - 410
MARKET RISK MANAGEMENT IN BANKS –MODELS FOR ANALYSIS AND ASSESSMENT
UDC 330.131.7:005]:336.7
Emilia Milanova
University of National and World Economy Sofia, Bulgaria
Abstract. Market risk is connected with the price fluctuations on four of the most important
economic markets: market of debt securities sensitive to interest rates changes; stock market;
currency market, and commodity market. With regard to this, market risk is the risk that the
financial instrument's value will fluctuate as a result from market price changes, regardless
of whether these changes are caused by factors typical for individual instruments or their
issuer, or by factors pertaining to all the instruments traded on the market.
This article presents the main components of market risk – interest rate risk, currency risk,
and price risk. The methods for interest rate risk measurement include imbalance
analysis, duration analysis and simulation model. The Value at Risk (VaR) model is
presented as a basic method for market risk analysis. Special place is devoted to stresstests as a technique for reliable risk management used in the potential impact assessment
of individual factors or changes in many financial parameters of the bank's income,
capital and economic value.
Key Words: interest rate risk (including revaluation risk, basic risk, option risk),
currency risk, price risk, gap analysis, VaR analysis
I NTRODUCTION
Market risk is the risk that the financial instrument's value will fluctuate as a result
from market price changes, regardless of whether these changes are caused by factors
typical for individual instruments or their issuer (counterparty), or by factors pertaining to
all the instruments traded on the market 1. The four most common factors connected withmarket risk are interest rates, currency exchange rates, costs of investments in trade port-
folio (regardless of the instruments' character – debt or capital), prices of exchange com-
modities and other market variables related to the bank's activity. The market risk per-
taining to both individual financial instruments and portfolio instruments can be a func-
Received December 21, 2010
1 IFRS 7 "Financial instruments – disclosure"

8/10/2019 MRMA of Bank
http://slidepdf.com/reader/full/mrma-of-bank 2/16
E. MILANOVA396
tion of one, several or all these factors, and in many cases it can be very complicated. In
general, market risk can be defined as a risk arising from market movements – of prices,
interest rates and currency exchange rates.
The policy for market risk control and management should be subordinated to several
main aims:
to protect the bank against unexpected losses and to contribute to income stability
via independent identification, assessment and understanding of business market
risks;
to contribute to bringing the bank's organizational structure and management proc-
ess in line with the best international practices and to set minimum standards for
market risks control;
to create transparent, objective and consistent information system of the market
risks as a base for reasonable decision-making; to establish a structure that will help the bank to realize the connection between the
business strategy and the operations on one hand, and between the purposes of risk
control and monitoring, on the other.
The admissible threshold of market risk is the amount of potential unexpected loss
which the bank is willing to assume because of unexpected and unfavorable changes in
the market variables. The admissible threshold of market risk should not exceed the losses
which the bank can assume without disturbing its financial stability. The bank's ability to
overcome losses caused by market risk depends on its capital and reserves, on the poten-
tial losses originating from other non-market risks and on the regulatory capital required
for maintaining the business activity.
Risk monitoring is the fundament for effective management process. That is the reason
why the banking institutions should have adequate internal reporting systems reflecting
their exposure to market risk. Sufficiently detailed regular reports should be submitted tothe top management and to the various management levels.
І. TYPES OF MARKET RISK
1. Interest rate risk
Interest rate risk is the probability that variations in the interest rates will have a negative
influence on the quality of a given financial instrument or portfolio, as well as on the
institution's condition as a whole. Assuming of that risk is a normal aspect of the bank's
activity and can be an important source of profit and share value. However, excess interest
rate risk can significantly jeopardize the bank's incomes and capital base. Variations in the
interest rates influence the bank's incomes and change its net interest revenues and the levelof other interest-sensitive earnings and operative costs. Interest rate variations also affect the
basic value of the bank's assets, liabilities and off-balance instruments, because the present
value of the future cash flows (and in some cases the cash flows themselves) alters when
interest rates change. Interest rates variations can also influence the level of credit risk and
the ability to retain the attracted resources. That is why the effective interest risk
management that keeps risk in reasonable limits is of vital importance for bank stability.

8/10/2019 MRMA of Bank
http://slidepdf.com/reader/full/mrma-of-bank 3/16
Market Risk Management in Banks – Models for Analysis and Assessment 397
1.1. Sources of interest rate risk
Repricing risk
Banks in their capacity as financial brokers face interest rate risk every day. The most
common and debated form of interest rate risk originates from the time differences of
maturity (for fixed rate), and changes in the interest rates (for floating rate) of the bank's
assets, liabilities and off-balance items2. Although these discrepancies are fundamental for
the bank's activity, they can expose the bank's income and basic economic value to unex-
pected fluctuations when interest rates vary. For example, a bank which finances a long-
term credit with a fixed interest rate with a short-term deposit can experience a decrease
in the future revenues and in its basic value if the interest rates rise. This decrease hap-
pens because the cash flows are fixed for the credit period while the interests paid on the
funding are variable and the interest rates' increase takes place after the short-term depositmatures (respectively, the interest-related costs increase).
Yield curve risk
The repricing discrepancies can also expose the bank to changes of the yield curve tilt
and shape. The yield curve risk arises when unexpected changes of the yield curve have
an adverse effect on the bank's returns or basic economic value. The yield curve risk re-
sults from a change in the percentage ratios of identical instruments with different maturi-
ties. For example, the 30-year government bond' profitability can change by 200 basic
points, while the profitability of a 3-year government promissory note can change by only
50 basic points for the same time period (one basic point is defined as one hundredth of a
percent, i.e. 100 basic points are equal to 1%). Or, the basic economic value of a long
position in 10-year government bonds, which is hedged with a short position in 5-year
government promissory notes, can abruptly drop if the yield curve steepens even if the
position is hedged against parallel changes of the yield curve.
Basic risk
The basic risk is a result from a weak correlation adjustment of the interest rates which
are received and paid on various instruments otherwise having the same repricing char-
acteristics. When the interest rates change, that absence of correlation can cause unex-
pected alterations in the cash flow and the spread between assets, liabilities and off-bal-
ance instruments with similar maturities. For example, three-month interest rates are paid
on three-month inter-bank deposits, three-month Euro-dollar deposits and three-month
treasury bills. However, these three-month rates do not from ideal ratios among each other
and their profitability margins can change over time. As a result, three-month treasury
bills financed by three-month Euro-dollar deposits represent an improperly balanced or
hedged position which can cost the bank a lot when interest rates change.
Option risk (risk of client's right of choice)
An additional source of interest rate risk with increasing significance is the risk arising
from options imbedded in many bank's assets, liabilities and off-balance portfolios. For-
mally, these options provide their holder with the right, but not the obligation to buy, sell
2 Principles for the Management and Supervision of Interest Rate Risk, BIS, Basel Committee for Banking
Supervision (BCBS), July 2004

8/10/2019 MRMA of Bank
http://slidepdf.com/reader/full/mrma-of-bank 4/16
E. MILANOVA398
or change in a certain way the cash flow of a given instrument or financial contract. In-
struments with imbedded options include various types of bonds and promissory notes
with call or put option, credits which provide the borrowers with the right to premature
repayment, as well as various types of undated deposit instruments which entitle the de-
positors to withdrawing their money at any time, often without any penalties. This type of
risk can have an adverse impact on the profit or economic value of the bank's own capital
via a decrease in the assets' profitability, increase in the attracted funds' price or decrease
in the expected cash flow's net present value. For example, if a client repays their credit
earlier during a period of decreasing interest rates, the bank will not receive the initially
expected cash flow. And thus it will have to reinvest the sum at a lower interest rate.
1.2. Effects of interest rate risk
The interest rates variations can have an unfavorable impact on the bank's income andeconomic value. That creates two separate, but supplementing perspectives for assessing
the bank's exposure to interest rate risk.
Yield perspective: It is focused on analyzing the influence of interest rate variations on
the accrued and reported income3. This is the traditional approach for interest rate risk
assessment adopted by many banks. The income variability is an important and central
point of the interest rate risk analysis, because decreased incomes or direct losses can
suddenly jeopardize the institution's financial stability, eroding its capital adequacy, de-
creasing the market confidence and reducing its liquidity. In this respect, the income
component, which traditionally is subject to greatest attention, is the net interest income
(the difference between total interest incomes and total interest expenses). However, as
banks constantly expand their activities that generate other non-interest related income
and income based on fees and other non-interest related revenues, we should add the non-
interest related earnings and expenses to the net interest income. The non-interest related
income, originating from many activities such as credit servicing and different programs
for assets' securitisation, can be very sensitive to the market interest rates. For example,
some banks provide and administer mortgage loans pools against a fee which is based on
the managed assets' volume. When the interest rates drop, the servicing bank can observe
a decrease in the fee income, because the basic mortgages are liquidated in advance.
Additionally, even the traditional sources of non-interest related incomes such as fees for
deals processing become more and more sensitive to interest rates.
Economic value perspective: The market interest rates variations also affect the eco-
nomic value of the bank's incomes, liabilities and off-balance items. A given instrument's
economic value is the estimation of the present value of its expected net cash flows dis-
counted in a way that they reflect the market interest rates. Viewed in broader sense, the
bank's economic value is the present value of the expected net cash flows defined as theexpected cash flows from the assets minus the expected net cash flows from liabilities
plus the expected net cash flows from off-balance items. In that sense, the economic value
perspective represents the bank's own capital's (net value) sensitivity to interest rates'
fluctuations. In view of the fact that economic value perspective examines the possible
3 Guidelines on Interest Rate in the Banking Book, Committee of European Banking Supervisors (CEBS),
October 2006
8/10/2019 MRMA of Bank
http://slidepdf.com/reader/full/mrma-of-bank 5/16
Market Risk Management in Banks – Models for Analysis and Assessment 399
influence of interest rates' variations on the present value of all future cash flows, it offers
a broader view of the potential long-term effect from the interest rate variations rather
than the yield perspective.
2. Currency risk
Currency risk is the risk where the fair value or future cash flows of a given financial in-
strument fluctuate as a result from changes in the currency exchange rates4. Currency ex-
change rates can be subject to big and unexpected changes, and understanding and managing
of the risk related to the currency exchange rates' volatility can be very complicated.
Although it is important to acknowledge that currency exchange rates are definitely a
market risk factor, the currency instruments' valuation usually requires knowledge about the
behaviour of both spot currency exchange rates and interest rates. Each forward premium or
value discount of a given foreign currency against the local one is determined to a great
extent by the relative interest rates on the two national markets. Like all market risks, the
currency risk evolves from both open and improperly balanced or hedged positions. The
imperfect correlations between the currencies and the international interest markets put
forward concrete challenges to the efficiency of the hedging currency strategies.
3. Price risk – risk when the fair value or future cash flows of capital and debt finan-
cial instruments (stocks, bonds, indexes and derivatives connected with them) fluctuate as
a result from market prices' changes, no matter whether these changes are caused by fac-
tors typical for individual instruments or for their issuer (counterparty), or by factors re-
lated to all the instruments traded on the market. The risk connected with the commodity
exchange prices is the probability of unfavorable changes in the value of commodities
traded by the bank. Price risks associated with commodities differ significantly from in-terest rate and currency risks, and require careful monitoring and management as most of
the commodities are traded on markets where the supply concentration can increase the
price volatility. What is more, changes in the market liquidity are often accompanied by
significant price volatility. That is why the commodities' prices are in broad lines more
unstable than those of most financial assets commonly traded. The risk assessment associ-
ated with commodities prices should be performed market by market and it should include
not only analysis of historical price movements, but also assessment of the supply and
demand structure on the market, so that the probability for unusually large price move-
ments can be assessed.
ІІ. MEASUREMENT OF PRICE RISKS
There are a number of methods for the measurement of various market risks. They all
require adequate information about the current positions, market conditions and instru-
ments' characteristics. No matter which method is used, the range and preciseness of the
measurement systems of a given institution should be proportional to scale, complexity
and nature of its trade activity and its positions. Proper control should be exercised over
4 Guidelines on the Application of the Supervisory Review Process under Pillar 2, CEBS, January 2006
8/10/2019 MRMA of Bank
http://slidepdf.com/reader/full/mrma-of-bank 6/16
E. MILANOVA400
all the elements in the process of market risk measurement and monitoring, including
collection and delivery of data about positions, market factors, key preconditions, calcu-
lation of risk amount and reporting of risk exposures via appropriate chains of rights and
responsibility.
IFRS 7 "Financial instruments – disclosure" obliges banks to disclose:
sensitivity analysis for each type of market risk to which the bank is exposed at the
date of financial report showing how profit, loss or equity will be affected by the
reasonably possible changes in the respective risk variable (prevalent market interest
rates, currency exchange rates, prices of equity instruments or commodity prices);
methods and assumptions used when preparing the sensitivity analysis;
changes during the previous period in the used methods and assumptions, as well as
the reasons for those changes.
In addition to IAS/IFRS, Basel II5
requires from the banks, which use the market riskstandardized approach, to disclose their capital requirements for position (interest rate and
price risks for debt and capital instruments), currency and commodity risks. The banks
which apply internal models for their trade portfolio disclose: for each sub-portfolio – the
characteristics of the employed models; description of the stress tests; description of the
used approach for back-testing and verification of the accuracy and consistency of inter-
nal modeling.
1. Methods for interest rate risk measurement
Banks use different methods for the calculation of interest rate risk, but none is appro-
priate for all banks simultaneously. Regardless of the diversity, all methods require solid
accounting information which is the basis for adequate information necessary for moni-
toring and timely reporting of exposures to interest rate risk.The three most frequently used methods for interest rate risk measurement are the dis-
crepancy analysis, the simulation method and the duration method. The application of
each individual method depends on the bank's size, the complexity of its activity organi-
zation and the level of interest rate risk.
1.1. Discrepancy analysis (GAP analysis)
The discrepancy analysis is the most frequently used method for interest rate risk as-
sessment. Discrepancy is the difference between interest sensitive assets and interest sen-
sitive liabilities (including off-balance items) over a particular period of time. The dis-
crepancy analysis includes both assets and liabilities with fixed and with floating interest
rate. Under the discrepancy analysis the bank's assets and liabilities are grouped in differ-
ent time periods depending on their maturity (in case of fixed interest rate) or on the time
remaining until the next change of their prices (in case of floating interest rate). The allo-
cation of interest sensitive assets and liabilities to different revaluation periods allows for
showing the discrepancy for each of those periods. The time periods vary for each bank;
the discrepancy schedule can include the following categories: 1 day, 2 days – 1 month, 1
- 3 months, 3 - 6 months, 6 months - 1 year, 1 – 2 years, 2 – 5 years, and over 5 years.
5 International Convergence of Capital Measurement and Capital Standards, A Revised Framework, BIS, BCBS, June
2004
8/10/2019 MRMA of Bank
http://slidepdf.com/reader/full/mrma-of-bank 7/16
Market Risk Management in Banks – Models for Analysis and Assessment 401
A bank has a positive discrepancy when the sum of the assets being revaluated over a
particular period is bigger than the sum of the liabilities being revaluated for the same
period. A bank has a negative discrepancy if more liabilities than assets are being revalu-
ated. The discrepancy is a normal phenomenon and it cannot be avoided or fully eliminated.
The discrepancy affects the profit and is equal to the difference between the assets
being revaluated (the liabilities) and the off-setting liabilities (assets). If a bank has a
negative discrepancy and interest rates rise, the net interest income will decrease as more
liabilities than assets will be revaluated at higher interest rates. But, if interest rates drop,
the bank's net interest income will improve. On the other hand, if the bank has a positive
discrepancy and the interest rates increase, the net interest income will improve as more
assets than liabilities will be revaluated at higher interest rates. If the bank has a positive
discrepancy and the interest rates drop, revenues will decrease.
The bank's position in relation to interest rates sensitivity can be measured in severalways. One of the used methods is the ratio between the interest sensitive assets and the
interest sensitive liabilities. A ratio of interest sensitive assets to interest sensitive liabili-
ties equal to 1 shows a balanced position; a ratio bigger than 1 shows a position sensitive
to assets, and a ratio smaller than 1 shows a position sensitive to liabilities. In principal,
the discrepancy analysis shows a periodical and cumulative discrepancy. Regardless of
that whether at a particular moment the bank has a position sensitive to assets or to li-
abilities, that position should always be in line with the management's forecasts about the
interest rates movements, and should never be speculative. The most frequently used dis-
crepancy coefficient is the following:
assetsProfitablesliabilitiesensitiveInterestassetssensitiveInterest
assetsProfitablesliabilitiesensitiveInterest-assetssensitiveInterest(1)
In some cases, the total assets indicator can be used instead of profitable assets, but
that can lead to underestimating the interest rate risk.
The discrepancy shows the risk to which interest income is exposed . For that purpose,
the discrepancy can be multiplied by the presumptive value of the interest rate change, so
we can obtain the estimated value of net interest income changes, which is the result from
similar interest rate movements. That result reflects the deviation of the net interest mar-
gin. For example, a bank has a positive discrepancy of 15% in the category '1 year'. If the
interest rates decrease by 2%, the net interest margin can decrease by 30 basic points
(15% 0.02). This is an indication for a stable accounting balance sheet and immediate
and steady changes of the interest rates. The amount of the interest rate movement used in
the analysis can be based on a number of factors, incl. historical experience, modeling the
potential movements of the future interest rate and the bank's management's judgment.
The maintenance of a balanced position over all time periods in the discrepancy reportdoes not guarantee that the bank is immune to interest rate risk. The interest rates of dif-
ferent instruments do not change at the same time. For example, the revaluation of depos-
its with a floating interest rate can be made with a certain delay as regards the loans dis-
bursed at a first-class interest rate.
The 'discrepancy analysis' method has several advantages: the method is easy to de-
velop and use; the results are clear and easy to analyze; its performance is best in banks
with relatively low profile of interest rate risk and no options.

8/10/2019 MRMA of Bank
http://slidepdf.com/reader/full/mrma-of-bank 8/16
E. MILANOVA402
Although the discrepancy analysis is very widely used when assessing the interest rate
risk exposure, it has a number of disadvantages: (1) – the discrepancy analysis does not
register the fluctuations in different positions' characteristics within one time interval. In
the particular case, it is accepted that the maturity or the revaluation of all positions within
a particular time interval occur simultaneously – a simplification which is likely to have a
greater impact on the calculations accuracy, as the degree of generalization in a particular
time interval increases; (2) – the discrepancy analysis ignores the differences between the
interest rates spreads, which can originate from changes of the market interest rates (basic
risk); (3) – it does not register changes in payment dates which can occur as a result from
the interest environment changes. For that reason, the discrepancy analysis does not reg-
ister the differences in the income sensitivity which can result from option-related posi-
tions. On account of that, the discrepancy analysis broadly and roughly outlines the actual
change of the net interest income which results from the chosen change of interest ratedynamics; (4) – most of the discrepancy analyses cannot encompass the fluctuations of
non-interest incomes and expenses that represent a potentially important source of risk for
the current income.
1.2. Duration analysis
One of the discrepancy analysis' limitations is its inability to show the portfolio value
or its change as a consequence from interest rates' change. For tackling with this problem,
another analytical method for measuring risk in portfolios of interest sensitive securities
has been developed.
The duration is a measure for the percentage deviation of the economic value of an
individual position which will occur at a small change of the interest rates. It shows the
time and amount of cash flows which are received before the instrument's contractually-
agreed maturity. On principle, the longer the maturity period and the period for the next
change in the instrument's price is, or the smaller the payments received prior to maturity
are (for example, coupon payments), the longer the duration is. The longer duration
means that a certain change in interest rates levels will have a greater impact on the eco-
nomic value.
The modified duration is a variety of the simple duration which calculates the interest
rate risk sensitivity of the instrument's price.
The difference between the simple and modified duration is that the first one is ex-
pressed in time units, while the second one is a ratio. In the financial circles the term du-
ration usually refers to modified duration.
The duration measures the average life-cycle of an individual interest sensitive instru-
ment. Its characteristics are as follows: it decreases over time; it is always shorter than the
instrument's maturity period, for which payments are made prior to the maturity date, andit is always equal to the residual period until the zero-coupon instrument matures.
The following examples are an illustration of how duration is calculated:
A bank buys a 3-year bond at nominal value of BGN 1,000 which has a 10% annual
interest. To calculate the duration we should first calculate the net present value of each
payment. This calculation is performed by using the following formula:
8/10/2019 MRMA of Bank
http://slidepdf.com/reader/full/mrma-of-bank 9/16
Market Risk Management in Banks – Models for Analysis and Assessment 403
n
i
i
i
rate
Values NPV
1 )1( (1)
where
NPV = net present value
I = year of payment
Value = principal to be paid;
Rate = interest rate
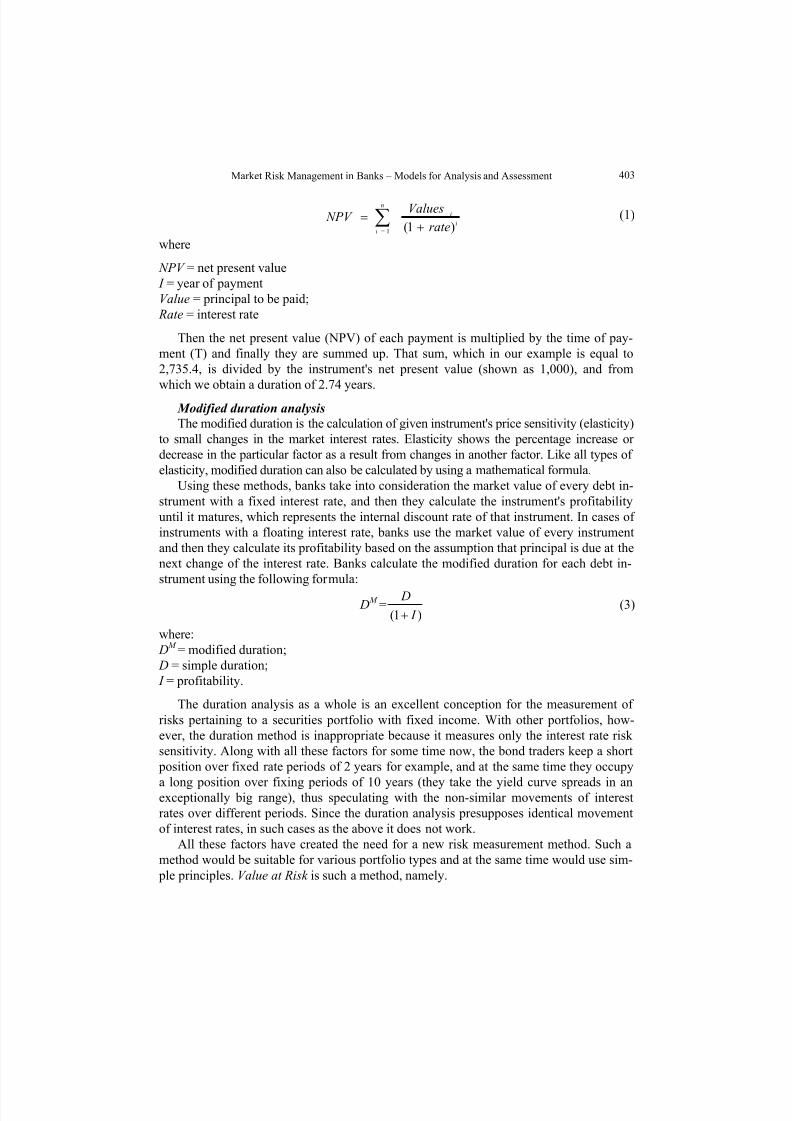
Then the net present value (NPV) of each payment is multiplied by the time of pay-
ment (T) and finally they are summed up. That sum, which in our example is equal to
2,735.4, is divided by the instrument's net present value (shown as 1,000), and from
which we obtain a duration of 2.74 years.
Modified duration analysis
The modified duration is the calculation of given instrument's price sensitivity (elasticity)
to small changes in the market interest rates. Elasticity shows the percentage increase or
decrease in the particular factor as a result from changes in another factor. Like all types of
elasticity, modified duration can also be calculated by using a mathematical formula.
Using these methods, banks take into consideration the market value of every debt in-
strument with a fixed interest rate, and then they calculate the instrument's profitability
until it matures, which represents the internal discount rate of that instrument. In cases of
instruments with a floating interest rate, banks use the market value of every instrument
and then they calculate its profitability based on the assumption that principal is due at the
next change of the interest rate. Banks calculate the modified duration for each debt in-
strument using the following formula:
D M
=)1( I
D
(3)
where:
D M
= modified duration;
D = simple duration;
I = profitability.
The duration analysis as a whole is an excellent conception for the measurement of
risks pertaining to a securities portfolio with fixed income. With other portfolios, how-
ever, the duration method is inappropriate because it measures only the interest rate risk
sensitivity. Along with all these factors for some time now, the bond traders keep a short
position over fixed rate periods of 2 years for example, and at the same time they occupy
a long position over fixing periods of 10 years (they take the yield curve spreads in anexceptionally big range), thus speculating with the non-similar movements of interest
rates over different periods. Since the duration analysis presupposes identical movement
of interest rates, in such cases as the above it does not work.
All these factors have created the need for a new risk measurement method. Such a
method would be suitable for various portfolio types and at the same time would use sim-
ple principles. Value at Risk is such a method, namely.
8/10/2019 MRMA of Bank
http://slidepdf.com/reader/full/mrma-of-bank 10/16
E. MILANOVA404
1.3. Analysis of the type 'simulation analysis'
Simulation methods work on the fact that interest rates changes are not static, but dy-
namic. Simulation includes a process of generating several interest rate scenarios over a
time period and discounting of supposed cash flows in each individual interest rate sce-
nario in order to calculate the present value for every scenario. As a result from the simu-
lation, we obtain a range of probable risk exposures which reflect both the current and
expected risk. The main advantage of the simulation methods is that they are dynamic and
forward-oriented. Banks can change their interest rate scenarios depending on many fac-
tors such as pricing and structure of assets and liabilities. The models also take into ac-
count the fact that interest rates do not change similarly in the various maturity groups, so
risk caused by unparallel changes in the yield curve can be identified through using a
simulation method. The accuracy of those models depends on the validity of the used out-
put data. If output data is incorrect, the results cannot accurately reflect the interest raterisk to which the bank is exposed. Another weakness of those models is that they require
technical experience for their development and detailed information about maturities and
interest rates. Sometimes it is much more practical and cheaper for the bank to buy a par-
ticular program product well-known on the market than to develop a certain simulation
model. They are not consumer-friendly and may require more personnel than the other
systems for interest rate risk measurement.
2. Value at Risk (VaR) as a method for interest rate risk assessment
The Value at Risk model (VAR) is the most common measurement method used by
the banks to generalize their market risk exposures. The bank applies the Value at Risk
(VAR) models for measuring the trade and the bank portfolios' market risk and for the
potential losses assessment via an appropriate analytical method supported by empiricalcircumstances and documented analysis. This method is applied consistently and with a
higher level of conservativeness when the available data is limited. All instruments that
are valuated at market prices are exposed to market risk. These financial instruments are
reported in the bank's financial condition report at fair value on the basis of market prices
quotes, and the effect from changes in the market conditions is recognised as profit or loss
in the comprehensive income statement.
The VaR method is defined as the estimated maximum loss amount from a given in-
strument or portfolio which can be expected over a particular time interval and a specified
level of probability. The level of probability at which that value will not be exceeded,
should be determined in advance6, and in practice it is usually set between 95% and 99%
(one-sided confidence interval). In theory, the period when the estimated loss cannot be
exceeded is the period required for the sale or hedging of the position (the time for the
position's closing-up). The shortest period is one day and it is used in banks, while the
longest one is usually one year and is used by investment funds. The standard practice has
determined this period to be 10 days (a 10-day equivalent period of holding). Changes in
the current portfolio's value are calculated on the basis of possible changes in the risk
6 Fair Value Measurement and Modeling: An Assessment of Challenges and Lessons Learned from the Market
Stress, BIS, BCBS, June 2008
8/10/2019 MRMA of Bank
http://slidepdf.com/reader/full/mrma-of-bank 11/16
Market Risk Management in Banks – Models for Analysis and Assessment 405
parameters during the following working day. These possible changes of risk parameters
can be determined by three methods – the historical simulation method, the parametric
value at risk method and the variance-covariance method.
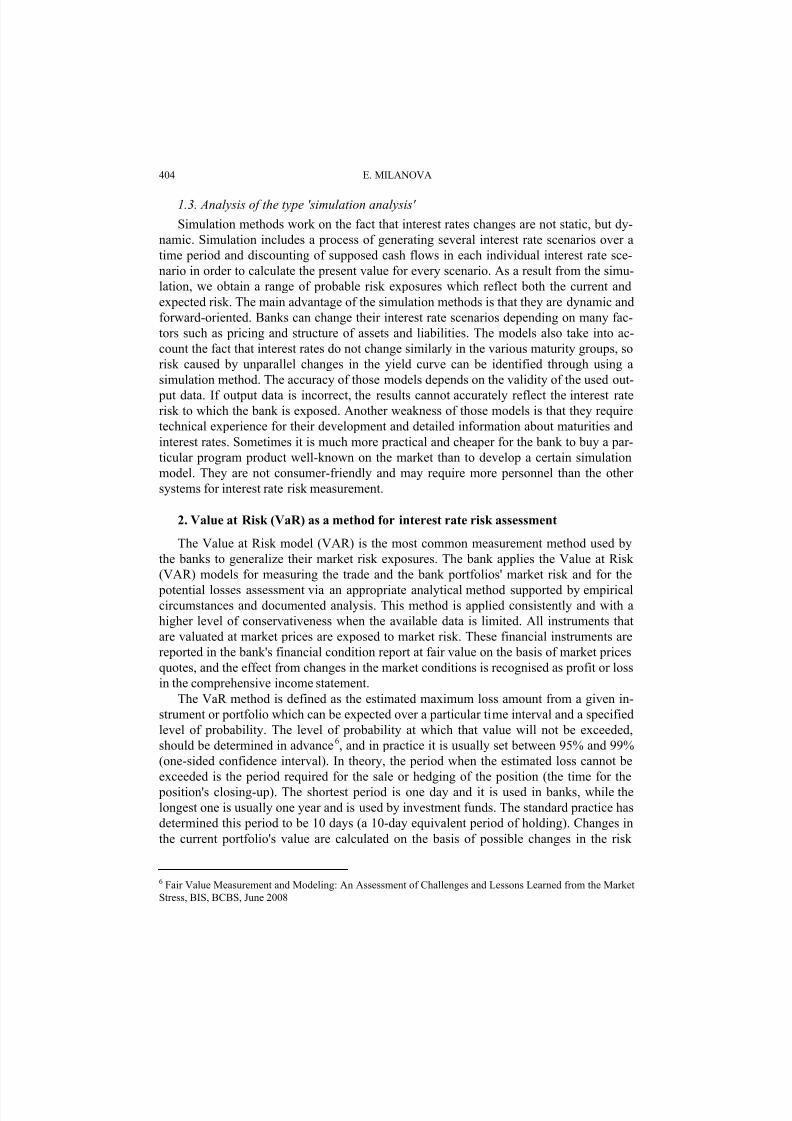
2.1. Historical simulation
Under this method, forecasts for the influence of market changes can be made. The
method includes the use of historical changes in risk factors and parameters observed over
a particular period-extract. Usually, for that purpose the banks go one year back, yet some
banks use longer periods of 4 or more years. For each day of the previous year, the banks
examine the daily movements and compare with the previous day as regards all market
determinants. Here are included all the interest rates, currency exchange rates, movements
on commodity exchanges and the volatility of all market variables. If a 1-year historical
period is used, this process leads to 250 scenarios. One of advantages in the use of his-torical scenarios is that these scenarios have already taken place. On the other hand, it is
unlikely that in future historical events will happen exactly the same way.
Table 1
2009
Average Maximum Minimum As at 31.12.
Value at Risk in trade portfolio – interest rate risk 1316 1785 526 540
Value at Risk in trade portfolio – price risk 408 508 2 1 0 405
Value at Risk in bank portfolio – market risk 6056 7767 4277 5305
Value at Risk in bank portfolio – currency risk 118 362 32 84
Total Value at Risk 7898 10422 5045 6334
2008 Average Maximum Minimum As at 31.12.
Value at Risk in trade portfolio – interest rate risk 2595 4264 808 1327
Value at Risk in trade portfolio – price risk 842 1514 210 211
Value at Risk in bank portfolio – market risk 1567 5240 386 4735
Value at Risk in bank portfolio – currency risk 111 275 60 96
Total Value at Risk: 5115 11293 1464 6369
2.2. Parametric Value at Risk
Under the parametric or structural VaR method, a statistical model for price determi-
nants or market variables is used. Here the presumption is that all risk parameters are
'normally distributed', i.e. the average daily change is zero. The standard deviation of
these normal distributions is tested against the historical data about each risk parameter.
As the relation between the risk parameters and the portfolio value is set to be linear, adifferent normal distribution of possible changes in the current portfolio is created when
applying the normal distribution of risk parameters to valuation models. With the aid of
that normal distribution's characteristic it is very easy to calculate the portfolio's Value at
Risk. Value at Risk can as well be used for composite portfolios, and for this purpose the
variance-covariance method is applied.
8/10/2019 MRMA of Bank
http://slidepdf.com/reader/full/mrma-of-bank 12/16
E. MILANOVA406
2.3. Variance-covariance approach
According to the parametric VaR method, the most important factor for risk determi-
nation of a position containing only one product is product volatility as a result from
changes in the risk parameters. That volatility can be calculated with the aid of the stan-
dard deviation. In the case of a composite portfolio, we should consider the entire portfo-
lio's standard deviation.
The standard deviation of a composite portfolio with two sub-portfolios consists of
three elements:
standard deviation of the first portfolio;
standard deviation of the second portfolio;
factor showing a correlation between the two portfolios.
The structural VaR models can be applied for some option portfolios, but as a wholethey cannot measure the value at risk for all option positions. As an alternative to the pa-
rametric VaR models, scenario analyses can be used: the grid approach and the Monte
Carlo simulation.
Grid / coordinate approach
This approach supplements the structural VaR method on the basis of delta equiva-
lence. It consists of two parts: first, the delta-equivalent parametric value at risk; second, a
simple scenario approach. First the delta equivalent value at risk is calculated via the pa-
rametric VaR on the basis of the delta-equivalent portfolio. That produces a first-tier ef-
fect on the portfolio's price movements and therefore is only part of the actual risk. For
calculating the effect of the other variables, the portfolio's first-tier price effect calculated
in advance, is gradually removed. Several scenarios for simultaneous movement of prices
and volatility are applied on that delta-neutral portfolio. The results from both calcula-
tions are summed up and in that is how the portfolio's total value at risk is determined.
Monte Carlo simulation
This scenario analysis is developed to overcome the limitations of the Grid analysis. It is
complete and incorporates all market variables. Under it very large number of hypothetical
scenarios on the basis of the measured movements in the various market variables during the
last year. On the basis of a 250-day scenario used for the historical VaR, we create a
countless number of possible scenarios. Each historical result for an individual variable is
combined with each possible historical results combination for all the other market variables.
As scenarios are randomly drawn out of that large number of scenarios created by the model,
the analysis is called the Monte Carlo simulation. These randomly selected scenarios are
applied to the current portfolio and the value at risk is calculated. Today, this approach is
used as a standard for the evaluation of portfolios with option nature.
2.4. Back-testing
As in all models, the validity of the value at risk models should be tested regularly. This
kind of testing is performed by both the financial institution's management and the
supervisors. The most evident approach is to make a comparison between the model fore-
casts for the previous period and the actual results. Such a statistical analysis is called 'back-
testing'. One of the value at risk concept's advantages is the easy conducting of that testing.
8/10/2019 MRMA of Bank
http://slidepdf.com/reader/full/mrma-of-bank 13/16
Market Risk Management in Banks – Models for Analysis and Assessment 407
Generally speaking, back-testing consists of determining how often the value at risk
has been exceeded over the examined period. If a 97.7% probability has been established,
exceeding should not happen in more than 2.28% of the cases, i.e. in 2.28 days within a
100-day period or 4.56 days within a 200-day period. All the additional tests have been
developed to assess the extent to which the probability limit can be exceeded with no fatal
decrease in the model's reliability.
Although the value at risk is a good instrument for risk measurement in the portfolio
under normal circumstances, the model manifests shortcomings in extreme situations
known as 'events'. This could be overcome by complimenting the value at risk analysis
with a method that provides more information about the risks arising under extreme mar-
ket circumstances. This additional method is called 'stress testing'.
2.5. Stress testsStress tests are a way to identify the risk to which the ban is exposed when the model
assumptions cannot be applied or in the case of exceptional events. Stress tests are used to
determine whether the financial institution is strong enough to overcome extreme shocks
on the financial markets. Stress testing is a set of techniques which measure the influence
of exceptional, but not impossible market conditions on the bank's incomes or financial
position7. Prior to conducting the portfolio stress test, the frame of its performance should
be created to include: the possible scenarios, assumptions as regards the market condi-
tions, portfolio revaluation and possible applications of the stress testing results.
In choosing the possible scenario, the market variables which should be stressed are
affected. A decision should be taken on whether to stress just one variable over time or a
set of several variables simultaneously. The first method relates to sensitivity analysis.
The second method under which several market variables 'collapse' simultaneously is
called 'a scenario one' (see Table 2).
After having selected the variables which are to be stressed, the risk manager should
add the stress test details, by for example making some assumptions that everything can
change under extreme circumstances. For the purpose, suggestions are made in the fol-
lowing areas: degree of shock, volatility, correlation, market liquidity, financial limita-
tions of own bank, market structure, risk inter-relatedness.
The stress test results can be used for different purposes, such as risk reporting, identi-
fication of portfolio weaknesses, establishment of risk limits, capital allocation, and posi-
tions adjustments.
The main disadvantage of stress tests is that they are too expensive and do not ensure
a 100% guarantee against the maximum market risks to which banks are exposed. Despite
all that, stress tests remain a mandatory supplement to the standard method 'Value at Risk.
Used along, these methods render quite an accurate picture of the risks to which banks areexposed when trading on financial markets.
7 Technical Aspects of Stress Testing under the Supervisory Review Process, CEBS, December 2006

8/10/2019 MRMA of Bank
http://slidepdf.com/reader/full/mrma-of-bank 14/16
E. MILANOVA408
Table 2
POSITION & SPECIFIC STRESS TEST 31/05/20..
Position analysis Stress test
Risktype
DescriptionNotionalamounts
Var Description P&LEquityeffect
Htm&
DSLTotal
FX Treasury Position
(excl. EUR)
FX Treasury Position
against EUR
FX Capital Position
against EUR
2.5
31.8
275
FXOpen FX
positionFX Limit
(excl. EUR): 2
FX Limit Treasury
Position against
EUR: 50 long, 10
short
FX Limit against
EUR: 325 long
-
20% depreciation oflocal currency
against all foreign
currencies
62 - - 62
Retail Deposits
Wholesale Deposits
Wholesale Funding
Loans
Interbank
Placements
1,377
623
403
1,980
344IR
Core
banking,
interbank
transactions
&
wholesale
fundingIR Bank Limits: 1Y
eq.: 350 & 10Y eq.:
125
Assets: 2,869
-
+200 bps shift in
swap curve
(BGN only)
+100 bps shift in
swap curve(all other currencies)
- - 5 5
Government Bonds -
Asset Swaps
Government Bonds
Corporate Bonds
147
13
49
IRBonds &
asset swapsTotal Bonds Avg
Maturity 4.07 Y -
Longest 26.2 Y
-
+200 bps shift in
swap curve
(BGN only)
+100 bps shift in
swap curve
(all other currencies)
+100 bps increase in
Country's credit
spread
0 -8 0 -8
IR Otherderivatives
FX Derivatives
CCIRS
IRS
267
380
25
-
+200 bps shift in
swap curve
(BGN only)+100 bps shift in
swap curve
(all other currencies)
8 - - 8
Proprietary portfolio
of BSE-listed shares1.8 0.18
EQEquity
portfolioEquity limit: 2.0
20% drop in equity
prices across the
board
-0.11 -0.24 - 0
Total stress test 69 -8 5 66

8/10/2019 MRMA of Bank
http://slidepdf.com/reader/full/mrma-of-bank 15/16
Market Risk Management in Banks – Models for Analysis and Assessment 409
3. Sensitivity to market risk
The analysis of the assets and liabilities' sensitivity to market risk in the table below
shows the degree in which changes in the market interest rates, currency exchange rates,
prices of shares or exchange tradable commodities can have an adverse impact on the
bank's incomes and capital position (see Table 3).
Table 3
31.12. 20..Total effecton economic
value
Direct effecton income
report
Directeffect oncapital
Other
Interest rates+250 b.p. parallel shift for local currency
+200 b.p. parallel shift for other currencies 16,992 (737) (2,030) 19,759
-250 b.p. parallel shift for local currency
-50 b.p. parallel shift for Euro (11,622) 728 546 (12,896)
-25 b.p. parallel shift for other currencies
Stocks / Stock indexes / Mutual funds
-25% price decrease (1,010) (318) (692) -
+25% price increase 1,010 318 692 -
Currency exchange rates
-25% depreciation for local currency 19,486 19,486 - -
20% appreciation for local currency (15,589) (15,589) - -
CONCLUSION
In contrast to the traditional credit risk, market risk does not arise as a result from the
inertness of the issuer or seller of financial instruments or assets. Market risk, as we have
defined it, is the risk of possible losses from the bank' balance sheet and off-balance sheet
items as a result from adverse dynamics of the market prices. The risk arises not only
from market changes, but also as a result from actions performed by market participants
which can take risk upon themselves, but can as well 'rid of' it. The increase in the poten-
tial market risk for banks is explained with the diversification of the bank's business
activities which go beyond the frames of traditional brokerage functions and adopt trading
and investment operations with financial instruments that bring high potential income forcapital increase, but at the same time make banks face significantly higher risk. Market
risk is associated not only with the standard instruments, but also with various derivative
financial instruments such as options, forwards, futures, and swaps (derivative instruments
of stock capital, currency and interest derivatives).
In its essence, market risk requires adequate management and analysis systems to as-
sess each significant risk element; to use generally accepted financial concepts and tech-
niques for risk measurement; to have accurately documented quantities and parameters.
Basel ІІІ (the Basel Committee's reforms program) sets new special requirements for the
8/10/2019 MRMA of Bank
http://slidepdf.com/reader/full/mrma-of-bank 16/16
E. MILANOVA410
bank's capital for covering the market risk, which are related to rigorous qualitative and
quantitative standards of this risk management process.
R EFERENCES
1. Greuning, H., Bratanovic, S., Analyzing Banking Risk (A Framework for Assessing Corporate Governance and
Financial Risk Management), Washington D.C., 2000.
2. Jorion, P., Value at Risk: The New Benchmark for Controlling Risk, Chicago-London, 1994.
3. Vatev, Zh., Georgiev, G., Analysis of the Bank Activity, V. Tarnovo, 2004.
4. Wills, G./J., Risk Management in the Banking Sector (translation from English), Varna, 1996.
5. Zawadska, Z., Dzozdovska, M. et all, Banking (translation from Polish), UNWE, Sofia, 2004
6. Amendment to the Capital Accord to Incorporate Market Risks, BIS, BCBS, November 2005.
7. Fair Value Measurement and Modeling: An Assessment of Challenges and Lessons Learned from the
Market Stress, BIS, BCBS, June 2008.8. Guidelines for Computing Capital for Incremental Risk in the Trading Book, BIS, BCBS, July 2009.
9. Guidelines on the Application of the Supervisory Review Process under Pillar 2, 25 January 2006.
10. Guidelines on Interest Rate Risk in the Banking Book, 3 October 2006.
11. International Convergence of Capital Measurement and Capital Standards, A Revised Framework,
BCBS, June 2004.
12. Principles for the Management and Supervision of Interest Rate Risk, BCBS, July 2004.
13. Revisions to the Basel II Market Risk Framework, BIS, BCBS, January 2009.
14. Strengthening the Resilience of the Banking Sector, BCBS, July 2009.
UPRAVLJANJE TRŽIŠNIM RIZICIMA U BANKAMA –MODELI ZA ANALIZU I PROCENU
Emilija MilanovaTržišni rizik je povezan sa fluktuacijama cena na č etiri najvažnija ekonomska tržišta: tržištu dužnič kih
hartija od vrednosti osetljivih na promenu kamatnih stopa; berzi; deviznom tržištu, i tržištu roba. U vezi
sa ovim, tržišni rizik je rizik da će vrednost finansijskog instrumenta fluktuirati kao rezultat promena u
tržištu cena, bez obzira na to da li su te promene prouzrokovane faktorima tipič nim za pojedinač ne
instrumente ili njihove emitente, ili faktorima koji se odnose na sve instrumente kojima se na tržištu trguje.
Ovaj rad predstavlja najvažnije komponente tržišnog rizika – rizik kamatne stope, devizni rizik, i ritik
cene. Metodi za merenje rizika kamatne stope uključ uju analizu debalansa, analizu trajanja i simulacioni
model. Model Vrednosti pod Rizikom (VpR) je predstavljen kao osnovni metod za analizu tržišnog rizika.
Posebno mesto je posvećeno testovima opterećenja kao tehnici za pouzdano upravljanje rizikom koja se
koristi u potencijalnoj proceni uticaja pojedinač nih faktora ili promena u mnogim finansijskim
parametrima prihoda banke, kapitala i tržišne vrednosti.
Ključne reči: rizik kamatne stope (uključ ujući i rizik revaluacije, osnovni rizik, opcioni rizik), devizni
rizik, rizik cene, gep analiza, VpR analiza