MRI QA - AMOS Onlineamos3.aapm.org/abstracts/pdf/77-22640-311435-101908.pdfACR 2004 Magnetic...
35
Wright Center of Innovation in Biomedical Imaging MRI QA Technologist’s Tests Guang Jia, PhD Associate Professor Department of Physics Louisiana State University AAPM 55th Annual Meeting
-
Upload
vuongduong -
Category
Documents
-
view
216 -
download
1
Transcript of MRI QA - AMOS Onlineamos3.aapm.org/abstracts/pdf/77-22640-311435-101908.pdfACR 2004 Magnetic...

Wright Center of Innovation in
Biomedical Imaging
MRI QA
Technologist’s Tests
Guang Jia, PhDAssociate Professor
Department of Physics
Louisiana State University
AAPM 55th Annual Meeting
Wright Center of Innovation in
Biomedical Imaging
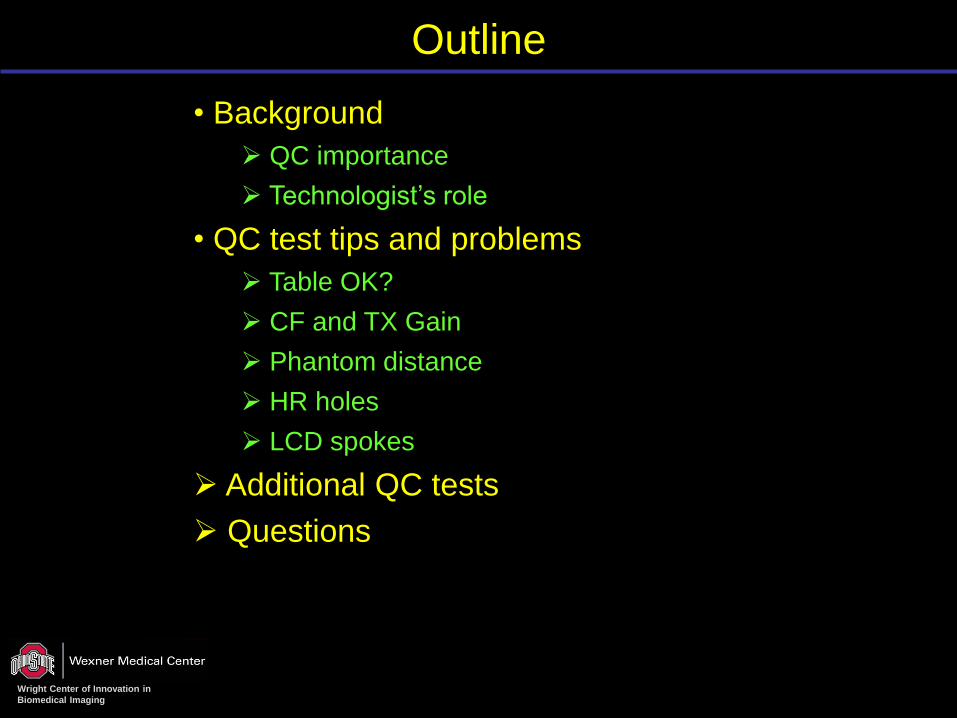
Outline
• Background
QC importance
Technologist’s role
• QC test tips and problems
Table OK?
CF and TX Gain
Phantom distance
HR holes
LCD spokes
Additional QC tests
Questions
Wright Center of Innovation in
Biomedical Imaging
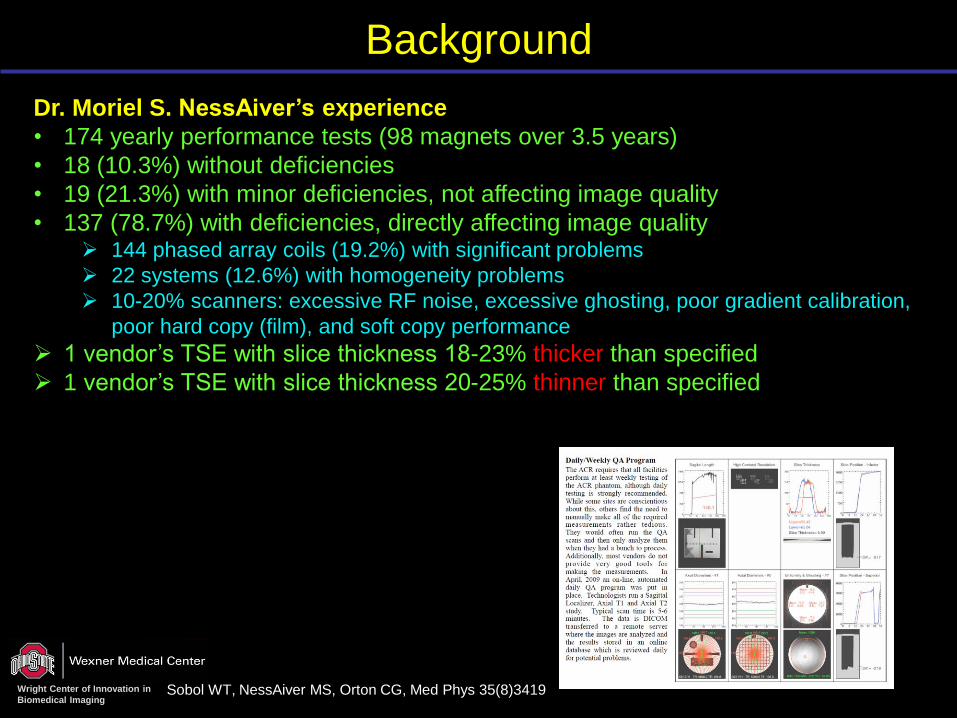
Background
Dr. Moriel S. NessAiver’s experience
• 174 yearly performance tests (98 magnets over 3.5 years)
• 18 (10.3%) without deficiencies
• 19 (21.3%) with minor deficiencies, not affecting image quality
• 137 (78.7%) with deficiencies, directly affecting image quality 144 phased array coils (19.2%) with significant problems
22 systems (12.6%) with homogeneity problems
10-20% scanners: excessive RF noise, excessive ghosting, poor gradient calibration,
poor hard copy (film), and soft copy performance
1 vendor’s TSE with slice thickness 18-23% thicker than specified
1 vendor’s TSE with slice thickness 20-25% thinner than specified
Sobol WT, NessAiver MS, Orton CG, Med Phys 35(8)3419

Wright Center of Innovation in
Biomedical Imaging
Daily/Weekly QA Program

Wright Center of Innovation in
Biomedical Imaging
Technologist’s Role
Wright Center of Innovation in
Biomedical Imaging
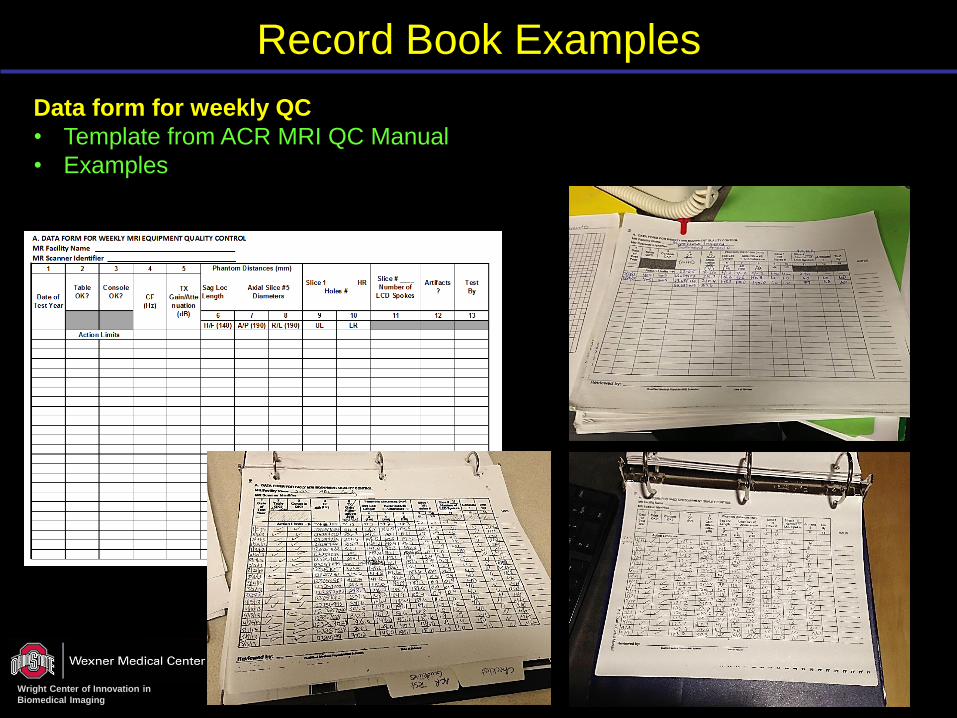
Record Book Examples
Data form for weekly QC
• Template from ACR MRI QC Manual
• Examples
Wright Center of Innovation in
Biomedical Imaging
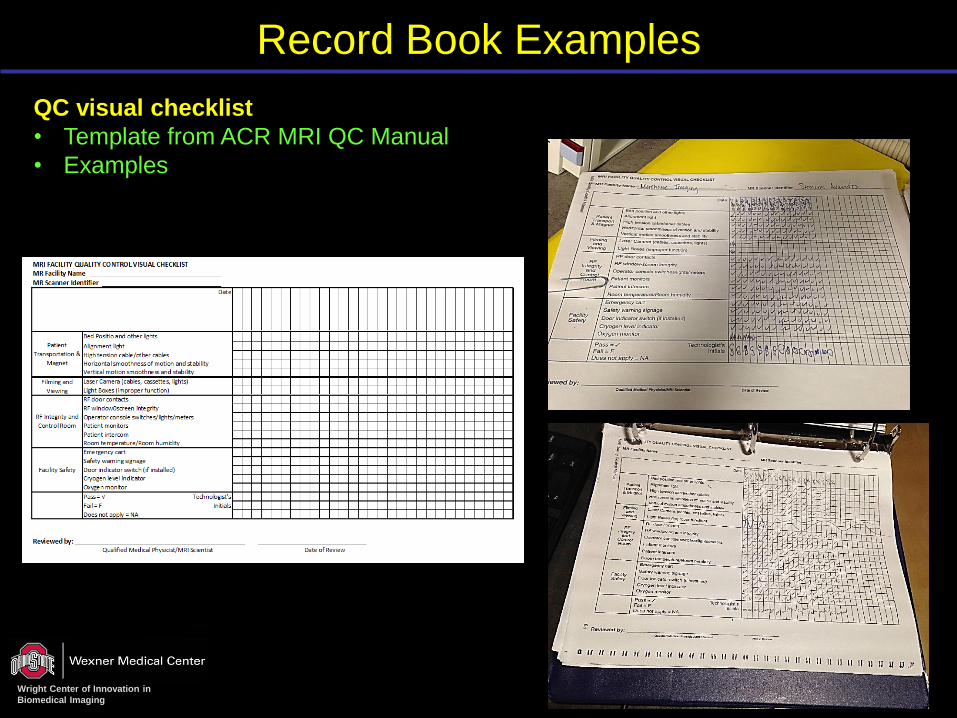
Record Book Examples
QC visual checklist
• Template from ACR MRI QC Manual
• Examples

Wright Center of Innovation in
Biomedical Imaging
“Table OK?”
Table OK?
• A test about the accuracy of the laser localizer
• Page 35 of ACR Manual 2004 version
• Frequently ignored by technologists
• Most technologists misunderstand that it is a check of whether the table move
smoothly
Laser Light

Wright Center of Innovation in
Biomedical Imaging
“Table OK?” on Siemens Scanner
Procedure
• Open the sagittal localizer image
• User “PixelLens” to check the top edge of the vertical bars
• The location should be within ± 2mm
• < H(ead)2 or F(oot)2

Wright Center of Innovation in
Biomedical Imaging
“Table OK?” on GE Scanner
Procedure
• Open the sagittal localizer image
• User “Crosshair” to check the top edge of the vertical bars
• The location should be within ± 2mm
• < S2 or I2

Wright Center of Innovation in
Biomedical Imaging
“Table OK?” Offline Measurement
Philips EBW
• Open the sagittal localizer image
• User “Crosshair” to check the top edge of the vertical bars

Wright Center of Innovation in
Biomedical Imaging
“Table OK?” Offline Measurement
Philips EBW
• Open the sagittal localizer image
• User “Crosshair” to check the top edge of the vertical bars

Wright Center of Innovation in
Biomedical Imaging
Magnetic Field Drift
• Definition
Center frequency run down over time
• Drift reasons
Windings are not perfect superconductors
Eddy current interactions
• Drift rate
< 0.01 ppm per hour
< 107 Hz per week for 1.5T
< 214 Hz per week for 3T
• Enshrined drift level
3 ppm per day (AAPM report 34, 1992)
1 ppm per day (AAPM report 100, 2010): 447 Hz/wk for 1.5T and 894 Hz/wk for 3T
1.5 ppm per day (ACR MRI QC guide, 2004)
• Corrective action
Ask medical physicist or MRI scientist to re-check
Ask service to monitor the units to ensure
1. B0 field within RF transmit/receive frequency range
2. Draft rate does not increase

Wright Center of Innovation in
Biomedical Imaging
Central Frequency on GE scanner: 1
• GE Signa Horizon 1.5T
Place the phantom
Click “Auto Prescan” before run the localizer sequence
Record TG (transmit gain) and AX (central frequency)

Wright Center of Innovation in
Biomedical Imaging
Central Frequency on GE scanner: 2
• GE Signa Horizon 1.5T
Text page Series page
Record central frequency and transmit gain

Wright Center of Innovation in
Biomedical Imaging
Central Frequency on Siemens scanner
• Procedure
Before run a sequence, e.g. ACR T1 axial
“Options” “Adjustments…”
Record central frequency and transmit gain

Wright Center of Innovation in
Biomedical Imaging
Distance Measurement: WW and WC
• Setting window and level/center
To have the edges at the half-maximum value of the signal intensity
Skipped by some Technologists
First set window to 0 or 1
Adjust level/center about ½ white and ½ black, record level value
width = recorded level value
level/center = ½ recorded level value
W = 1
C = 256W = 256
C = 128
W = 1
C = 500W = 500
C = 250
W = 606
C = 303
W = 768
C = 384

Wright Center of Innovation in
Biomedical Imaging
Distance Measurement: Sagittal
• Sagittal Image
Avoid going through the black bar
< 148 ± 2 mm

Wright Center of Innovation in
Biomedical Imaging
Distance Measurement: Problem
• Sagittal Loc Length
145.3 mm (Stoneridge)
146.4 mm (Morehouse)
147.0 mm (Siemens SSCBC)

Wright Center of Innovation in
Biomedical Imaging
Distance Measurement: Axial
• Axial slice #5
One vertical
One horizontal
< 190 ± 2 mm
Examples:

Wright Center of Innovation in
Biomedical Imaging
Distance Measurement: Problem
• Vertical distance
194 mm (Siemens SSCBC 3T MRI)
Out of spec
Out of spec
Curved border
Axial
Axial

Wright Center of Innovation in
Biomedical Imaging
Spokes
• GE Signa Horizon 1.5T
Assign image 8 or 9?
# of spokes on the image?
Image 8
Image 9
Image 10
Image 11

Wright Center of Innovation in
Biomedical Imaging
Resolution
• GE Signa Horizon 1.5T
(1.0) Rows 1 through 4 of the UL array are resolved
(1.0) no columns or column 4 of the LR array could be resolved?
ACR MRI Accreditation Program Phantom Test Guidance

Wright Center of Innovation in
Biomedical Imaging
Resolution: ZIP
• Zero filled interpolation (ZIP)
ZIP512: zero fill up to 512x256
Better image resolution
Cost
1. Slower reconstruction times
2. Longer to transfer
3. Takes up more disk space
Unfiltered Image256x256
k-space data256x256
FT
Courtesy of Dr. Moriel S. NessAiver
Wright Center of Innovation in
Biomedical Imaging
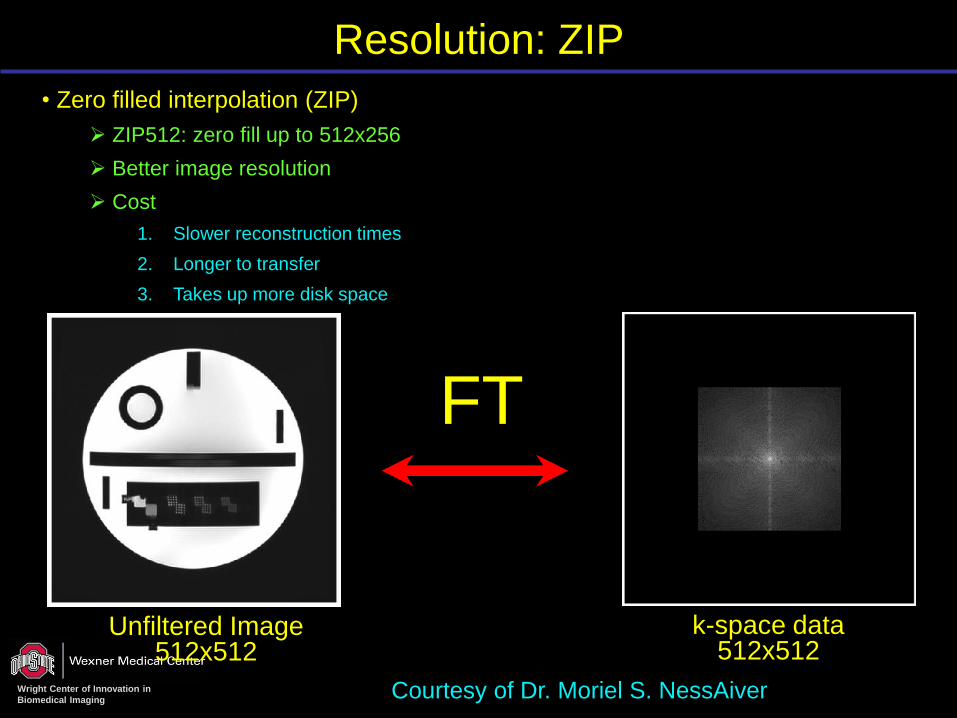
Resolution: ZIP
• Zero filled interpolation (ZIP)
ZIP512: zero fill up to 512x256
Better image resolution
Cost
1. Slower reconstruction times
2. Longer to transfer
3. Takes up more disk space
Unfiltered Image512x512
k-space data512x512
FT
Courtesy of Dr. Moriel S. NessAiver

Wright Center of Innovation in
Biomedical Imaging
Resolution: ZIP
• No ZIP
UL: 1.0
LR: 1.1
Not passing ACR criteria
• with ZIP512
UL: 0.9
LR: 0.9
Passing ACR criteria

Wright Center of Innovation in
Biomedical Imaging
Common Problems
• Problems
1. Central frequency: 4 digits? (should be 9 at 3T)
2. Phantom distance: 3 digits? (should be 4)
3. LCD spokes: Always 10 spokes? (because the tech used slice #11, should use
specified slice # 8)
1 2 3
Slice 11
Slice 8

Wright Center of Innovation in
Biomedical Imaging
Additional Tests
• Advanced clinical MRI procedures
MR spectroscopy
Diffusion imaging
Blood oxygen level dependent contrast (BOLD) imaging
Angiographic and blood perfusion methods
1. DCE-MRI

Wright Center of Innovation in
Biomedical Imaging
Diffusion

Wright Center of Innovation in
Biomedical Imaging
DCE-MRI
ACRIN CQIE Body PhantomPurpose of the DCE-MRI Phantom Tests:
• Provide means for qualitative and
quantitative evaluation, including T1
map error estimation, temporal
resolution and image quality.
• Evaluate compliance with image
acquisition protocols.

Wright Center of Innovation in
Biomedical Imaging
Question 1: Allowed weekly CF
drift from ACR Manual?
20%
20%
20%
20%
20% 1. 0.1 ppm
2. 1.0 ppm
3. 1.5 ppm
4. 2.0 ppm
5. 2.5 ppm
10

Wright Center of Innovation in
Biomedical Imaging
Question 2: Transaxial image
measurements on slice #?
20%
20%
20%
20%
20% 1. 1
2. 3
3. 5
4. 11
5. Any slice
10

Wright Center of Innovation in
Biomedical Imaging
Question 3: Table OK is for
checking?
20%
20%
20%
20%
20% 1. Bed position and lights
2. Laser light alignment
3. Patient monitors
4. Horizontal bed movement
5. Vertical motion smoothness
10

Wright Center of Innovation in
Biomedical Imaging
References
1. Sobol WT, NessAiver MS, Orton CG, Point/counterpoint. The physics components of the ACR MRI
Accreditation Program are overly tedious and beyond what is needed to ensure good patient care.Med Phys 35(8)3419
2. ACR 2004 Magnetic Resonance Imaging Qaulity Control Manual
3. Ihalainen TM, Lönnroth NT, Peltonen JI, Uusi-Simola JK, Timonen MH, Kuusela LJ, Savolainen SE, Sipilä OE.
MRI quality assurance using the ACR phantom in a multi-unit imaging center. Acta Oncol. 2011 Aug;50(6):966-72
4. Chen CC, Wan YL, Wai YY, Liu HL. Quality assurance of clinical MRI scanners using ACR MRI phantom: preliminary results.
J Digit Imaging. 2004 Dec;17(4):279-84.
5. NessAiver, Range of Results from over 534 ACR-mandated Annual MRI Performance Evaluations on over 204 Magnets
from 8 Vendors Spanning a 10-year Period, MRI QA RSNA 2011.
6. AAPM Report No. 110, Acceptance Testing and Quality Assurance Procedures for Magnetic Resonance Imaging Facilities, 2010
7. AAPM Report No. 34, Acceptance Testing of Magnetic Resonance Imaging Systems (Reprinted from Medical Physics,
Vol. 19, Issue 1)

Wright Center of Innovation in
Biomedical Imaging
Acknowledgements
Department of Radiology
Rick Layman
Brian Raterman
Xiangyu Yang
Georgeta Mihai
Jun Zhang