
MRI and DTI in Clinical Neurosurgery - MIT...
21
MRI and DTI in Clinical Neurosurgery Lauren O’Donnell December 19, 2005 1 Introduction This document attempts to describe the clinical practice of neurosurgery from the point of view of a computer scientist/medical engineer. I will focus on the current use of imaging technology in clinical practice and on the potential utility of diffusion tensor MRI imaging (DTI). The two main questions I have tried to answer are “How do doctors actually use MRI for neurosurgery?” and “What do doctors want to know that DTI might tell them?” This document was produced as part of MIT’s HST 203, Clinical Experience in Medical Engineering and Medical Physics. Over a period of three months in the fall of 2005, I shadowed Dr. Alexandra Golby (Assistant Professor, Depart- ment of Neurosurgery, Harvard Medical School) while she saw patients in her weekly neurosurgery clinic at Brigham and Women’s Hospital in Boston, MA. I attended many of her research group meetings, I attended an Epilepsy Board meeting, and I observed two neurosurgeries. In addition to the shadowing component, the project had a technical com- ponent. I produced 3D visualizations of the white matter of several subjects by clustering paths from DTI tractography, then grouping clusters by anatomical region. To my knowledge, this is the first time fiber clustering has been applied to neurosurgical visualization. I evaluated the utility of the visualizations with Dr. Golby, and here I present the “second try,” images that include some of the additional features she found necessary. The rest of this document is organized as follows: First I describe the clinical shadowing part of the project, focusing on how MRI was used in the situations I observed. This is followed by background on Diffusion Tensor MRI and a discussion of how Dr. Golby would like to be able to use this information. Finally I present visualizations of two surgical patients. 2 MRI Use in Neurosurgery MRI is extremely important in the neurosurgery clinic. There is a dark room with lightboxes and computers just like in a radiology department, and this room is where the doctors are when they are not seeing a patient. Before seeing a patient the scans are reviewed, often in concert with other specialists such as 1
Transcript of MRI and DTI in Clinical Neurosurgery - MIT...

MRI and DTI in Clinical Neurosurgery
Lauren O’Donnell
December 19, 2005
1 Introduction
This document attempts to describe the clinical practice of neurosurgery fromthe point of view of a computer scientist/medical engineer. I will focus on thecurrent use of imaging technology in clinical practice and on the potential utilityof diffusion tensor MRI imaging (DTI). The two main questions I have tried toanswer are “How do doctors actually use MRI for neurosurgery?” and “Whatdo doctors want to know that DTI might tell them?”
This document was produced as part of MIT’s HST 203, Clinical Experiencein Medical Engineering and Medical Physics. Over a period of three months inthe fall of 2005, I shadowed Dr. Alexandra Golby (Assistant Professor, Depart-ment of Neurosurgery, Harvard Medical School) while she saw patients in herweekly neurosurgery clinic at Brigham and Women’s Hospital in Boston, MA.I attended many of her research group meetings, I attended an Epilepsy Boardmeeting, and I observed two neurosurgeries.
In addition to the shadowing component, the project had a technical com-ponent. I produced 3D visualizations of the white matter of several subjects byclustering paths from DTI tractography, then grouping clusters by anatomicalregion. To my knowledge, this is the first time fiber clustering has been appliedto neurosurgical visualization. I evaluated the utility of the visualizations withDr. Golby, and here I present the “second try,” images that include some of theadditional features she found necessary.
The rest of this document is organized as follows: First I describe the clinicalshadowing part of the project, focusing on how MRI was used in the situationsI observed. This is followed by background on Diffusion Tensor MRI and adiscussion of how Dr. Golby would like to be able to use this information.Finally I present visualizations of two surgical patients.
2 MRI Use in Neurosurgery
MRI is extremely important in the neurosurgery clinic. There is a dark roomwith lightboxes and computers just like in a radiology department, and thisroom is where the doctors are when they are not seeing a patient. Before seeinga patient the scans are reviewed, often in concert with other specialists such as
1

radiation oncologists or other neurosurgeons. In general I was amazed by thesheer number of images for every patient, but also by the lack of any “fancycomputer science technology” in the clinic. In fact, the main technical difficultyfor physicians was learning the variety of programs for displaying MRI imagesthat come on CDs.
All image viewing that I saw used the standard two-dimensional slices whichdoctors are trained to read, as opposed to the fancy spinning three-dimensionalbrains that we as computer scientists are more accustomed to. I was surprisedthat even though surgery is fundamentally three-dimensional, trained surgeonsprefer two-dimensional information. This began to make sense, however, whenDr. Golby explained that in a three-dimensional scene, she can’t tell what is“in the slice” and what is “in front of it.” Obviously she needs to know exactlywhere the anatomy is, and the two-dimensional images are not ambiguous inthis way.
MRI in neurosurgery is fundamentally an aid for making decisions. In therest of this section I will describe how MRI has been used for making decisions inthe types of situations that I have observed in the clinic and operating room. Ihave grouped these into five main sections: tumors, hydrocephalus/shunt main-tenance, arteriovenous malformation or bleeding, neurosurgical planning, andneurosurgery.
2.1 Clinical Situation 1: Tumors
One of the most important decisions that must be made when a tumor is foundis how to treat it. Treatment options include “watch and wait,” biopsy, surgery,stereotactic radiosurgery (one large dose at once), stereotactic radiotherapy(smaller doses over a few sessions, for the case when the tumor is large or nearsensitive regions such as the optic nerve or chiasm), and chemotherapy (whichmay be combined with other treatments). The choice of treatment is influencedby several factors: a) the type of tumor, b) the rate of growth of the tumor, c)the size of the tumor, d) the location of the tumor, and e) the symptoms andcurrent quality of life of the patient.
MRI is used to evaluate factors a) through d). The tumor type is diagnosedbased on its appearance and location, using knowledge from years of clinicalexperience. For example in the case of one patient, the relevant question fordiagnosis was “Is this metastatic cancer or possibly MS?” because both couldappear as hyperintense regions on MRI. In another patient, there appeared tobe a tumor of the pineal gland on MRI which was then confirmed based ona positive history for recent inability to sleep. Another patient had a largetumor located at the brain surface in MRI images. This was diagnosed as ameningioma, a tumor of the meninges which cover the brain, based partially onits location (though later I learned that meningiomas can occur in the ventriclesas well).
The rate of growth of a tumor is evaluated using MRI scans from differentpoints in time. A patient with a small, slow-growing, or recently discoveredtumor might be in the “watch and wait” category. In this case, the tumor is
2

Tumor Type % DescriptionGlioma 50% From glial cells, supporting cells for neurons
This is a broad category with a wide range of malignancy.Meningioma 15% From meninges that cover the brain and spinal cordPituitary 10% Located in pituitary gland (may secrete hormones)Pineal 1% Located in pineal glandMetastatic Originates elsewhere in the bodyLymphoma Primary tumor, or rarely secondary (metastatic)
Table 1: Common Tumor Types in Adults (percentages from [1])
MRI Sequence Use Recognition TipT1 anatomical CSF dark; fat, white matter brightT2 lesion often bright CSF bright; fat, white matter darkFLAIR lesions bright CSF dark, white matter darkContrast blood-brain barrier Bright in sinuses and choroid plexus
and in most malignant tumors
Table 2: MRI Sequences
measured on two or more MRI scans (using the latest images and prior ones),and a decision is made as to whether it seems to be growing. The measurementis done by drawing a line with the mouse across the widest dimension, andpossibly perpendicular to that as well. Depending on the result, the patientmight need surgical treatment, or if not, would be asked to return with anotherscan after 3 months, 6 months, or a year.
Common types of tumors and their characteristics are listed in Table 1.Malignancy in brain tumors is defined not by whether they metastasize, sincethis does not happen with primary brain tumors, but rather by how quickly theygrow and by their cellular differentiation as measured by pathology (whetherthe cells look normal or have many mitoses, etc.). However tumors in otherparts of the body can metastasize to the brain.
Various MRI sequences are used to elicit information about a tumor. Table2 lists the ones that seemed to me to be the most used, as well as tips forrecognizing that type of image.
2.1.1 Tumor Follow-Up Care
Most of the tumor patients that I met were actually in the clinic for follow-up.This showed me how successful neurosurgery is. In general, MRI was used tocheck for recurrence of tumors.
3

2.2 Clinical Situation 2: Hydrocephalus/Shunt Mainte-nance
A shunt consists of a catheter which is inserted into the lateral ventricles, avalve, and a catheter that drains into either the peritoneum or the right atrium.In the case of a programmable shunt, a magnetic device is used to adjust theopening pressure of the valve. This is done in the clinic and must be performedafter every MRI since the shunt can be reset in a magnetic field. The currentopening pressure is read using a skull x-ray, and the image of the valve lookssort of like a clock with 2 (large and small) circles to give its orientation. Thevalve can be felt through the skin on the back of the head. On a CT scan, theshunt catheter appears as a very bright, thick line in a lateral ventricle.
I saw one patient who was in the clinic for follow-up of an emergency shuntrevision (that is what they call an operation to fix an existing shunt). In addi-tion, I saw another patient who was a candidate for a shunt. This patient wasan elderly woman who had enlarged ventricles seen on MRI, with the symp-toms of normal pressure hydrocephalus (NPH), a triad which includes urinaryincontinence, difficulty walking, and dementia. NPH is one of the few reversiblecauses of dementia in the elderly, because it can be reversed if the ventricles aredrained. Before surgery, an inpatient test is done to determine if CSF drainagereduces symptoms: a lumbar catheter is inserted to drain CSF gradually overa few days, and if the symptoms improve the patient is a good candidate for ashunt. Interestingly, Dr. Golby informed me that it is not known why or howthat particular triad of symptoms is caused by NPH, but stretching of frontalwhite matter tracts is implicated.
2.3 Clinical Situation 3: Arteriovenous Malformation orBleeding
I saw two patients that fell into this category. One patient had surgery to removean arteriovenous malformation that had caused one seizure. The other patienthad been referred to the neurosurgeon due to an event in the past year wherebleeding in the brainstem area had caused diplopia. In both cases the MRI wasinspected for vascular abnormalities.
2.4 Clinical Situation 4: Neurosurgical Planning
I learned about planning for two types of neurosurgeries, radiation therapy andstandard surgery. In stereotactic radiosurgery, the general idea is to aim beamsof radiation into the skull from many directions, such that the beams convergeto produce a high dose only inside of the tumor. There are multiple types ofradiosurgery machines, most of which require stereotactic frames to fix the headin place, and one which is called the CyberKnife which automatically detectshead position. Planning for radiation therapy involves defining the tumor lo-cation and pinpointing the location of sensitive regions which include the optic
4
nerve and chiasm. This information is then analyzed by treatment planningsoftware.
The conversations I have had with Dr. Golby about planning for conven-tional neurosurgery focused mainly on current and potential uses of DTI. Thisinformation is included later in this document, in sections 3.2 and 4.
2.5 Clinical Situation 5: Neurosurgery
I observed two neurosurgeries. The first one was actually prior to the officialstart of this project. In this case I saw the beginning of the surgical process,including head fixation with a frame, registration of presurgical MRI data, andcortical stimulation for language mapping. The presurgical MRI was registeredby touching points on the face and scalp with a surgical probe, which then werealigned with the head surface from the scan. The mapping was done by askingthe patient to count, then stimulating in different regions to find those whichcaused his speech to waver or stop. There were also epilepsy doctors presentand cortical electrodes were used to test for seizures. The EEG was visible ona screen next to the patient.
The next neurosurgery was a trans-sphenoidal resection of a non-secretingpituitary tumor. The approach in this type of surgery is through the nose,through the sphenoid sinus, and through the sella turcica (the bony cavity atthe skull base where the pituitary gland is located). The sella is separated fromthe rest of the brain by a membrane, the diaphragma sellae, so the brain isstill separated from the sinuses after the surgery. The sphenoid sinus bordersthe optic nerve and interior carotid which must be avoided. In this surgery,both an endoscope and a surgical microscope were used. Both produced clearimages of the surgical field, but the endoscope could be inserted into the sinusand therefore had a wider field of view; however it could not be locked in placelike the surgical microscope. Surgical navigation was aided by CT images andthe VTI/GE surgical guidance device. Image registration was done by meansof a light plastic stereotactic headpiece which was worn during the scan andreplaced in the same position before surgery. Specific points on the headpiecewere touched with the surgical probe in order to register the images to thepatient. Then during surgery, the surgical probe was inserted into the sinusesperiodically, to check the depth and trajectory towards the tumor. This surgerywas amazing because using the surgical microscope it was not possible to seeinto the sella turcica, so Dr. Golby spent hours patiently removing all possibletumor from the (unseen) cavity using very small “scraping” tools which wereon the end of long, thin handles.
3 The Potential Role of Diffusion MRI
Diffusion MRI is the first noninvasive technique for measuring white matterfiber structure in vivo. Thus it has begun to see use in neurosurgical plan-ning and guidance [5, 13, 10, 4]. The majority of the cited studies focus on
5
three-dimensional reconstructions (approximations) of the fiber tracts througha process called tractography, while one article describes tumor appearance ontwo-dimensional images that use color to show tract orientation. It should benoted that unlike all previously available types of MRI images, a single DTI im-age slice is fundamentally not two-dimensional because at every voxel location,there is an estimate of diffusion in three dimensions.
In this section I briefly give background information on DTI data, thenI present a description of how Dr. Golby would like to be able to use theinformation from DTI, with a list of her specific application suggestions. FinallyI will present information from the literature on DTI in neurosurgery.
3.1 DTI Background Information
Diffusion MRI measures the diffusion of water molecules. The amount of diffu-sion can be measured in any direction, and by choosing many evenly distributeddirections, one can build up a 3D model of diffusion magnitude. This is usefulin tissues with a strong orientation like white matter or muscles, because theamount of diffusion in each direction is determined by the tissue structure. Theexact cause is unknown, but in the brain higher diffusion is measured parallel towhite matter fiber tracts than perpendicular to them, so diffusion measurementscan be used to give a local fiber coordinate system. The simplest representa-tion of the shape of diffusion in 3D is the diffusion tensor, a 3x3 symmetric,positive-definite matrix whose major eigenvector points in the principal diffu-sion direction (direction of the highest diffusion). The principal eigenvector willnot always match an underlying fiber tract direction (for example in the ven-tricles there are no fiber tracts yet diffusion can be measured) but if the largesteigenvalue is much larger than the last two eigenvalues, this is good evidencefor the presence of a tract.
Tensor anisotropy measures are ratios of the eigenvalues that are used toquantify tensor shape. Three intuitive measures are cL, cP , and cS , the linear,planar, and spherical shape measures. They describe whether the shape of dif-fusion (and the local tissue structure) is like a cigar (linear), pancake (planar),or sphere (spherical). The linear shape measure is defined as λ1−λ2
λ1(where the
normalization in the denominator can instead be the tensor norm) [12]. Thelinear measure is a good indication of the presence of a fiber tract. For this pur-pose, the fractional anisotropy (FA), a normalized variance of the eigenvalues,may also be used. However the FA is less specific for indicating the presenceof a fiber tract as it can be high in areas of planar diffusion which can indicatetract crossings or branchings [2].
DTI may be visualized in two or three dimensions, depending on the subsetof the data that is presented. An example of 2D and 3D visualization is foundin Figure 1. These images (and the rest of the images in this document) weregenerated with the DTMRI module in the 3D Slicer (software that I wrote inconjunction with the Lab for Mathematics in Imaging at BWH) along withadditional matlab code for tract clustering. On the left side of Figure 1, thetop image is a zoomed-in part of a semi-transparent coronal anisotropy image,
6
showing glyphs representing the major eigenvector in each voxel (technicallythese glyphs are displayed in 3D but as their out-of-plane component is hard tosee it’s essentially a 2D image). The two images in the lower left display the colorscheme commonly used to represent the orientation of the major eigenvector:blue is superior-inferior, red is left-right, and green is anterior-posterior [8]. Thebrightness in these images is controlled by tensor anisotropy, which can be seenwithout orientation color information in the lower right image.
On the right side of Figure 1 the top image contains tractography in a DTIdataset. The paths (variously and somewhat incorrectly referred to as “tracts”or “fibers” in the literature and in this document) were interpolated through themajor eigenvector field of the DTI data, in this case with second order Runga-Kutta integration. The different colors were assigned automatically by a wholebrain tract clustering process [7] and a subset of the clusters was selected tocreate this image.
3.2 Neurosurgical Description and Application Suggestionsfrom the Neurosurgeon
In this section I relate, to the extent that I have understood it, the point of viewof a neurosurgeon relative to DTI and the brain.
Surprisingly, I have learned that the unfixed brain has a consistency not dis-similar to Jello. It is “suckable.” The white matter fibers are not visible in anyway, but the consistency of a tumor is different and can be more fibrous. Dur-ing surgery, electrical stimulation is used to interrupt neural function (speaking,counting, movement) in order to assess proximity to eloquent regions. Theseare as opposed to “silent” regions whose function is harder to measure. Thisstimulation is done on the cortex, not in the white matter, so it does not directlyprovide information on which white matter regions are functional.
While the electrical stimulation is obviously an invaluable method, it couldbe helpful to have additional information about the structure of the white matterin the region of the lesion. Dr. Golby has suggested methods of presenting theinformation in a DTI scan that would be useful to her, the majority of whichhave not been tried before to my knowledge. Despite her general preference for2D images, she is in fact interested in 3D visualizations of fiber tracts, althoughat this point she is not sure to what extent they should be trusted. Currentlyshe finds the 2D images with superimposed glyphs to be the most useful insurgical planning. Her suggestions are discussed below and are summarized inTable 3.
Her first idea relates to the general concept that doctors analyze brain imagesby comparing the left and right side to look for abnormalities, and it is notclear how to do that with three-dimensional information from tractography.Dr. Golby suggested that color-coding corresponding tracts on the right andleft sides would facilitate this comparison. This is not a simple request as itdepends on having either anatomical labels for the tracts or an algorithm formatching them across hemispheres.
7

Figure 1: Two- and three-dimensional DTI visualization (in two different sub-jects)
8
The second two items in Table 3 have to do with the 3D information be-ing unclear. (“What is in front/behind/inside the tumor?”) In the 3D Slicervisualization system, it is possible to make a surface model of the tumor semi-transparent to see what is inside, but then it is not possible to differentiatewhether a tract is inside or behind the tumor. Similarly, when viewing tracts in3D along with 2D image slices, the 3D extension of the path visually occludesits intersection with the 2D slice and therefore with the tumor. So one sugges-tion is to augment the 3D view of the tracts by coloring them where they passthrough the tumor. Another possibility is to show the paths in the 2D slicesinstead.
The fourth item in Table 3 was extremely interesting. When neurosurgeonsmake the initial incision, they try to make it parallel to white matter fibers inorder to cut as few as possible. They do not “scoop” out a cavity, but rathercut a line in the surface and then follow that direction inward. The orientationof this line on the surface is determined by the known anatomical orientationof the fibers, however this is not patient-specific and may not be correct in allcases. Dr. Golby pointed out that this orientation may vary in neuroanatomicalillustrations, as in for example the fibers in Meyer’s loop around the inferior hornof the lateral ventricles, where an incision is made to approach tumors of theventricles. So she would like to somehow see which way the fibers are goingbelow the surface, in order to plan the orientation of the incision.
The last item in Table 3 relates to the fact that the fibers displayed usingtractography are most assuredly not representations of individual axons (witha scale of microns), but rather are paths which follow the most probable fiberorientations measured on a scale of millimeters using diffusion MRI. Due tonoise, partial voluming, or fiber crossing, tractography makes anatomical errors,and it is important to a) display only paths that pass quality thresholds and b)provide a visual quality estimate.
Application Suggestions from Dr. Golby1 Color code matching tracts on right and left.2 Color the part of the tract that is inside the tumor.3 Show the tracts on the 2D images.4 Show the fiber orientation for incision planning.5 Show how certain it is that the tract exists.
Table 3: Neurosurgical DTI Wish List
3.3 DTI In Tumors
The main potential use of DTI in neurosurgery is to evaluate whether functionalwhite matter is present in a tumor. However, DTI doesn’t measure function, itmeasures structure, and it is not a simple problem to correlate DTI anisotropymeasures and principal directions with white matter functionality. However,by assuming that function is preserved in white matter that looks “normal” on
9

DTI, methods have been suggested for assessing the integrity of fiber tracts.Using DTI color images the following categories have been introduced to
describe white matter tracts in the vicinity of a tumor: displaced, edematous,infiltrated, and disrupted [13, 3]. Their categorization was performed in thefollowing way: Displaced tracts were said to be those with normal anisotropy butabnormal location or orientation. Edematous tracts looked normal (orientationand anisotropy) in the DTI color images but had high T2 intensity. Infiltratedtracts were those which had reduced anisotropy but could be identified withDTI color images. Finally, disrupted tracts were classified as such if they couldnot be identified on the DTI color images.
In addition to the clinical application of DTI colormaps, various groupshave employed tractography to visualize the relationship between tumors andwhite matter [5, 10, 4]. In one recent paper, intraoperative tractography wasused to visualize and quantify the shifting of white matter fibers (primarily thepyramidal tract but in one case the corpus callosum) that occurs during surgery[5]. This study found average shifts of 2.7 mm, with a range from -8 to +15mm,where negative and positive numbers indicate movements toward and away fromthe craniotomy opening, respectively.
4 Two Surgical Cases, Illustrated Using AdvancedVisualization Tools
I created retrospective visualizations of two surgical cases in which tumors hadbeen resected by Dr. Golby. Each case had presurgical data including T1- andT2-weighted MRI, DTI, and fMRI.
Creation of the visualizations had several steps. The first step was whole-brain tractography, using a cL threshold to define the region of interest forseeding and a cL threshold for the anisotropy cutoff (where fiber tracking stops).The optimal thresholds for clustering applications are under investigation butthe range I have used for seeding is in general 0.2 to 0.35 minimum cL, and forstopping 0.15 to 0.25 cL. The minimum path length was 40mm. The secondstep in production of the visualizations was an automatic clustering of the pathsfrom tractography which produced approximately 120 bundles using spectralclustering as in [7]. The clustering step was followed by an interactive manualanatomical labeling. While developing this interactive tool in the 3D Slicerprogram, I performed anatomical labeling with repeated reference to the whitematter anatomy described in [6, 3, 11].
4.1 Case 1
Patient 1, a 54 year old male, presented with a seizure and word finding difficulty,and on MRI had a large left temporal mass. The tumor was resected and thepathologic diagnosis was anaplastic oligoastrocytoma, WHO Grade III. Duringsurgical resection in the posterior region, the patient had difficulty with speech;
10

Figure 2: Two-dimensional DTI visualization of patient 1. First row:MPRAGE, FA, cL. Second row: T2, DTI colormap (brightness by FA), DTIcolormap (brightness by cL). The window and level for the FA and cL imageswas set to be window of 1 and level of 0.5 to allow direct image comparison.
superiorly, electrical stimulation interrupted language function. About half ofthe tumor was resected while the rest was left to preserve function.
Figure 2 shows a standard 2D slice visualization at one axial location forpatient 1. The DTI colormaps would seem to indicate that tracts are not presentin this level of the tumor, due to the lack of anisotropy, according to references[13, 3]. However there are some bright spots in the tumor region seen in bothFA and cL images, and from this small subset of the images one can’t tell abouttract presence/absence in the rest of the tumor. Dr. Golby found there to belittle difference between the images with brightness modulated by FA and cL,so it seems this choice is not crucial for this application.
Figure 3 shows the raw output of the tractography clustering, where colorsare determined by by the clustering algorithm (similar colors appear when trac-tographic paths map near each other in the high-dimensional space in whichclustering is performed). Tractography was initiated in each voxel of a region ofinterest where cL was above .3. Tractography stopped when cL fell below 0.15.This low stopping value was chosen with the goal of “not leaving out anything”in the tractography. After tractography, which produced over 20,000 paths, arandom subset of 10,000 was selected for further clustering and display. Theanatomical interpretation of this initial clustering is not clear when all pathsare viewed at the same time as in Figure 3.
11

Figure 3: Raw output of whole-brain clustering, shown with axial, sagittal, andcoronal images. Each unique color represents a cluster.
12
After showing the tractography visualization in Figure 3 to Dr. Golby, Ireturned to the drawing (rendering?) board and attempted to clarify whichtracts were passing through the tumor. This is actually more difficult to answerthan it sounds, even with so much MRI data, in part due to the fact that it ishard to determine where the tract ends in a tumor. It is possible that edematoustissue contains functioning fibers, but that due to edema the anisotropy in thisregion is low, which will cause the tractography algorithm to stop tracing. Infact, anisotropy is found to be reduced in in the peritumoral area of both gliomasand metastatic lesions, but the mean diffusion (ADC) is higher at the borderof metastatic lesions, apparently due to a higher amount of edema [9]. Theanisotropy decrease bordering gliomas is partially attributed to infiltration sincethere is less edema [9].
Figure 4 shows one possibility for clarifying whether the tract is in a tumor.I have “painted” the tractographic paths with the T2 image volume (keepingthe same window/level as the T2 images) in order to transfer its informationabout tumor boundaries to the tract. In general this method could be used withany available images. I believe this is a useful viewing method, however thereare two issues. First the T2 volume could be bright due to edema rather thantumor, and second, the tract tends to “blend in” with the image unless anotheris placed behind it.
Dr. Golby found this image to be potentially useful, in that the cliniciancould decide about the tumor boundary intensities using the 2D images, then“paint” the tracts and see whether the tumor intersects. However she informedme that neither the T2 or the FLAIR images differentiate tumor from edema,and that there is interest in diffusion imaging for making this decision. Possiblyrelated to this, note that in Figure 4, in the right image with eigenvector glyphs,there appears to be a region of coherent orientation that was not traced bytractography. This could be due to lower anisotropy in the tumor region thatmay reflect edema rather than lack of white matter organization, or this regioncould be infiltrated but still look organized according to the major eigenvectors.
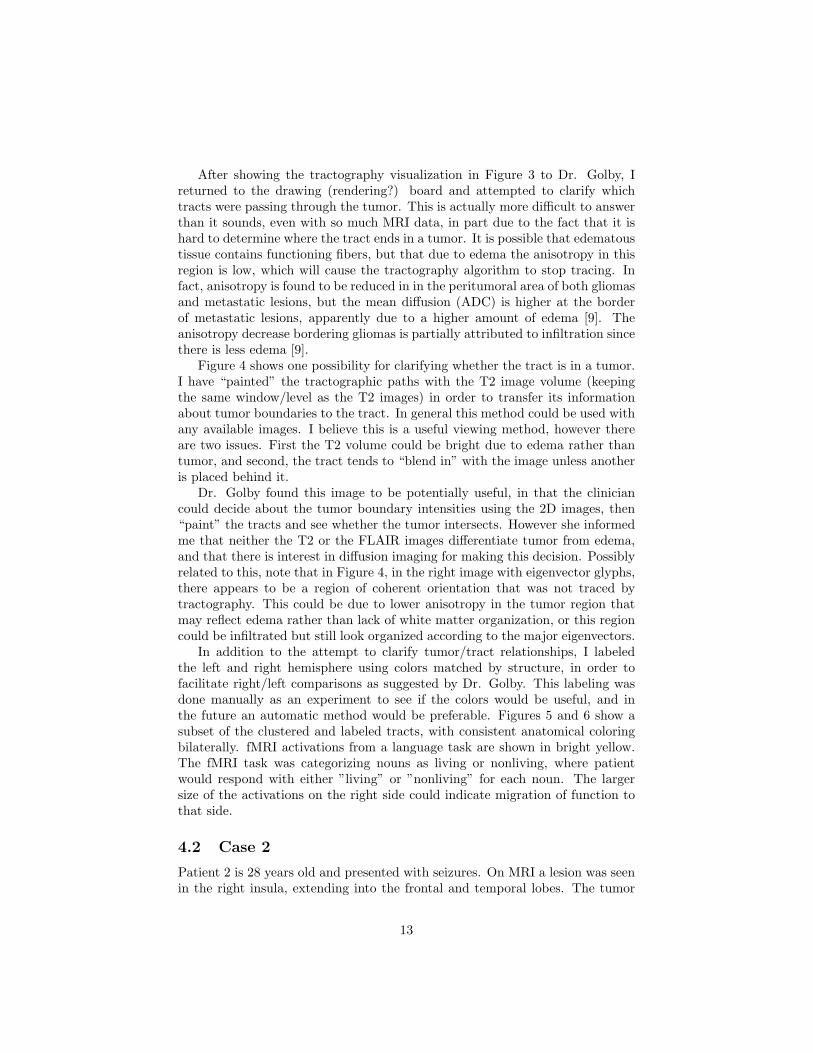
In addition to the attempt to clarify tumor/tract relationships, I labeledthe left and right hemisphere using colors matched by structure, in order tofacilitate right/left comparisons as suggested by Dr. Golby. This labeling wasdone manually as an experiment to see if the colors would be useful, and inthe future an automatic method would be preferable. Figures 5 and 6 show asubset of the clustered and labeled tracts, with consistent anatomical coloringbilaterally. fMRI activations from a language task are shown in bright yellow.The fMRI task was categorizing nouns as living or nonliving, where patientwould respond with either ”living” or ”nonliving” for each noun. The largersize of the activations on the right side could indicate migration of function tothat side.
4.2 Case 2
Patient 2 is 28 years old and presented with seizures. On MRI a lesion was seenin the right insula, extending into the frontal and temporal lobes. The tumor
13

Figure 4: Attempt to clarify whether the arcuate fasciculus passes through thetumor. The left two images show the left arcuate fasciculus, as defined by fiberclustering and labeling, colored using the T2 weighted images. In the middleimage the axial T2 is shown to allow comparison of intensities in the tumor andon the tract, while the sagittal T1 is shown for background contrast to make thetract more visible. The bottom image raises the question of if tractography washalted too soon, as there seems to be some organization in the tumor (where theposterior arcuate fasciculus fibers (light blue) meet the tumor). The eigenvectorglyphs in the bottom image are colored by anisotropy, with bright blue beinghighest.
14

Figure 5: Three-dimensional DTI visualization of patient 1, with consistent col-oring on both sides to facilitate left/right hemisphere comparison. Note thatthe tumor has displaced tracts inferiorly in the coronal view. The colors corre-spond to anatomy as follows: dark blue, ventricles; light blue, arcuate fasciculus;orange, inferior longitudinal fasciculus; dark purple, inferior fronto-occipital fas-ciculus; green, unknown name (arcuate or u-fibers); light purple, uncinate fas-ciculus; and yellow, fMRI language activations. All labeled tracts can’t be seenat once, so a subset is shown.
15
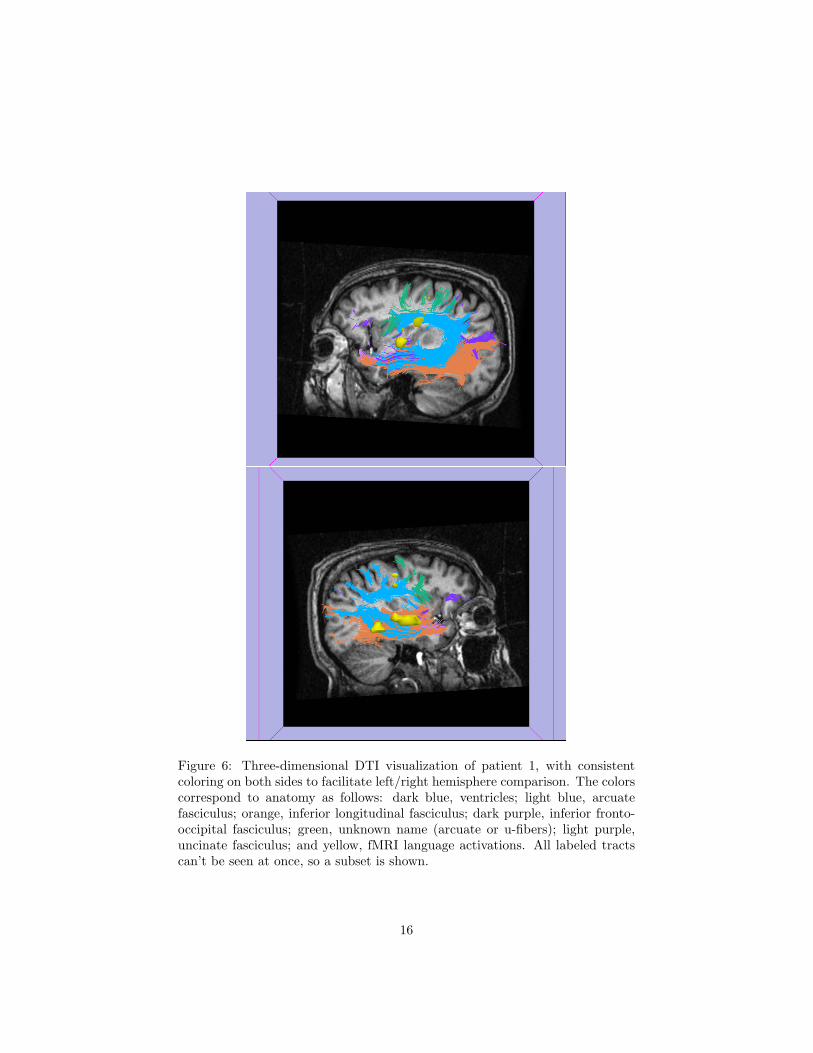
Figure 6: Three-dimensional DTI visualization of patient 1, with consistentcoloring on both sides to facilitate left/right hemisphere comparison. The colorscorrespond to anatomy as follows: dark blue, ventricles; light blue, arcuatefasciculus; orange, inferior longitudinal fasciculus; dark purple, inferior fronto-occipital fasciculus; green, unknown name (arcuate or u-fibers); light purple,uncinate fasciculus; and yellow, fMRI language activations. All labeled tractscan’t be seen at once, so a subset is shown.
16

Figure 7: Two-dimensional DTI visualization of patient 2. First row:MPRAGE, FA, cL. Second row: T2, DTI colormap (brightness by FA), DTIcolormap (brightness by cL)
was classified by pathology as a mixed oligoastrocytoma, WHO Grade II/IV.In this case I used the same settings as in Case 1 to produce the tractography
and create clusters, except that I used a random subset of 8,000 paths insteadof 10,000. Interestingly, using the same settings (and the same voxel size andsimilar number of slices) nearly 50,000 paths were initially produced in this 28year old subject, versus close to 20,000 in patient 1 (54 years old). This differencemay be caused by the overall anisotropy decrease with age, and shows that thesethresholds need further investigation.
Figure 7 shows the 2D visualization of the patient, while figures 8 and 9show the 3D tractography visualization with the same colors as applied in Case1. The shape of the corona radiata is quite different from left to right, and theuncinate fasciculus curves around the tumor. On the right side, fewer pathsbelonging to the occipitofrontal fasciculus (dark purple) were found.
5 Conclusion
I have presented the clinical and technical parts of my HST 203 project. Duringthe clinical shadowing part of the project, it became very clear that standardMRI is crucial in neurosurgery. In the technical half of the project, I realized(in fact I was told) that it is not yet clear how DTI should most profitably beemployed in neurosurgery. With input from Dr. Golby, I have demonstratedsome possible visualization methods that could aid neurosurgical planning. To
17
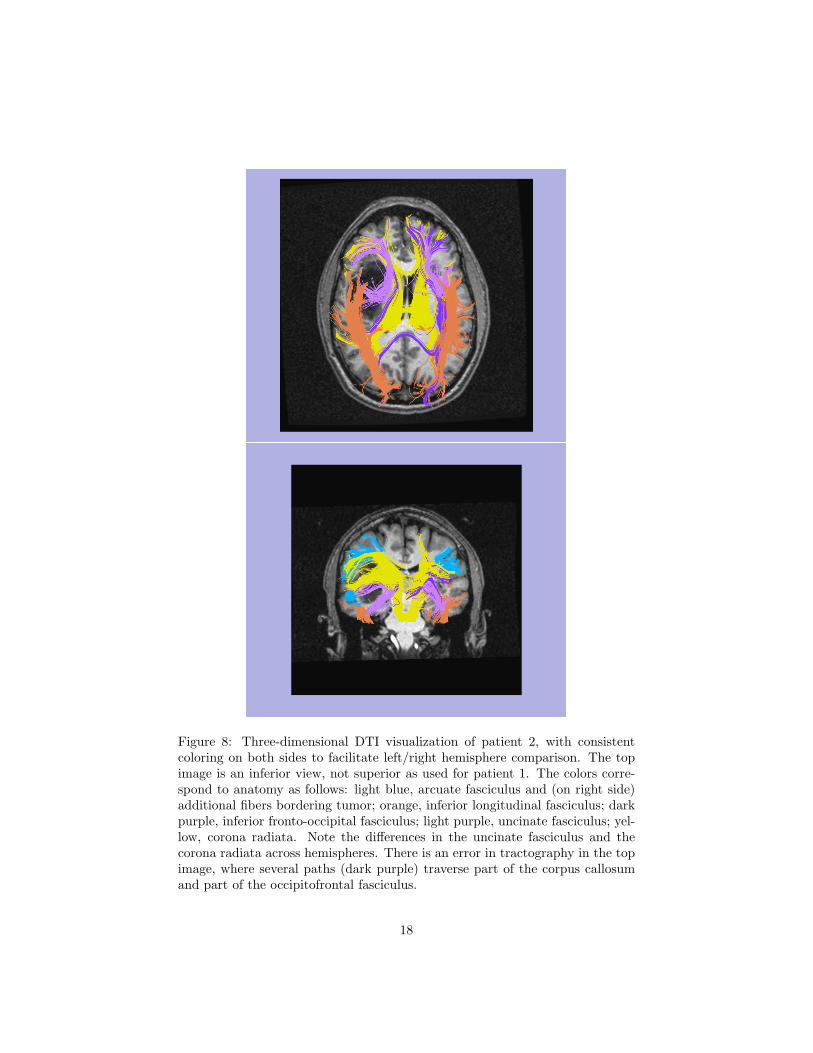
Figure 8: Three-dimensional DTI visualization of patient 2, with consistentcoloring on both sides to facilitate left/right hemisphere comparison. The topimage is an inferior view, not superior as used for patient 1. The colors corre-spond to anatomy as follows: light blue, arcuate fasciculus and (on right side)additional fibers bordering tumor; orange, inferior longitudinal fasciculus; darkpurple, inferior fronto-occipital fasciculus; light purple, uncinate fasciculus; yel-low, corona radiata. Note the differences in the uncinate fasciculus and thecorona radiata across hemispheres. There is an error in tractography in the topimage, where several paths (dark purple) traverse part of the corpus callosumand part of the occipitofrontal fasciculus.
18

Figure 9: Three-dimensional DTI visualization of patient 2, with consistentcoloring on both sides to facilitate left/right hemisphere comparison. The colorscorrespond to anatomy as follows: light blue, arcuate fasciculus and (on rightside) additional fibers bordering tumor; orange, inferior longitudinal fasciculus;dark purple, inferior fronto-occipital fasciculus; light purple, uncinate fasciculus;yellow, corona radiata. Note the differences in the uncinate fasciculus and thecorona radiata across hemispheres.
19

my knowledge, this is the first demonstration of whole-brain patient-specificanatomically labeled tractography for white matter visualization.
6 Acknowledgements
I would like to profusely thank Alex Golby for her amazing explanations of“everything” to do with neurosurgery and the brain, and for her wonderfulattitude about having a shadow. This has been an amazing experience. Thanksto Donna Della Iacono for explaining to me about radiotherapy planning andshunt pressure reading, and for showing me how the shunt pressure is set usinga magnetic device. Many thanks to the rest of the folks at the neurosurgeryclinic, many of whom answered my questions or let me shadow them with apatient. Thanks to the Golby Lab, especially to Stephen Whalen (for givingme data, describing fMRI paradigms, and bringing me to an early morningsurgery) and to Ralph Suarez (for teaching me more about fMRI, MEG, andlaterality indices). Thanks to Sandy Wells for suggesting the original version ofthis project and for introducing me to Alex. Finally I would like to acknowledgethe HST MEMP Fellowship which has provided fellowship support during thissemester.
References
[1] Brain and Spinal Cord Tumors. National Institute of Neurological Disor-ders and Stroke, 1993.
[2] D. B. Ennis and G. Kindlmann. Orthogonal tensor invariants and theanalysis of diffusion tensor magnetic resonance images. Magnetic Resonancein Medicine, 2005.
[3] B. J. Jellison, A. S. Field, J. Medow, M. Lazar, M. S. Salamat, and A. L.Alexander. Diffusion tensor imaging of cerebral white matter: A picto-rial review of physics, fiber tract anatomy, and tumor imaging patterns.American Journal of Neuroradiology, 25:356–369, 2004.
[4] M. Kinoshita, K. Yamada, N. Hashimoto, A. Kato, S. Izumoto, T. Baba,M. Maruno, T. Nishimura, and T. Yoshimine. Fiber-tracking does notaccurately estimate size of fiber bundle in pathological condition: initialneurosurgical experience using neuronavigation and subcortical white mat-ter stimulation. Neuroimage, 25(2):424–429, 2005.
[5] C. Nimsky, O. Ganslandt, P. Hastreiter, R. Wang, T. Benner, A. Sorensen,and R. Fahlbusch. Preoperative and intraoperative diffusion tensorimaging-based fiber tracking in glioma surgery. Neurosurgery, 56(1):130–137, 2005.
[6] J. Nolte. The Human Brain. An Introduction to Its Functional Anatomy.Mosby, Inc., 2002.
20

[7] L. O’Donnell and C.-F. Westin. White matter tract clustering and corre-spondence in populations. In Conference on Medical Image Computing andComputer-Assisted Intervention (MICCAI), 2005.
[8] S. Pajevic and C. Pierpaoli. Color schemes to represent the orientation ofanisotropic tissues from diffusion tensor data: application to white matterfiber tract mapping in the human brain. Magnetic Resonance in Medicine2000, 42(3):526–540, 1999.
[9] G. J. Stanley Lu, Daniel Ahn and S. Cha. Peritumoral diffusion tensorimaging of high-grade gliomas and metastatic brain tumors. AmericanJournal of Neuroradiology, 24:937–941, 2003.
[10] I.-F. Talos, L. O’Donnell, C.-F. Westin, S. K. Warfield, W. W. III, S.-S.Yoo, L. P. Panych, A. Golby, H. Mamata, S. S. Maier, P. Ratiu, C. R.Guttmann, P. M. Black, F. A. Jolesz, and R. Kikinis. Diffusion tensor andfunctional MRI fusion with anatomical MRI for image-guided neurosurgery.In Conference on Medical Image Computing and Computer-Assisted Inter-vention (MICCAI), pages 407–415, Toronto, Canada, 2003.
[11] S. Wakana, H. Jiang, L. M. Nagae-Poetscher, P. C. M. van Zijl, and S. Mori.Fiber tract-based atlas of human white matter anatomy. Radiology, 230:77–87, 2004.
[12] C.-F. Westin, S. Maier, H. Mamata, A. Nabavi, F. Jolesz, and R. Kiki-nis. Processing and visualization of diffusion tensor MRI. Medical ImageAnalysis, 6(2):93–108, 2002.
[13] B. Witwer, R. Moftakhar, K. Hasan, P. Deshmukh, V. Haughton, A. Field,K. Arfanakis, J. Noyes, C. Moritz, M. Meyerand, H. Rowley, A. Alexander,and B. Badie. Diffusion-tensor imaging of white matter tracts in patientswith cerebral neoplasm. J Neurosurg, 2002.
21