MR Spectroscopy: The Physical Basis and Acquisition Strategies · MR Spectroscopy: The Physical...
60
MDACC MR Research MR Spectroscopy: The Physical Basis and Acquisition Strategies Edward F. Jackson, PhD Department of Imaging Physics AAPM 2010 – SAM Imaging Session
Transcript of MR Spectroscopy: The Physical Basis and Acquisition Strategies · MR Spectroscopy: The Physical...
MDACC MR Research
MR Spectroscopy: The Physical Basis and Acquisition Strategies
Edward F. Jackson, PhDDepartment of Imaging Physics
AAPM 2010 – SAM Imaging Session
MDACC MR Research
Objectives
• Understand the physical basis of in vivo MRS applications
• Appreciate the requirements necessary to obtain high quality in vivo MRS data
• Understand the spatial localization strategies commonly used for in vivo MRS studies
• Understand common approaches to quantitative interpretation of the measured data
• Understand the dependence of measured parameters on key acquisition parameters
MDACC MR Research
• Recall the Larmor relation that relates resonant frequency to magnetic field strength:
ν = γ Βnucleus
where ν is the resonant frequency (MHz), γ is the gyromagnetic ratio (a constant for a given nucleus, e.g., 42.57 MHz/T for protons), and Bnucleus is the applied magnetic field strength (T) at a given nucleus.
• However, the value of Bnucleus depends on the local electronic environment, i.e., it is the value of the applied field, Bo, modified by the magnetic field due to the chemical environment.
Introduction to Spectroscopy
MDACC MR Research
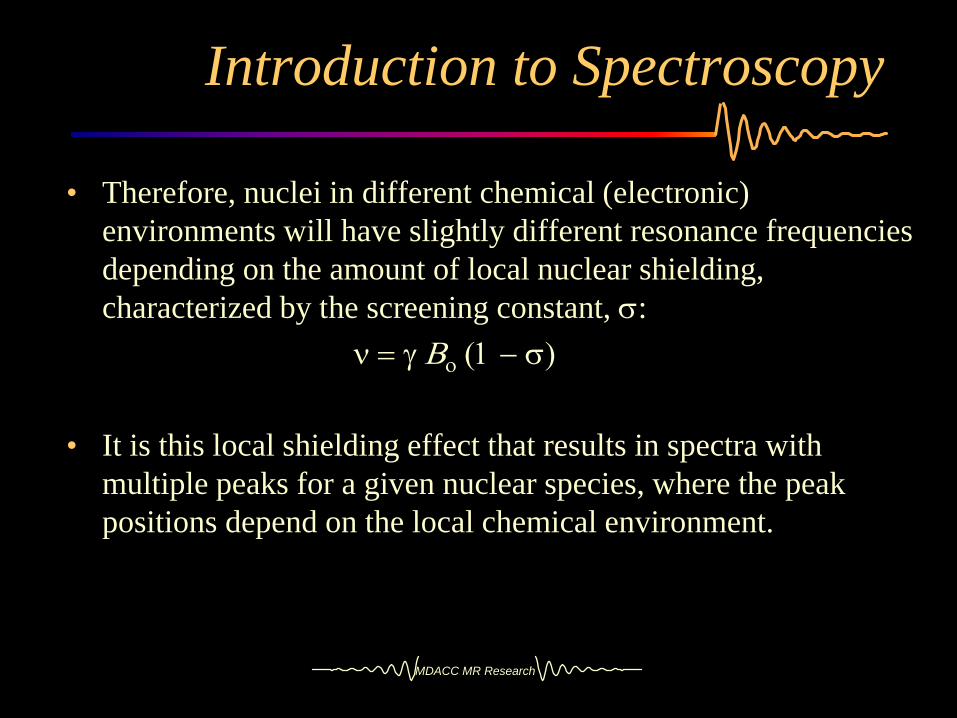
• Therefore, nuclei in different chemical (electronic) environments will have slightly different resonance frequencies depending on the amount of local nuclear shielding, characterized by the screening constant, σ:
ν = γ Βο (1 − σ)
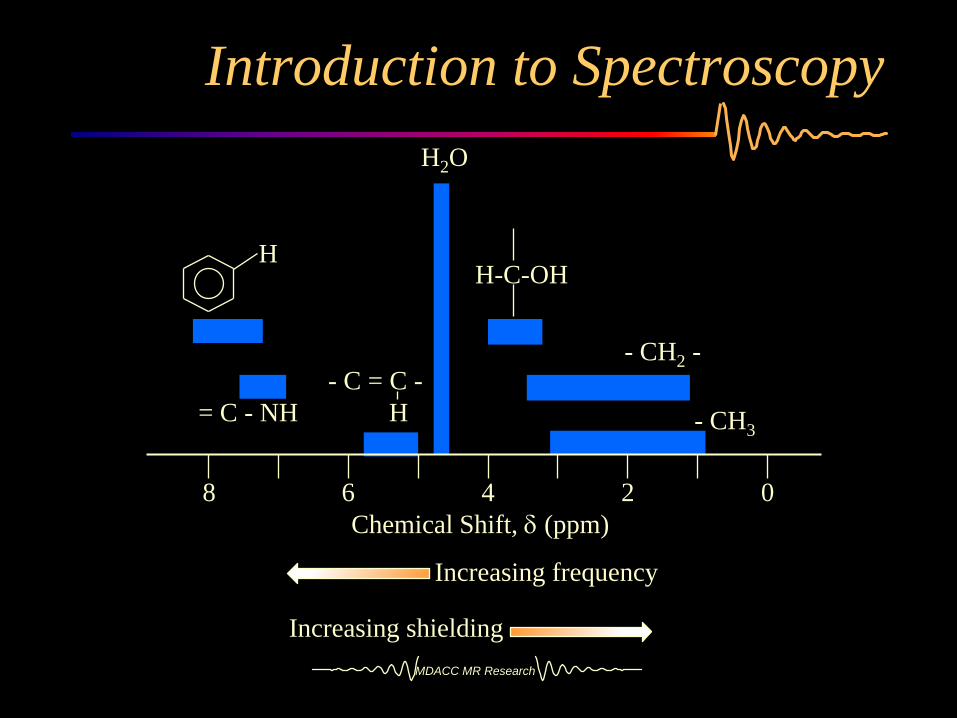
• It is this local shielding effect that results in spectra with multiple peaks for a given nuclear species, where the peak positions depend on the local chemical environment.
Introduction to Spectroscopy
MDACC MR Research
H2O
H-C-OH
- CH2 -
- CH3
- C = C -H= C - NH
H
4 2 068Chemical Shift, δ (ppm)
Introduction to Spectroscopy
Increasing frequency
Increasing shielding
MDACC MR Research
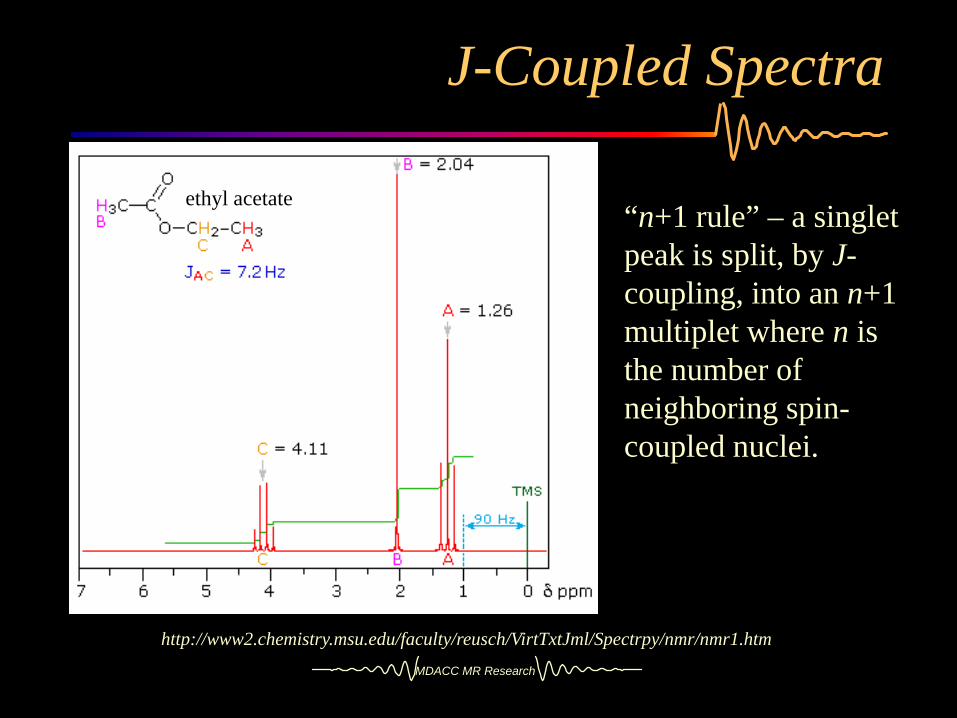
J-Coupled Spectra
“n+1 rule” – a singlet peak is split, by J-coupling, into an n+1 multiplet where n is the number of neighboring spin-coupled nuclei.
http://www2.chemistry.msu.edu/faculty/reusch/VirtTxtJml/Spectrpy/nmr/nmr1.htm
ethyl acetate
MDACC MR Research
• The position of a given spectral peak is usually given in terms of chemical shift with respect to some reference,
δx = (νx - νref) / νref x 106
• It is given in parts per million (ppm) to make separations between the peaks independent of applied field strength.
• Note that the separation of the peaks (in Hz) does depend on field strength. Therefore, the spectral resolution improves as field strength increases. (So does the SNR.)
• For in vivo applications, the reference is usually water for 1Hspectroscopy, and phosphocreatine for 31P studies of tissues such as muscle which have significant amounts of this high energy substrate.
Introduction to Spectroscopy
MDACC MR Research
The success of an MRS examination depends upon:– Highly homogeneous magnetic field
The limiting line widths of peaks are inversely proportional to T2*, so improved homogeneity results in narrower peaks (improved spectral resolution).
– High quality localizationThe volume from which the chemical information (spectrum) is obtained must be accurately known.
– Efficient water suppression (1H MRS)This is aided by improved homogeneity as well.
– Spectral quantification
Requirements
MDACC MR Research
• The requirements for magnetic field homogeneity are stringent if MRS is required, much more stringent than for conventional MRI.
• Good field homogeneity is a prerequisite for good spectral resolution and, for 1H MRS, effective water suppression.
• All clinical MR systems have automated shimming capabilities which optimize the magnetic field within the chosen volume of interest (VOI). This automatic shimming is usually done as part of the MRS prescan function.
Magnetic Field Homogeneity
MDACC MR Research
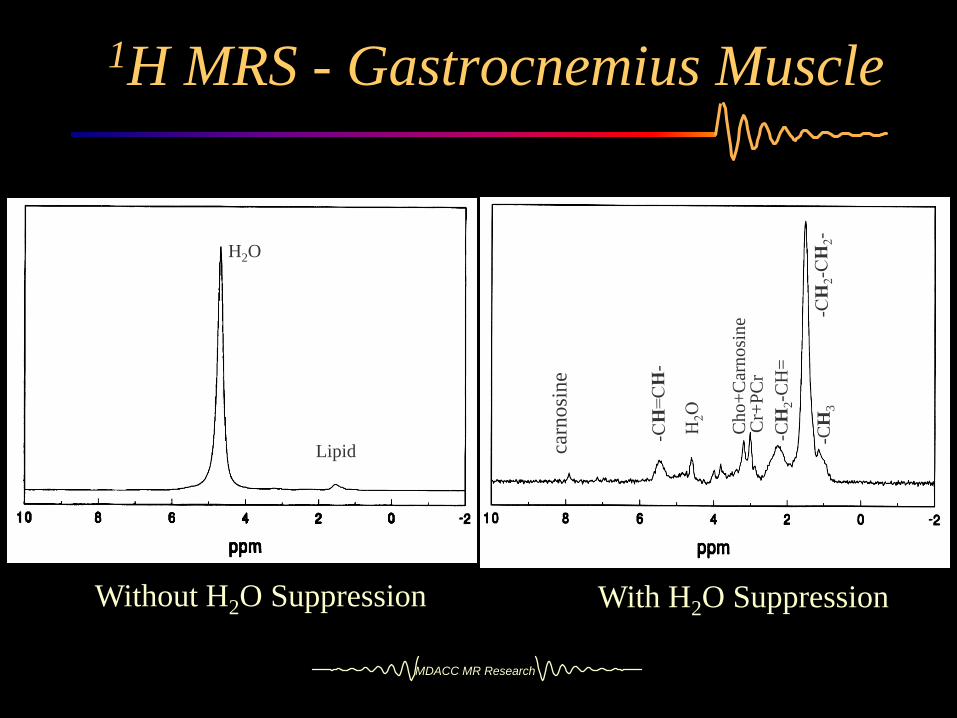
• In 1H MRS studies, water is seldom the molecule of interest.
• The metabolites of interest are usually about a factor of ~5,000 less in concentration than water. (Millimolar concentrations vs. ~ 55 M H2O concentration).
• A very efficient means of suppressing the water resonance (by about 500x) is required to readily detect the metabolite resonances.
Water Suppression (1H MRS)
MDACC MR Research
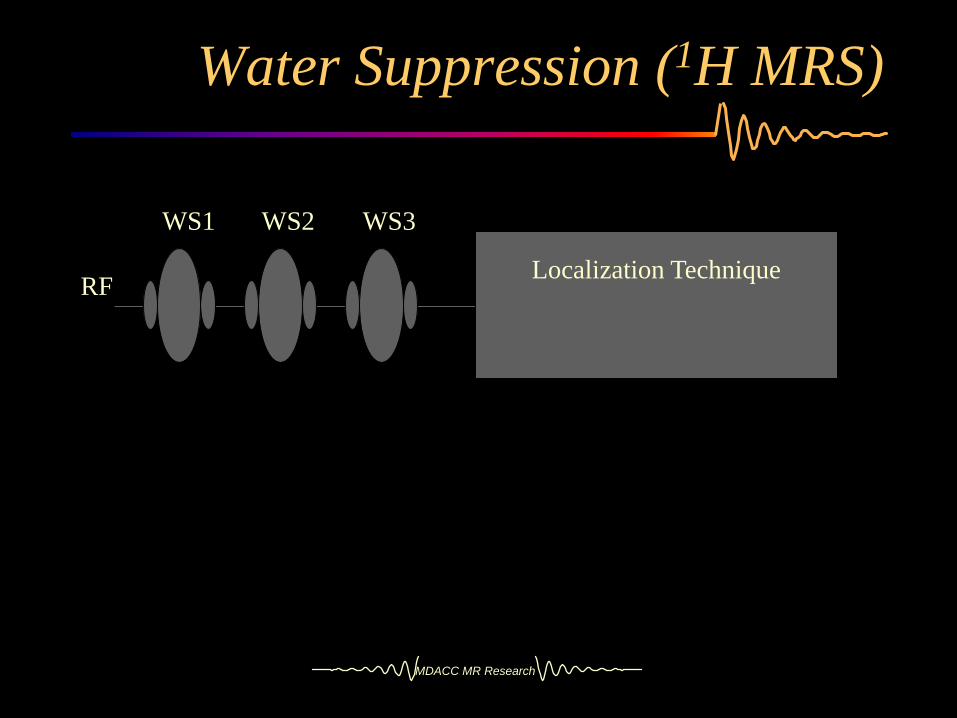
• The most commonly utilized method for water suppression is based on the same principle as “fat sat”. (For MRS sequences, the suppression pulses are commonly referred to as CHESS pulses - chemically selective saturation.)
• Typically, multiple (often 3), narrow bandwidth (~50 Hz) pulses are applied at the water resonance frequency preceding the localization sequence.
• Multiple pulses are used to improve the degree of water suppression.
• On commercial MR systems, the MRS prescan function includes automated optimization of the suppression pulses.
Water Suppression (1H MRS)
MDACC MR Research
Localization Technique
WS1 WS2 WS3
RF
Water Suppression (1H MRS)
MDACC MR Research
For a spectrum to have any significance, the region from which it is obtained must be accurately known. There are some basic requirements for the localization technique:– It should be possible to move the desired volume of interest
(VOI) anywhere in the FOV of the image and maintain localization quality,
– It should be possible to obtain the spectrum in a single acquisition in order to shim (manually or auto) on the VOI,
– For 1H MRS: Water suppression should be efficiently incorporated into the localization sequence.
Localization
MDACC MR Research
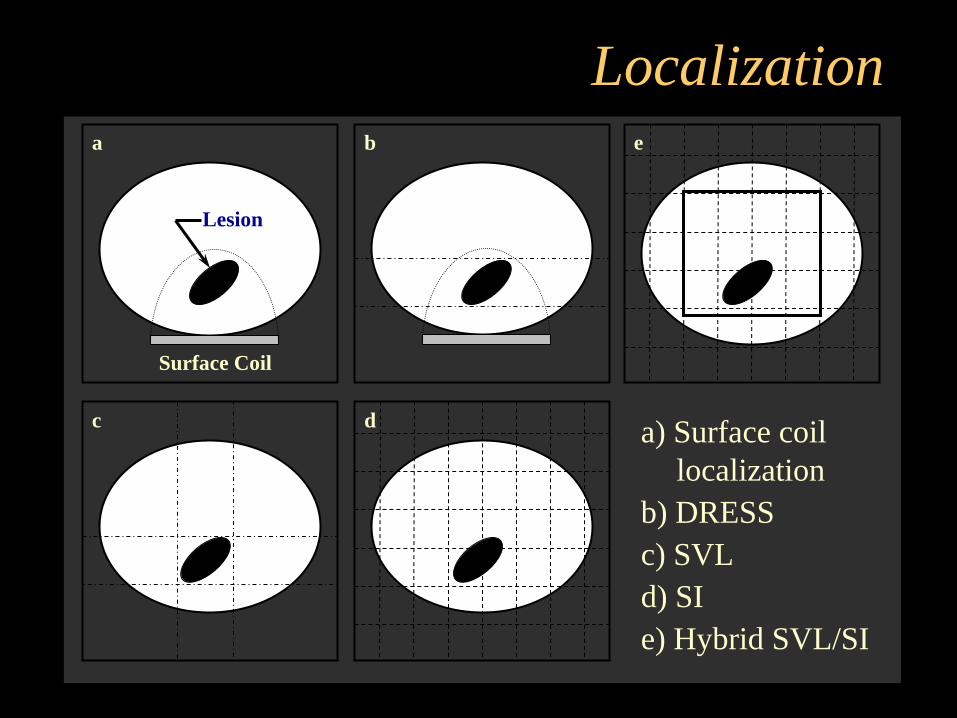
– Surface coil localization. Originally used for superficial lesions and/or performing 31P or 13C studies
– Surface coil + single slice selection, e.g., DRESS (depth resolved surface coil spectroscopy).
– Single voxel volume localization (SVL): VOI is the intersection of three slice selective gradient/RF pulses. Each slice thickness can be individually varied to define VOI.
– Spectroscopic imaging (SI): Uses phase-encoding for localization.
– Hybrids: Usually a combination of SVL and SI techniques.
Localization
a b
c d
Lesion
Surface Coil
e
a) Surface coil localization
b) DRESSc) SVLd) SIe) Hybrid SVL/SI
Localization
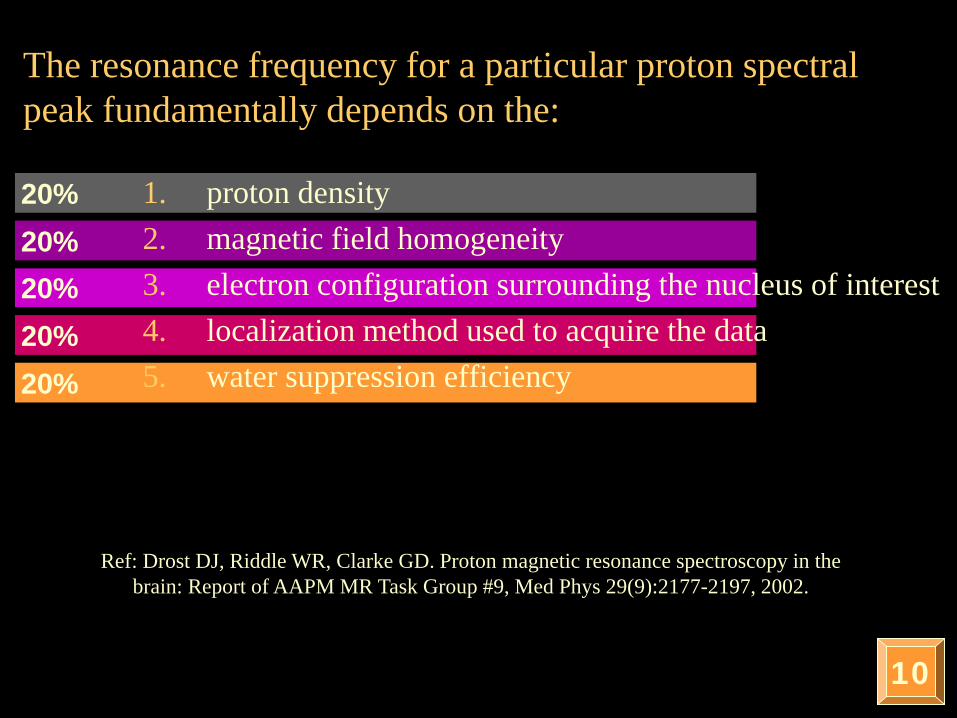
The resonance frequency for a particular proton spectral peak fundamentally depends on the:
10
Ref: Drost DJ, Riddle WR, Clarke GD. Proton magnetic resonance spectroscopy in the brain: Report of AAPM MR Task Group #9, Med Phys 29(9):2177-2197, 2002.
20%20%20%20%20% 1. proton density
2. magnetic field homogeneity3. electron configuration surrounding the nucleus of interest4. localization method used to acquire the data5. water suppression efficiency
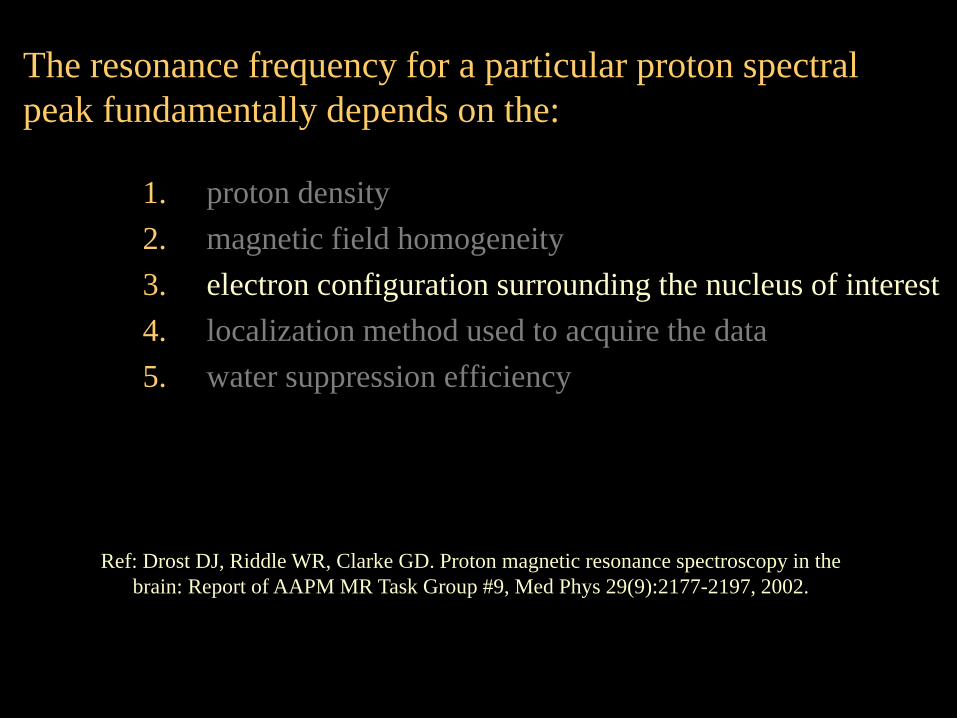
The resonance frequency for a particular proton spectral peak fundamentally depends on the:
1. proton density2. magnetic field homogeneity3. electron configuration surrounding the nucleus of interest4. localization method used to acquire the data5. water suppression efficiency
Ref: Drost DJ, Riddle WR, Clarke GD. Proton magnetic resonance spectroscopy in the brain: Report of AAPM MR Task Group #9, Med Phys 29(9):2177-2197, 2002.
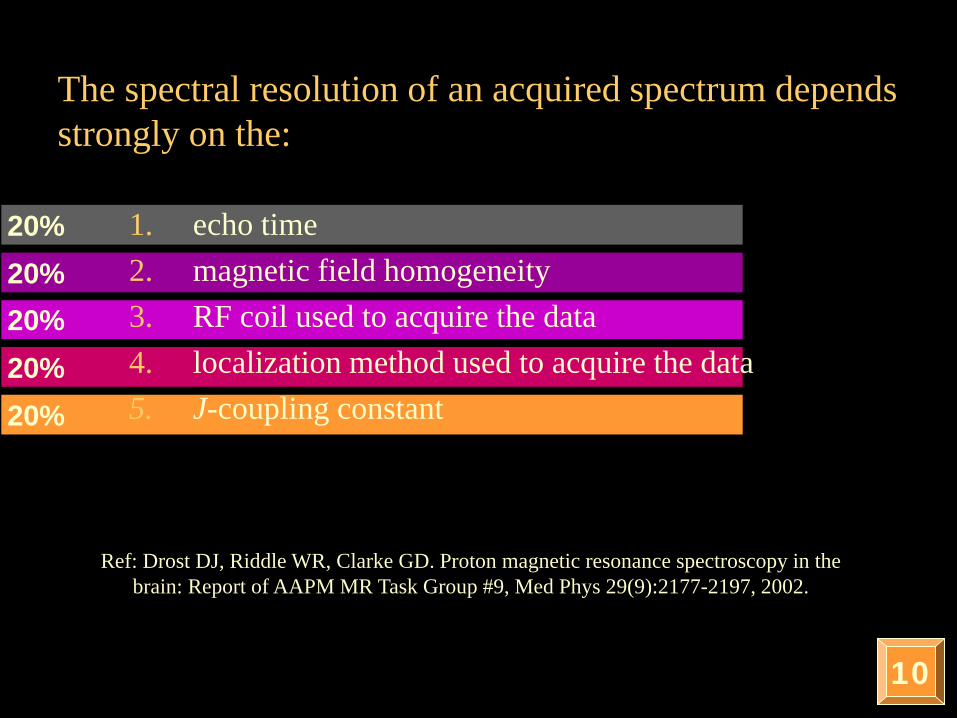
The spectral resolution of an acquired spectrum depends strongly on the:
10
Ref: Drost DJ, Riddle WR, Clarke GD. Proton magnetic resonance spectroscopy in the brain: Report of AAPM MR Task Group #9, Med Phys 29(9):2177-2197, 2002.
20%20%20%20%20% 1. echo time
2. magnetic field homogeneity3. RF coil used to acquire the data4. localization method used to acquire the data5. J-coupling constant
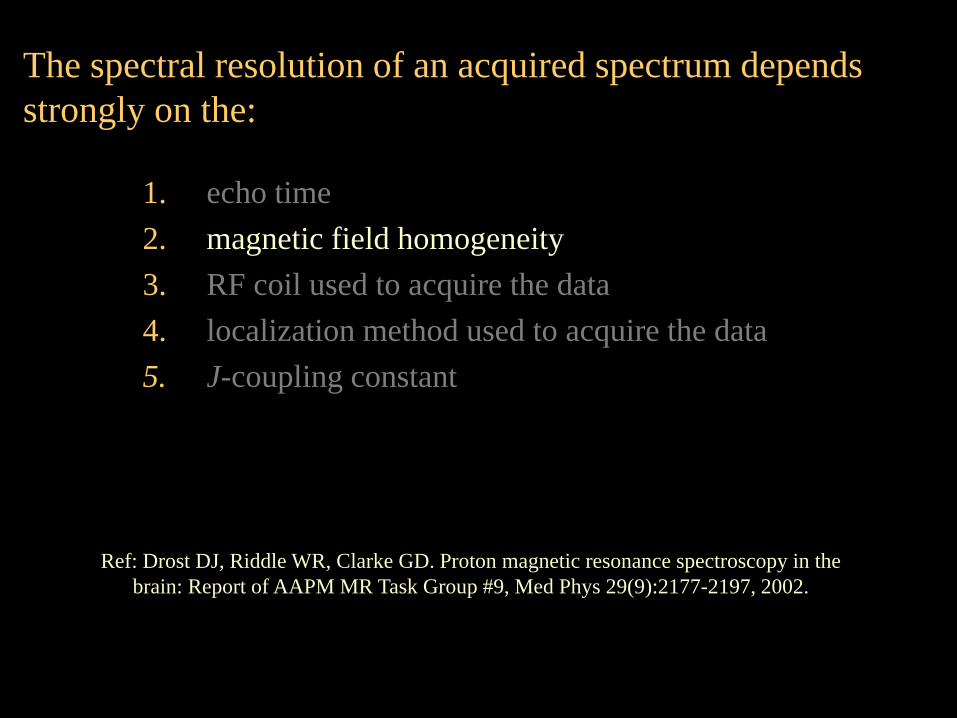
The spectral resolution of an acquired spectrum depends strongly on the:
1. echo time2. magnetic field homogeneity3. RF coil used to acquire the data4. localization method used to acquire the data5. J-coupling constant
Ref: Drost DJ, Riddle WR, Clarke GD. Proton magnetic resonance spectroscopy in the brain: Report of AAPM MR Task Group #9, Med Phys 29(9):2177-2197, 2002.
MDACC MR Research
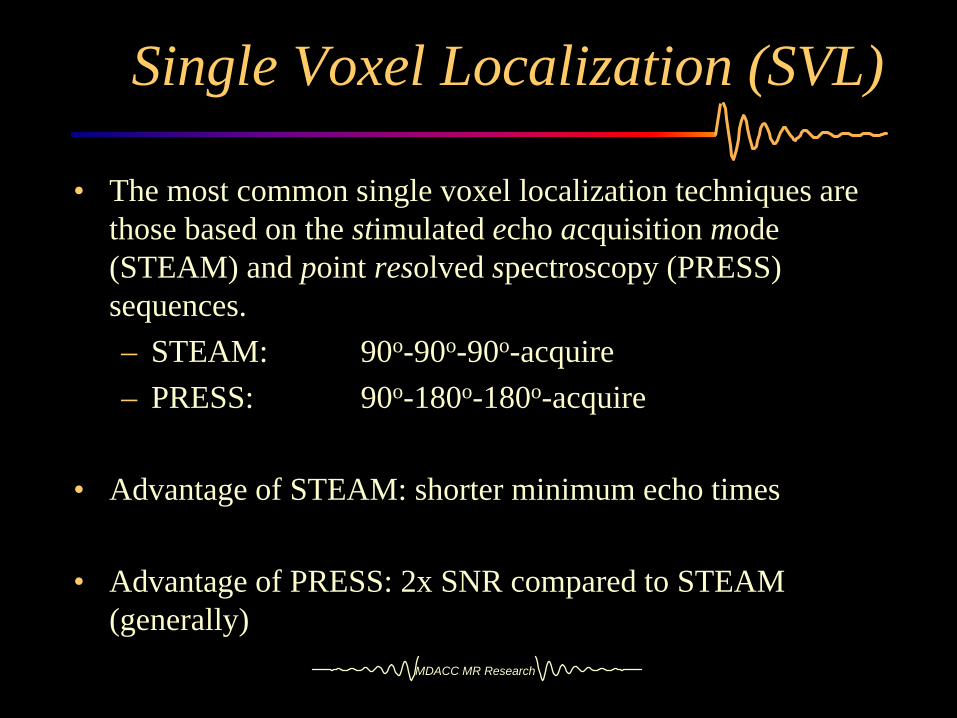
• The most common single voxel localization techniques are those based on the stimulated echo acquisition mode (STEAM) and point resolved spectroscopy (PRESS) sequences.– STEAM: 90o-90o-90o-acquire– PRESS: 90o-180o-180o-acquire
• Advantage of STEAM: shorter minimum echo times
• Advantage of PRESS: 2x SNR compared to STEAM (generally)
Single Voxel Localization (SVL)
MDACC MR Research
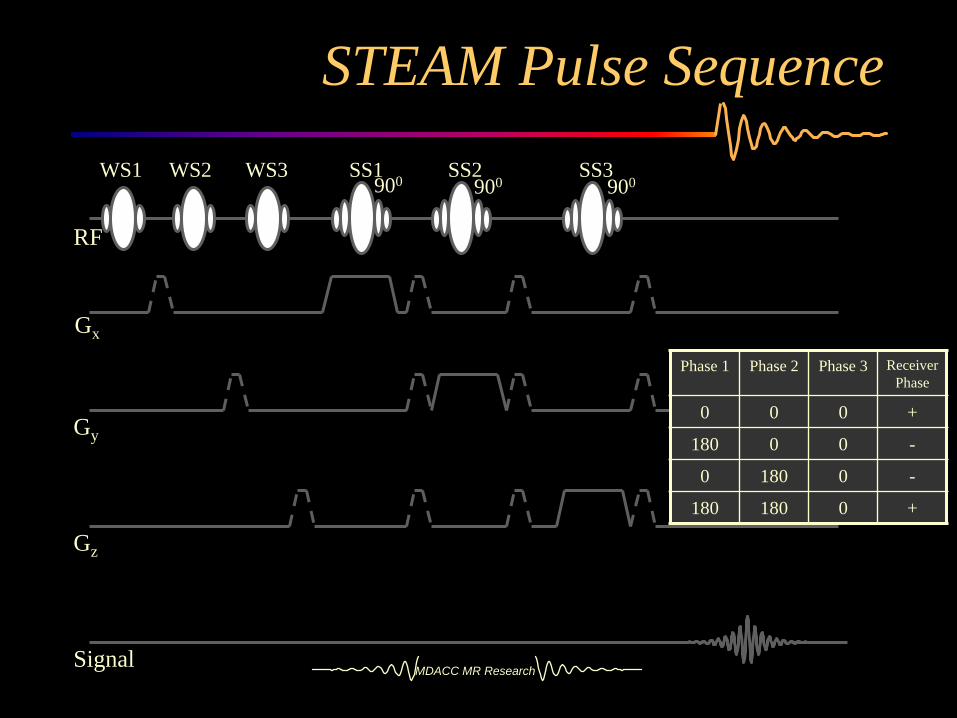
WS1 WS2 WS3
RF
SS1 SS2 SS3
Gx
Gy
Gz
Signal
900 900 900
Phase 1 Phase 2 Phase 3 Receiver Phase
0 0 0 +
180 0 0 -
0 180 0 -
180 180 0 +
STEAM Pulse Sequence
MDACC MR Research
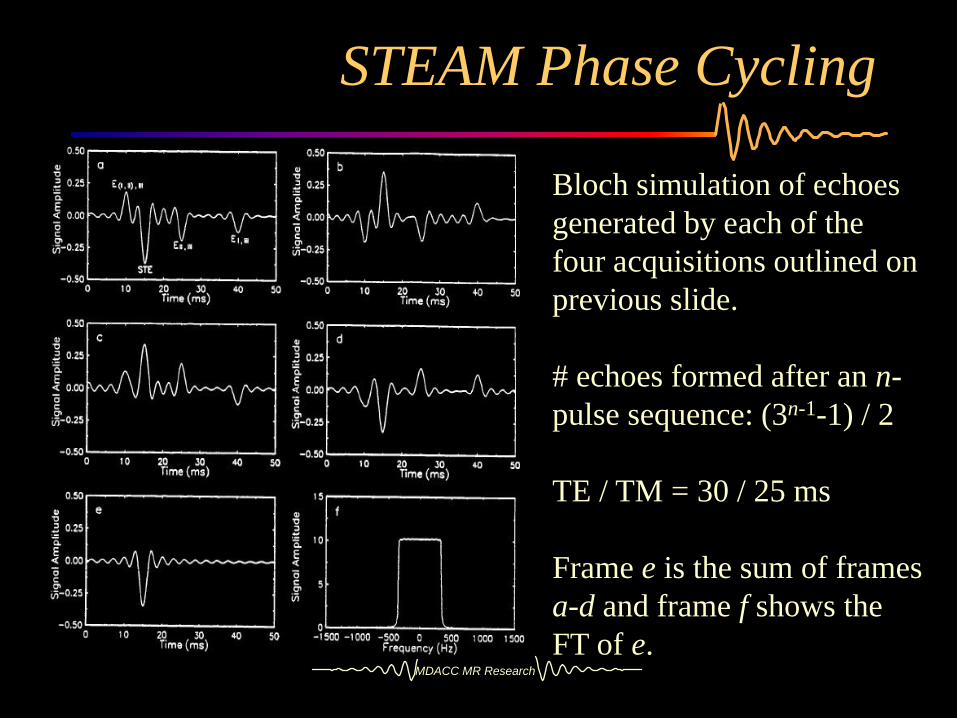
STEAM Phase Cycling
Bloch simulation of echoes generated by each of the four acquisitions outlined on previous slide.
# echoes formed after an n-pulse sequence: (3n-1-1) / 2
TE / TM = 30 / 25 ms
Frame e is the sum of frames a-d and frame f shows the FT of e.
MDACC MR Research
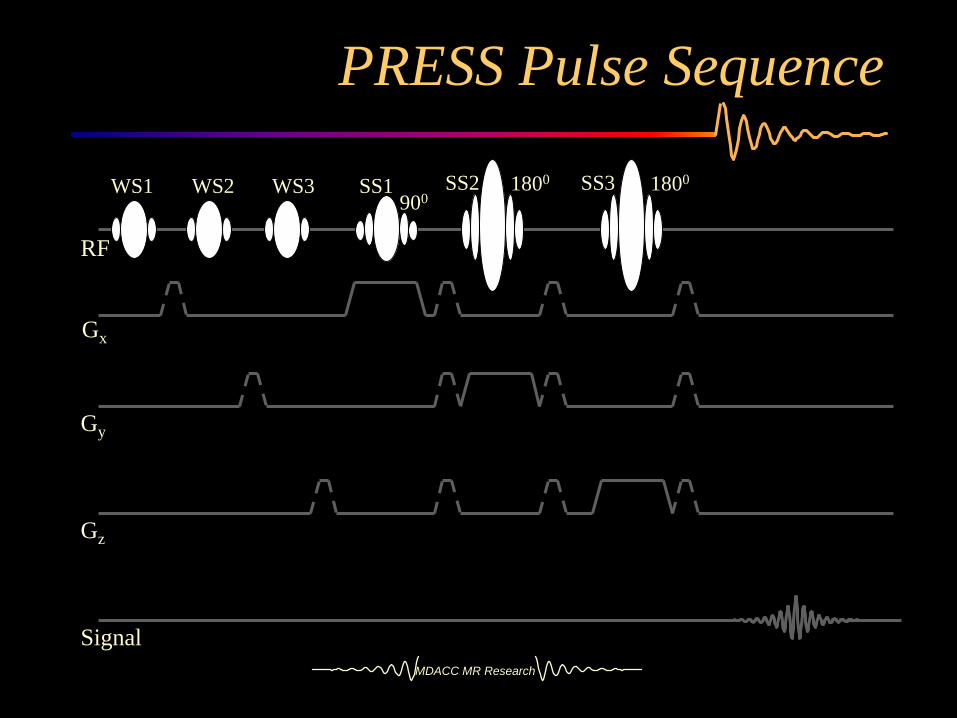
WS1 WS2 WS3
RF
SS1 SS2 SS3
Gx
Gy
Gz
Signal
9001800 1800
PRESS Pulse Sequence
MDACC MR Research
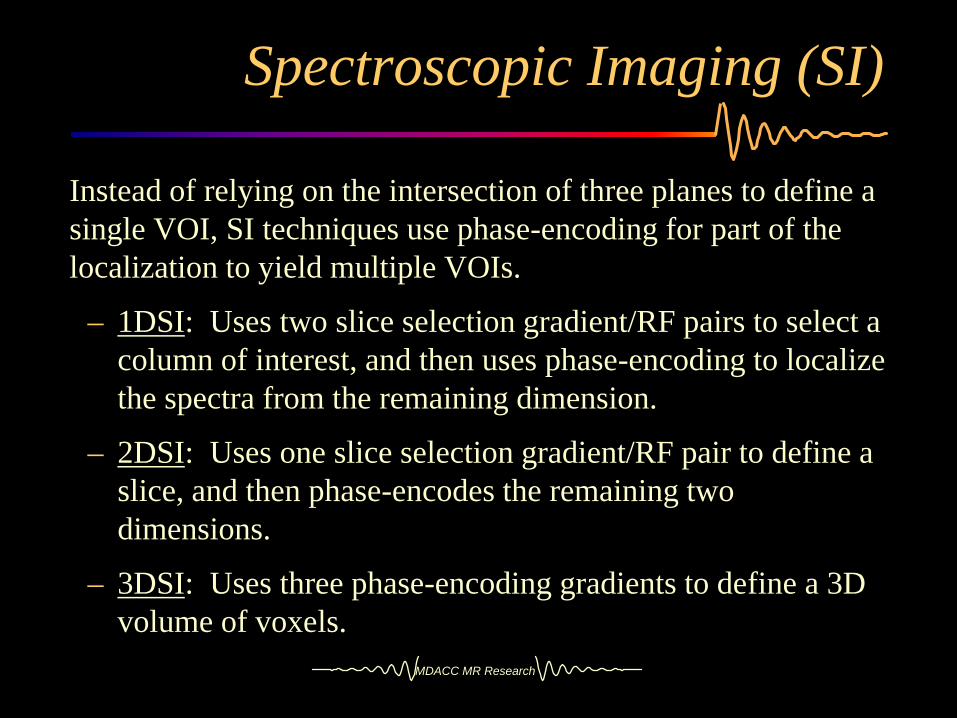
Instead of relying on the intersection of three planes to define a single VOI, SI techniques use phase-encoding for part of the localization to yield multiple VOIs.
– 1DSI: Uses two slice selection gradient/RF pairs to select a column of interest, and then uses phase-encoding to localize the spectra from the remaining dimension.
– 2DSI: Uses one slice selection gradient/RF pair to define a slice, and then phase-encodes the remaining two dimensions.
– 3DSI: Uses three phase-encoding gradients to define a 3D volume of voxels.
Spectroscopic Imaging (SI)
MDACC MR Research
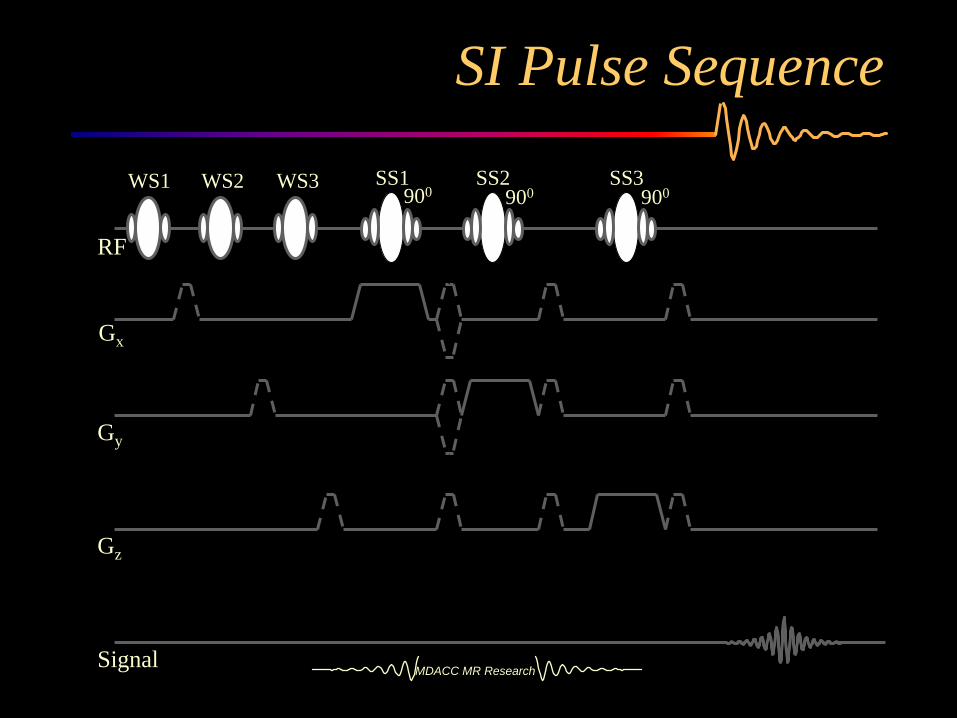
WS1 WS2 WS3
RF
SS1 SS2 SS3
Gx
Gy
Gz
Signal
900 900 900
SI Pulse Sequence

MDACC MR Research
SVL vs. SI Localization

MDACC MR Research
While SVL techniques are faster for obtaining a single localized spectrum, SI techniques have the following advantages:
– Spectra from multiple VOIs can be obtained at one time. Useful for comparing suspected pathological tissue with normal-appearing contralateral region, or for better assessment of lesion heterogeneity.
– Spectra from smaller VOIs can be obtained compared to SVL techniques.
Less partial volume averaging, better assessment of heterogeneity.
– “Metabolite maps”, in which pixel intensity is proportional to chemical concentration, can be generated.
SI Acquisitions
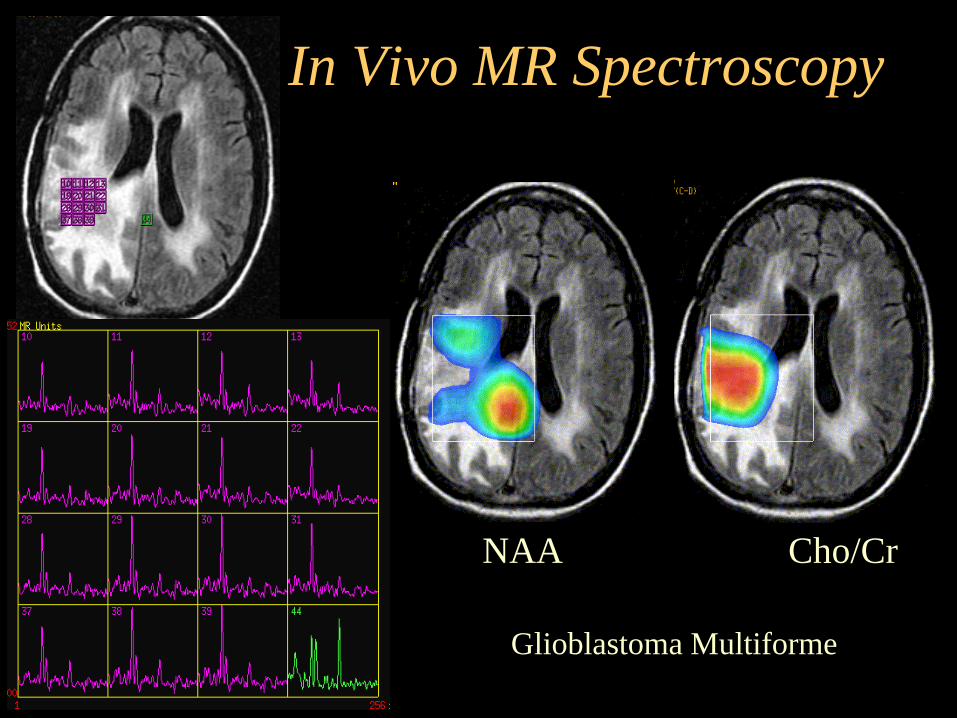
NAA Cho/Cr
Glioblastoma Multiforme
In Vivo MR Spectroscopy
MDACC MR Research
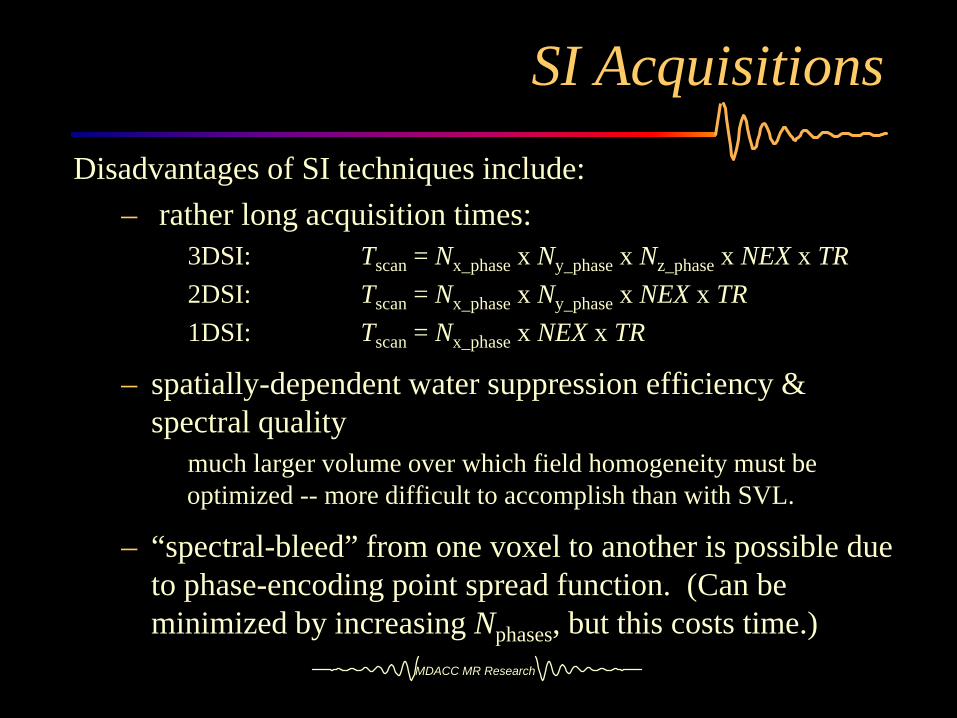
Disadvantages of SI techniques include:– rather long acquisition times:
3DSI: Tscan = Nx_phase x Ny_phase x Nz_phase x NEX x TR2DSI: Tscan = Nx_phase x Ny_phase x NEX x TR1DSI: Tscan = Nx_phase x NEX x TR
– spatially-dependent water suppression efficiency & spectral quality
much larger volume over which field homogeneity must be optimized -- more difficult to accomplish than with SVL.
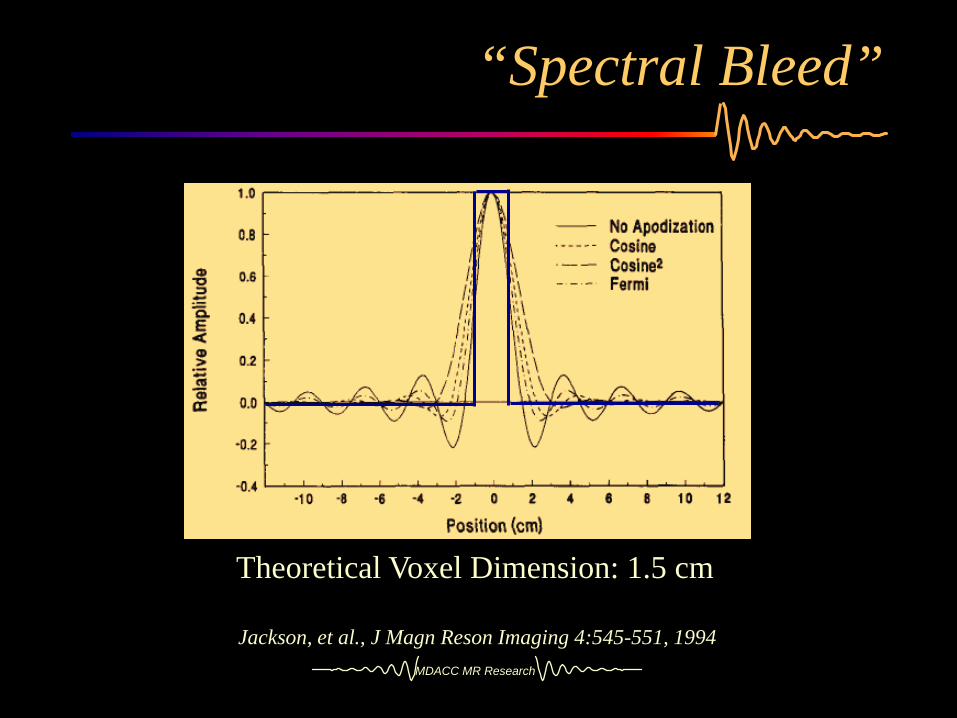
– “spectral-bleed” from one voxel to another is possible due to phase-encoding point spread function. (Can be minimized by increasing Nphases, but this costs time.)
SI Acquisitions
MDACC MR Research
“Spectral Bleed”
Jackson, et al., J Magn Reson Imaging 4:545-551, 1994
Theoretical Voxel Dimension: 1.5 cm
MDACC MR Research
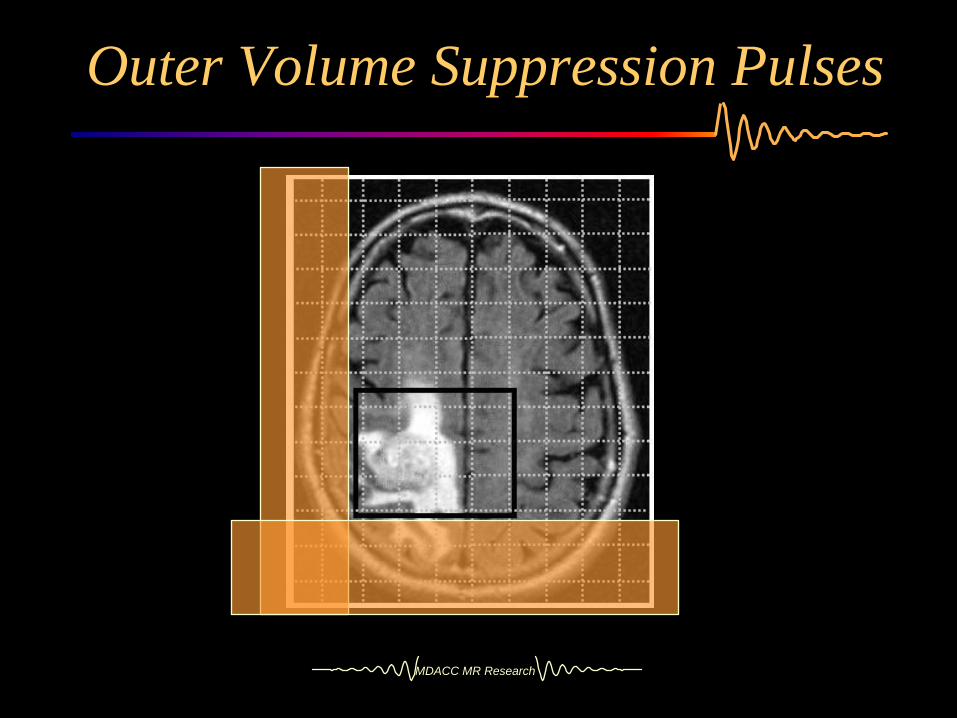
Outer Volume Suppression Pulses
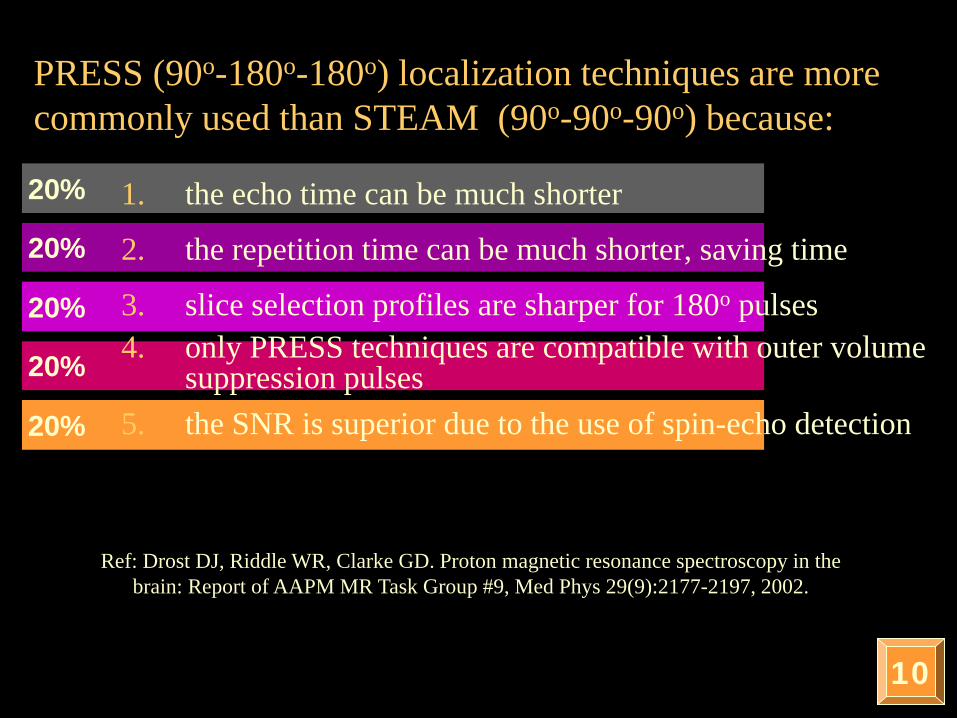
PRESS (90o-180o-180o) localization techniques are more commonly used than STEAM (90o-90o-90o) because:
10
Ref: Drost DJ, Riddle WR, Clarke GD. Proton magnetic resonance spectroscopy in the brain: Report of AAPM MR Task Group #9, Med Phys 29(9):2177-2197, 2002.
20%
20%
20%
20%
20% 1. the echo time can be much shorter
2. the repetition time can be much shorter, saving time
3. slice selection profiles are sharper for 180o pulses4. only PRESS techniques are compatible with outer volume
suppression pulses5. the SNR is superior due to the use of spin-echo detection
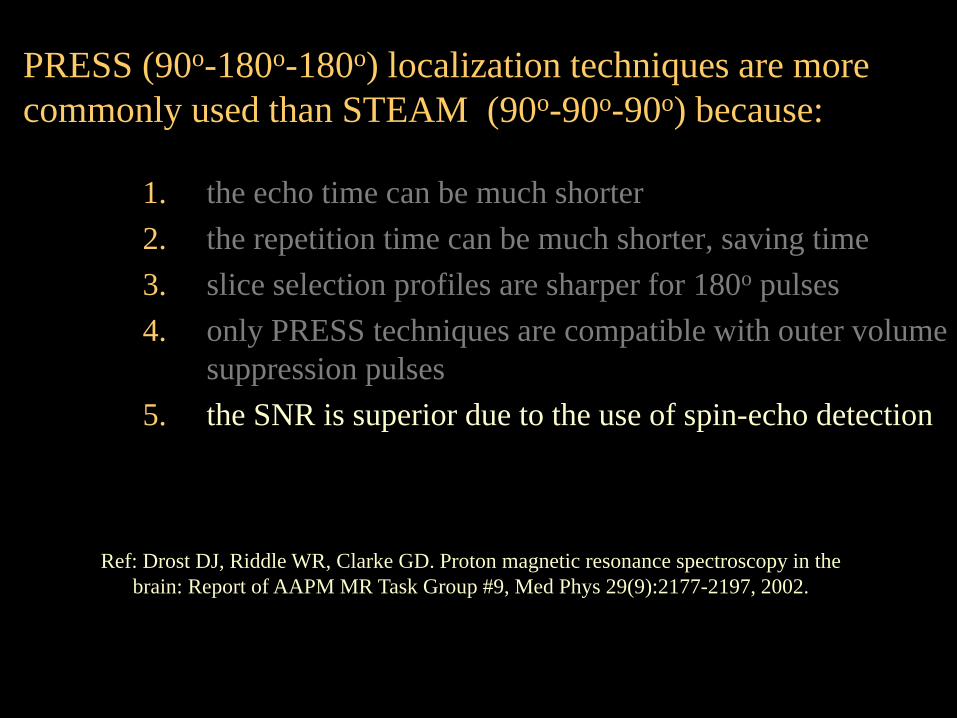
PRESS (90o-180o-180o) localization techniques are more commonly used than STEAM (90o-90o-90o) because:
1. the echo time can be much shorter2. the repetition time can be much shorter, saving time3. slice selection profiles are sharper for 180o pulses4. only PRESS techniques are compatible with outer volume
suppression pulses5. the SNR is superior due to the use of spin-echo detection
Ref: Drost DJ, Riddle WR, Clarke GD. Proton magnetic resonance spectroscopy in the brain: Report of AAPM MR Task Group #9, Med Phys 29(9):2177-2197, 2002.
Lipid contamination of spectral data acquired with PRESS spectroscopic imaging techniques is typically due to:
10
Ref: Drost DJ, Riddle WR, Clarke GD. Proton magnetic resonance spectroscopy in the brain: Report of AAPM MR Task Group #9, Med Phys 29(9):2177-2197, 2002.
20%20%20%20%20% 1. the use of outer volume suppression pulses
2. J-coupling of methyl and methylene lipid protons3. insufficient sampling bandwidth4. insufficient number of data samples used to define echo5. limited number of phase-encoding steps
Lipid contamination of spectral data acquired with PRESS spectroscopic imaging techniques is typically due to:
1. the use of outer volume suppression pulses2. J-coupling of methyl and methylene lipid protons3. insufficient sampling bandwidth4. insufficient number of data samples used to define echo5. limited number of phase-encoding steps
Ref: Drost DJ, Riddle WR, Clarke GD. Proton magnetic resonance spectroscopy in the brain: Report of AAPM MR Task Group #9, Med Phys 29(9):2177-2197, 2002.
MDACC MR Research
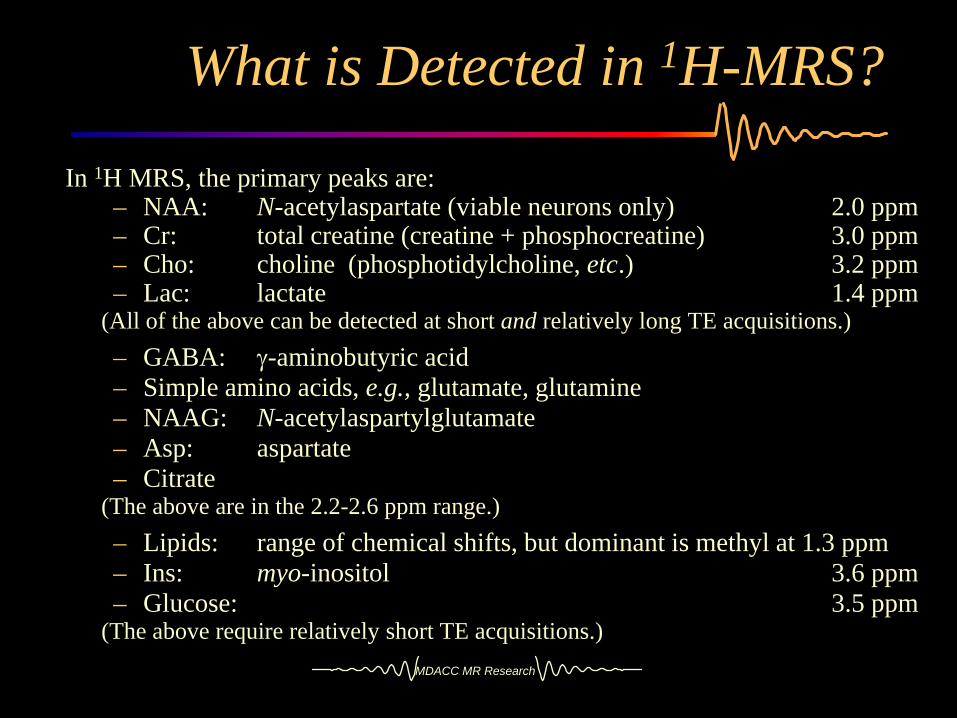
In 1H MRS, the primary peaks are:– NAA: N-acetylaspartate (viable neurons only) 2.0 ppm– Cr: total creatine (creatine + phosphocreatine) 3.0 ppm– Cho: choline (phosphotidylcholine, etc.) 3.2 ppm– Lac: lactate 1.4 ppm
(All of the above can be detected at short and relatively long TE acquisitions.)– GABA: γ-aminobutyric acid– Simple amino acids, e.g., glutamate, glutamine– NAAG: N-acetylaspartylglutamate– Asp: aspartate– Citrate
(The above are in the 2.2-2.6 ppm range.)– Lipids: range of chemical shifts, but dominant is methyl at 1.3 ppm– Ins: myo-inositol 3.6 ppm– Glucose: 3.5 ppm
(The above require relatively short TE acquisitions.)
What is Detected in 1H-MRS?
MDACC MR Research
NAA
CrPCr
ChoIns
CrGluGln
AspNAA
GABAGlu, Gln
LactateLipids
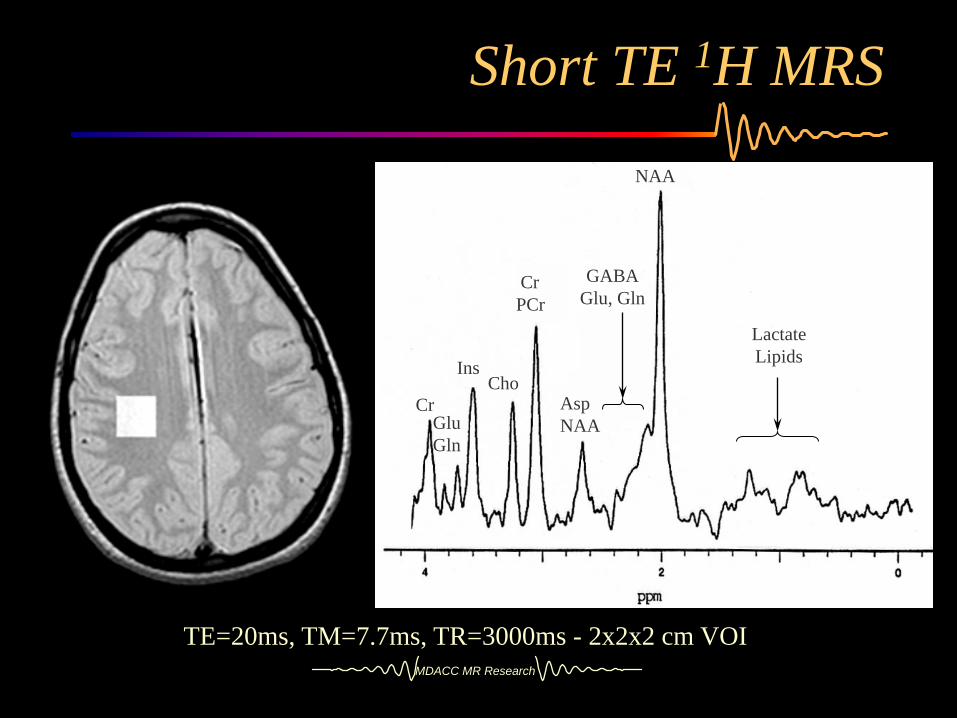
TE=20ms, TM=7.7ms, TR=3000ms - 2x2x2 cm VOI
Short TE 1H MRS
MDACC MR Research
Cho
+Car
nosi
ne
H2O
Lipid
-CH
3
Cr+
PCr
-CH
2-C
H=
carn
osin
e
Without H2O Suppression With H2O Suppression
1H MRS - Gastrocnemius Muscle
MDACC MR Research
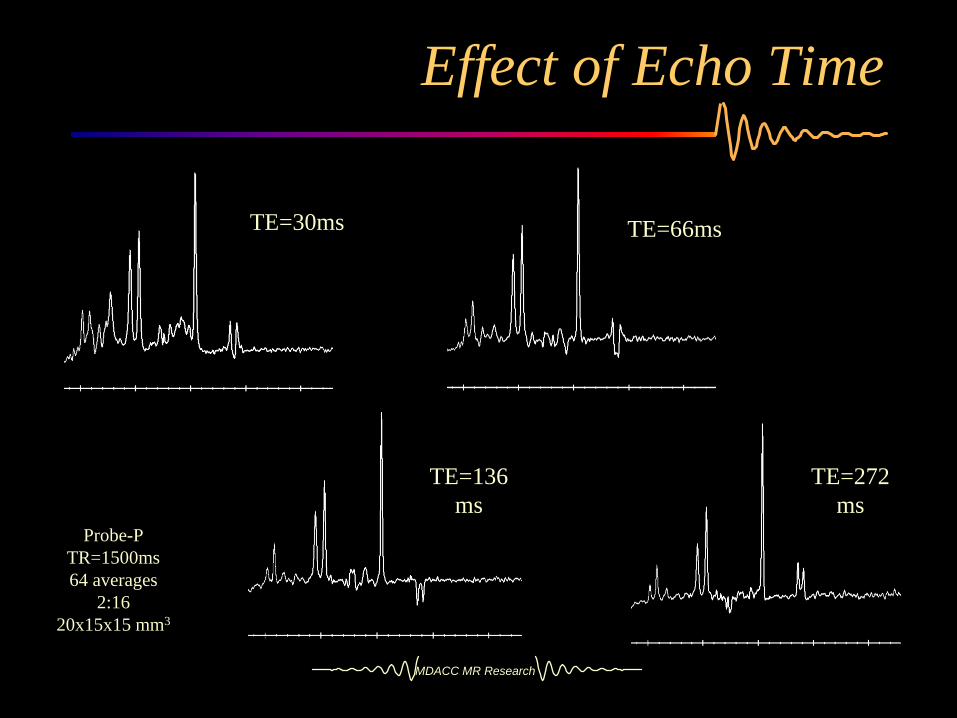
• Note that the choice of echo times in MRS exams is important.
• As you increase TE, of course, the signal amplitudes from all metabolites decrease due to spin dephasing.
• Short TE: more spectral peaks means more options for lesion characterization or evaluation of therapy. However, the examinations are more challenging to obtain reproducibly, mainly due to decreased water suppression efficiency.
Choice of Echo Times
MDACC MR Research
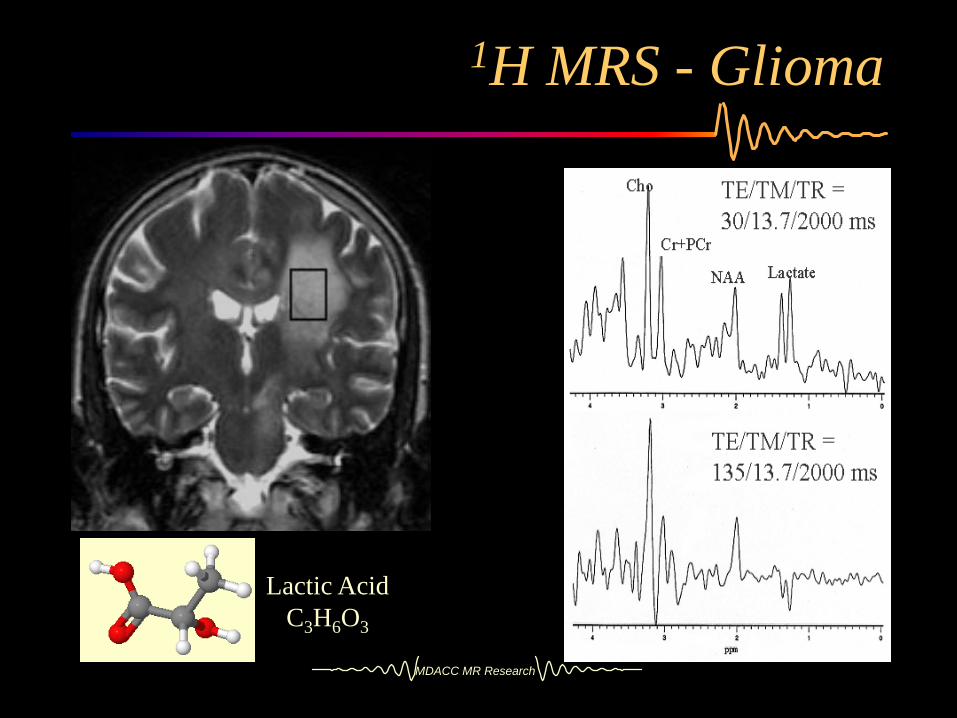
There are certain choices of echo times that prove very useful in verifying peak assignments. For example, lipid and lactate peaks overlap strongly at 1.5T. To separate them, one can use a TE that takes advantage of the J-coupling that occurs in lactate.
– The use of TE~135ms will result in an inverted lactate peak in phased MR spectra.
– The use of TE~270ms will result in a totally “in-phase” lactate resonance.
– Since lipid protons do not exhibit the coupling, the lipid peaks will be “in-phase” in both cases (no inversion).
– The J-coupling constant (6.93 Hz) is independent of Bo.
Choice of Echo Times
MDACC MR Research
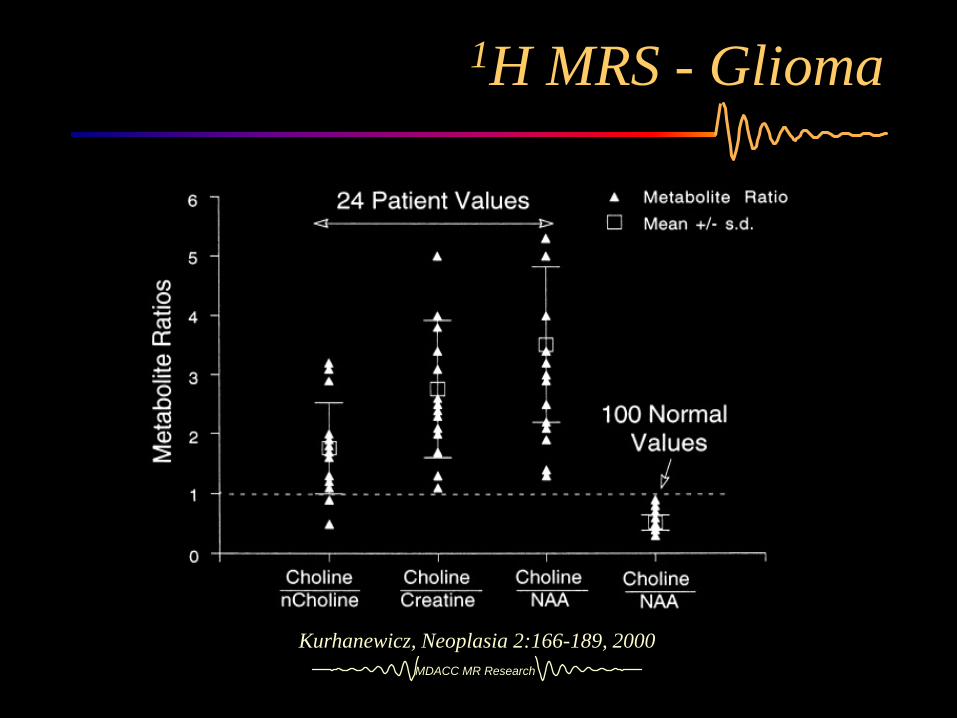
1H MRS - Glioma
Lactic AcidC3H6O3
MDACC MR Research
Kurhanewicz, Neoplasia 2:166-189, 2000
1H MRS - Glioma
MDACC MR Research
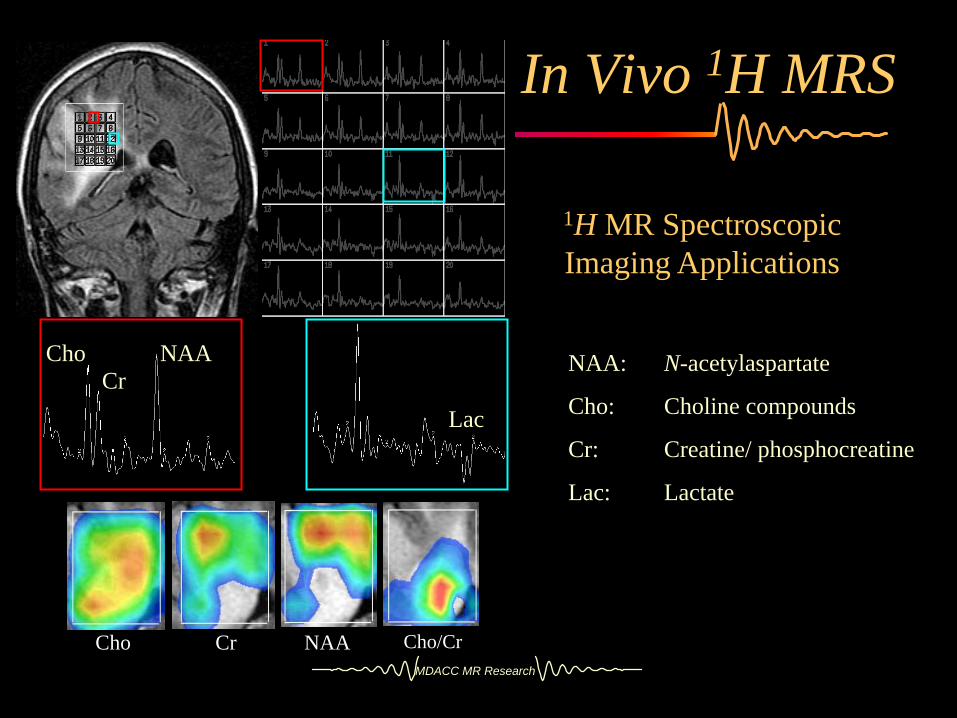
In Vivo 1H MRS
1H MR Spectroscopic Imaging Applications
NAA: N-acetylaspartate
Cho: Choline compounds
Cr: Creatine/ phosphocreatine
Lac: Lactate
Cho Cr NAA Cho/Cr
NAACr
Cho
Lac
MDACC MR Research
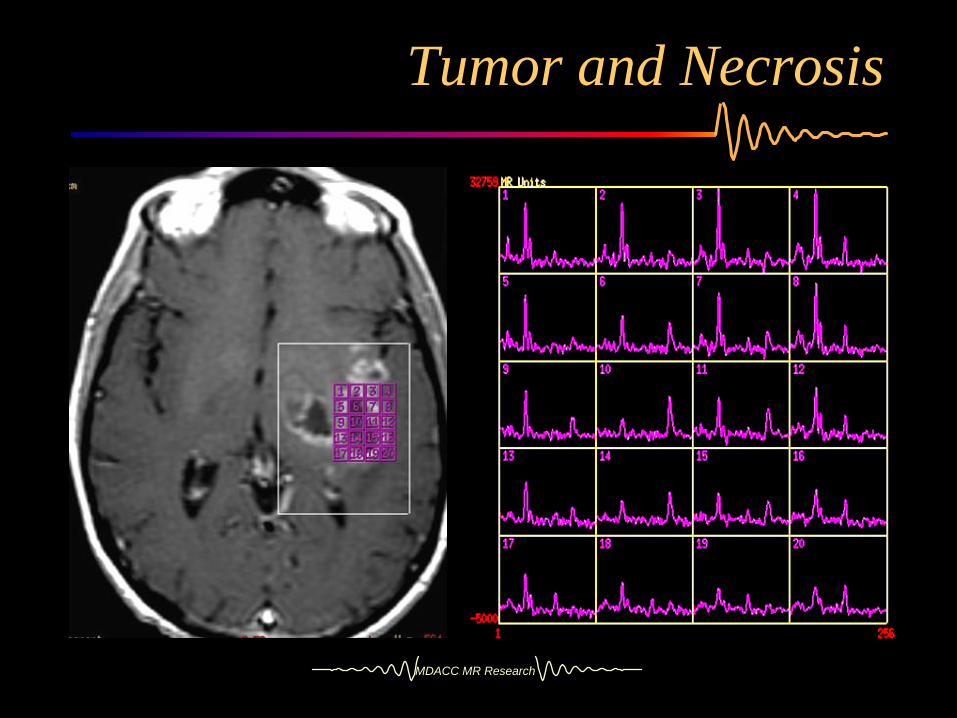
Tumor and Necrosis
MDACC MR Research
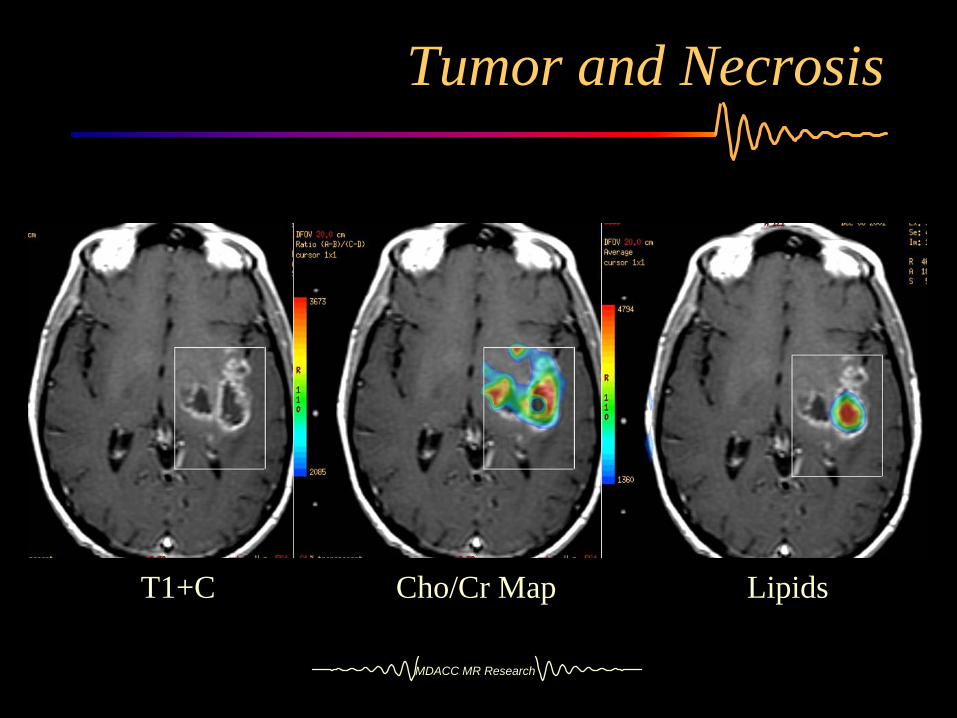
T1+C Cho/Cr Map Lipids
Tumor and Necrosis
MDACC MR Research
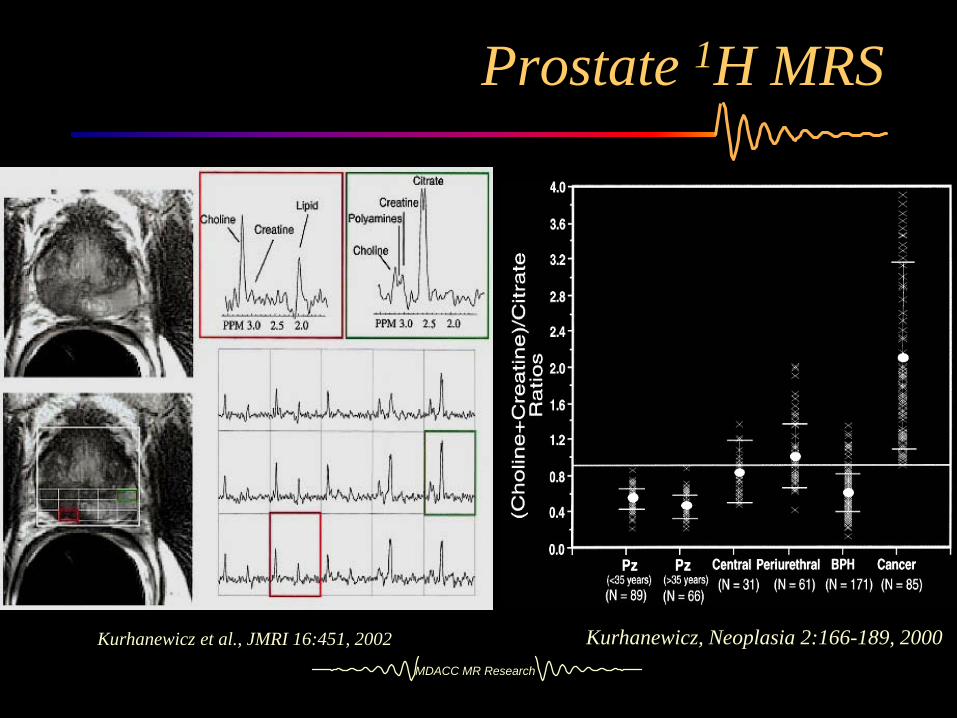
Kurhanewicz et al., JMRI 16:451, 2002 Kurhanewicz, Neoplasia 2:166-189, 2000
Prostate 1H MRS
MDACC MR Research
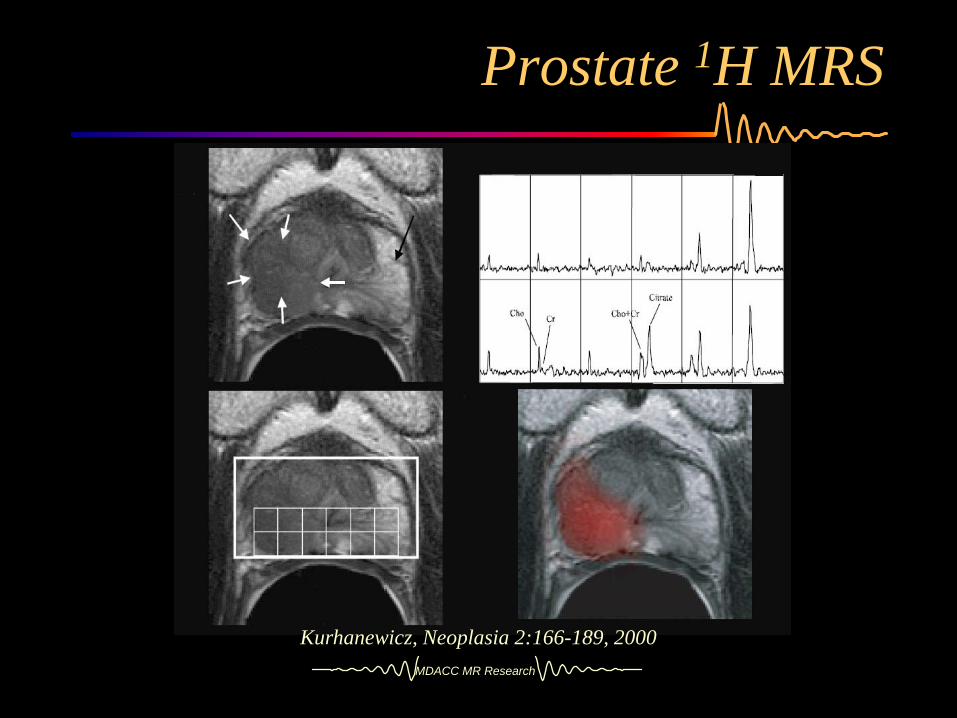
Prostate 1H MRS
Kurhanewicz, Neoplasia 2:166-189, 2000
MDACC MR Research
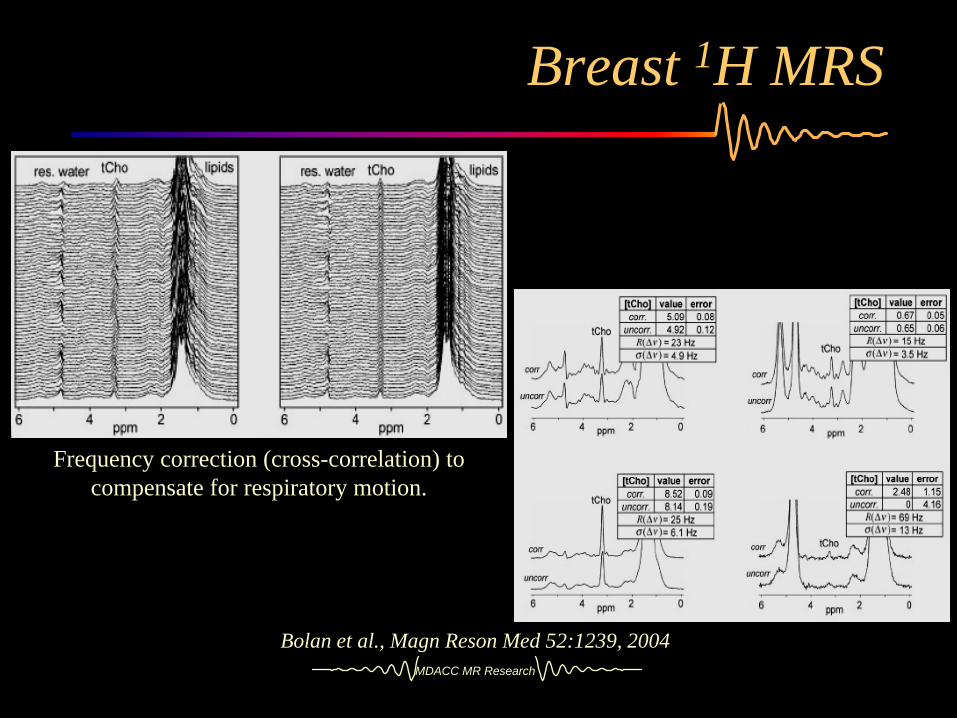
Breast 1H MRS
Bolan et al., Magn Reson Med 52:1239, 2004
Frequency correction (cross-correlation) to compensate for respiratory motion.
MDACC MR Research
• The most consistent indication of malignant lesions is an elevation in choline (CNS, prostate, breast).
• In brain, the degree of elevation in Cho/NAA and Cho/Cr is, in general, indicative of tumor grade.
• In prostate, malignant lesions demonstrate a decrease in citrate and an increase in choline as compared to normal tissue and benign disease, e.g., BPH.
• Following effective chemotherapy or radiation therapy, the most consistent finding is a decrease in choline.
• In non-enhancing lesions, MRS is a useful tool for biopsy guidance.
General 1H MRS Findings
MDACC MR Research
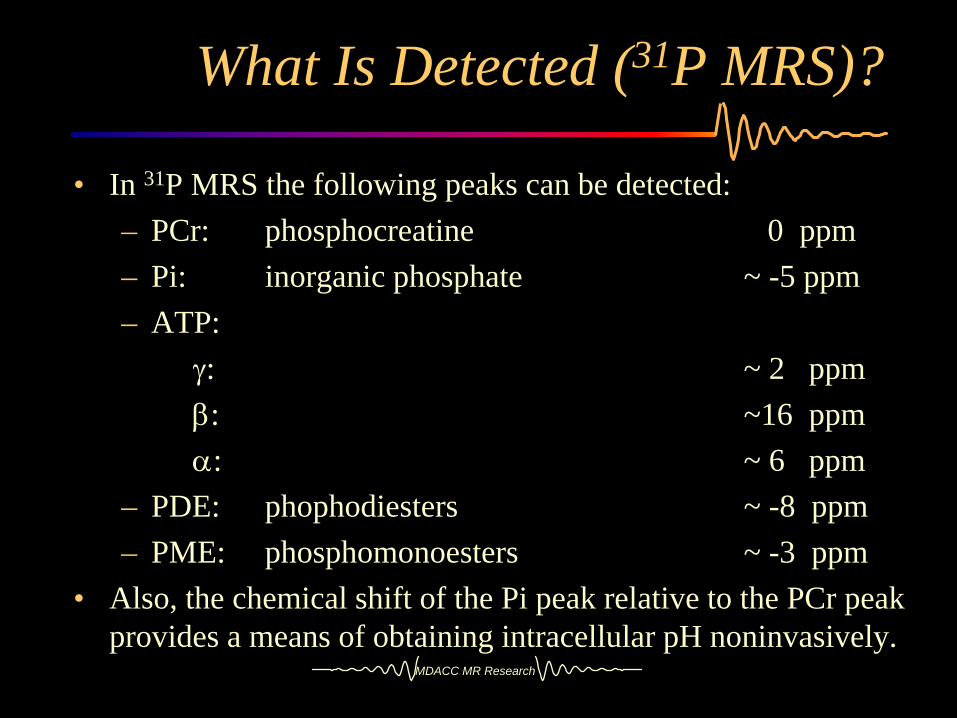
• In 31P MRS the following peaks can be detected:– PCr: phosphocreatine 0 ppm– Pi: inorganic phosphate ~ -5 ppm– ATP:
γ: ~ 2 ppmβ: ~16 ppmα: ~ 6 ppm
– PDE: phophodiesters ~ -8 ppm– PME: phosphomonoesters ~ -3 ppm
• Also, the chemical shift of the Pi peak relative to the PCr peak provides a means of obtaining intracellular pH noninvasively.
What Is Detected (31P MRS)?
MDACC MR Research
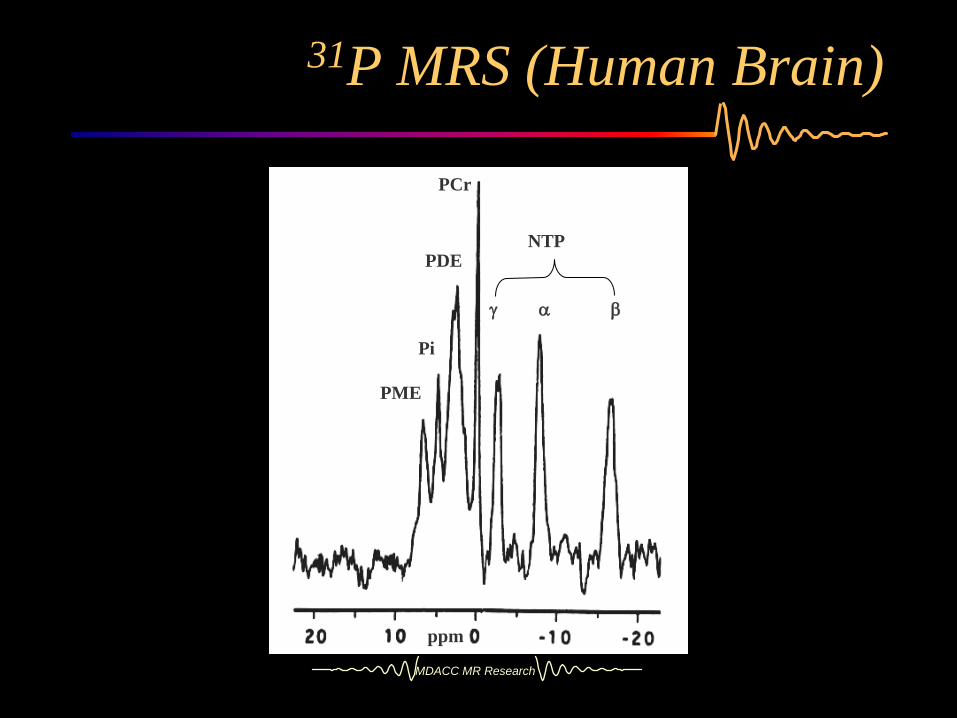
ppm
PCr
NTP
γ α β
Pi
PDE
PME
31P MRS (Human Brain)
MDACC MR Research
• While some information can be gleaned from visual examination of spectral peaks, quantitative assessment is necessary to really put MRS to its fullest use.
• It can be shown that the area under the spectral peak is proportional to the concentration of the corresponding compound.
• Measuring peak heights, while much simpler, is less accurate.
We’ve Got Peaks, Now What?
MDACC MR Research
Quantitative analysis comes in two forms:– Relative concentrations
• Most commonly involves taking the ratio of peak areas, e.g., NAA/Cr and Cho/Cr in brain.
• Problem: Changes in ratios can be due to changes in, for example, NAA or Cr.
– Absolute concentrations• Much more difficult and requires some form of “standard”.• External standard: small container of known concentration
of reference sample from which reference spectrum is obtained.
• Internal standard: most commonly taken as water.
Spectral Quantification
MDACC MR Research
• When reviewing MRS data in the literature, and particularly when comparing your data against others, or data acquired from multiple groups, be sure you take the TE and TR times into account.
• Each metabolite has its own T1 and T2 relaxation times. Therefore, as you change TE and/or TR, the relative peak areas and heights change.
• If you must compare data acquired at different TE and TR values, you can approximately normalize the data using the equations for T2-decay and T1-recovery appropriate for the particular localization sequence, and the reported in vivo T1and T2 relaxation times for the metabolites of interest.
Chemical Specific T1 and T2
MDACC MR Research
TE=30ms TE=66ms
TE=136ms
TE=272ms
Probe-PTR=1500ms64 averages
2:1620x15x15 mm3
Effect of Echo Time
The choice of echo time in proton MRS will influence each of the following except the:
10
Ref: Drost DJ, Riddle WR, Clarke GD. Proton magnetic resonance spectroscopy in the brain: Report of AAPM MR Task Group #9, Med Phys 29(9):2177-2197, 2002.
0%0%0%0%0% 1. ratio of the spectral peak amplitudes
2. inherent spectral resolution3. phase of the lactate peak4. degree of observed water suppression5. SNR of the resulting spectra
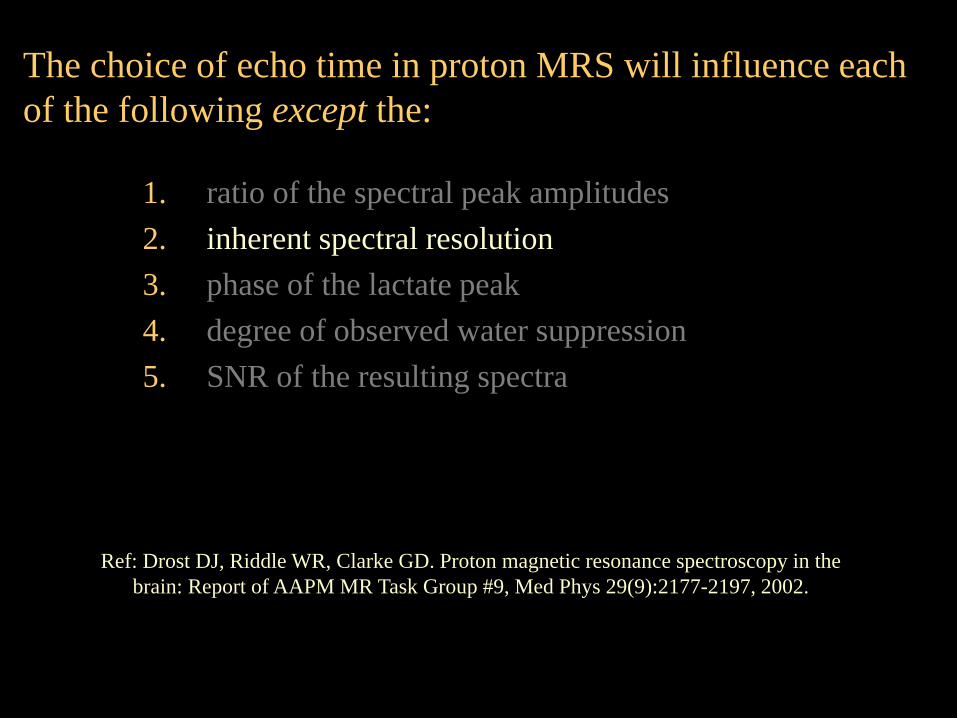
The choice of echo time in proton MRS will influence each of the following except the:
1. ratio of the spectral peak amplitudes2. inherent spectral resolution3. phase of the lactate peak4. degree of observed water suppression5. SNR of the resulting spectra
Ref: Drost DJ, Riddle WR, Clarke GD. Proton magnetic resonance spectroscopy in the brain: Report of AAPM MR Task Group #9, Med Phys 29(9):2177-2197, 2002.
MDACC MR Research
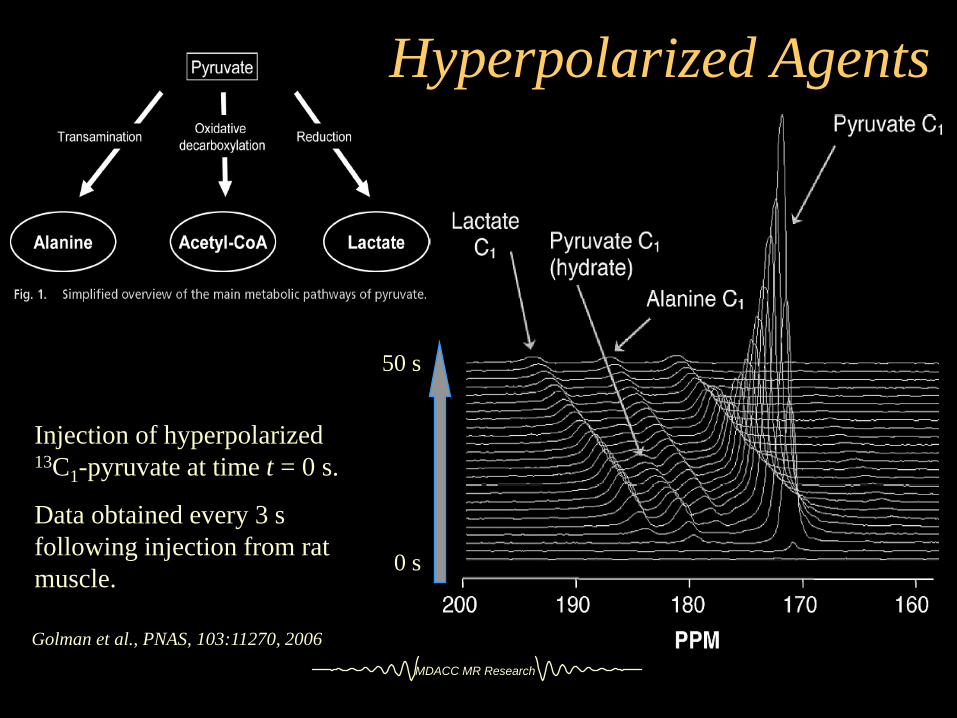
Hyperpolarized Agents
50 s
0 s
Injection of hyperpolarized 13C1-pyruvate at time t = 0 s.
Data obtained every 3 s following injection from rat muscle.
Golman et al., PNAS, 103:11270, 2006
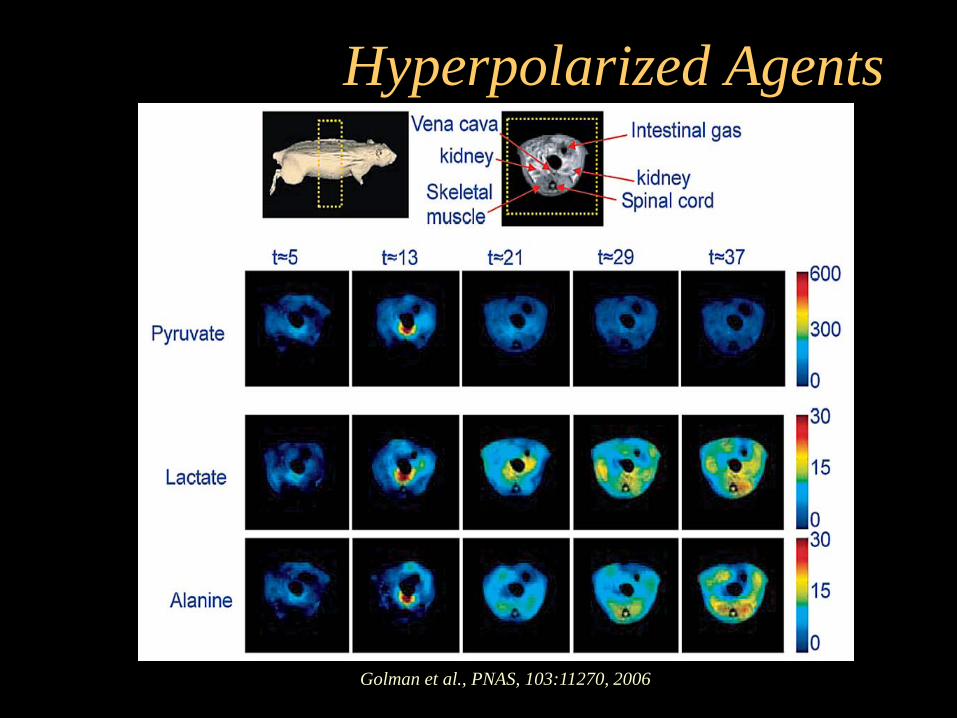
Golman et al., PNAS, 103:11270, 2006
Hyperpolarized Agents
MDACC MR Research
References
– Gilles and Morse, Annu Rev Biomed Eng. 7:287-326, 2005.– Drost, Riddle, and Clarke, Med Phys 29:2177-2197, 2002.– http://www2.chemistry.msu.edu/faculty/reusch/VirtTxtJml/
Spectrpy/nmr/nmr1.htm– Castillo, Neuroimaging Clinics N Am, 8(4), 1998. (Proton
MR Spectroscopy of the Brain)– Ross and Michaelis, Magn Reson Q, 10(4):191-247, 1994.
(Mainly 1H.)– Bottomley, Radiology, 170:1, 1989. (Almost exclusively
31P.)